Kila, MT Map & Demographics
Kila Map
Kila Overview
$30,315
PER CAPITA INCOME
$112,614
AVG FAMILY INCOME
0.33
INEQUALITY / GINI INDEX
440
TOTAL POPULATION
171
MALE POPULATION
269
FEMALE POPULATION
63.57
MALES / 100 FEMALES
157.31
FEMALES / 100 MALES
41.3
MEDIAN AGE
3.2
AVG FAMILY SIZE
2.8
AVG HOUSEHOLD SIZE
208
LABOR FORCE [ PEOPLE ]
62.5%
PERCENT IN LABOR FORCE
1.9%
UNEMPLOYMENT RATE
Kila Zip Codes
Kila Area Codes
Income in Kila
Income Overview in Kila
| Characteristic | Number | Measure |
| Per Capita Income | 440 | $30,315 |
| Median Family Income | 121 | $112,614 |
| Mean Family Income | 121 | $81,176 |
| Median Household Income | 159 | $0 |
| Mean Household Income | 159 | $80,730 |
| Income Deficit | 121 | $0 |
| Wage / Income Gap (%) | 440 | 0.00% |
| Wage / Income Gap ($) | 440 | 100.00¢ per $1 |
| Gini / Inequality Index | 440 | 0.33 |
Earnings by Sex in Kila
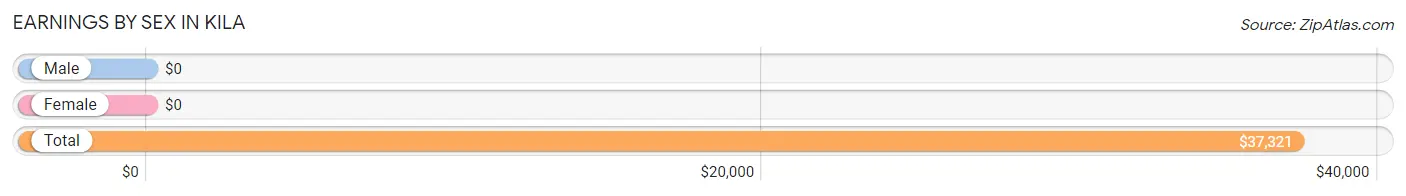
| Sex | Number | Average Earnings |
| Male | 75 (36.1%) | $0 |
| Female | 133 (63.9%) | $0 |
| Total | 208 (100.0%) | $37,321 |
Earnings by Sex by Income Bracket in Kila
The most common earnings brackets in Kila are $5,000 to $7,499 for men (33 | 44.0%) and $100,000+ for women (41 | 30.8%).
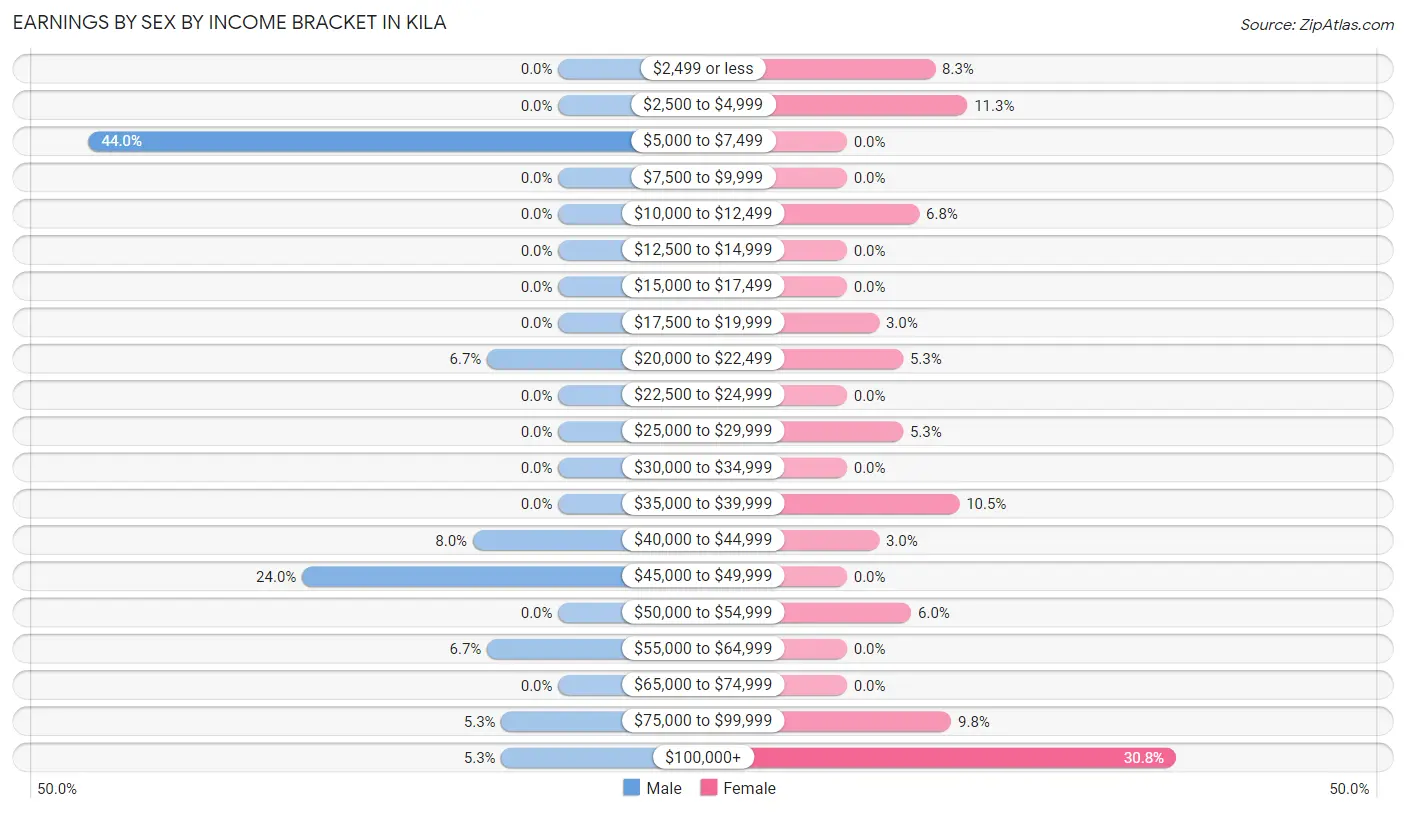
| Income | Male | Female |
| $2,499 or less | 0 (0.0%) | 11 (8.3%) |
| $2,500 to $4,999 | 0 (0.0%) | 15 (11.3%) |
| $5,000 to $7,499 | 33 (44.0%) | 0 (0.0%) |
| $7,500 to $9,999 | 0 (0.0%) | 0 (0.0%) |
| $10,000 to $12,499 | 0 (0.0%) | 9 (6.8%) |
| $12,500 to $14,999 | 0 (0.0%) | 0 (0.0%) |
| $15,000 to $17,499 | 0 (0.0%) | 0 (0.0%) |
| $17,500 to $19,999 | 0 (0.0%) | 4 (3.0%) |
| $20,000 to $22,499 | 5 (6.7%) | 7 (5.3%) |
| $22,500 to $24,999 | 0 (0.0%) | 0 (0.0%) |
| $25,000 to $29,999 | 0 (0.0%) | 7 (5.3%) |
| $30,000 to $34,999 | 0 (0.0%) | 0 (0.0%) |
| $35,000 to $39,999 | 0 (0.0%) | 14 (10.5%) |
| $40,000 to $44,999 | 6 (8.0%) | 4 (3.0%) |
| $45,000 to $49,999 | 18 (24.0%) | 0 (0.0%) |
| $50,000 to $54,999 | 0 (0.0%) | 8 (6.0%) |
| $55,000 to $64,999 | 5 (6.7%) | 0 (0.0%) |
| $65,000 to $74,999 | 0 (0.0%) | 0 (0.0%) |
| $75,000 to $99,999 | 4 (5.3%) | 13 (9.8%) |
| $100,000+ | 4 (5.3%) | 41 (30.8%) |
| Total | 75 (100.0%) | 133 (100.0%) |
Earnings by Sex by Educational Attainment in Kila
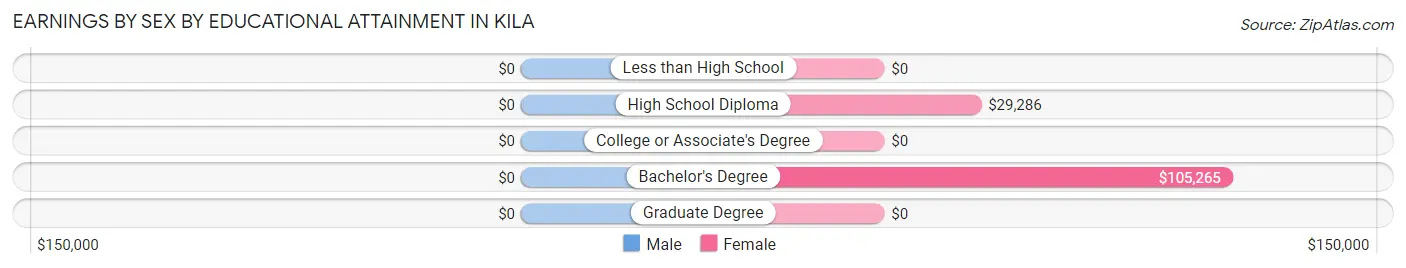
| Educational Attainment | Male Income | Female Income |
| Less than High School | - | - |
| High School Diploma | - | - |
| College or Associate's Degree | - | - |
| Bachelor's Degree | - | - |
| Graduate Degree | - | - |
| Total | $55,500 | $0 |
Family Income in Kila
Family Income Brackets in Kila
According to the Kila family income data, there are 59 families falling into the $100,000 to $149,999 income range, which is the most common income bracket and makes up 48.8% of all families.
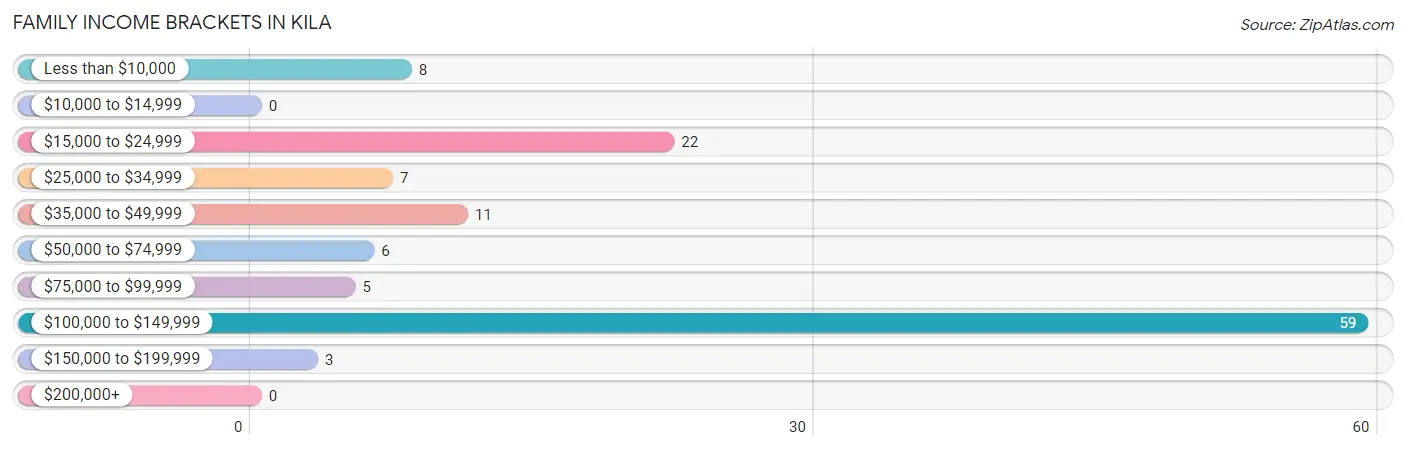
| Income Bracket | # Families | % Families |
| Less than $10,000 | 8 | 6.6% |
| $10,000 to $14,999 | 0 | 0.0% |
| $15,000 to $24,999 | 22 | 18.2% |
| $25,000 to $34,999 | 7 | 5.8% |
| $35,000 to $49,999 | 11 | 9.1% |
| $50,000 to $74,999 | 6 | 5.0% |
| $75,000 to $99,999 | 5 | 4.1% |
| $100,000 to $149,999 | 59 | 48.8% |
| $150,000 to $199,999 | 3 | 2.5% |
| $200,000+ | 0 | 0.0% |
Family Income by Famaliy Size in Kila
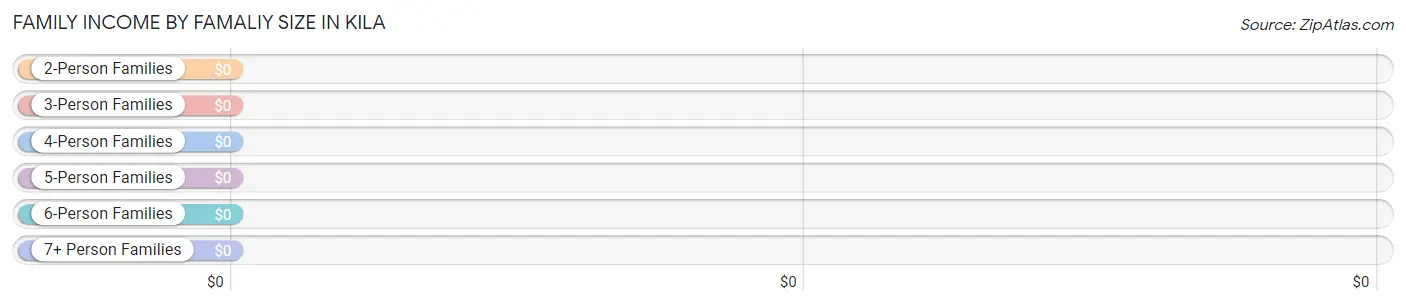
| Income Bracket | # Families | Median Income |
| 2-Person Families | 66 (54.5%) | $0 |
| 3-Person Families | 37 (30.6%) | $0 |
| 4-Person Families | 7 (5.8%) | $0 |
| 5-Person Families | 0 (0.0%) | $0 |
| 6-Person Families | 0 (0.0%) | $0 |
| 7+ Person Families | 11 (9.1%) | $0 |
| Total | 121 (100.0%) | $112,614 |
Family Income by Number of Earners in Kila
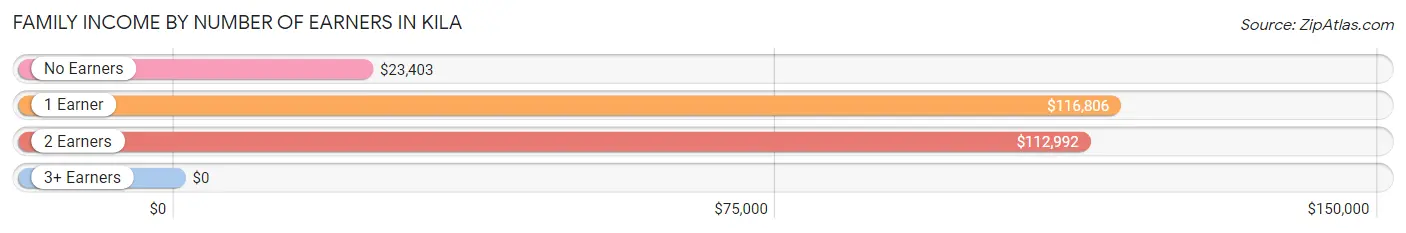
| Number of Earners | # Families | Median Income |
| No Earners | 29 (24.0%) | $23,403 |
| 1 Earner | 31 (25.6%) | $116,806 |
| 2 Earners | 61 (50.4%) | $112,992 |
| 3+ Earners | 0 (0.0%) | $0 |
| Total | 121 (100.0%) | $112,614 |
Household Income in Kila
Household Income Brackets in Kila
With 76 households falling in the category, the $100,000 to $149,999 income range is the most frequent in Kila, accounting for 47.8% of all households.
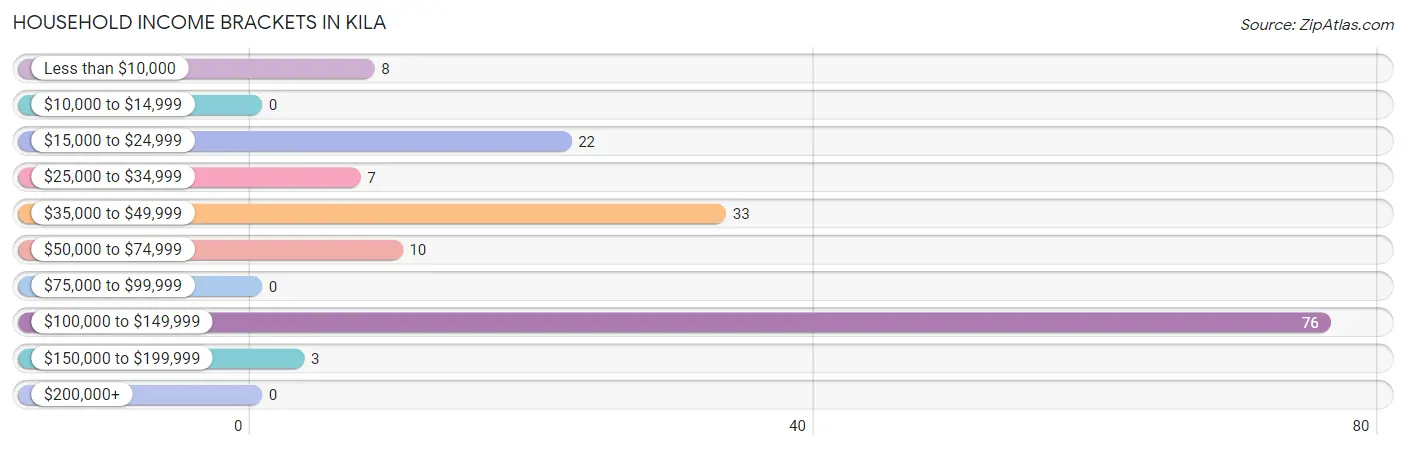
| Income Bracket | # Households | % Households |
| Less than $10,000 | 8 | 5.0% |
| $10,000 to $14,999 | 0 | 0.0% |
| $15,000 to $24,999 | 22 | 13.8% |
| $25,000 to $34,999 | 7 | 4.4% |
| $35,000 to $49,999 | 33 | 20.8% |
| $50,000 to $74,999 | 10 | 6.3% |
| $75,000 to $99,999 | 0 | 0.0% |
| $100,000 to $149,999 | 76 | 47.8% |
| $150,000 to $199,999 | 3 | 1.9% |
| $200,000+ | 0 | 0.0% |
Household Income by Householder Age in Kila
The median household income in Kila is $0, with the highest median household income of $126,750 found in the 45 to 64 years age bracket for the primary householder. A total of 19 households (11.9%) fall into this category. Meanwhile, the 15 to 24 years age bracket for the primary householder has the lowest median household income of $0, with 18 households (11.3%) in this group.
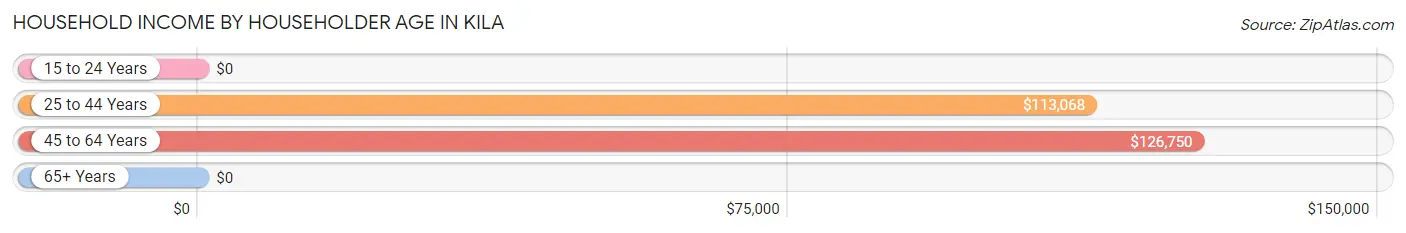
| Income Bracket | # Households | Median Income |
| 15 to 24 Years | 18 (11.3%) | $0 |
| 25 to 44 Years | 67 (42.1%) | $113,068 |
| 45 to 64 Years | 19 (11.9%) | $126,750 |
| 65+ Years | 55 (34.6%) | $0 |
| Total | 159 (100.0%) | $0 |
Poverty in Kila
Income Below Poverty by Sex and Age in Kila
With 11.1% poverty level for males and 27.9% for females among the residents of Kila, 35 to 44 year old males and under 5 year old females are the most vulnerable to poverty, with 11 males (45.8%) and 10 females (100.0%) in their respective age groups living below the poverty level.
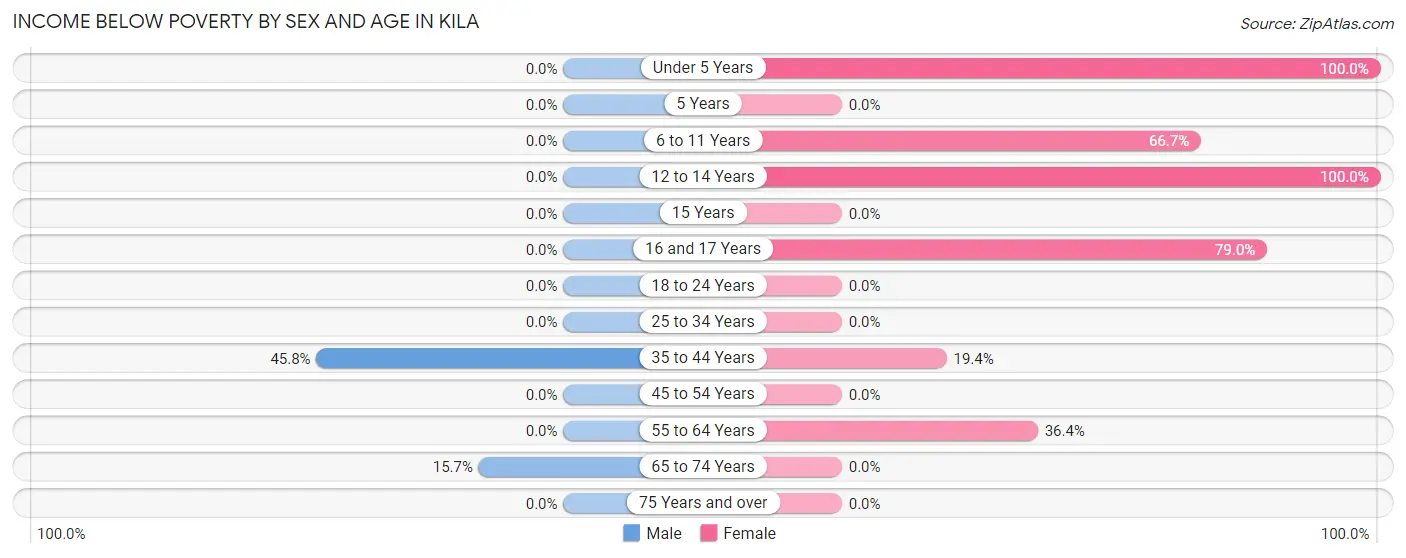
| Age Bracket | Male | Female |
| Under 5 Years | 0 (0.0%) | 10 (100.0%) |
| 5 Years | 0 (0.0%) | 0 (0.0%) |
| 6 to 11 Years | 0 (0.0%) | 16 (66.7%) |
| 12 to 14 Years | 0 (0.0%) | 12 (100.0%) |
| 15 Years | 0 (0.0%) | 0 (0.0%) |
| 16 and 17 Years | 0 (0.0%) | 15 (78.9%) |
| 18 to 24 Years | 0 (0.0%) | 0 (0.0%) |
| 25 to 34 Years | 0 (0.0%) | 0 (0.0%) |
| 35 to 44 Years | 11 (45.8%) | 14 (19.4%) |
| 45 to 54 Years | 0 (0.0%) | 0 (0.0%) |
| 55 to 64 Years | 0 (0.0%) | 8 (36.4%) |
| 65 to 74 Years | 8 (15.7%) | 0 (0.0%) |
| 75 Years and over | 0 (0.0%) | 0 (0.0%) |
| Total | 19 (11.1%) | 75 (27.9%) |
Income Above Poverty by Sex and Age in Kila
According to the poverty statistics in Kila, males aged under 5 years and females aged 15 years are the age groups that are most secure financially, with 100.0% of males and 100.0% of females in these age groups living above the poverty line.
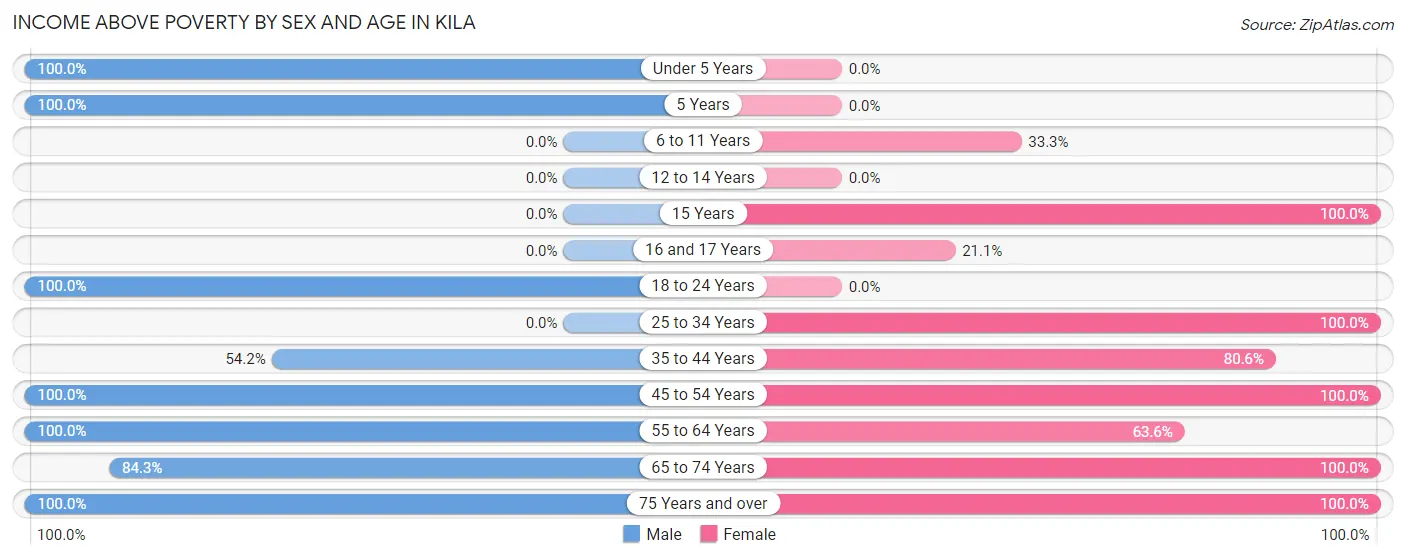
| Age Bracket | Male | Female |
| Under 5 Years | 4 (100.0%) | 0 (0.0%) |
| 5 Years | 8 (100.0%) | 0 (0.0%) |
| 6 to 11 Years | 0 (0.0%) | 8 (33.3%) |
| 12 to 14 Years | 0 (0.0%) | 0 (0.0%) |
| 15 Years | 0 (0.0%) | 49 (100.0%) |
| 16 and 17 Years | 0 (0.0%) | 4 (21.0%) |
| 18 to 24 Years | 51 (100.0%) | 0 (0.0%) |
| 25 to 34 Years | 0 (0.0%) | 4 (100.0%) |
| 35 to 44 Years | 13 (54.2%) | 58 (80.6%) |
| 45 to 54 Years | 9 (100.0%) | 21 (100.0%) |
| 55 to 64 Years | 13 (100.0%) | 14 (63.6%) |
| 65 to 74 Years | 43 (84.3%) | 27 (100.0%) |
| 75 Years and over | 11 (100.0%) | 9 (100.0%) |
| Total | 152 (88.9%) | 194 (72.1%) |
Income Below Poverty Among Married-Couple Families in Kila
The poverty statistics for married-couple families in Kila show that 30.6% or 19 of the total 62 families live below the poverty line. Families with 5 or more children have the highest poverty rate of 100.0%, comprising of 11 families. On the other hand, families with 1 or 2 children have the lowest poverty rate of 0.0%, which includes 0 families.
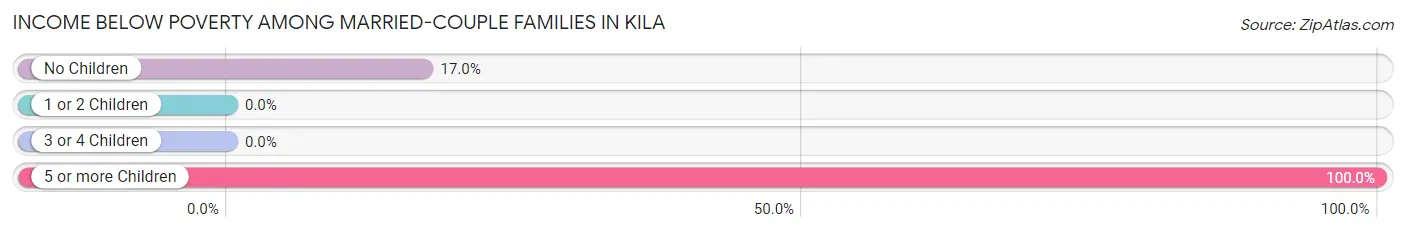
| Children | Above Poverty | Below Poverty |
| No Children | 39 (83.0%) | 8 (17.0%) |
| 1 or 2 Children | 4 (100.0%) | 0 (0.0%) |
| 3 or 4 Children | 0 (0.0%) | 0 (0.0%) |
| 5 or more Children | 0 (0.0%) | 11 (100.0%) |
| Total | 43 (69.4%) | 19 (30.6%) |
Income Below Poverty Among Single-Parent Households in Kila
| Children | Single Father | Single Mother |
| No Children | 0 (0.0%) | 0 (0.0%) |
| 1 or 2 Children | 0 (0.0%) | 0 (0.0%) |
| 3 or 4 Children | 0 (0.0%) | 0 (0.0%) |
| 5 or more Children | 0 (0.0%) | 0 (0.0%) |
| Total | 0 (0.0%) | 0 (0.0%) |
Income Below Poverty Among Married-Couple vs Single-Parent Households in Kila
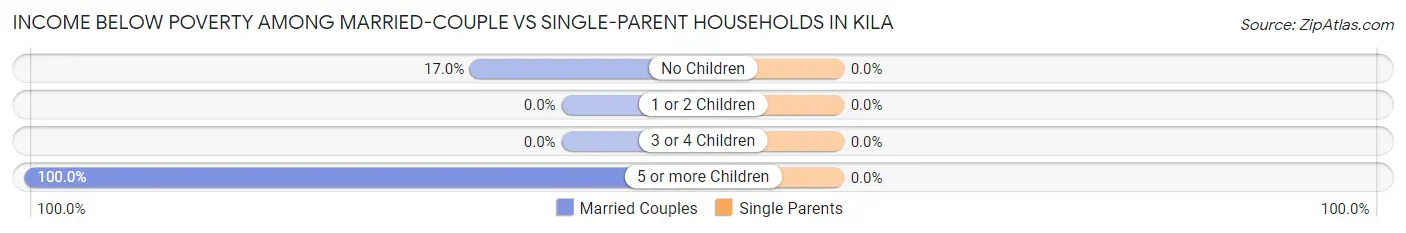
| Children | Married-Couple Families | Single-Parent Households |
| No Children | 8 (17.0%) | 0 (0.0%) |
| 1 or 2 Children | 0 (0.0%) | 0 (0.0%) |
| 3 or 4 Children | 0 (0.0%) | 0 (0.0%) |
| 5 or more Children | 11 (100.0%) | 0 (0.0%) |
| Total | 19 (30.6%) | 0 (0.0%) |
Race in Kila
The most populous races in Kila are White / Caucasian (314 | 71.4%), Black / African American (82 | 18.6%), and Native / Alaskan (33 | 7.5%).
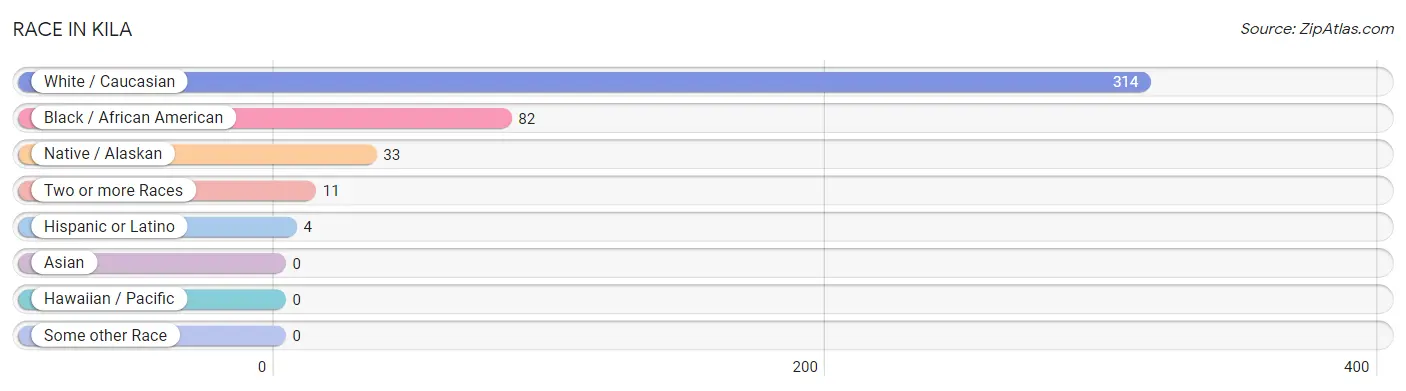
| Race | # Population | % Population |
| Asian | 0 | 0.0% |
| Black / African American | 82 | 18.6% |
| Hawaiian / Pacific | 0 | 0.0% |
| Hispanic or Latino | 4 | 0.9% |
| Native / Alaskan | 33 | 7.5% |
| White / Caucasian | 314 | 71.4% |
| Two or more Races | 11 | 2.5% |
| Some other Race | 0 | 0.0% |
| Total | 440 | 100.0% |
Ancestry in Kila
The most populous ancestries reported in Kila are English (73 | 16.6%), Irish (53 | 12.0%), Norwegian (49 | 11.1%), German (45 | 10.2%), and Chippewa (33 | 7.5%), together accounting for 57.5% of all Kila residents.
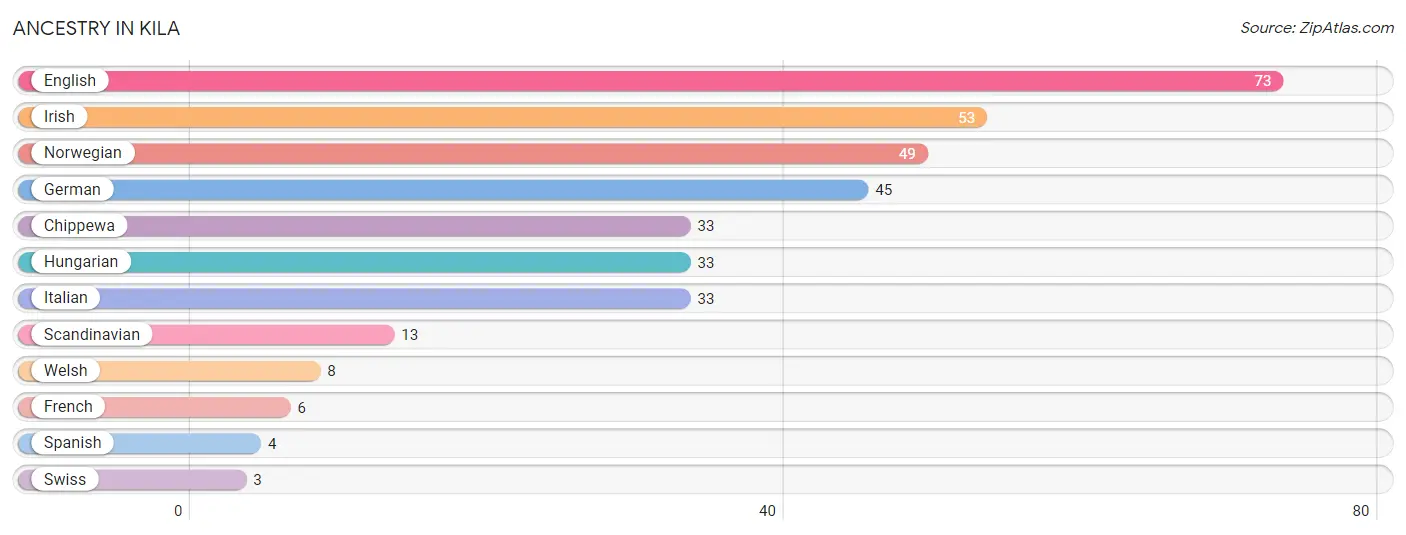
| Ancestry | # Population | % Population |
| Chippewa | 33 | 7.5% |
| English | 73 | 16.6% |
| French | 6 | 1.4% |
| German | 45 | 10.2% |
| Hungarian | 33 | 7.5% |
| Irish | 53 | 12.0% |
| Italian | 33 | 7.5% |
| Norwegian | 49 | 11.1% |
| Scandinavian | 13 | 2.9% |
| Spanish | 4 | 0.9% |
| Swiss | 3 | 0.7% |
| Welsh | 8 | 1.8% | View All 12 Rows |
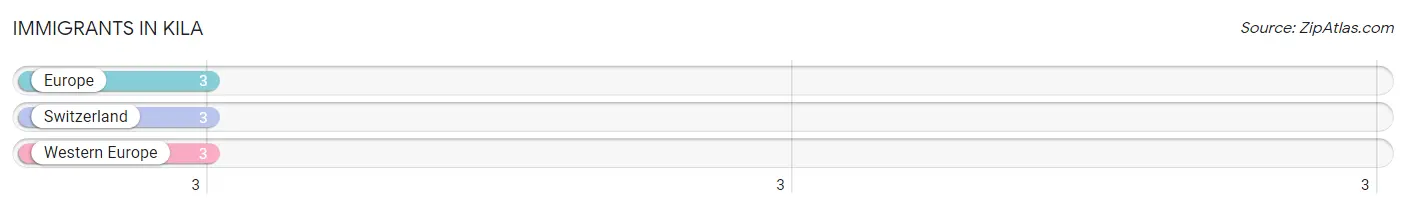
Immigrants in Kila
The most numerous immigrant groups reported in Kila came from Europe (3 | 0.7%), Switzerland (3 | 0.7%), and Western Europe (3 | 0.7%), together accounting for 2.0% of all Kila residents.
| Immigration Origin | # Population | % Population |
| Europe | 3 | 0.7% |
| Switzerland | 3 | 0.7% |
| Western Europe | 3 | 0.7% | View All 3 Rows |
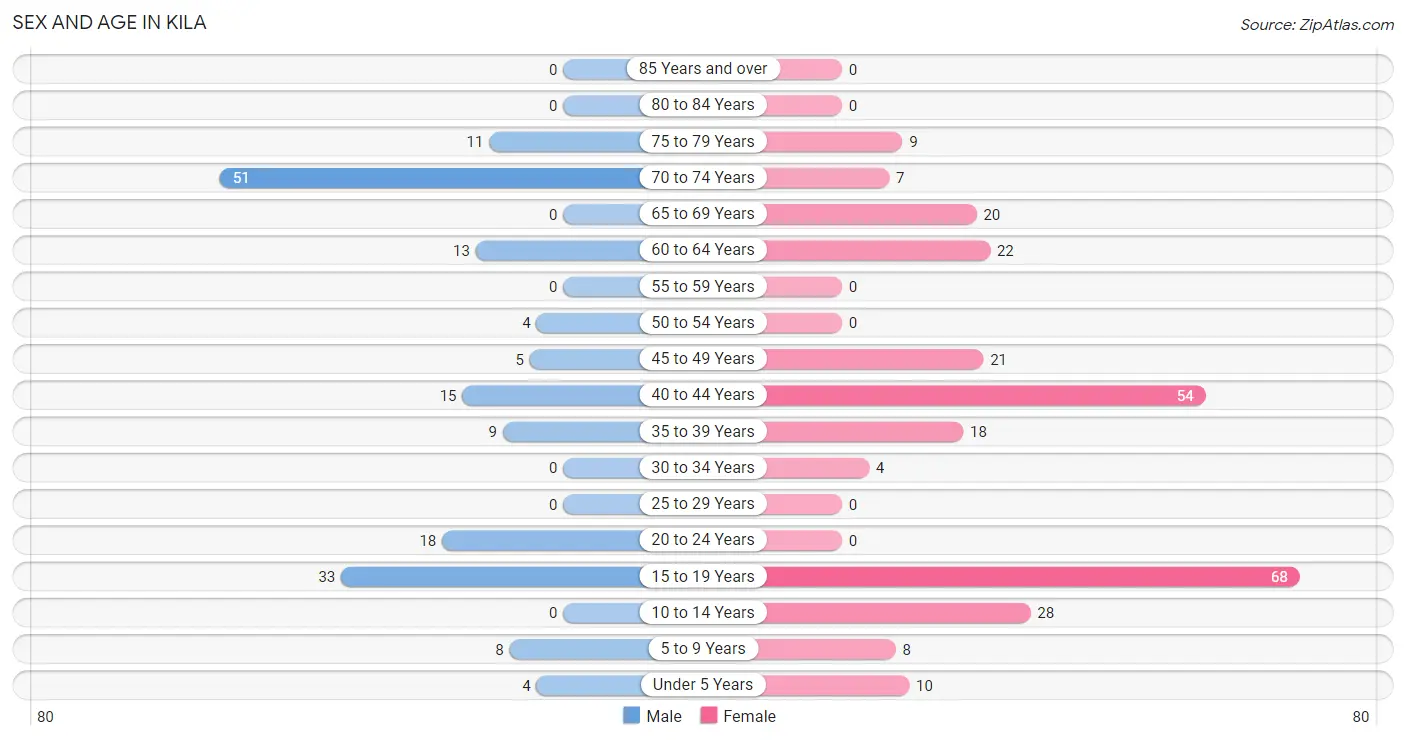
Sex and Age in Kila
Sex and Age in Kila
The most populous age groups in Kila are 70 to 74 Years (51 | 29.8%) for men and 15 to 19 Years (68 | 25.3%) for women.
| Age Bracket | Male | Female |
| Under 5 Years | 4 (2.3%) | 10 (3.7%) |
| 5 to 9 Years | 8 (4.7%) | 8 (3.0%) |
| 10 to 14 Years | 0 (0.0%) | 28 (10.4%) |
| 15 to 19 Years | 33 (19.3%) | 68 (25.3%) |
| 20 to 24 Years | 18 (10.5%) | 0 (0.0%) |
| 25 to 29 Years | 0 (0.0%) | 0 (0.0%) |
| 30 to 34 Years | 0 (0.0%) | 4 (1.5%) |
| 35 to 39 Years | 9 (5.3%) | 18 (6.7%) |
| 40 to 44 Years | 15 (8.8%) | 54 (20.1%) |
| 45 to 49 Years | 5 (2.9%) | 21 (7.8%) |
| 50 to 54 Years | 4 (2.3%) | 0 (0.0%) |
| 55 to 59 Years | 0 (0.0%) | 0 (0.0%) |
| 60 to 64 Years | 13 (7.6%) | 22 (8.2%) |
| 65 to 69 Years | 0 (0.0%) | 20 (7.4%) |
| 70 to 74 Years | 51 (29.8%) | 7 (2.6%) |
| 75 to 79 Years | 11 (6.4%) | 9 (3.4%) |
| 80 to 84 Years | 0 (0.0%) | 0 (0.0%) |
| 85 Years and over | 0 (0.0%) | 0 (0.0%) |
| Total | 171 (100.0%) | 269 (100.0%) |
Families and Households in Kila
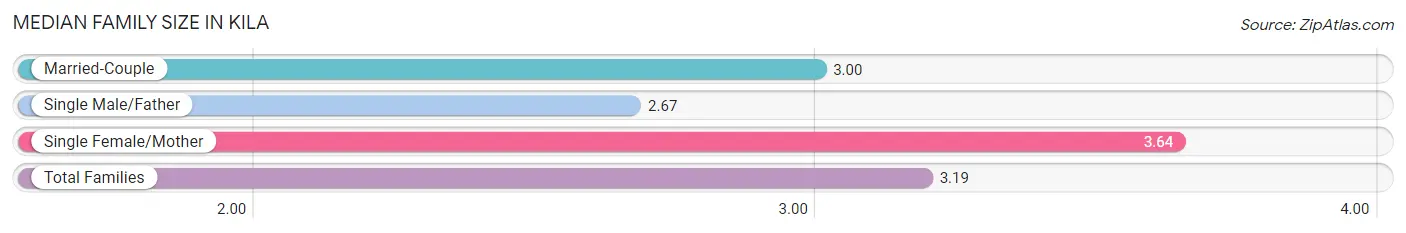
Median Family Size in Kila
The median family size in Kila is 3.19 persons per family, with single female/mother families (44 | 36.4%) accounting for the largest median family size of 3.64 persons per family. On the other hand, single male/father families (15 | 12.4%) represent the smallest median family size with 2.67 persons per family.
| Family Type | # Families | Family Size |
| Married-Couple | 62 (51.2%) | 3.00 |
| Single Male/Father | 15 (12.4%) | 2.67 |
| Single Female/Mother | 44 (36.4%) | 3.64 |
| Total Families | 121 (100.0%) | 3.19 |
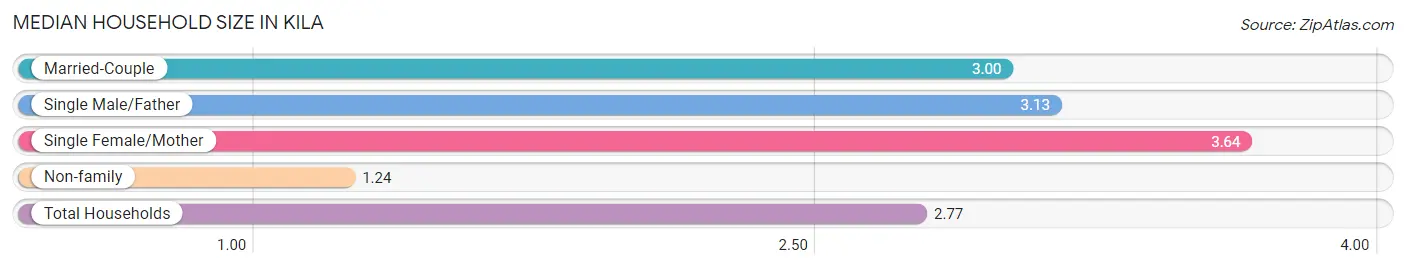
Median Household Size in Kila
The median household size in Kila is 2.77 persons per household, with single female/mother households (44 | 27.7%) accounting for the largest median household size of 3.64 persons per household. non-family households (38 | 23.9%) represent the smallest median household size with 1.24 persons per household.
| Household Type | # Households | Household Size |
| Married-Couple | 62 (39.0%) | 3.00 |
| Single Male/Father | 15 (9.4%) | 3.13 |
| Single Female/Mother | 44 (27.7%) | 3.64 |
| Non-family | 38 (23.9%) | 1.24 |
| Total Households | 159 (100.0%) | 2.77 |
Household Size by Marriage Status in Kila
Out of a total of 159 households in Kila, 121 (76.1%) are family households, while 38 (23.9%) are nonfamily households. The most numerous type of family households are 2-person households, comprising 61, and the most common type of nonfamily households are 1-person households, comprising 30.
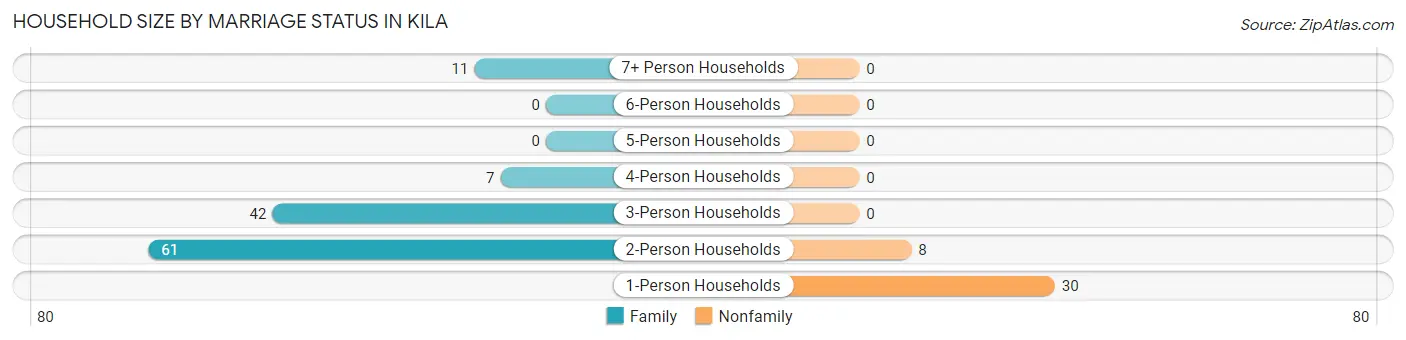
| Household Size | Family Households | Nonfamily Households |
| 1-Person Households | - | 30 (18.9%) |
| 2-Person Households | 61 (38.4%) | 8 (5.0%) |
| 3-Person Households | 42 (26.4%) | 0 (0.0%) |
| 4-Person Households | 7 (4.4%) | 0 (0.0%) |
| 5-Person Households | 0 (0.0%) | 0 (0.0%) |
| 6-Person Households | 0 (0.0%) | 0 (0.0%) |
| 7+ Person Households | 11 (6.9%) | 0 (0.0%) |
| Total | 121 (76.1%) | 38 (23.9%) |
Female Fertility in Kila
Fertility by Age in Kila
| Age Bracket | Women with Births | Births / 1,000 Women |
| 15 to 19 years | 0 (0.0%) | 0.0 |
| 20 to 34 years | 0 (0.0%) | 0.0 |
| 35 to 50 years | 0 (0.0%) | 0.0 |
| Total | 0 (0.0%) | 0.0 |
Fertility by Age by Marriage Status in Kila
| Age Bracket | Married | Unmarried |
| 15 to 19 years | 0 (0.0%) | 0 (0.0%) |
| 20 to 34 years | 0 (0.0%) | 0 (0.0%) |
| 35 to 50 years | 0 (0.0%) | 0 (0.0%) |
| Total | 0 (0.0%) | 0 (0.0%) |
Fertility by Education in Kila
| Educational Attainment | Women with Births | Births / 1,000 Women |
| Less than High School | 0 (0.0%) | 0.0 |
| High School Diploma | 0 (0.0%) | 0.0 |
| College or Associate's Degree | 0 (0.0%) | 0.0 |
| Bachelor's Degree | 0 (0.0%) | 0.0 |
| Graduate Degree | 0 (0.0%) | 0.0 |
| Total | 0 (0.0%) | 0.0 |
Fertility by Education by Marriage Status in Kila
| Educational Attainment | Married | Unmarried |
| Less than High School | 0 (0.0%) | 0 (0.0%) |
| High School Diploma | 0 (0.0%) | 0 (0.0%) |
| College or Associate's Degree | 0 (0.0%) | 0 (0.0%) |
| Bachelor's Degree | 0 (0.0%) | 0 (0.0%) |
| Graduate Degree | 0 (0.0%) | 0 (0.0%) |
| Total | 0 (0.0%) | 0 (0.0%) |
Employment Characteristics in Kila
Employment by Class of Employer in Kila
Among the 200 employed individuals in Kila, private company employees (163 | 81.5%), self-employed (not incorporated) (20 | 10.0%), and local government employees (13 | 6.5%) make up the most common classes of employment.
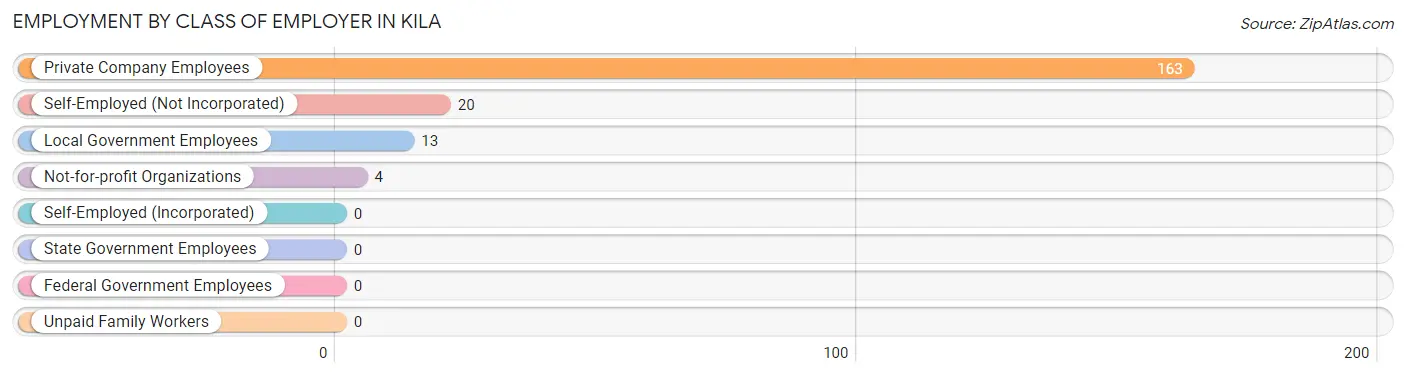
| Employer Class | # Employees | % Employees |
| Private Company Employees | 163 | 81.5% |
| Self-Employed (Incorporated) | 0 | 0.0% |
| Self-Employed (Not Incorporated) | 20 | 10.0% |
| Not-for-profit Organizations | 4 | 2.0% |
| Local Government Employees | 13 | 6.5% |
| State Government Employees | 0 | 0.0% |
| Federal Government Employees | 0 | 0.0% |
| Unpaid Family Workers | 0 | 0.0% |
| Total | 200 | 100.0% |
Employment Status by Age in Kila
According to the labor force statistics for Kila, out of the total population over 16 years of age (333), 62.5% or 208 individuals are in the labor force, with 1.9% or 4 of them unemployed. The age group with the highest labor force participation rate is 16 to 19 years, with 100.0% or 52 individuals in the labor force. Within the labor force, the 35 to 44 years age range has the highest percentage of unemployed individuals, with 4.7% or 4 of them being unemployed.
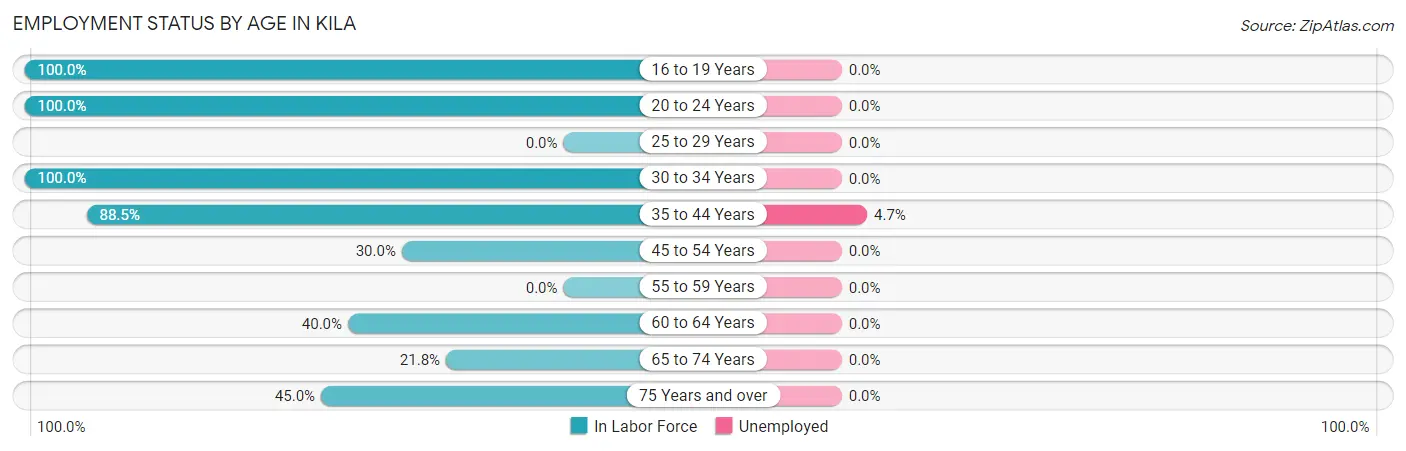
| Age Bracket | In Labor Force | Unemployed |
| 16 to 19 Years | 52 (100.0%) | 0 (0.0%) |
| 20 to 24 Years | 18 (100.0%) | 0 (0.0%) |
| 25 to 29 Years | 0 (0.0%) | 0 (0.0%) |
| 30 to 34 Years | 4 (100.0%) | 0 (0.0%) |
| 35 to 44 Years | 85 (88.5%) | 4 (4.7%) |
| 45 to 54 Years | 9 (30.0%) | 0 (0.0%) |
| 55 to 59 Years | 0 (0.0%) | 0 (0.0%) |
| 60 to 64 Years | 14 (40.0%) | 0 (0.0%) |
| 65 to 74 Years | 17 (21.8%) | 0 (0.0%) |
| 75 Years and over | 9 (45.0%) | 0 (0.0%) |
| Total | 208 (62.5%) | 4 (1.9%) |
Employment Status by Educational Attainment in Kila
According to labor force statistics for Kila, 67.9% of individuals (112) out of the total population between 25 and 64 years of age (165) are in the labor force, with 3.6% or 4 of them being unemployed. The group with the highest labor force participation rate are those with the educational attainment of college / associate degree, with 100.0% or 20 individuals in the labor force. Within the labor force, individuals with college / associate degree education have the highest percentage of unemployment, with 20.0% or 4 of them being unemployed.
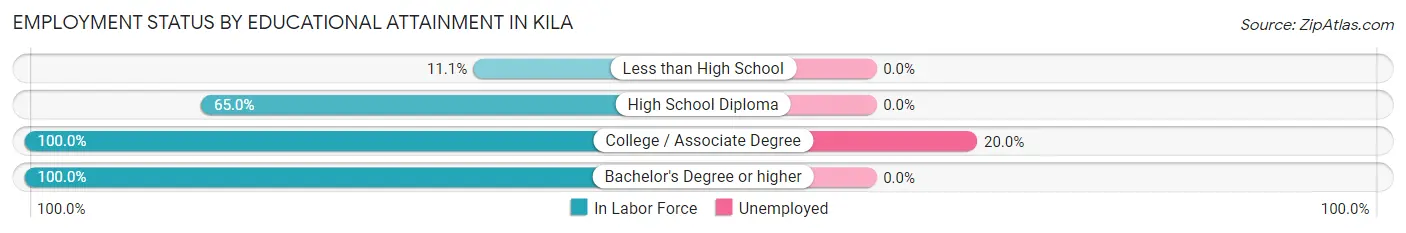
| Educational Attainment | In Labor Force | Unemployed |
| Less than High School | 4 (11.1%) | 0 (0.0%) |
| High School Diploma | 39 (65.0%) | 0 (0.0%) |
| College / Associate Degree | 20 (100.0%) | 4 (20.0%) |
| Bachelor's Degree or higher | 49 (100.0%) | 0 (0.0%) |
| Total | 112 (67.9%) | 6 (3.6%) |
Employment Occupations by Sex in Kila
Management, Business, Science and Arts Occupations
The most common Management, Business, Science and Arts occupations in Kila are Management (73 | 35.8%), Business & Financial (4 | 2.0%), Community & Social Service (4 | 2.0%), and Legal Services & Support (4 | 2.0%).
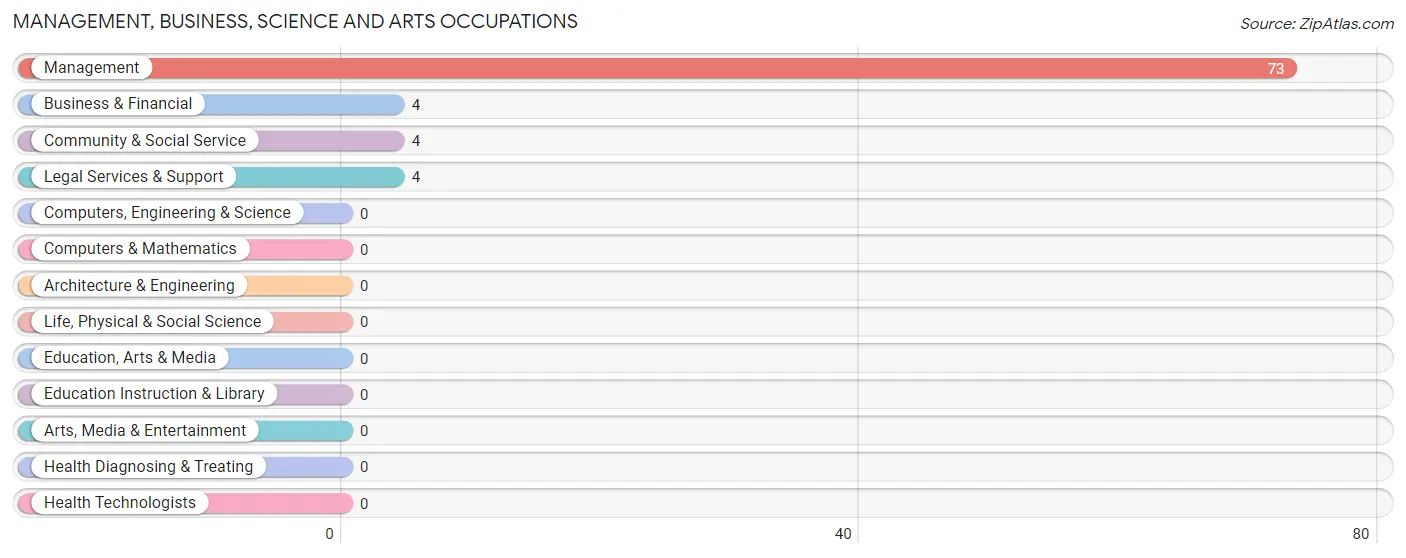
Management, Business, Science and Arts Occupations by Sex
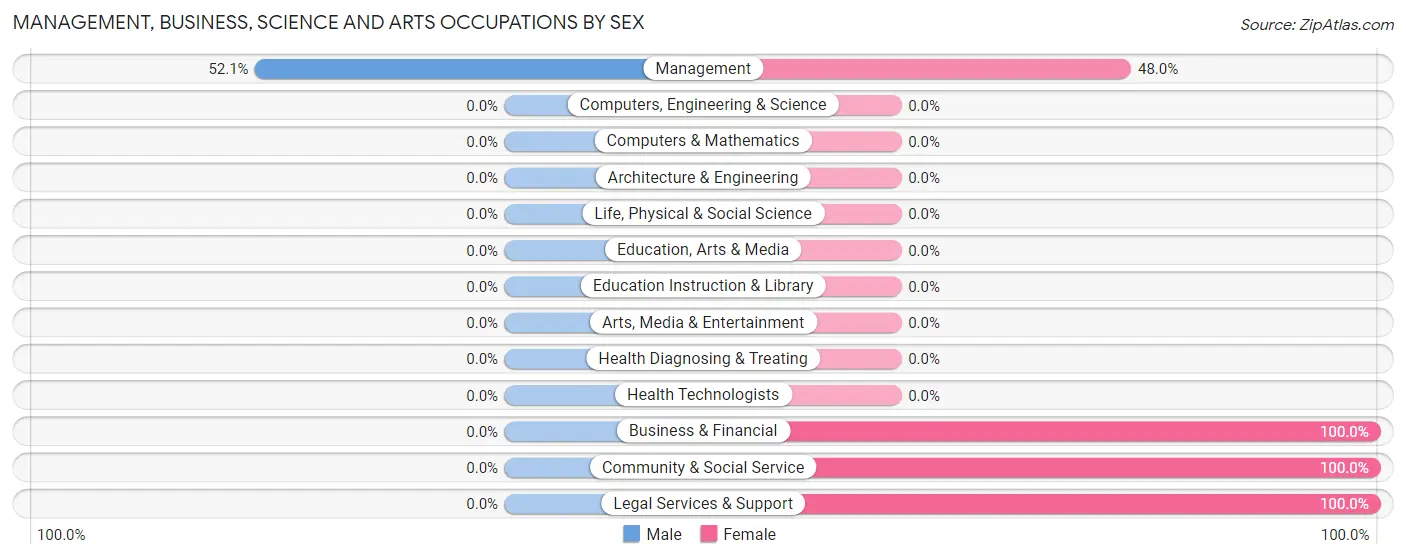
| Occupation | Male | Female |
| Management | 38 (52.0%) | 35 (47.9%) |
| Business & Financial | 0 (0.0%) | 4 (100.0%) |
| Computers, Engineering & Science | 0 (0.0%) | 0 (0.0%) |
| Computers & Mathematics | 0 (0.0%) | 0 (0.0%) |
| Architecture & Engineering | 0 (0.0%) | 0 (0.0%) |
| Life, Physical & Social Science | 0 (0.0%) | 0 (0.0%) |
| Community & Social Service | 0 (0.0%) | 4 (100.0%) |
| Education, Arts & Media | 0 (0.0%) | 0 (0.0%) |
| Legal Services & Support | 0 (0.0%) | 4 (100.0%) |
| Education Instruction & Library | 0 (0.0%) | 0 (0.0%) |
| Arts, Media & Entertainment | 0 (0.0%) | 0 (0.0%) |
| Health Diagnosing & Treating | 0 (0.0%) | 0 (0.0%) |
| Health Technologists | 0 (0.0%) | 0 (0.0%) |
| Total (Category) | 38 (46.9%) | 43 (53.1%) |
| Total (Overall) | 75 (36.8%) | 129 (63.2%) |
Services Occupations
The most common Services occupations in Kila are Food Preparation & Serving (8 | 3.9%), and Cleaning & Maintenance (7 | 3.4%).
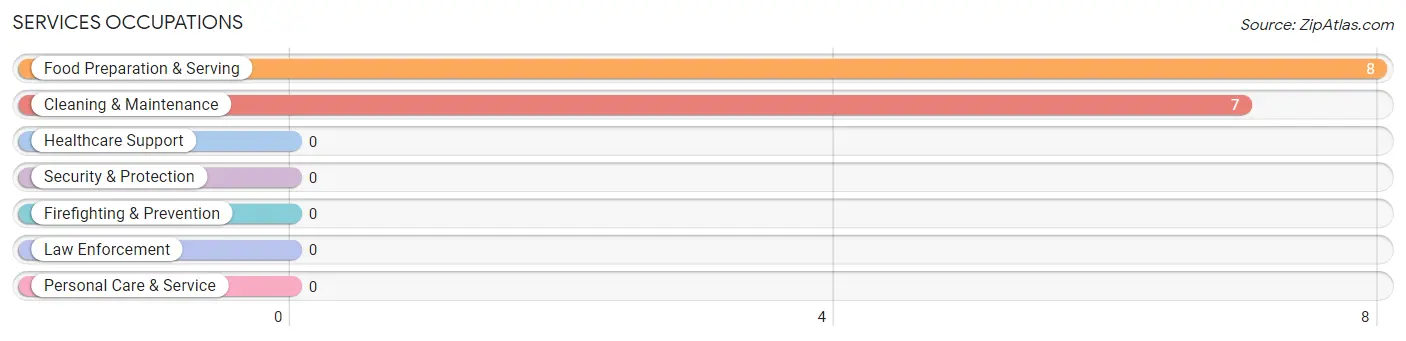
Services Occupations by Sex
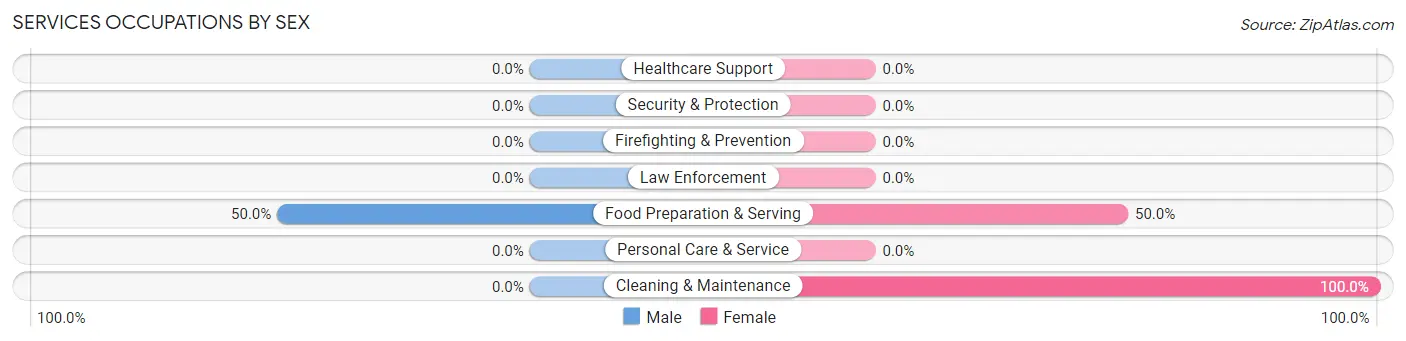
| Occupation | Male | Female |
| Healthcare Support | 0 (0.0%) | 0 (0.0%) |
| Security & Protection | 0 (0.0%) | 0 (0.0%) |
| Firefighting & Prevention | 0 (0.0%) | 0 (0.0%) |
| Law Enforcement | 0 (0.0%) | 0 (0.0%) |
| Food Preparation & Serving | 4 (50.0%) | 4 (50.0%) |
| Cleaning & Maintenance | 0 (0.0%) | 7 (100.0%) |
| Personal Care & Service | 0 (0.0%) | 0 (0.0%) |
| Total (Category) | 4 (26.7%) | 11 (73.3%) |
| Total (Overall) | 75 (36.8%) | 129 (63.2%) |
Sales and Office Occupations
The most common Sales and Office occupations in Kila are Sales & Related (42 | 20.6%), and Office & Administration (18 | 8.8%).
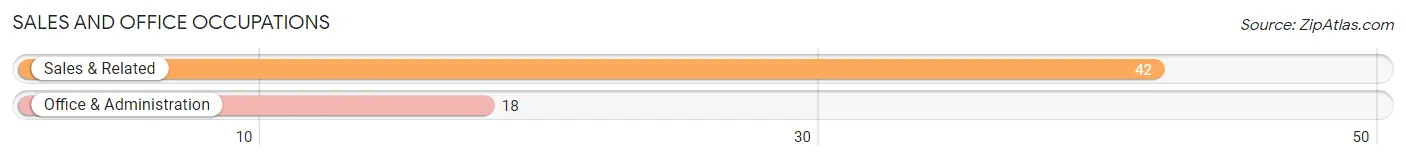
Sales and Office Occupations by Sex
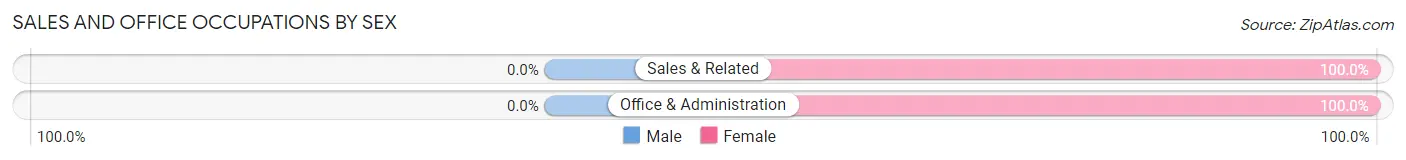
| Occupation | Male | Female |
| Sales & Related | 0 (0.0%) | 42 (100.0%) |
| Office & Administration | 0 (0.0%) | 18 (100.0%) |
| Total (Category) | 0 (0.0%) | 60 (100.0%) |
| Total (Overall) | 75 (36.8%) | 129 (63.2%) |
Natural Resources, Construction and Maintenance Occupations
The most common Natural Resources, Construction and Maintenance occupations in Kila are , and Construction & Extraction (9 | 4.4%).
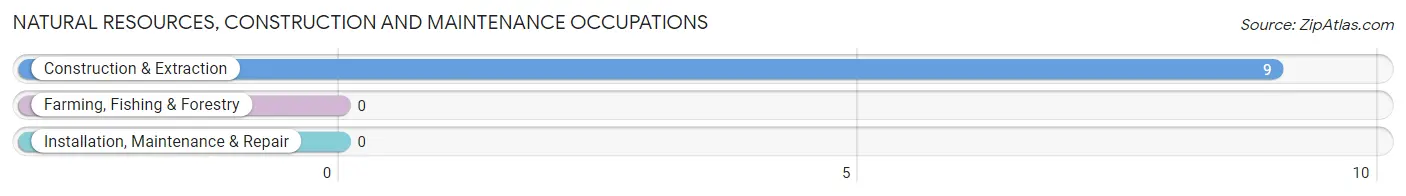
Natural Resources, Construction and Maintenance Occupations by Sex
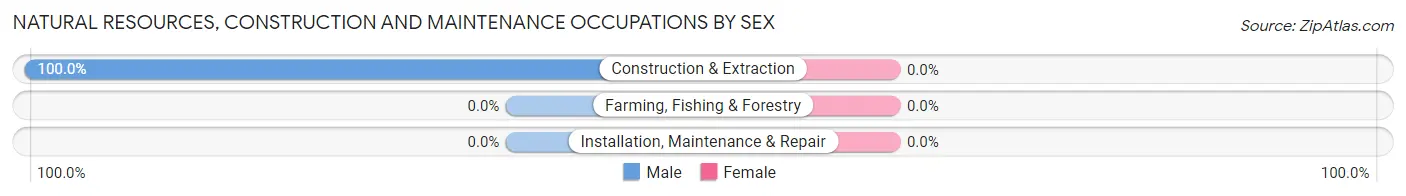
| Occupation | Male | Female |
| Farming, Fishing & Forestry | 0 (0.0%) | 0 (0.0%) |
| Construction & Extraction | 9 (100.0%) | 0 (0.0%) |
| Installation, Maintenance & Repair | 0 (0.0%) | 0 (0.0%) |
| Total (Category) | 9 (100.0%) | 0 (0.0%) |
| Total (Overall) | 75 (36.8%) | 129 (63.2%) |
Production, Transportation and Moving Occupations
The most common Production, Transportation and Moving occupations in Kila are Transportation (20 | 9.8%), Material Moving (15 | 7.3%), and Production (4 | 2.0%).
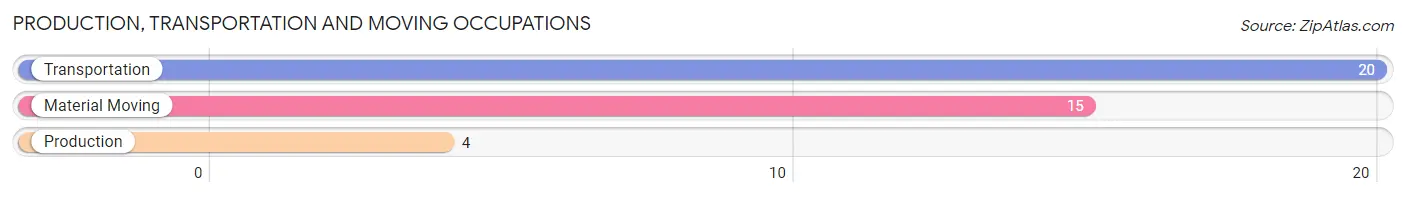
Production, Transportation and Moving Occupations by Sex
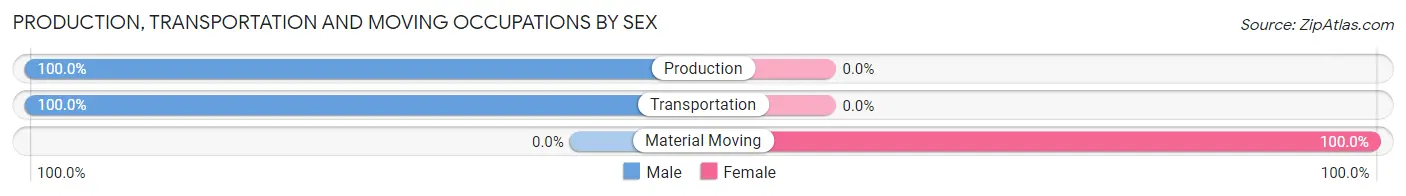
| Occupation | Male | Female |
| Production | 4 (100.0%) | 0 (0.0%) |
| Transportation | 20 (100.0%) | 0 (0.0%) |
| Material Moving | 0 (0.0%) | 15 (100.0%) |
| Total (Category) | 24 (61.5%) | 15 (38.5%) |
| Total (Overall) | 75 (36.8%) | 129 (63.2%) |
Employment Industries by Sex in Kila
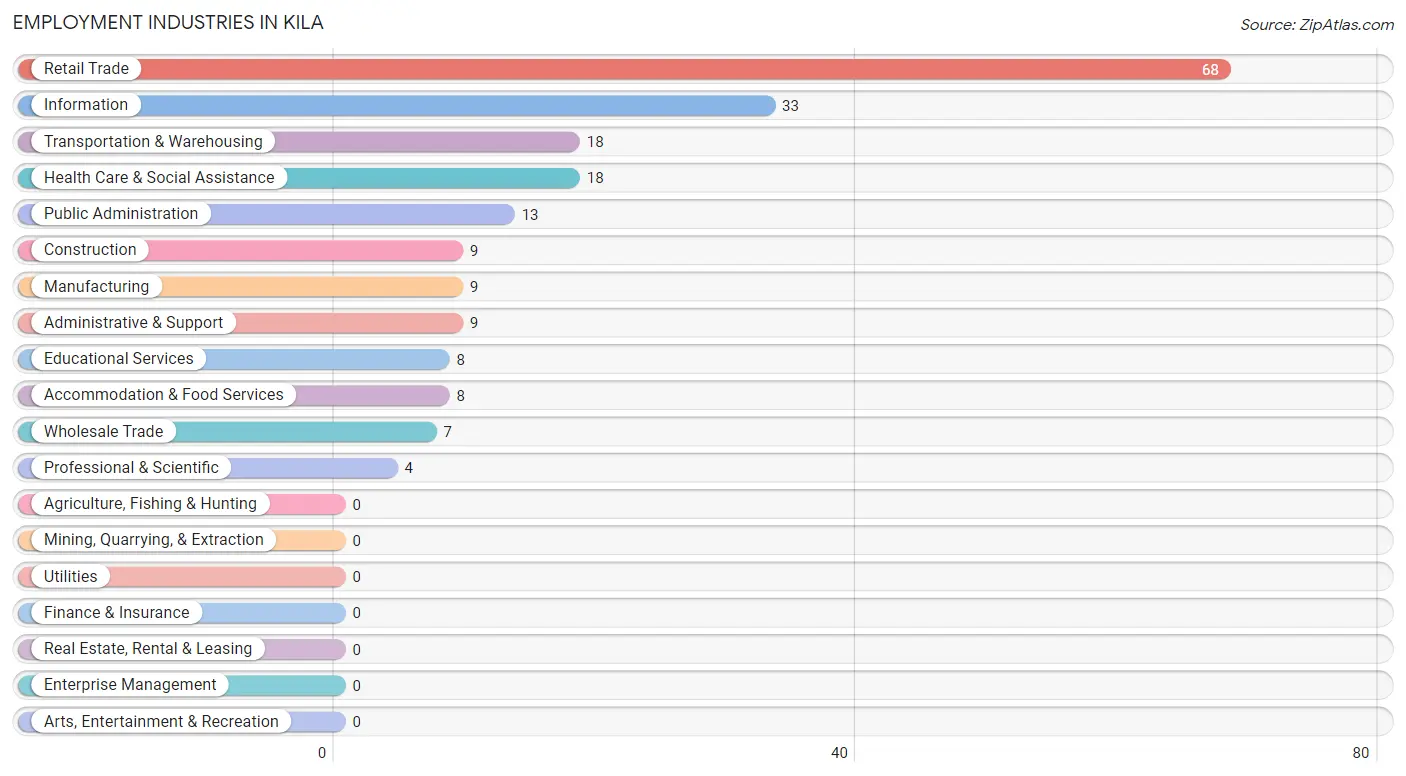
Employment Industries in Kila
The major employment industries in Kila include Retail Trade (68 | 33.3%), Information (33 | 16.2%), Transportation & Warehousing (18 | 8.8%), Health Care & Social Assistance (18 | 8.8%), and Public Administration (13 | 6.4%).
Employment Industries by Sex in Kila
The Kila industries that see more men than women are Construction (100.0%), Manufacturing (100.0%), and Transportation & Warehousing (100.0%), whereas the industries that tend to have a higher number of women are Wholesale Trade (100.0%), Retail Trade (100.0%), and Professional & Scientific (100.0%).
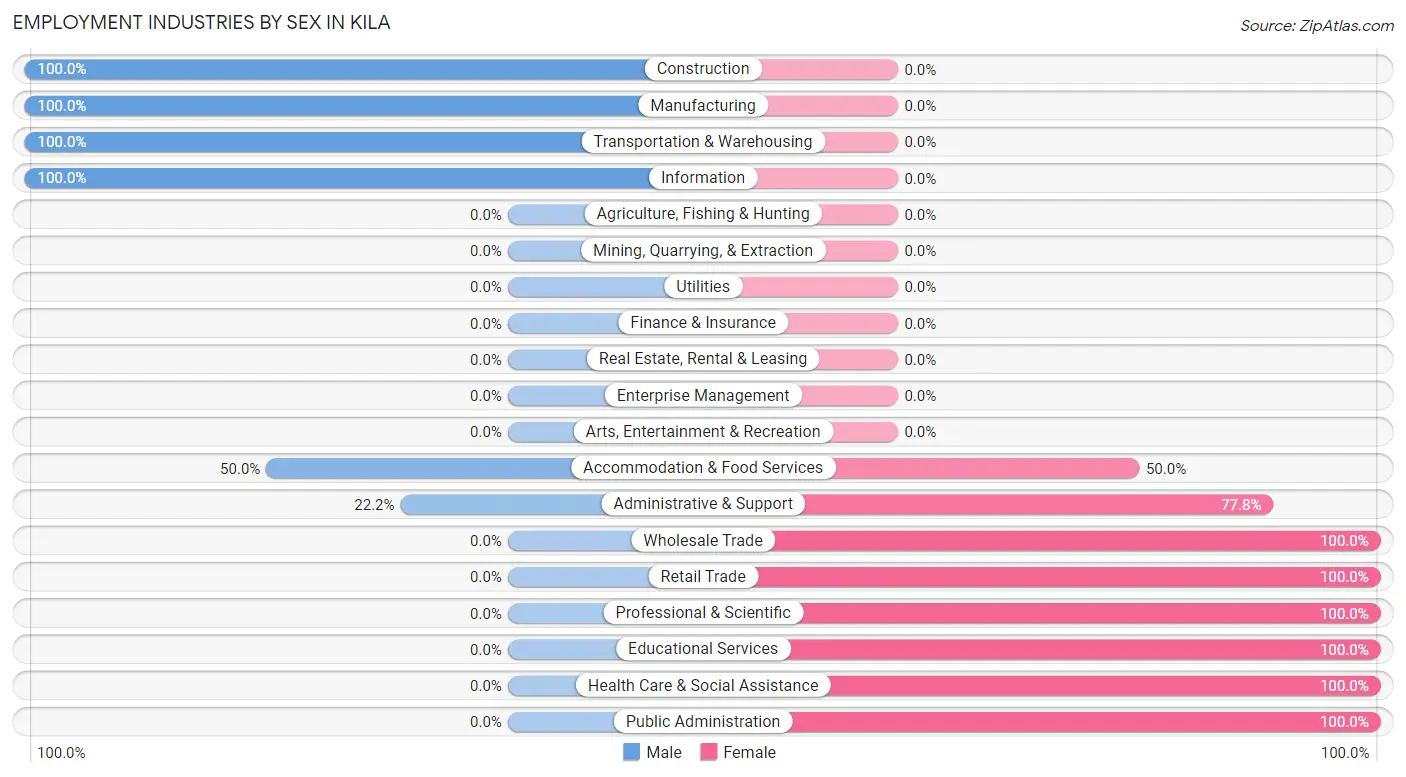
| Industry | Male | Female |
| Agriculture, Fishing & Hunting | 0 (0.0%) | 0 (0.0%) |
| Mining, Quarrying, & Extraction | 0 (0.0%) | 0 (0.0%) |
| Construction | 9 (100.0%) | 0 (0.0%) |
| Manufacturing | 9 (100.0%) | 0 (0.0%) |
| Wholesale Trade | 0 (0.0%) | 7 (100.0%) |
| Retail Trade | 0 (0.0%) | 68 (100.0%) |
| Transportation & Warehousing | 18 (100.0%) | 0 (0.0%) |
| Utilities | 0 (0.0%) | 0 (0.0%) |
| Information | 33 (100.0%) | 0 (0.0%) |
| Finance & Insurance | 0 (0.0%) | 0 (0.0%) |
| Real Estate, Rental & Leasing | 0 (0.0%) | 0 (0.0%) |
| Professional & Scientific | 0 (0.0%) | 4 (100.0%) |
| Enterprise Management | 0 (0.0%) | 0 (0.0%) |
| Administrative & Support | 2 (22.2%) | 7 (77.8%) |
| Educational Services | 0 (0.0%) | 8 (100.0%) |
| Health Care & Social Assistance | 0 (0.0%) | 18 (100.0%) |
| Arts, Entertainment & Recreation | 0 (0.0%) | 0 (0.0%) |
| Accommodation & Food Services | 4 (50.0%) | 4 (50.0%) |
| Public Administration | 0 (0.0%) | 13 (100.0%) |
| Total | 75 (36.8%) | 129 (63.2%) |
Education in Kila
School Enrollment in Kila
The most common levels of schooling among the 129 students in Kila are middle school (71 | 55.0%), and high school (58 | 45.0%).
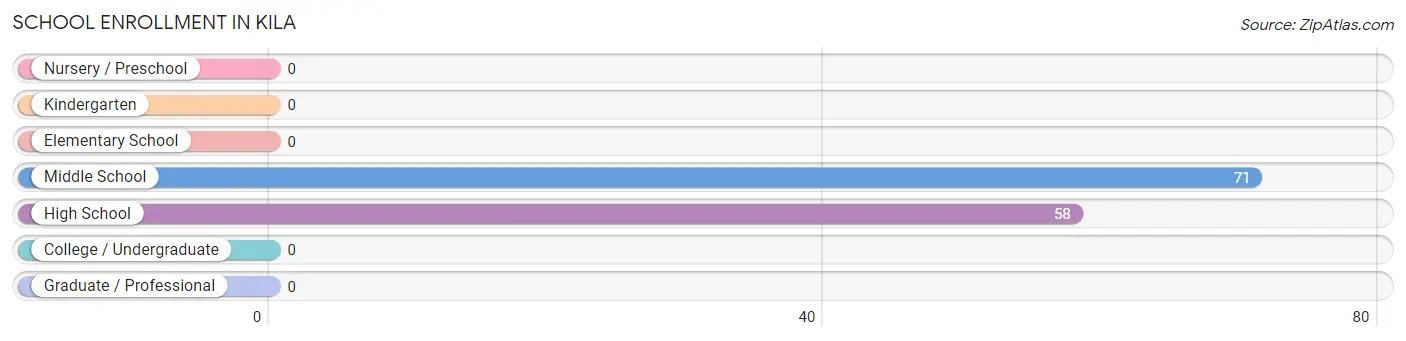
| School Level | # Students | % Students |
| Nursery / Preschool | 0 | 0.0% |
| Kindergarten | 0 | 0.0% |
| Elementary School | 0 | 0.0% |
| Middle School | 71 | 55.0% |
| High School | 58 | 45.0% |
| College / Undergraduate | 0 | 0.0% |
| Graduate / Professional | 0 | 0.0% |
| Total | 129 | 100.0% |
School Enrollment by Age by Funding Source in Kila
Out of a total of 129 students who are enrolled in schools in Kila, 21 (16.3%) attend a private institution, while the remaining 108 (83.7%) are enrolled in public schools. The age group of 15 to 17 year olds has the highest likelihood of being enrolled in private schools, with 15 (22.1% in the age bracket) enrolled. Conversely, the age group of 18 to 19 year olds has the lowest likelihood of being enrolled in a private school, with 33 (100.0% in the age bracket) attending a public institution.
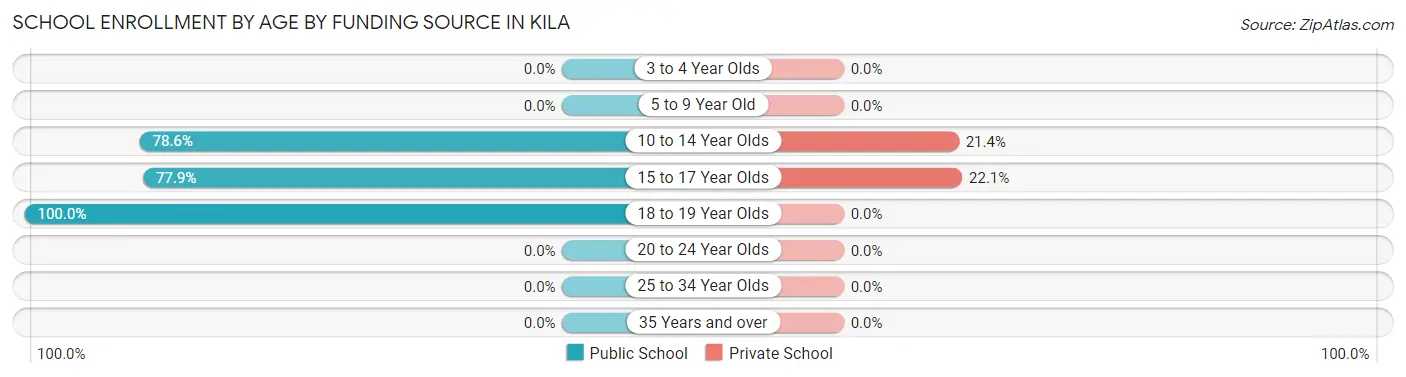
| Age Bracket | Public School | Private School |
| 3 to 4 Year Olds | 0 (0.0%) | 0 (0.0%) |
| 5 to 9 Year Old | 0 (0.0%) | 0 (0.0%) |
| 10 to 14 Year Olds | 22 (78.6%) | 6 (21.4%) |
| 15 to 17 Year Olds | 53 (77.9%) | 15 (22.1%) |
| 18 to 19 Year Olds | 33 (100.0%) | 0 (0.0%) |
| 20 to 24 Year Olds | 0 (0.0%) | 0 (0.0%) |
| 25 to 34 Year Olds | 0 (0.0%) | 0 (0.0%) |
| 35 Years and over | 0 (0.0%) | 0 (0.0%) |
| Total | 108 (83.7%) | 21 (16.3%) |
Educational Attainment by Field of Study in Kila
Liberal arts & history (33 | 22.6%), social sciences (25 | 17.1%), education (25 | 17.1%), business (20 | 13.7%), and physical & health sciences (11 | 7.5%) are the most common fields of study among 146 individuals in Kila who have obtained a bachelor's degree or higher.
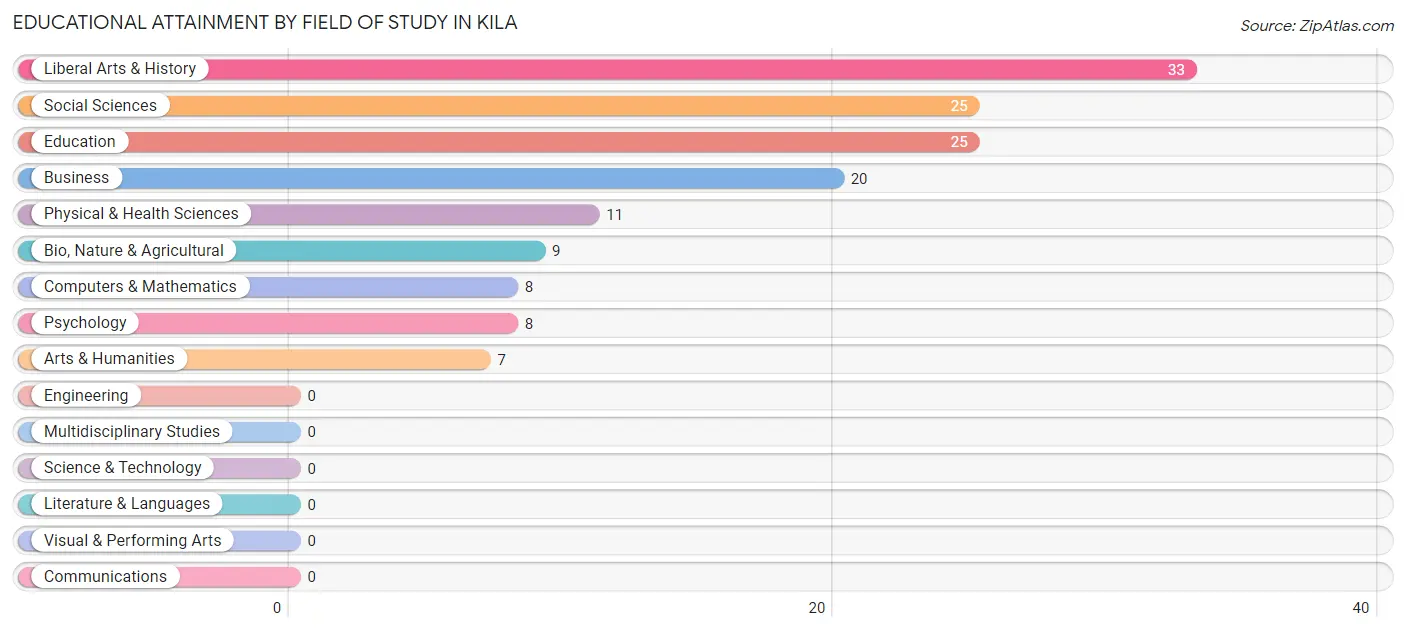
| Field of Study | # Graduates | % Graduates |
| Computers & Mathematics | 8 | 5.5% |
| Bio, Nature & Agricultural | 9 | 6.2% |
| Physical & Health Sciences | 11 | 7.5% |
| Psychology | 8 | 5.5% |
| Social Sciences | 25 | 17.1% |
| Engineering | 0 | 0.0% |
| Multidisciplinary Studies | 0 | 0.0% |
| Science & Technology | 0 | 0.0% |
| Business | 20 | 13.7% |
| Education | 25 | 17.1% |
| Literature & Languages | 0 | 0.0% |
| Liberal Arts & History | 33 | 22.6% |
| Visual & Performing Arts | 0 | 0.0% |
| Communications | 0 | 0.0% |
| Arts & Humanities | 7 | 4.8% |
| Total | 146 | 100.0% |
Transportation & Commute in Kila
Vehicle Availability by Sex in Kila
The most prevalent vehicle ownership categories in Kila are males with 3 vehicles (39, accounting for 52.0%) and females with 3 vehicles (78, making up 31.2%).
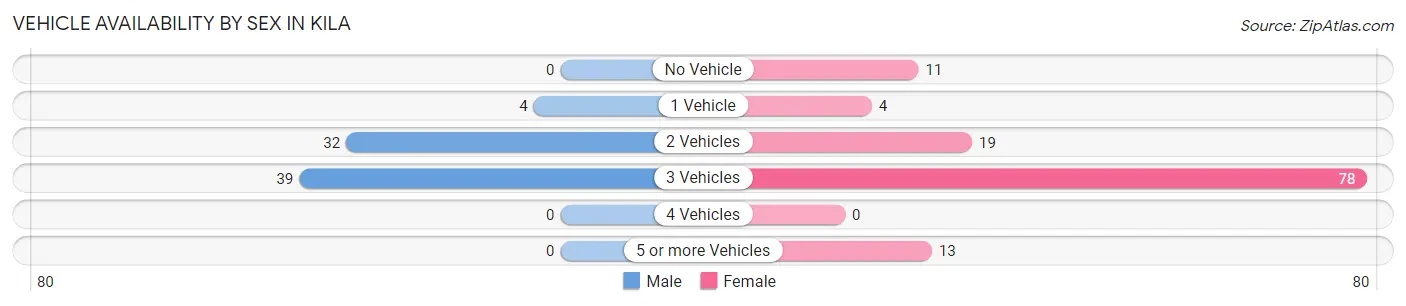
| Vehicles Available | Male | Female |
| No Vehicle | 0 (0.0%) | 11 (8.8%) |
| 1 Vehicle | 4 (5.3%) | 4 (3.2%) |
| 2 Vehicles | 32 (42.7%) | 19 (15.2%) |
| 3 Vehicles | 39 (52.0%) | 78 (62.4%) |
| 4 Vehicles | 0 (0.0%) | 0 (0.0%) |
| 5 or more Vehicles | 0 (0.0%) | 13 (10.4%) |
| Total | 75 (100.0%) | 125 (100.0%) |
Commute Time in Kila
The most frequently occuring commute durations in Kila are 20 to 24 minutes (70 commuters, 36.3%), 15 to 19 minutes (35 commuters, 18.1%), and 5 to 9 minutes (33 commuters, 17.1%).
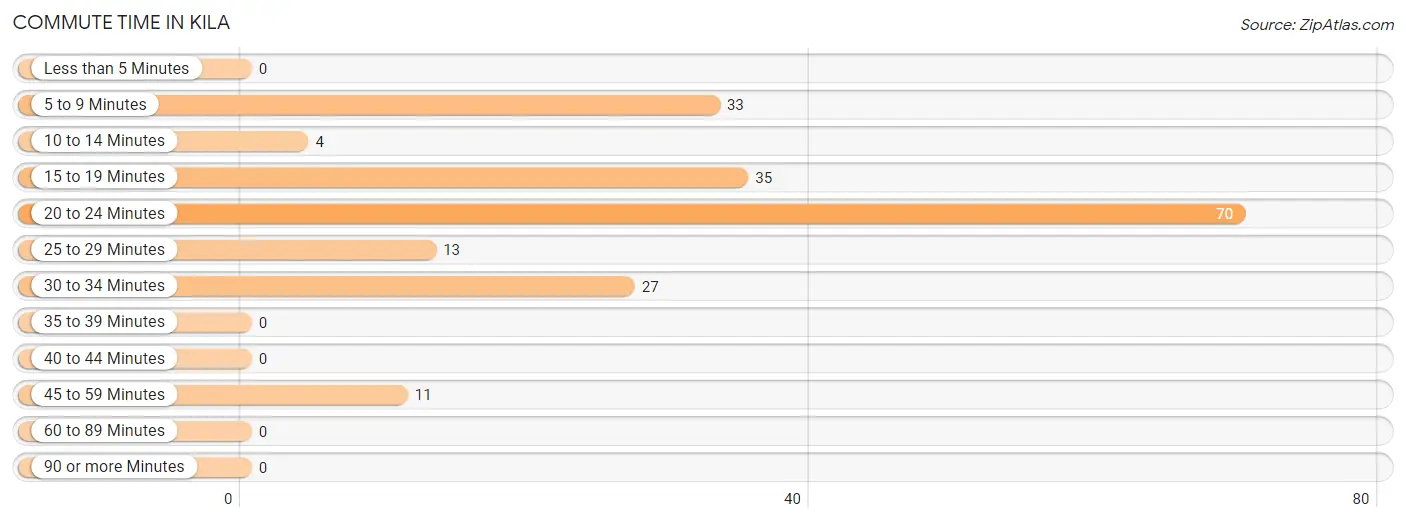
| Commute Time | # Commuters | % Commuters |
| Less than 5 Minutes | 0 | 0.0% |
| 5 to 9 Minutes | 33 | 17.1% |
| 10 to 14 Minutes | 4 | 2.1% |
| 15 to 19 Minutes | 35 | 18.1% |
| 20 to 24 Minutes | 70 | 36.3% |
| 25 to 29 Minutes | 13 | 6.7% |
| 30 to 34 Minutes | 27 | 14.0% |
| 35 to 39 Minutes | 0 | 0.0% |
| 40 to 44 Minutes | 0 | 0.0% |
| 45 to 59 Minutes | 11 | 5.7% |
| 60 to 89 Minutes | 0 | 0.0% |
| 90 or more Minutes | 0 | 0.0% |
Commute Time by Sex in Kila
The most common commute times in Kila are 5 to 9 minutes (33 commuters, 44.0%) for males and 20 to 24 minutes (57 commuters, 48.3%) for females.
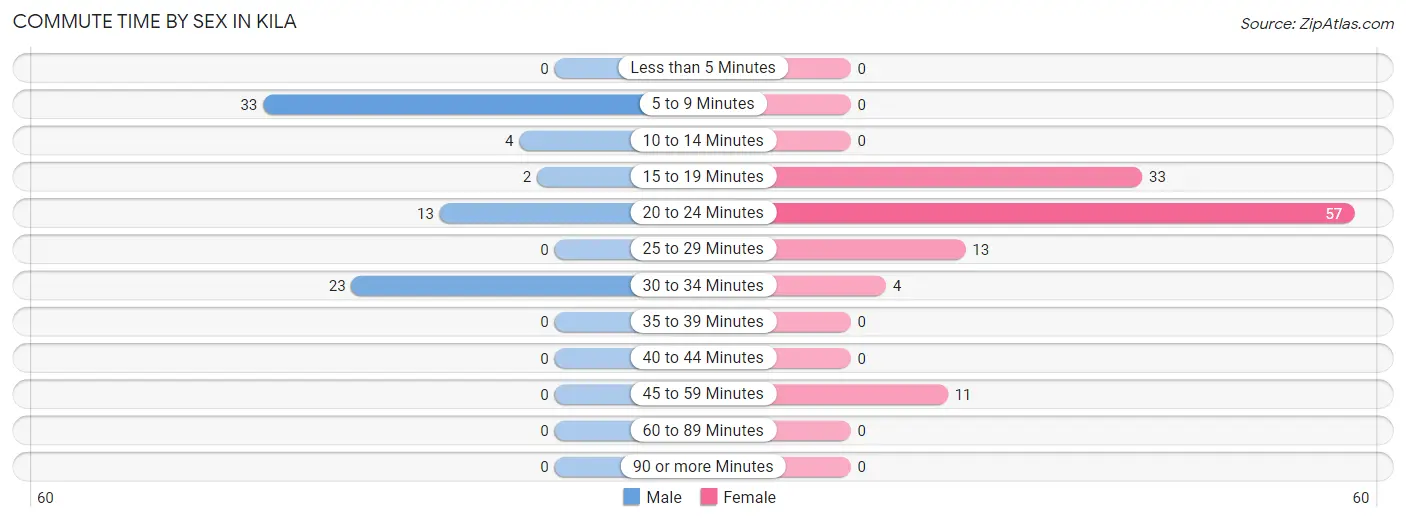
| Commute Time | Male | Female |
| Less than 5 Minutes | 0 (0.0%) | 0 (0.0%) |
| 5 to 9 Minutes | 33 (44.0%) | 0 (0.0%) |
| 10 to 14 Minutes | 4 (5.3%) | 0 (0.0%) |
| 15 to 19 Minutes | 2 (2.7%) | 33 (28.0%) |
| 20 to 24 Minutes | 13 (17.3%) | 57 (48.3%) |
| 25 to 29 Minutes | 0 (0.0%) | 13 (11.0%) |
| 30 to 34 Minutes | 23 (30.7%) | 4 (3.4%) |
| 35 to 39 Minutes | 0 (0.0%) | 0 (0.0%) |
| 40 to 44 Minutes | 0 (0.0%) | 0 (0.0%) |
| 45 to 59 Minutes | 0 (0.0%) | 11 (9.3%) |
| 60 to 89 Minutes | 0 (0.0%) | 0 (0.0%) |
| 90 or more Minutes | 0 (0.0%) | 0 (0.0%) |
Time of Departure to Work by Sex in Kila
The most frequent times of departure to work in Kila are 6:30 AM to 6:59 AM (37, 49.3%) for males and 7:30 AM to 7:59 AM (66, 55.9%) for females.
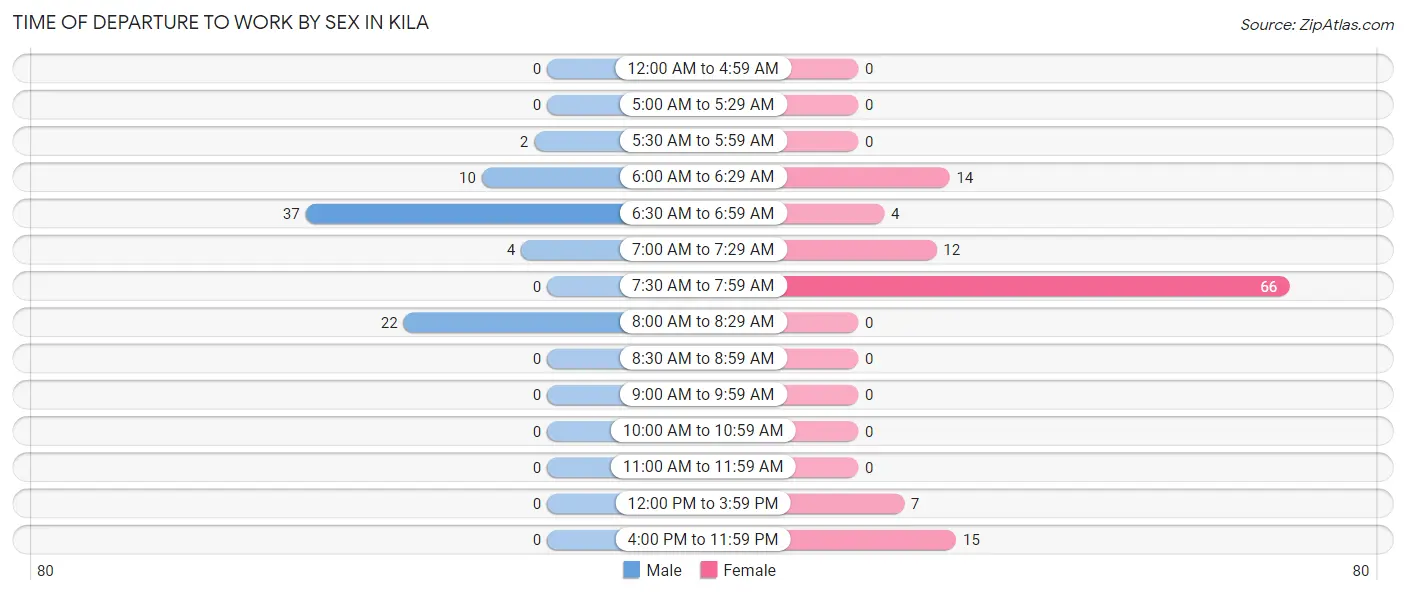
| Time of Departure | Male | Female |
| 12:00 AM to 4:59 AM | 0 (0.0%) | 0 (0.0%) |
| 5:00 AM to 5:29 AM | 0 (0.0%) | 0 (0.0%) |
| 5:30 AM to 5:59 AM | 2 (2.7%) | 0 (0.0%) |
| 6:00 AM to 6:29 AM | 10 (13.3%) | 14 (11.9%) |
| 6:30 AM to 6:59 AM | 37 (49.3%) | 4 (3.4%) |
| 7:00 AM to 7:29 AM | 4 (5.3%) | 12 (10.2%) |
| 7:30 AM to 7:59 AM | 0 (0.0%) | 66 (55.9%) |
| 8:00 AM to 8:29 AM | 22 (29.3%) | 0 (0.0%) |
| 8:30 AM to 8:59 AM | 0 (0.0%) | 0 (0.0%) |
| 9:00 AM to 9:59 AM | 0 (0.0%) | 0 (0.0%) |
| 10:00 AM to 10:59 AM | 0 (0.0%) | 0 (0.0%) |
| 11:00 AM to 11:59 AM | 0 (0.0%) | 0 (0.0%) |
| 12:00 PM to 3:59 PM | 0 (0.0%) | 7 (5.9%) |
| 4:00 PM to 11:59 PM | 0 (0.0%) | 15 (12.7%) |
| Total | 75 (100.0%) | 118 (100.0%) |
Housing Occupancy in Kila
Occupancy by Ownership in Kila
Of the total 159 dwellings in Kila, owner-occupied units account for 125 (78.6%), while renter-occupied units make up 34 (21.4%).
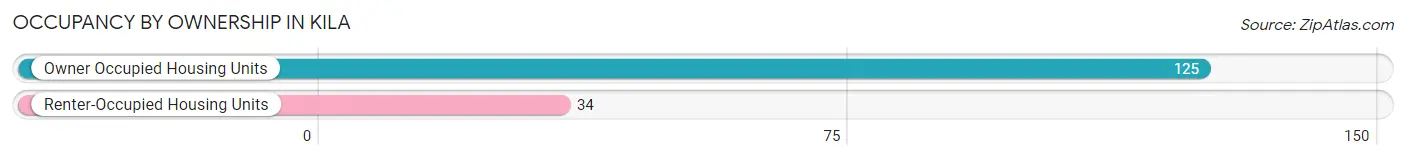
| Occupancy | # Housing Units | % Housing Units |
| Owner Occupied Housing Units | 125 | 78.6% |
| Renter-Occupied Housing Units | 34 | 21.4% |
| Total Occupied Housing Units | 159 | 100.0% |
Occupancy by Household Size in Kila
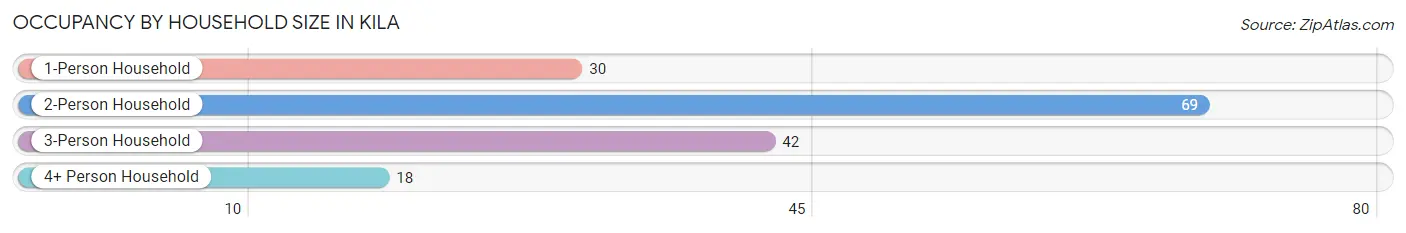
| Household Size | # Housing Units | % Housing Units |
| 1-Person Household | 30 | 18.9% |
| 2-Person Household | 69 | 43.4% |
| 3-Person Household | 42 | 26.4% |
| 4+ Person Household | 18 | 11.3% |
| Total Housing Units | 159 | 100.0% |
Occupancy by Ownership by Household Size in Kila
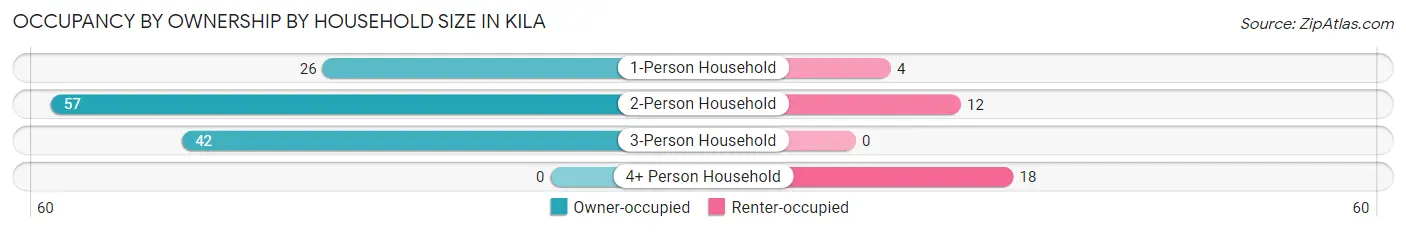
| Household Size | Owner-occupied | Renter-occupied |
| 1-Person Household | 26 (86.7%) | 4 (13.3%) |
| 2-Person Household | 57 (82.6%) | 12 (17.4%) |
| 3-Person Household | 42 (100.0%) | 0 (0.0%) |
| 4+ Person Household | 0 (0.0%) | 18 (100.0%) |
| Total Housing Units | 125 (78.6%) | 34 (21.4%) |
Occupancy by Educational Attainment in Kila
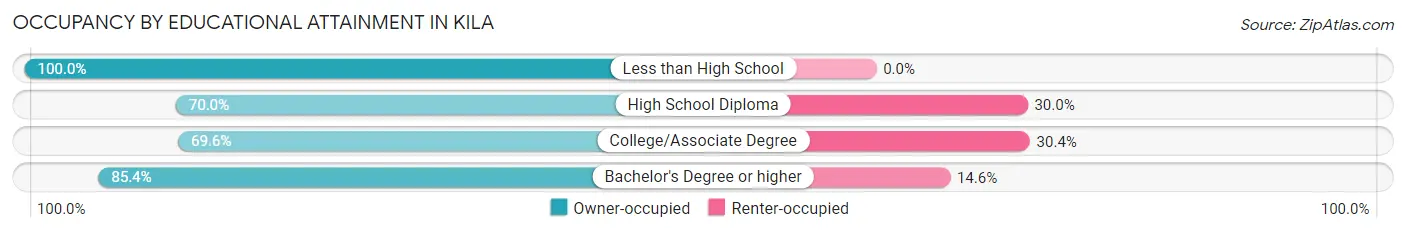
| Household Size | Owner-occupied | Renter-occupied |
| Less than High School | 4 (100.0%) | 0 (0.0%) |
| High School Diploma | 35 (70.0%) | 15 (30.0%) |
| College/Associate Degree | 16 (69.6%) | 7 (30.4%) |
| Bachelor's Degree or higher | 70 (85.4%) | 12 (14.6%) |
Occupancy by Age of Householder in Kila
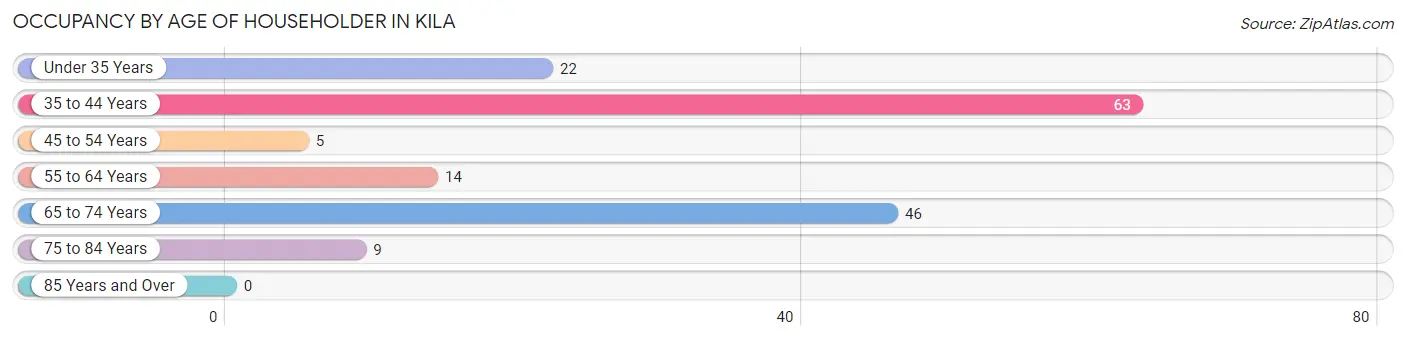
| Age Bracket | # Households | % Households |
| Under 35 Years | 22 | 13.8% |
| 35 to 44 Years | 63 | 39.6% |
| 45 to 54 Years | 5 | 3.1% |
| 55 to 64 Years | 14 | 8.8% |
| 65 to 74 Years | 46 | 28.9% |
| 75 to 84 Years | 9 | 5.7% |
| 85 Years and Over | 0 | 0.0% |
| Total | 159 | 100.0% |
Housing Finances in Kila
Median Income by Occupancy in Kila
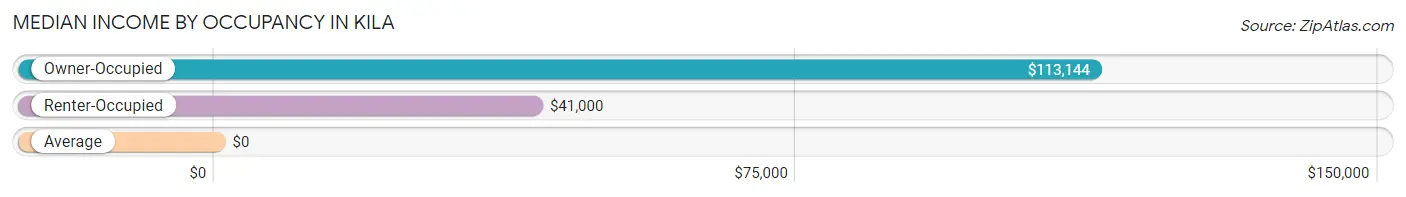
| Occupancy Type | # Households | Median Income |
| Owner-Occupied | 125 (78.6%) | $113,144 |
| Renter-Occupied | 34 (21.4%) | $41,000 |
| Average | 159 (100.0%) | $0 |
Occupancy by Householder Income Bracket in Kila
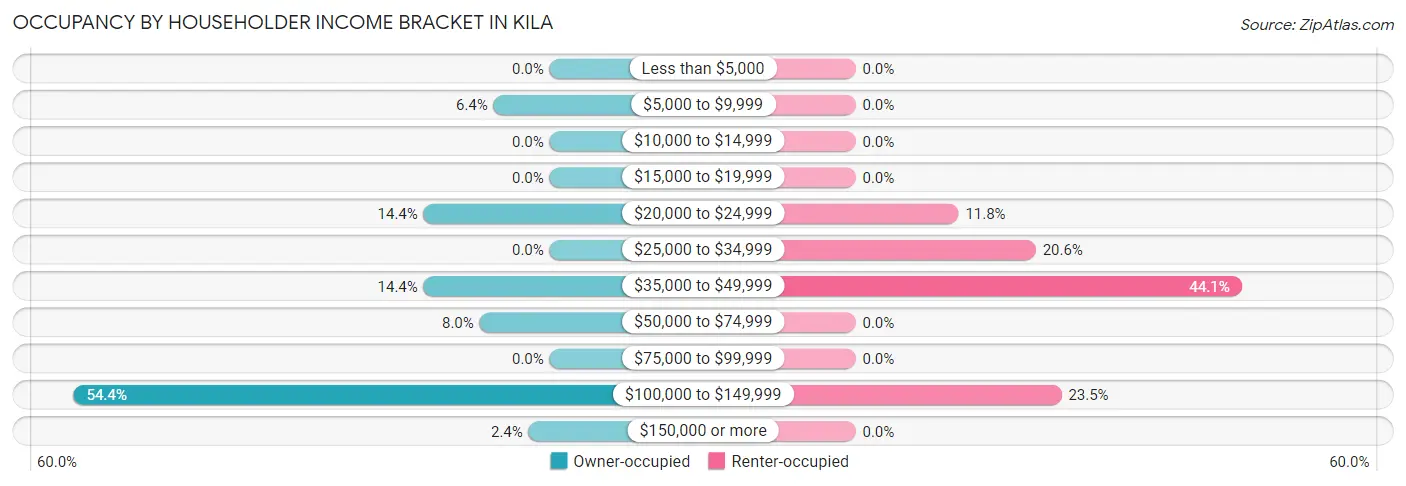
| Income Bracket | Owner-occupied | Renter-occupied |
| Less than $5,000 | 0 (0.0%) | 0 (0.0%) |
| $5,000 to $9,999 | 8 (6.4%) | 0 (0.0%) |
| $10,000 to $14,999 | 0 (0.0%) | 0 (0.0%) |
| $15,000 to $19,999 | 0 (0.0%) | 0 (0.0%) |
| $20,000 to $24,999 | 18 (14.4%) | 4 (11.8%) |
| $25,000 to $34,999 | 0 (0.0%) | 7 (20.6%) |
| $35,000 to $49,999 | 18 (14.4%) | 15 (44.1%) |
| $50,000 to $74,999 | 10 (8.0%) | 0 (0.0%) |
| $75,000 to $99,999 | 0 (0.0%) | 0 (0.0%) |
| $100,000 to $149,999 | 68 (54.4%) | 8 (23.5%) |
| $150,000 or more | 3 (2.4%) | 0 (0.0%) |
| Total | 125 (100.0%) | 34 (100.0%) |
Monthly Housing Cost Tiers in Kila
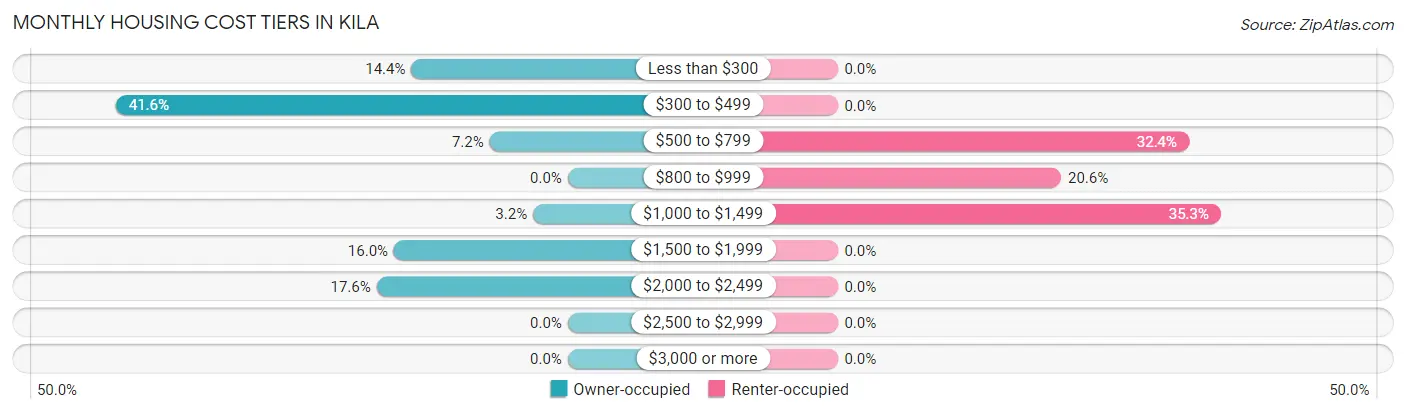
| Monthly Cost | Owner-occupied | Renter-occupied |
| Less than $300 | 18 (14.4%) | 0 (0.0%) |
| $300 to $499 | 52 (41.6%) | 0 (0.0%) |
| $500 to $799 | 9 (7.2%) | 11 (32.4%) |
| $800 to $999 | 0 (0.0%) | 7 (20.6%) |
| $1,000 to $1,499 | 4 (3.2%) | 12 (35.3%) |
| $1,500 to $1,999 | 20 (16.0%) | 0 (0.0%) |
| $2,000 to $2,499 | 22 (17.6%) | 0 (0.0%) |
| $2,500 to $2,999 | 0 (0.0%) | 0 (0.0%) |
| $3,000 or more | 0 (0.0%) | 0 (0.0%) |
| Total | 125 (100.0%) | 34 (100.0%) |
Physical Housing Characteristics in Kila
Housing Structures in Kila
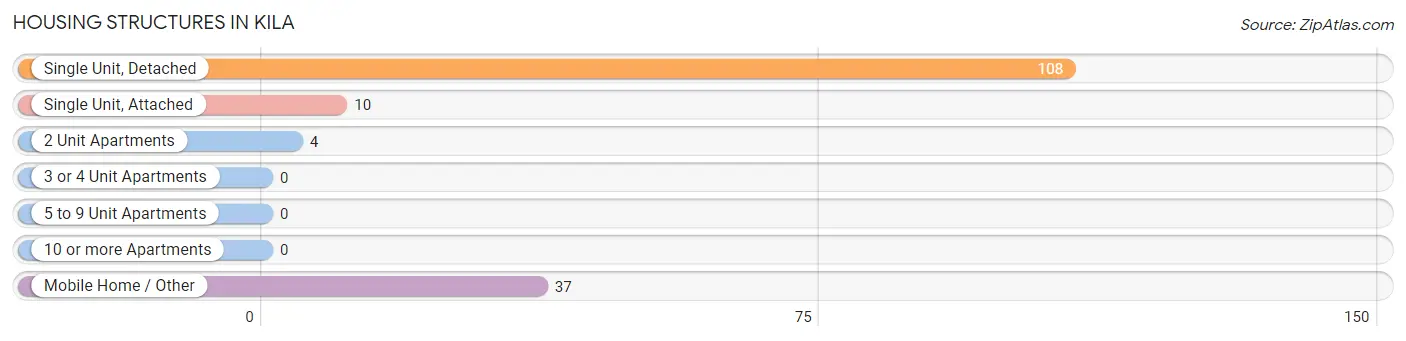
| Structure Type | # Housing Units | % Housing Units |
| Single Unit, Detached | 108 | 67.9% |
| Single Unit, Attached | 10 | 6.3% |
| 2 Unit Apartments | 4 | 2.5% |
| 3 or 4 Unit Apartments | 0 | 0.0% |
| 5 to 9 Unit Apartments | 0 | 0.0% |
| 10 or more Apartments | 0 | 0.0% |
| Mobile Home / Other | 37 | 23.3% |
| Total | 159 | 100.0% |
Housing Structures by Occupancy in Kila
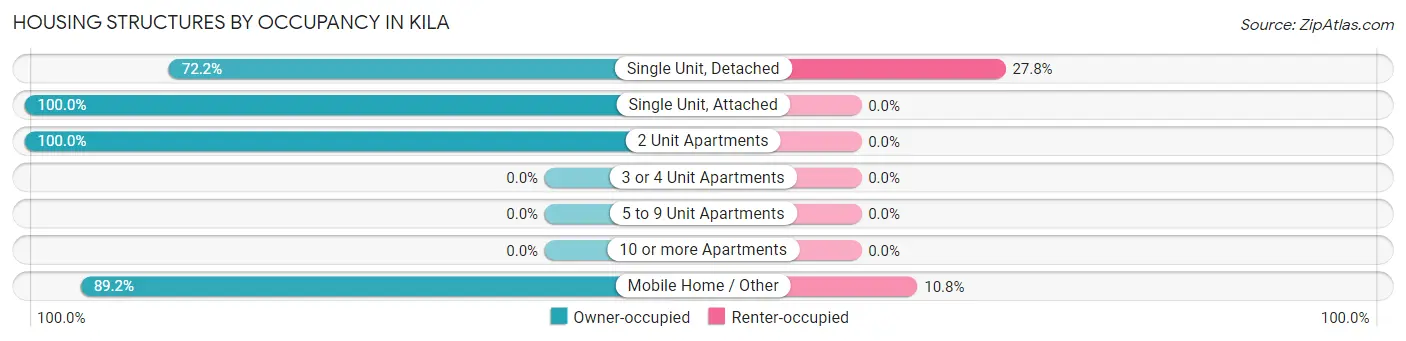
| Structure Type | Owner-occupied | Renter-occupied |
| Single Unit, Detached | 78 (72.2%) | 30 (27.8%) |
| Single Unit, Attached | 10 (100.0%) | 0 (0.0%) |
| 2 Unit Apartments | 4 (100.0%) | 0 (0.0%) |
| 3 or 4 Unit Apartments | 0 (0.0%) | 0 (0.0%) |
| 5 to 9 Unit Apartments | 0 (0.0%) | 0 (0.0%) |
| 10 or more Apartments | 0 (0.0%) | 0 (0.0%) |
| Mobile Home / Other | 33 (89.2%) | 4 (10.8%) |
| Total | 125 (78.6%) | 34 (21.4%) |
Housing Structures by Number of Rooms in Kila
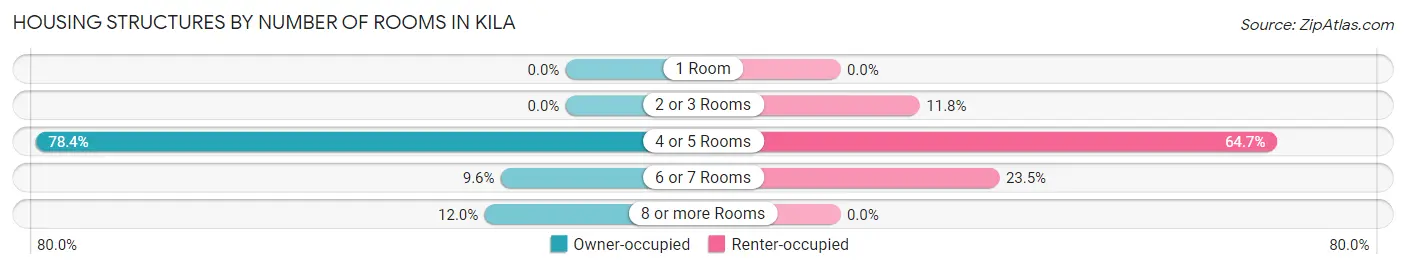
| Number of Rooms | Owner-occupied | Renter-occupied |
| 1 Room | 0 (0.0%) | 0 (0.0%) |
| 2 or 3 Rooms | 0 (0.0%) | 4 (11.8%) |
| 4 or 5 Rooms | 98 (78.4%) | 22 (64.7%) |
| 6 or 7 Rooms | 12 (9.6%) | 8 (23.5%) |
| 8 or more Rooms | 15 (12.0%) | 0 (0.0%) |
| Total | 125 (100.0%) | 34 (100.0%) |
Housing Structure by Heating Type in Kila
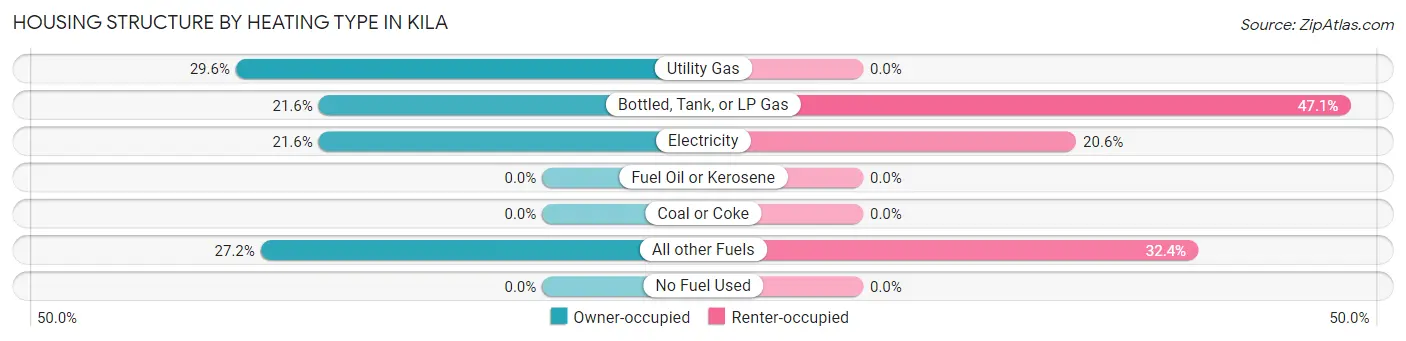
| Heating Type | Owner-occupied | Renter-occupied |
| Utility Gas | 37 (29.6%) | 0 (0.0%) |
| Bottled, Tank, or LP Gas | 27 (21.6%) | 16 (47.1%) |
| Electricity | 27 (21.6%) | 7 (20.6%) |
| Fuel Oil or Kerosene | 0 (0.0%) | 0 (0.0%) |
| Coal or Coke | 0 (0.0%) | 0 (0.0%) |
| All other Fuels | 34 (27.2%) | 11 (32.4%) |
| No Fuel Used | 0 (0.0%) | 0 (0.0%) |
| Total | 125 (100.0%) | 34 (100.0%) |
Household Vehicle Usage in Kila
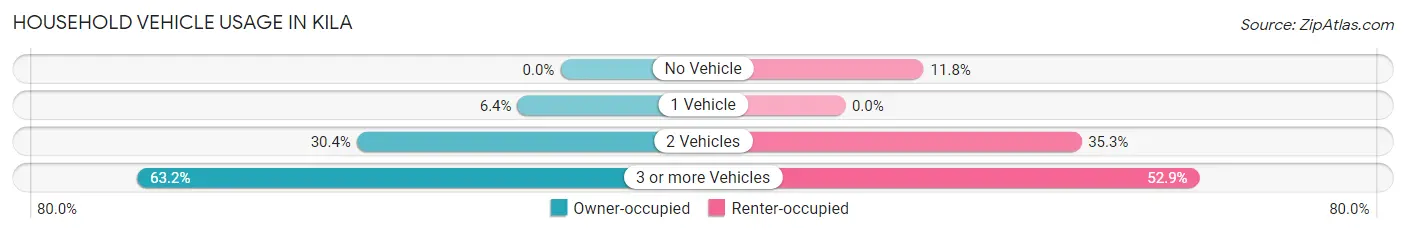
| Vehicles per Household | Owner-occupied | Renter-occupied |
| No Vehicle | 0 (0.0%) | 4 (11.8%) |
| 1 Vehicle | 8 (6.4%) | 0 (0.0%) |
| 2 Vehicles | 38 (30.4%) | 12 (35.3%) |
| 3 or more Vehicles | 79 (63.2%) | 18 (52.9%) |
| Total | 125 (100.0%) | 34 (100.0%) |
Real Estate & Mortgages in Kila
Real Estate and Mortgage Overview in Kila
| Characteristic | Without Mortgage | With Mortgage |
| Housing Units | 70 | 55 |
| Median Property Value | - | - |
| Median Household Income | - | - |
| Monthly Housing Costs | $321 | $0 |
| Real Estate Taxes | $1,375 | $0 |
Property Value by Mortgage Status in Kila
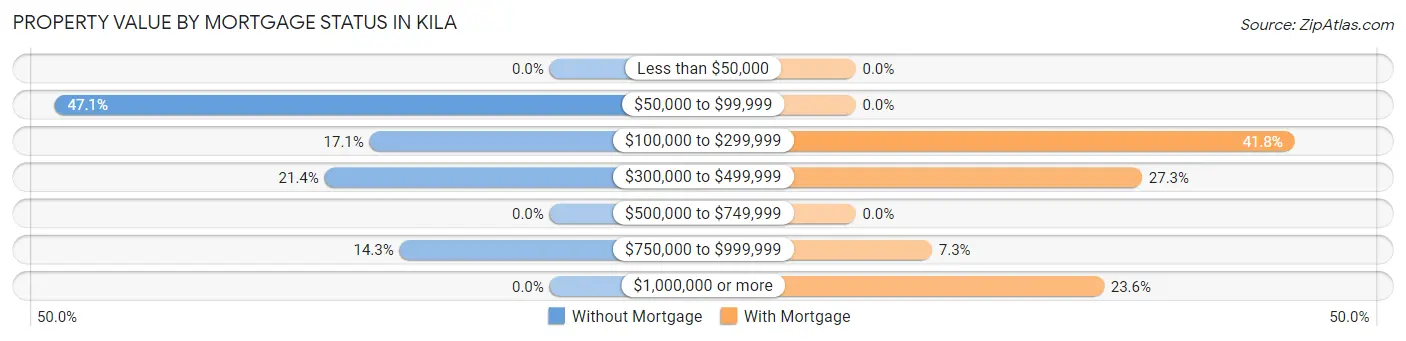
| Property Value | Without Mortgage | With Mortgage |
| Less than $50,000 | 0 (0.0%) | 0 (0.0%) |
| $50,000 to $99,999 | 33 (47.1%) | 0 (0.0%) |
| $100,000 to $299,999 | 12 (17.1%) | 23 (41.8%) |
| $300,000 to $499,999 | 15 (21.4%) | 15 (27.3%) |
| $500,000 to $749,999 | 0 (0.0%) | 0 (0.0%) |
| $750,000 to $999,999 | 10 (14.3%) | 4 (7.3%) |
| $1,000,000 or more | 0 (0.0%) | 13 (23.6%) |
| Total | 70 (100.0%) | 55 (100.0%) |
Household Income by Mortgage Status in Kila
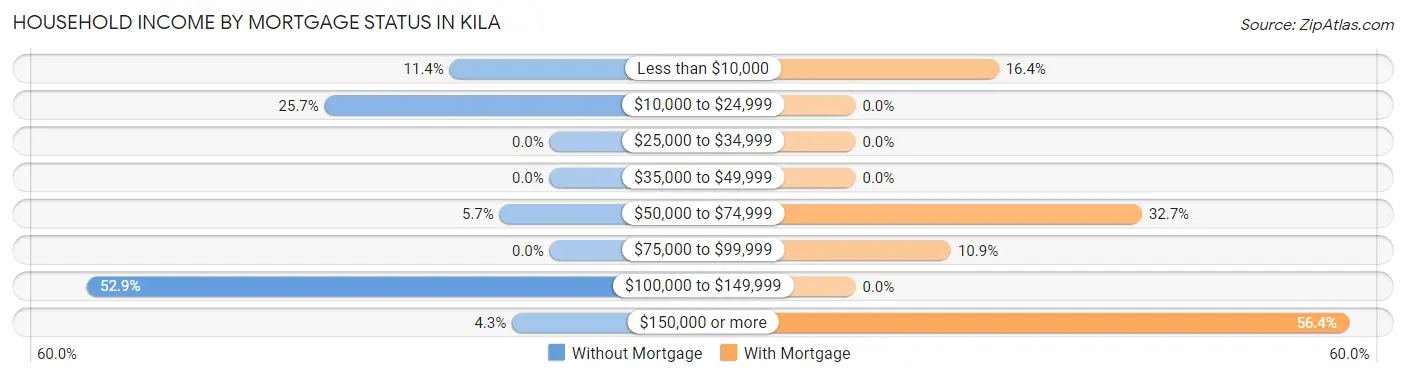
| Household Income | Without Mortgage | With Mortgage |
| Less than $10,000 | 8 (11.4%) | 9 (16.4%) |
| $10,000 to $24,999 | 18 (25.7%) | 0 (0.0%) |
| $25,000 to $34,999 | 0 (0.0%) | 0 (0.0%) |
| $35,000 to $49,999 | 0 (0.0%) | 0 (0.0%) |
| $50,000 to $74,999 | 4 (5.7%) | 18 (32.7%) |
| $75,000 to $99,999 | 0 (0.0%) | 6 (10.9%) |
| $100,000 to $149,999 | 37 (52.9%) | 0 (0.0%) |
| $150,000 or more | 3 (4.3%) | 31 (56.4%) |
| Total | 70 (100.0%) | 55 (100.0%) |
Property Value to Household Income Ratio in Kila
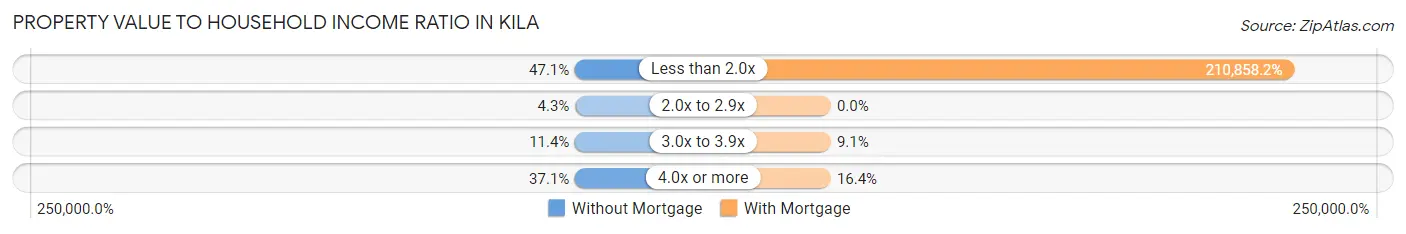
| Value-to-Income Ratio | Without Mortgage | With Mortgage |
| Less than 2.0x | 33 (47.1%) | 115,972 (210,858.2%) |
| 2.0x to 2.9x | 3 (4.3%) | 0 (0.0%) |
| 3.0x to 3.9x | 8 (11.4%) | 5 (9.1%) |
| 4.0x or more | 26 (37.1%) | 9 (16.4%) |
| Total | 70 (100.0%) | 55 (100.0%) |
Real Estate Taxes by Mortgage Status in Kila
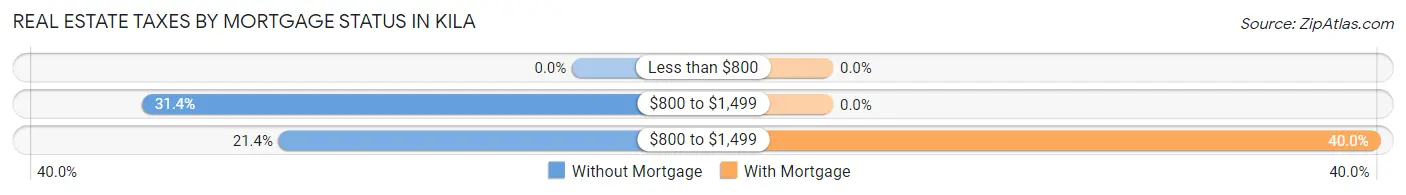
| Property Taxes | Without Mortgage | With Mortgage |
| Less than $800 | 0 (0.0%) | 0 (0.0%) |
| $800 to $1,499 | 22 (31.4%) | 0 (0.0%) |
| $800 to $1,499 | 15 (21.4%) | 22 (40.0%) |
| Total | 70 (100.0%) | 55 (100.0%) |
Health & Disability in Kila
Health Insurance Coverage by Age in Kila
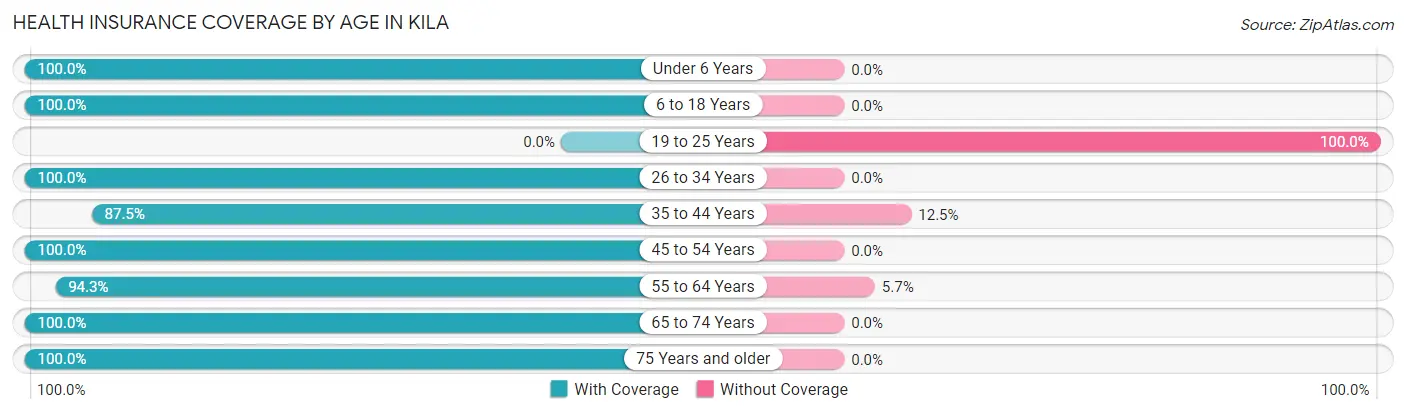
| Age Bracket | With Coverage | Without Coverage |
| Under 6 Years | 22 (100.0%) | 0 (0.0%) |
| 6 to 18 Years | 137 (100.0%) | 0 (0.0%) |
| 19 to 25 Years | 0 (0.0%) | 18 (100.0%) |
| 26 to 34 Years | 4 (100.0%) | 0 (0.0%) |
| 35 to 44 Years | 84 (87.5%) | 12 (12.5%) |
| 45 to 54 Years | 30 (100.0%) | 0 (0.0%) |
| 55 to 64 Years | 33 (94.3%) | 2 (5.7%) |
| 65 to 74 Years | 78 (100.0%) | 0 (0.0%) |
| 75 Years and older | 20 (100.0%) | 0 (0.0%) |
| Total | 408 (92.7%) | 32 (7.3%) |
Health Insurance Coverage by Citizenship Status in Kila
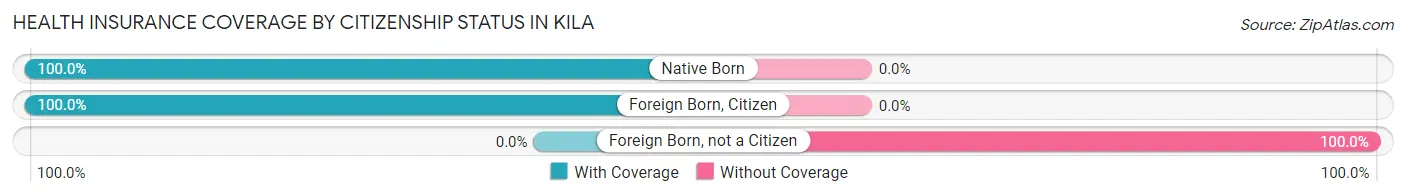
| Citizenship Status | With Coverage | Without Coverage |
| Native Born | 22 (100.0%) | 0 (0.0%) |
| Foreign Born, Citizen | 137 (100.0%) | 0 (0.0%) |
| Foreign Born, not a Citizen | 0 (0.0%) | 18 (100.0%) |
Health Insurance Coverage by Household Income in Kila
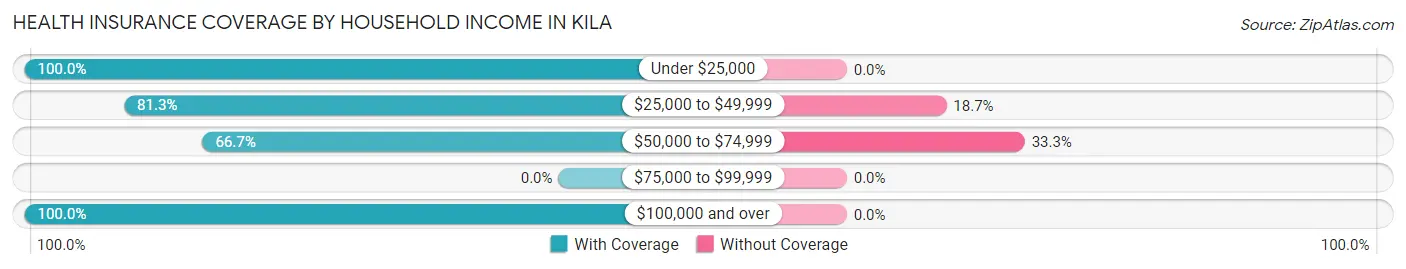
| Household Income | With Coverage | Without Coverage |
| Under $25,000 | 73 (100.0%) | 0 (0.0%) |
| $25,000 to $49,999 | 109 (81.3%) | 25 (18.7%) |
| $50,000 to $74,999 | 14 (66.7%) | 7 (33.3%) |
| $75,000 to $99,999 | 0 (0.0%) | 0 (0.0%) |
| $100,000 and over | 212 (100.0%) | 0 (0.0%) |
Public vs Private Health Insurance Coverage by Age in Kila
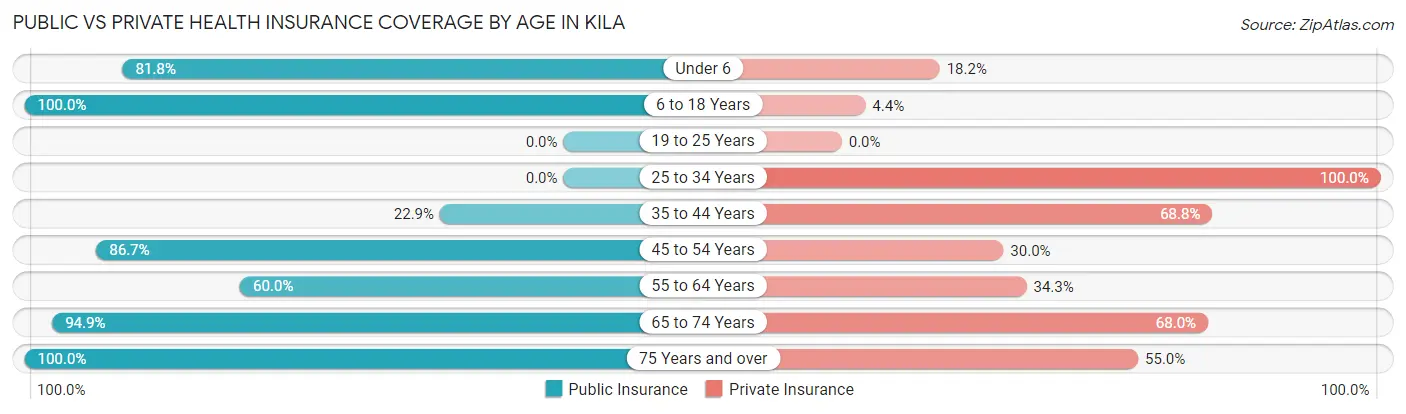
| Age Bracket | Public Insurance | Private Insurance |
| Under 6 | 18 (81.8%) | 4 (18.2%) |
| 6 to 18 Years | 137 (100.0%) | 6 (4.4%) |
| 19 to 25 Years | 0 (0.0%) | 0 (0.0%) |
| 25 to 34 Years | 0 (0.0%) | 4 (100.0%) |
| 35 to 44 Years | 22 (22.9%) | 66 (68.8%) |
| 45 to 54 Years | 26 (86.7%) | 9 (30.0%) |
| 55 to 64 Years | 21 (60.0%) | 12 (34.3%) |
| 65 to 74 Years | 74 (94.9%) | 53 (67.9%) |
| 75 Years and over | 20 (100.0%) | 11 (55.0%) |
| Total | 318 (72.3%) | 165 (37.5%) |
Disability Status by Sex by Age in Kila
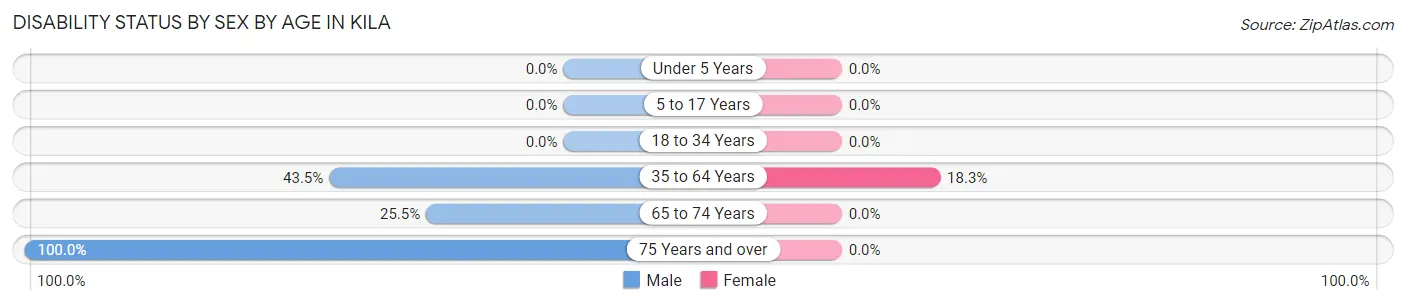
| Age Bracket | Male | Female |
| Under 5 Years | 0 (0.0%) | 0 (0.0%) |
| 5 to 17 Years | 0 (0.0%) | 0 (0.0%) |
| 18 to 34 Years | 0 (0.0%) | 0 (0.0%) |
| 35 to 64 Years | 20 (43.5%) | 21 (18.3%) |
| 65 to 74 Years | 13 (25.5%) | 0 (0.0%) |
| 75 Years and over | 11 (100.0%) | 0 (0.0%) |
Disability Class by Sex by Age in Kila
Disability Class: Hearing Difficulty
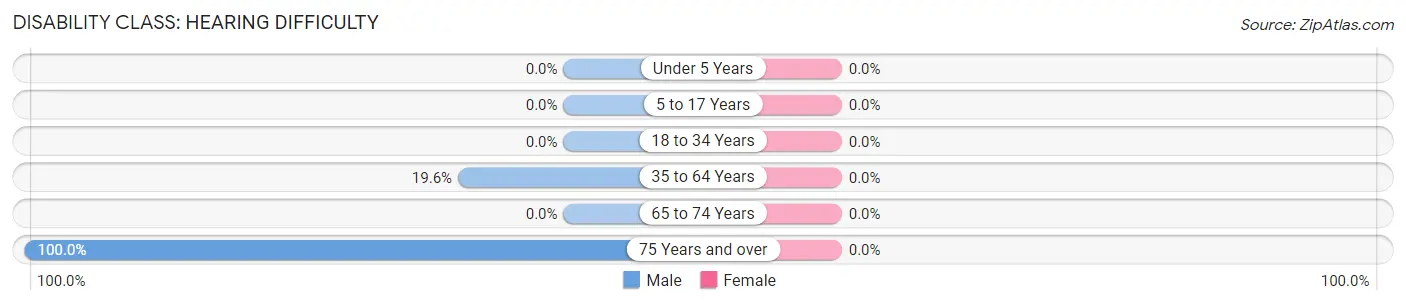
| Age Bracket | Male | Female |
| Under 5 Years | 0 (0.0%) | 0 (0.0%) |
| 5 to 17 Years | 0 (0.0%) | 0 (0.0%) |
| 18 to 34 Years | 0 (0.0%) | 0 (0.0%) |
| 35 to 64 Years | 9 (19.6%) | 0 (0.0%) |
| 65 to 74 Years | 0 (0.0%) | 0 (0.0%) |
| 75 Years and over | 11 (100.0%) | 0 (0.0%) |
Disability Class: Vision Difficulty
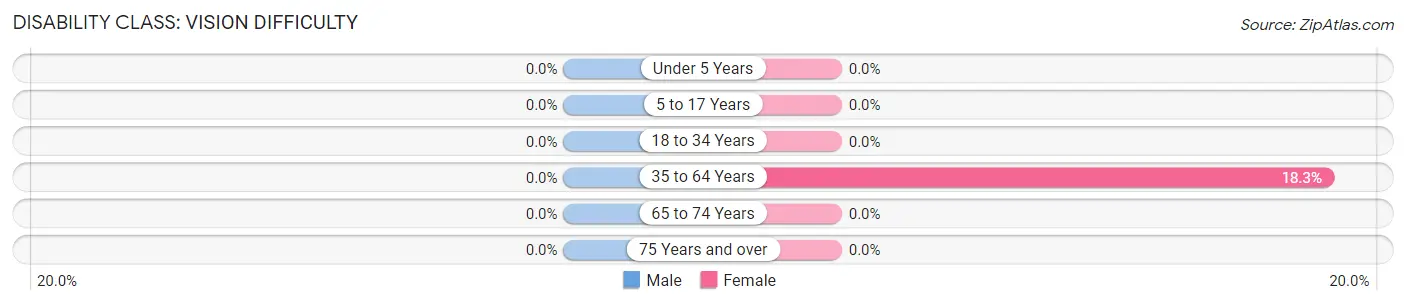
| Age Bracket | Male | Female |
| Under 5 Years | 0 (0.0%) | 0 (0.0%) |
| 5 to 17 Years | 0 (0.0%) | 0 (0.0%) |
| 18 to 34 Years | 0 (0.0%) | 0 (0.0%) |
| 35 to 64 Years | 0 (0.0%) | 21 (18.3%) |
| 65 to 74 Years | 0 (0.0%) | 0 (0.0%) |
| 75 Years and over | 0 (0.0%) | 0 (0.0%) |
Disability Class: Cognitive Difficulty
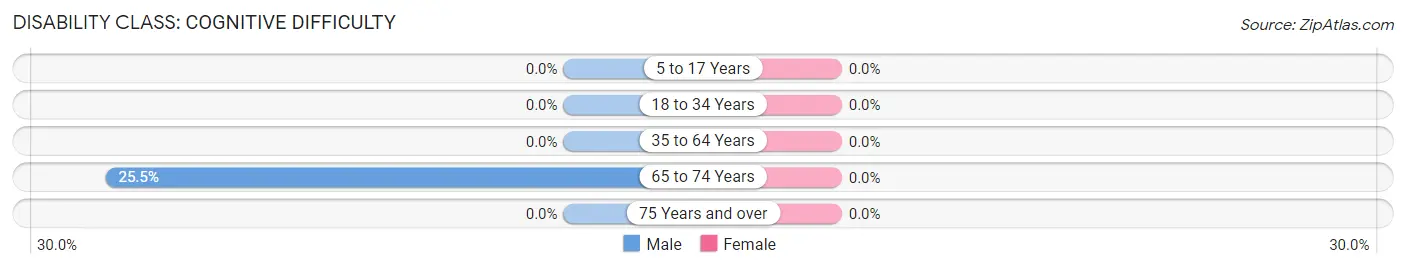
| Age Bracket | Male | Female |
| 5 to 17 Years | 0 (0.0%) | 0 (0.0%) |
| 18 to 34 Years | 0 (0.0%) | 0 (0.0%) |
| 35 to 64 Years | 0 (0.0%) | 0 (0.0%) |
| 65 to 74 Years | 13 (25.5%) | 0 (0.0%) |
| 75 Years and over | 0 (0.0%) | 0 (0.0%) |
Disability Class: Ambulatory Difficulty
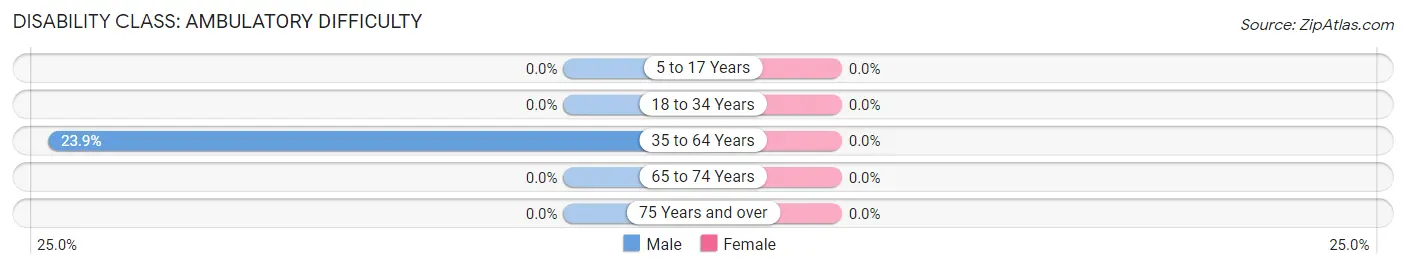
| Age Bracket | Male | Female |
| 5 to 17 Years | 0 (0.0%) | 0 (0.0%) |
| 18 to 34 Years | 0 (0.0%) | 0 (0.0%) |
| 35 to 64 Years | 11 (23.9%) | 0 (0.0%) |
| 65 to 74 Years | 0 (0.0%) | 0 (0.0%) |
| 75 Years and over | 0 (0.0%) | 0 (0.0%) |
Disability Class: Self-Care Difficulty
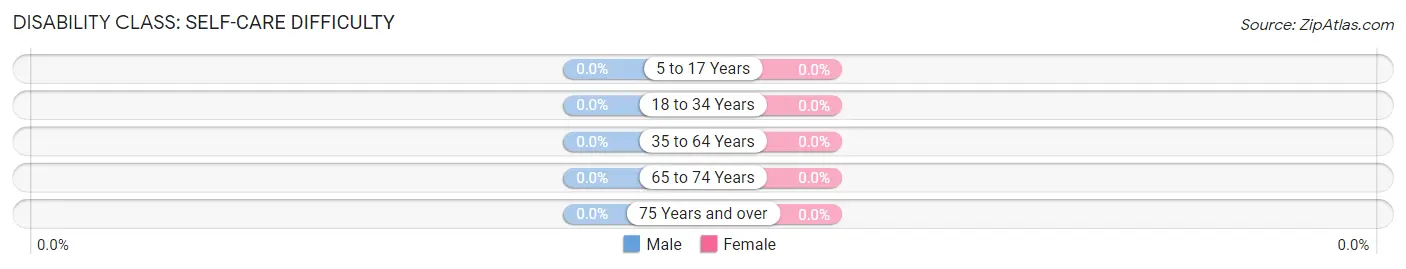
| Age Bracket | Male | Female |
| 5 to 17 Years | 0 (0.0%) | 0 (0.0%) |
| 18 to 34 Years | 0 (0.0%) | 0 (0.0%) |
| 35 to 64 Years | 0 (0.0%) | 0 (0.0%) |
| 65 to 74 Years | 0 (0.0%) | 0 (0.0%) |
| 75 Years and over | 0 (0.0%) | 0 (0.0%) |
Technology Access in Kila
Computing Device Access in Kila
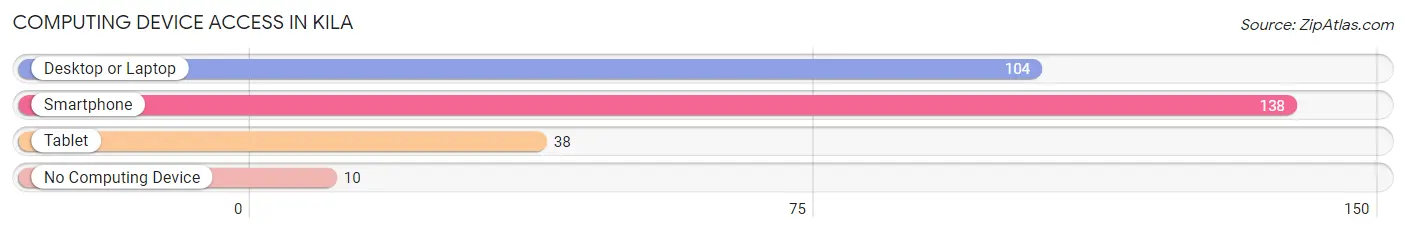
| Device Type | # Households | % Households |
| Desktop or Laptop | 104 | 65.4% |
| Smartphone | 138 | 86.8% |
| Tablet | 38 | 23.9% |
| No Computing Device | 10 | 6.3% |
| Total | 159 | 100.0% |
Internet Access in Kila
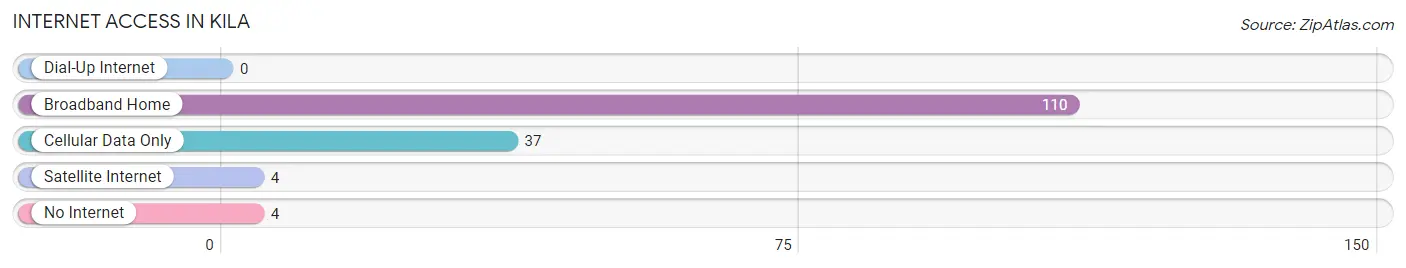
| Internet Type | # Households | % Households |
| Dial-Up Internet | 0 | 0.0% |
| Broadband Home | 110 | 69.2% |
| Cellular Data Only | 37 | 23.3% |
| Satellite Internet | 4 | 2.5% |
| No Internet | 4 | 2.5% |
| Total | 159 | 100.0% |
Kila Summary
Kila, Montana is a small town located in Flathead County, Montana. It is situated in the Flathead Valley, which is a large agricultural area in the northwestern part of the state. The town has a population of approximately 1,000 people and is located about 20 miles north of Kalispell, the county seat.
Kila was founded in 1891 by a group of homesteaders who were looking for a place to settle and start a new life. The town was named after the Kila River, which runs through the area. The town was originally a farming community, but over the years it has become a popular tourist destination due to its proximity to Glacier National Park and Flathead Lake.
Geographically, Kila is located in the Rocky Mountains and is surrounded by mountains and forests. The town is situated at an elevation of 3,400 feet and is located in a valley surrounded by the Swan, Whitefish, and Flathead Mountains. The climate in Kila is generally mild, with temperatures ranging from the low 30s in the winter to the high 80s in the summer.
The economy of Kila is largely based on tourism and agriculture. The town is home to several small businesses, including restaurants, shops, and lodging. The town also has a small airport, which serves as a gateway to Glacier National Park and other nearby attractions.
The demographics of Kila are largely white, with a small percentage of Native Americans and other minorities. The median household income in Kila is approximately $45,000, which is slightly lower than the state average. The town has a low unemployment rate and a high rate of home ownership.
Kila is a small town with a rich history and a vibrant culture. It is a great place to visit and explore, and it offers a variety of activities for visitors of all ages. From its scenic beauty to its friendly people, Kila is a great place to call home.
Common Questions
What is Per Capita Income in Kila?
Per Capita income in Kila is $30,315.
What is the Median Family Income in Kila?
Median Family Income in Kila is $112,614.
What is Inequality or Gini Index in Kila?
Inequality or Gini Index in Kila is 0.33.
What is the Total Population of Kila?
Total Population of Kila is 440.
What is the Total Male Population of Kila?
Total Male Population of Kila is 171.
What is the Total Female Population of Kila?
Total Female Population of Kila is 269.
What is the Ratio of Males per 100 Females in Kila?
There are 63.57 Males per 100 Females in Kila.
What is the Ratio of Females per 100 Males in Kila?
There are 157.31 Females per 100 Males in Kila.
What is the Median Population Age in Kila?
Median Population Age in Kila is 41.3 Years.
What is the Average Family Size in Kila
Average Family Size in Kila is 3.2 People.
What is the Average Household Size in Kila
Average Household Size in Kila is 2.8 People.
How Large is the Labor Force in Kila?
There are 208 People in the Labor Forcein in Kila.
What is the Percentage of People in the Labor Force in Kila?
62.5% of People are in the Labor Force in Kila.
What is the Unemployment Rate in Kila?
Unemployment Rate in Kila is 1.9%.