Jefferson City, MT Map & Demographics
Jefferson City Map
Jefferson City Overview
$34,970
PER CAPITA INCOME
$109,318
AVG FAMILY INCOME
0.32
INEQUALITY / GINI INDEX
480
TOTAL POPULATION
260
MALE POPULATION
220
FEMALE POPULATION
118.18
MALES / 100 FEMALES
84.62
FEMALES / 100 MALES
38.5
MEDIAN AGE
3.4
AVG FAMILY SIZE
2.7
AVG HOUSEHOLD SIZE
167
LABOR FORCE [ PEOPLE ]
49.4%
PERCENT IN LABOR FORCE
Jefferson City Zip Codes
Jefferson City Area Codes
Income in Jefferson City
Income Overview in Jefferson City
| Characteristic | Number | Measure |
| Per Capita Income | 480 | $34,970 |
| Median Family Income | 124 | $109,318 |
| Mean Family Income | 124 | $117,140 |
| Median Household Income | 175 | $0 |
| Mean Household Income | 175 | $96,403 |
| Income Deficit | 124 | $0 |
| Wage / Income Gap (%) | 480 | 0.00% |
| Wage / Income Gap ($) | 480 | 100.00¢ per $1 |
| Gini / Inequality Index | 480 | 0.32 |
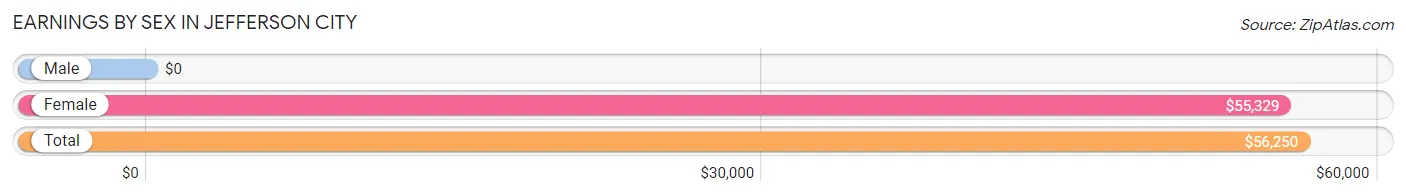
Earnings by Sex in Jefferson City
| Sex | Number | Average Earnings |
| Male | 104 (55.6%) | $0 |
| Female | 83 (44.4%) | $55,329 |
| Total | 187 (100.0%) | $56,250 |
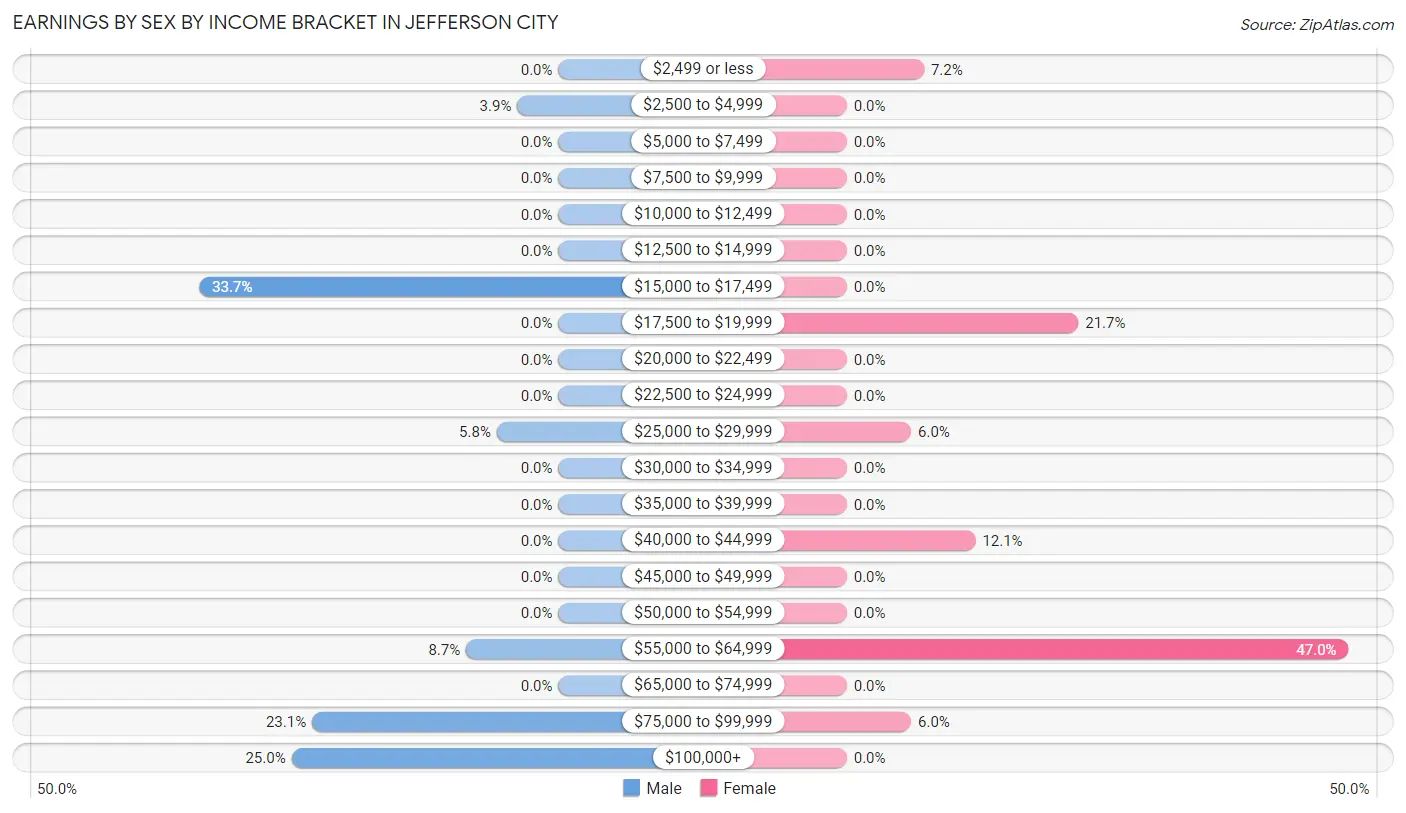
Earnings by Sex by Income Bracket in Jefferson City
The most common earnings brackets in Jefferson City are $15,000 to $17,499 for men (35 | 33.7%) and $55,000 to $64,999 for women (39 | 47.0%).
| Income | Male | Female |
| $2,499 or less | 0 (0.0%) | 6 (7.2%) |
| $2,500 to $4,999 | 4 (3.8%) | 0 (0.0%) |
| $5,000 to $7,499 | 0 (0.0%) | 0 (0.0%) |
| $7,500 to $9,999 | 0 (0.0%) | 0 (0.0%) |
| $10,000 to $12,499 | 0 (0.0%) | 0 (0.0%) |
| $12,500 to $14,999 | 0 (0.0%) | 0 (0.0%) |
| $15,000 to $17,499 | 35 (33.7%) | 0 (0.0%) |
| $17,500 to $19,999 | 0 (0.0%) | 18 (21.7%) |
| $20,000 to $22,499 | 0 (0.0%) | 0 (0.0%) |
| $22,500 to $24,999 | 0 (0.0%) | 0 (0.0%) |
| $25,000 to $29,999 | 6 (5.8%) | 5 (6.0%) |
| $30,000 to $34,999 | 0 (0.0%) | 0 (0.0%) |
| $35,000 to $39,999 | 0 (0.0%) | 0 (0.0%) |
| $40,000 to $44,999 | 0 (0.0%) | 10 (12.0%) |
| $45,000 to $49,999 | 0 (0.0%) | 0 (0.0%) |
| $50,000 to $54,999 | 0 (0.0%) | 0 (0.0%) |
| $55,000 to $64,999 | 9 (8.6%) | 39 (47.0%) |
| $65,000 to $74,999 | 0 (0.0%) | 0 (0.0%) |
| $75,000 to $99,999 | 24 (23.1%) | 5 (6.0%) |
| $100,000+ | 26 (25.0%) | 0 (0.0%) |
| Total | 104 (100.0%) | 83 (100.0%) |
Earnings by Sex by Educational Attainment in Jefferson City
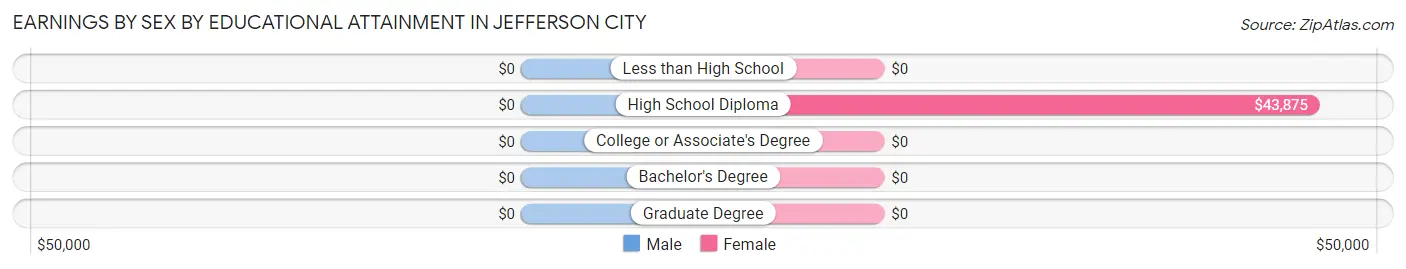
| Educational Attainment | Male Income | Female Income |
| Less than High School | - | - |
| High School Diploma | - | - |
| College or Associate's Degree | - | - |
| Bachelor's Degree | - | - |
| Graduate Degree | - | - |
| Total | - | - |
Family Income in Jefferson City
Family Income Brackets in Jefferson City
According to the Jefferson City family income data, there are 51 families falling into the $100,000 to $149,999 income range, which is the most common income bracket and makes up 41.1% of all families.
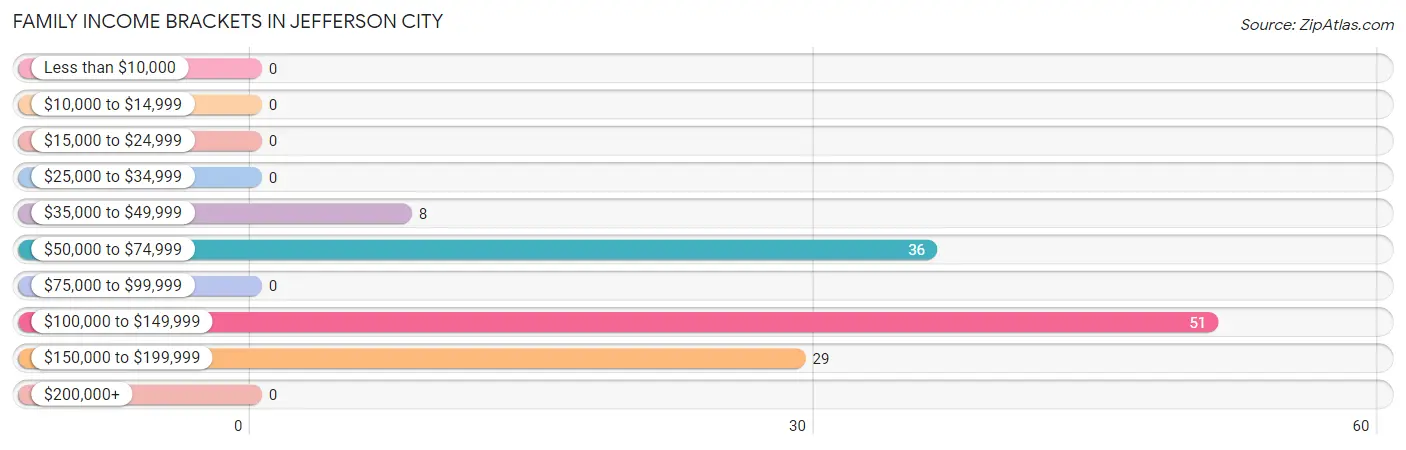
| Income Bracket | # Families | % Families |
| Less than $10,000 | 0 | 0.0% |
| $10,000 to $14,999 | 0 | 0.0% |
| $15,000 to $24,999 | 0 | 0.0% |
| $25,000 to $34,999 | 0 | 0.0% |
| $35,000 to $49,999 | 8 | 6.5% |
| $50,000 to $74,999 | 36 | 29.0% |
| $75,000 to $99,999 | 0 | 0.0% |
| $100,000 to $149,999 | 51 | 41.1% |
| $150,000 to $199,999 | 29 | 23.4% |
| $200,000+ | 0 | 0.0% |
Family Income by Famaliy Size in Jefferson City
2-person families (63 | 50.8%) account for the highest median family income in Jefferson City with $108,295 per family, while 2-person families (63 | 50.8%) have the highest median income of $54,148 per family member.
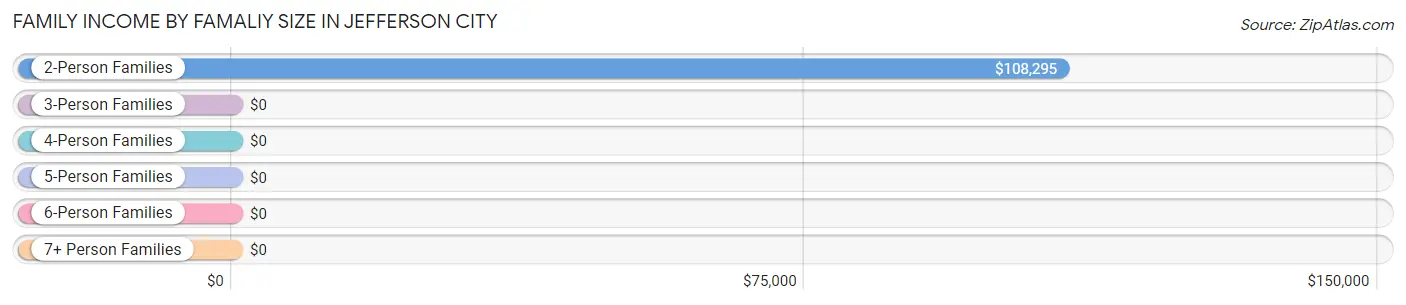
| Income Bracket | # Families | Median Income |
| 2-Person Families | 63 (50.8%) | $108,295 |
| 3-Person Families | 11 (8.9%) | $0 |
| 4-Person Families | 28 (22.6%) | $0 |
| 5-Person Families | 2 (1.6%) | $0 |
| 6-Person Families | 0 (0.0%) | $0 |
| 7+ Person Families | 20 (16.1%) | $0 |
| Total | 124 (100.0%) | $109,318 |
Family Income by Number of Earners in Jefferson City
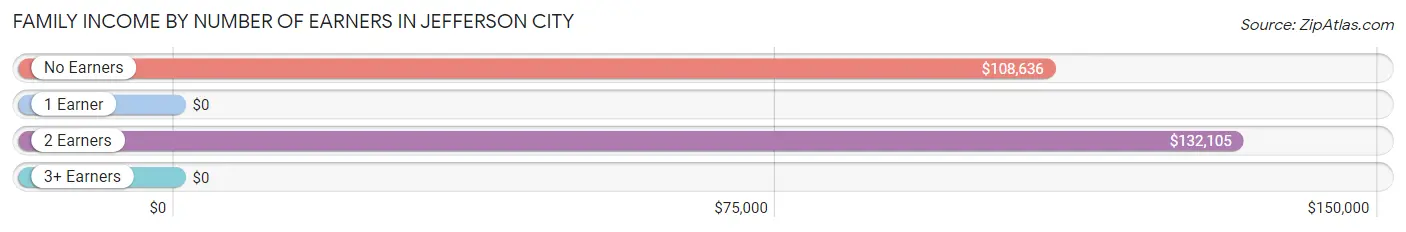
| Number of Earners | # Families | Median Income |
| No Earners | 34 (27.4%) | $108,636 |
| 1 Earner | 26 (21.0%) | $0 |
| 2 Earners | 64 (51.6%) | $132,105 |
| 3+ Earners | 0 (0.0%) | $0 |
| Total | 124 (100.0%) | $109,318 |
Household Income in Jefferson City
Household Income Brackets in Jefferson City
With 57 households falling in the category, the $100,000 to $149,999 income range is the most frequent in Jefferson City, accounting for 32.6% of all households.
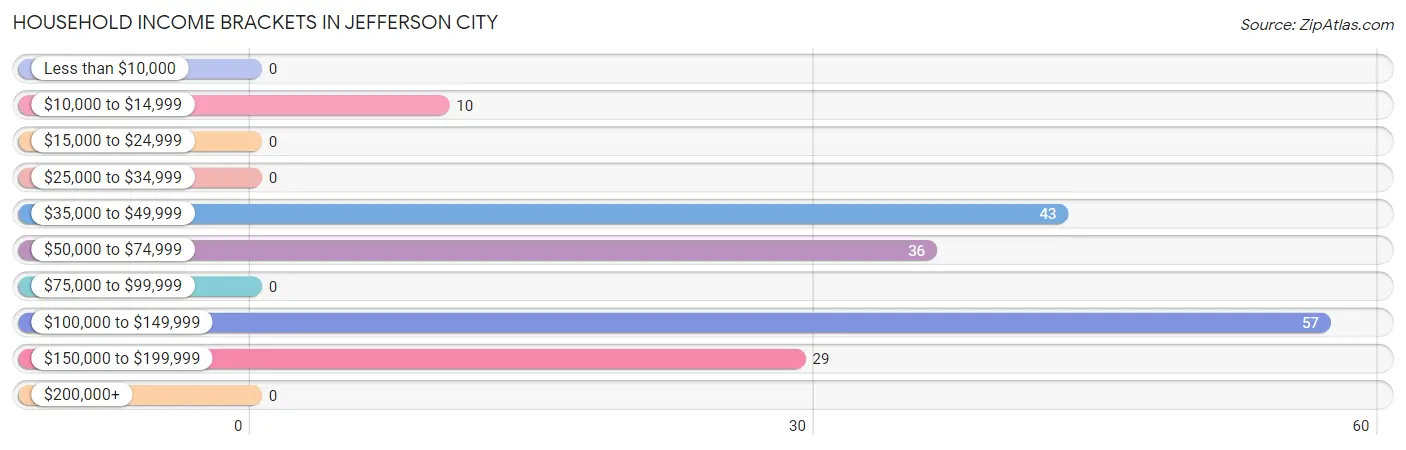
| Income Bracket | # Households | % Households |
| Less than $10,000 | 0 | 0.0% |
| $10,000 to $14,999 | 10 | 5.7% |
| $15,000 to $24,999 | 0 | 0.0% |
| $25,000 to $34,999 | 0 | 0.0% |
| $35,000 to $49,999 | 43 | 24.6% |
| $50,000 to $74,999 | 36 | 20.6% |
| $75,000 to $99,999 | 0 | 0.0% |
| $100,000 to $149,999 | 57 | 32.6% |
| $150,000 to $199,999 | 29 | 16.6% |
| $200,000+ | 0 | 0.0% |
Household Income by Householder Age in Jefferson City
The median household income in Jefferson City is $0, with the highest median household income of $198,295 found in the 25 to 44 years age bracket for the primary householder. A total of 30 households (17.1%) fall into this category.
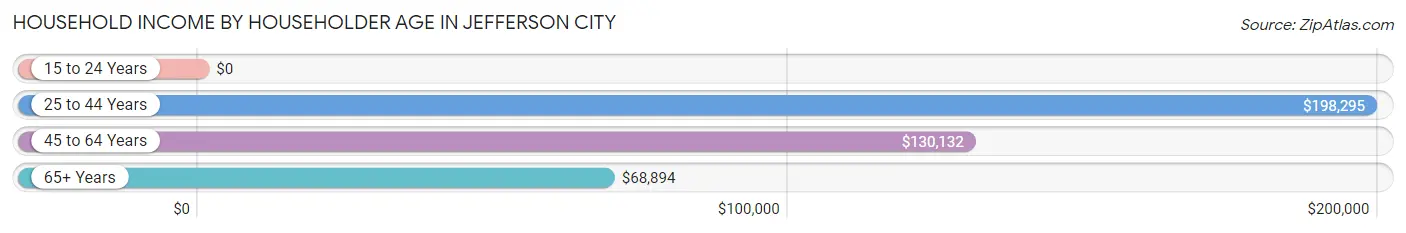
| Income Bracket | # Households | Median Income |
| 15 to 24 Years | 0 (0.0%) | $0 |
| 25 to 44 Years | 30 (17.1%) | $198,295 |
| 45 to 64 Years | 46 (26.3%) | $130,132 |
| 65+ Years | 99 (56.6%) | $68,894 |
| Total | 175 (100.0%) | $0 |
Poverty in Jefferson City
Income Below Poverty by Sex and Age in Jefferson City
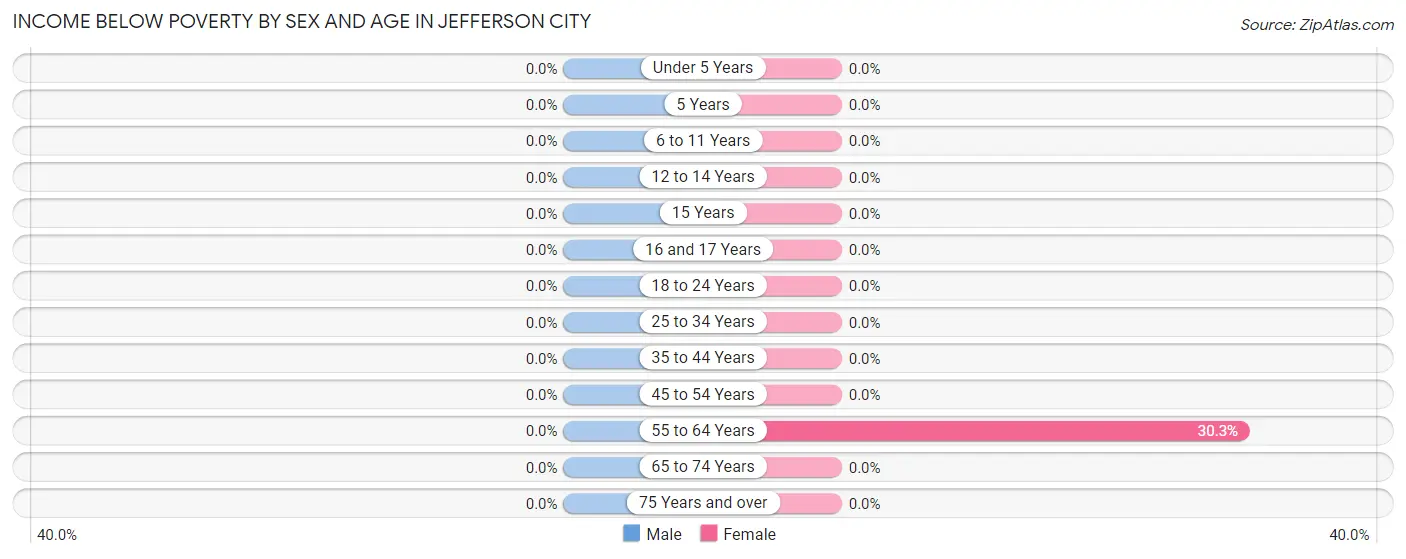
| Age Bracket | Male | Female |
| Under 5 Years | 0 (0.0%) | 0 (0.0%) |
| 5 Years | 0 (0.0%) | 0 (0.0%) |
| 6 to 11 Years | 0 (0.0%) | 0 (0.0%) |
| 12 to 14 Years | 0 (0.0%) | 0 (0.0%) |
| 15 Years | 0 (0.0%) | 0 (0.0%) |
| 16 and 17 Years | 0 (0.0%) | 0 (0.0%) |
| 18 to 24 Years | 0 (0.0%) | 0 (0.0%) |
| 25 to 34 Years | 0 (0.0%) | 0 (0.0%) |
| 35 to 44 Years | 0 (0.0%) | 0 (0.0%) |
| 45 to 54 Years | 0 (0.0%) | 0 (0.0%) |
| 55 to 64 Years | 0 (0.0%) | 10 (30.3%) |
| 65 to 74 Years | 0 (0.0%) | 0 (0.0%) |
| 75 Years and over | 0 (0.0%) | 0 (0.0%) |
| Total | 0 (0.0%) | 10 (4.5%) |
Income Above Poverty by Sex and Age in Jefferson City
According to the poverty statistics in Jefferson City, males aged under 5 years and females aged 6 to 11 years are the age groups that are most secure financially, with 100.0% of males and 100.0% of females in these age groups living above the poverty line.
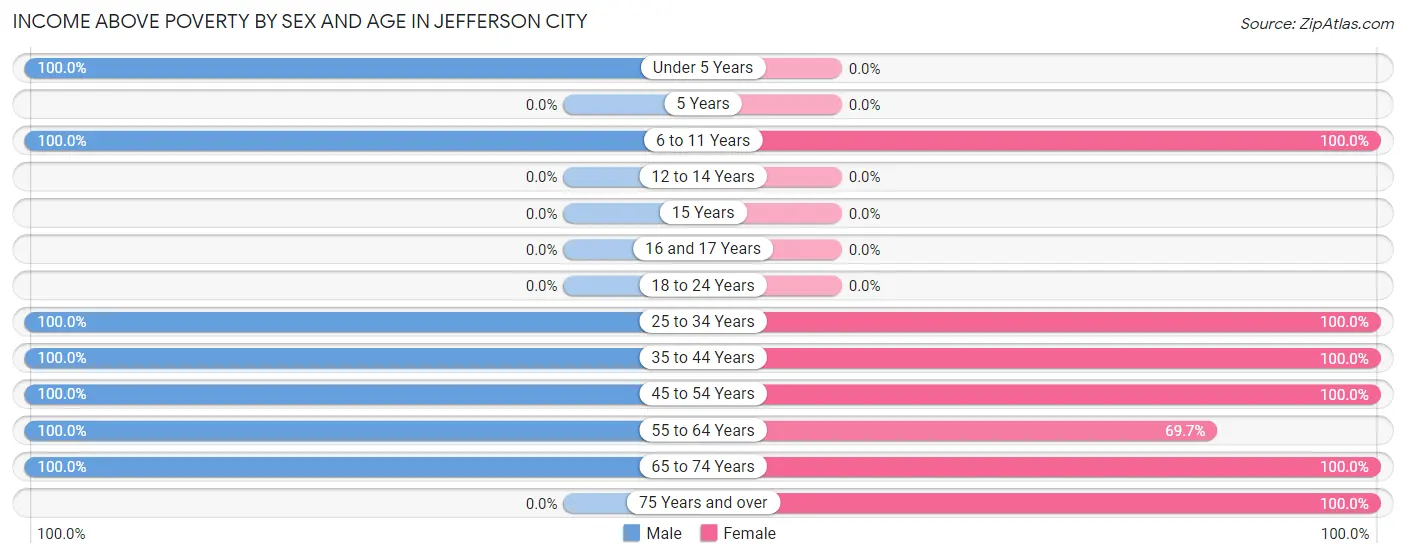
| Age Bracket | Male | Female |
| Under 5 Years | 18 (100.0%) | 0 (0.0%) |
| 5 Years | 0 (0.0%) | 0 (0.0%) |
| 6 to 11 Years | 66 (100.0%) | 58 (100.0%) |
| 12 to 14 Years | 0 (0.0%) | 0 (0.0%) |
| 15 Years | 0 (0.0%) | 0 (0.0%) |
| 16 and 17 Years | 0 (0.0%) | 0 (0.0%) |
| 18 to 24 Years | 0 (0.0%) | 0 (0.0%) |
| 25 to 34 Years | 33 (100.0%) | 33 (100.0%) |
| 35 to 44 Years | 22 (100.0%) | 20 (100.0%) |
| 45 to 54 Years | 28 (100.0%) | 29 (100.0%) |
| 55 to 64 Years | 5 (100.0%) | 23 (69.7%) |
| 65 to 74 Years | 88 (100.0%) | 41 (100.0%) |
| 75 Years and over | 0 (0.0%) | 6 (100.0%) |
| Total | 260 (100.0%) | 210 (95.5%) |
Income Below Poverty Among Married-Couple Families in Jefferson City
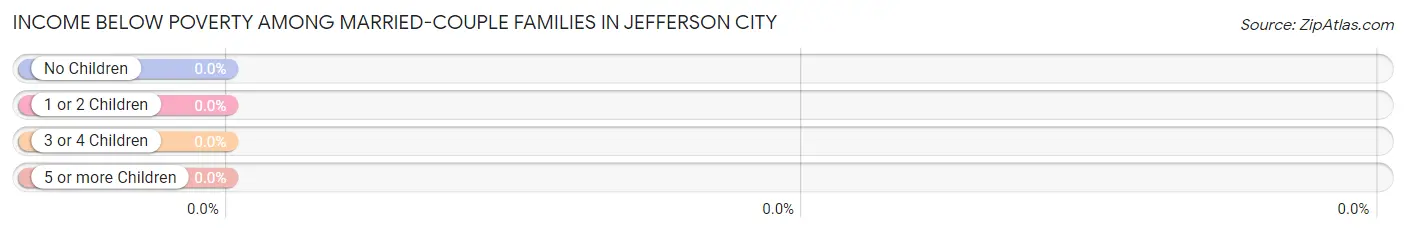
| Children | Above Poverty | Below Poverty |
| No Children | 74 (100.0%) | 0 (0.0%) |
| 1 or 2 Children | 30 (100.0%) | 0 (0.0%) |
| 3 or 4 Children | 20 (100.0%) | 0 (0.0%) |
| 5 or more Children | 0 (0.0%) | 0 (0.0%) |
| Total | 124 (100.0%) | 0 (0.0%) |
Income Below Poverty Among Single-Parent Households in Jefferson City
| Children | Single Father | Single Mother |
| No Children | 0 (0.0%) | 0 (0.0%) |
| 1 or 2 Children | 0 (0.0%) | 0 (0.0%) |
| 3 or 4 Children | 0 (0.0%) | 0 (0.0%) |
| 5 or more Children | 0 (0.0%) | 0 (0.0%) |
| Total | 0 (0.0%) | 0 (0.0%) |
Income Below Poverty Among Married-Couple vs Single-Parent Households in Jefferson City
| Children | Married-Couple Families | Single-Parent Households |
| No Children | 0 (0.0%) | 0 (0.0%) |
| 1 or 2 Children | 0 (0.0%) | 0 (0.0%) |
| 3 or 4 Children | 0 (0.0%) | 0 (0.0%) |
| 5 or more Children | 0 (0.0%) | 0 (0.0%) |
| Total | 0 (0.0%) | 0 (0.0%) |
Race in Jefferson City
The most populous races in Jefferson City are White / Caucasian (460 | 95.8%), Two or more Races (20 | 4.2%), and Hispanic or Latino (10 | 2.1%).
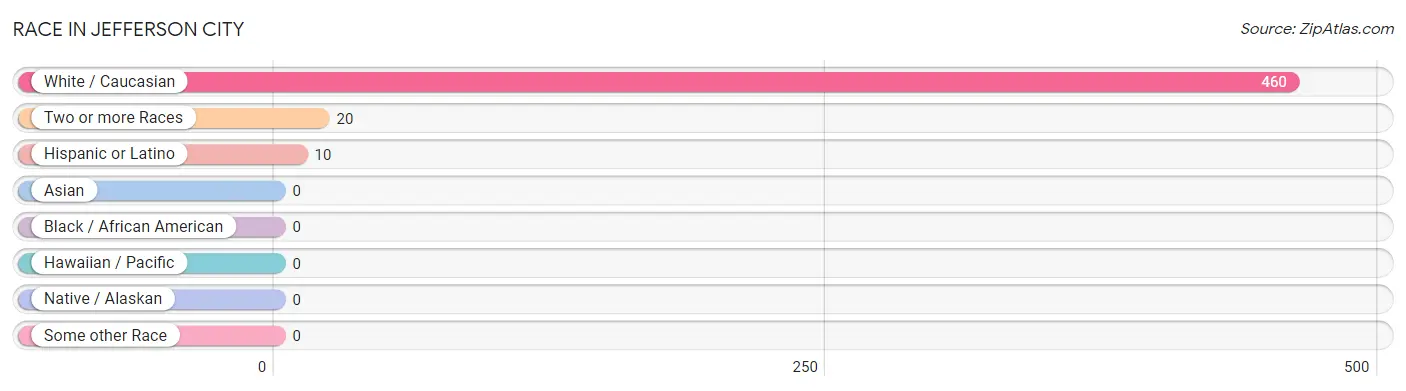
| Race | # Population | % Population |
| Asian | 0 | 0.0% |
| Black / African American | 0 | 0.0% |
| Hawaiian / Pacific | 0 | 0.0% |
| Hispanic or Latino | 10 | 2.1% |
| Native / Alaskan | 0 | 0.0% |
| White / Caucasian | 460 | 95.8% |
| Two or more Races | 20 | 4.2% |
| Some other Race | 0 | 0.0% |
| Total | 480 | 100.0% |
Ancestry in Jefferson City
The most populous ancestries reported in Jefferson City are English (161 | 33.5%), Scottish (150 | 31.2%), Danish (105 | 21.9%), German (97 | 20.2%), and Russian (69 | 14.4%), together accounting for 121.3% of all Jefferson City residents.
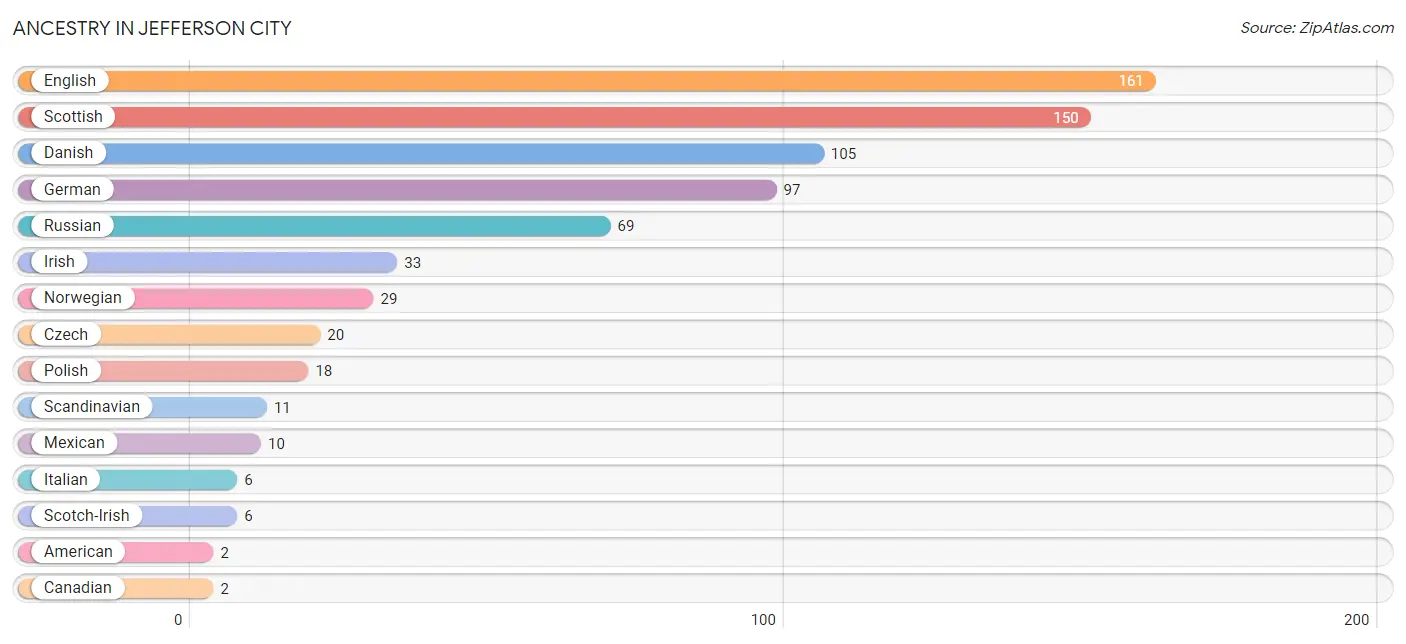
| Ancestry | # Population | % Population |
| American | 2 | 0.4% |
| Canadian | 2 | 0.4% |
| Czech | 20 | 4.2% |
| Danish | 105 | 21.9% |
| English | 161 | 33.5% |
| German | 97 | 20.2% |
| Irish | 33 | 6.9% |
| Italian | 6 | 1.3% |
| Mexican | 10 | 2.1% |
| Norwegian | 29 | 6.0% |
| Polish | 18 | 3.7% |
| Russian | 69 | 14.4% |
| Scandinavian | 11 | 2.3% |
| Scotch-Irish | 6 | 1.3% |
| Scottish | 150 | 31.2% | View All 15 Rows |
Immigrants in Jefferson City
The most numerous immigrant groups reported in Jefferson City came from , and Canada (2 | 0.4%), together accounting for 0.4% of all Jefferson City residents.

| Immigration Origin | # Population | % Population |
| Canada | 2 | 0.4% | View All 1 Rows |
Sex and Age in Jefferson City
Sex and Age in Jefferson City
The most populous age groups in Jefferson City are 65 to 69 Years (76 | 29.2%) for men and 5 to 9 Years (35 | 15.9%) for women.
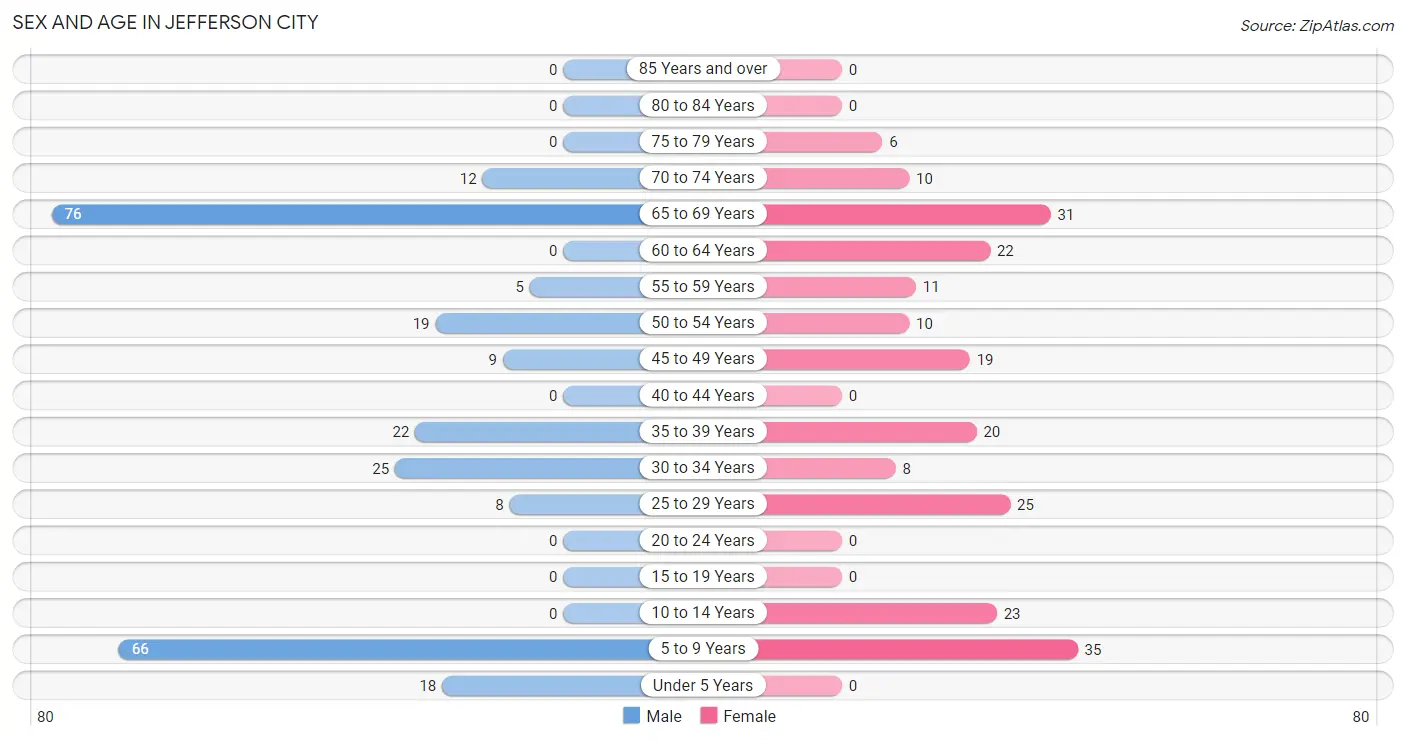
| Age Bracket | Male | Female |
| Under 5 Years | 18 (6.9%) | 0 (0.0%) |
| 5 to 9 Years | 66 (25.4%) | 35 (15.9%) |
| 10 to 14 Years | 0 (0.0%) | 23 (10.4%) |
| 15 to 19 Years | 0 (0.0%) | 0 (0.0%) |
| 20 to 24 Years | 0 (0.0%) | 0 (0.0%) |
| 25 to 29 Years | 8 (3.1%) | 25 (11.4%) |
| 30 to 34 Years | 25 (9.6%) | 8 (3.6%) |
| 35 to 39 Years | 22 (8.5%) | 20 (9.1%) |
| 40 to 44 Years | 0 (0.0%) | 0 (0.0%) |
| 45 to 49 Years | 9 (3.5%) | 19 (8.6%) |
| 50 to 54 Years | 19 (7.3%) | 10 (4.5%) |
| 55 to 59 Years | 5 (1.9%) | 11 (5.0%) |
| 60 to 64 Years | 0 (0.0%) | 22 (10.0%) |
| 65 to 69 Years | 76 (29.2%) | 31 (14.1%) |
| 70 to 74 Years | 12 (4.6%) | 10 (4.5%) |
| 75 to 79 Years | 0 (0.0%) | 6 (2.7%) |
| 80 to 84 Years | 0 (0.0%) | 0 (0.0%) |
| 85 Years and over | 0 (0.0%) | 0 (0.0%) |
| Total | 260 (100.0%) | 220 (100.0%) |
Families and Households in Jefferson City
Median Family Size in Jefferson City
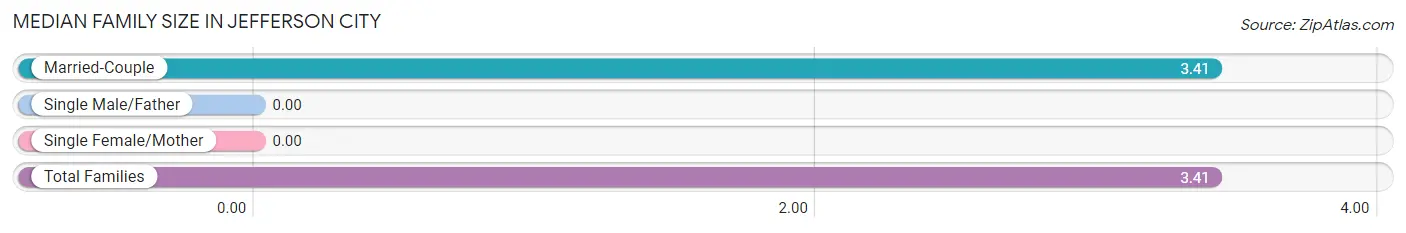
| Family Type | # Families | Family Size |
| Married-Couple | 124 (100.0%) | 3.41 |
| Single Male/Father | 0 (0.0%) | - |
| Single Female/Mother | 0 (0.0%) | - |
| Total Families | 124 (100.0%) | 3.41 |
Median Household Size in Jefferson City
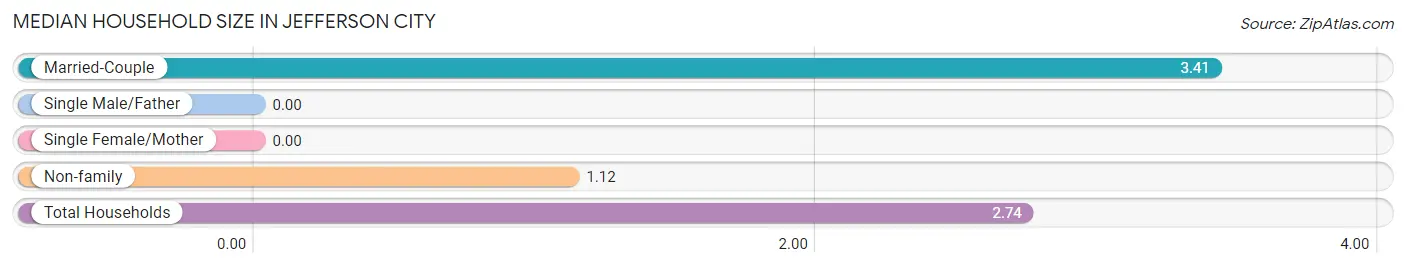
| Household Type | # Households | Household Size |
| Married-Couple | 124 (70.9%) | 3.41 |
| Single Male/Father | 0 (0.0%) | - |
| Single Female/Mother | 0 (0.0%) | - |
| Non-family | 51 (29.1%) | 1.12 |
| Total Households | 175 (100.0%) | 2.74 |
Household Size by Marriage Status in Jefferson City
Out of a total of 175 households in Jefferson City, 124 (70.9%) are family households, while 51 (29.1%) are nonfamily households. The most numerous type of family households are 2-person households, comprising 63, and the most common type of nonfamily households are 1-person households, comprising 45.
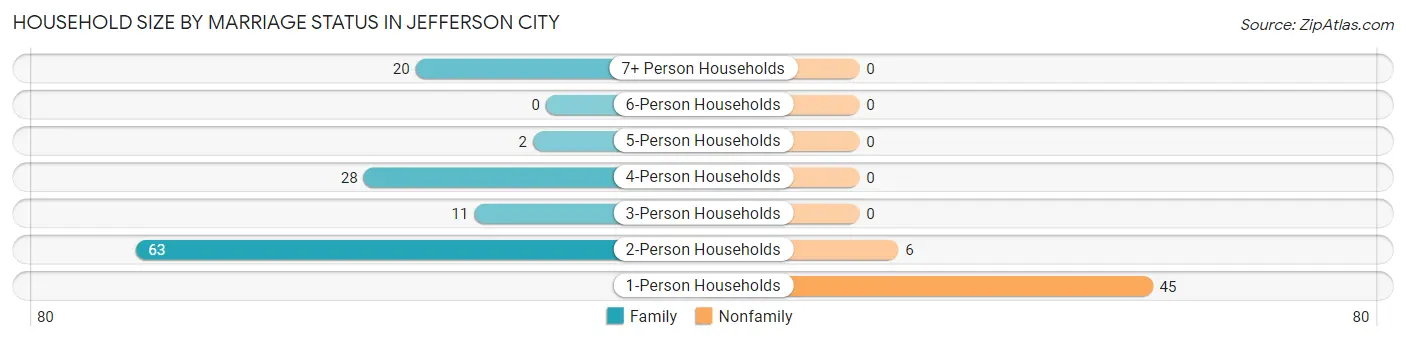
| Household Size | Family Households | Nonfamily Households |
| 1-Person Households | - | 45 (25.7%) |
| 2-Person Households | 63 (36.0%) | 6 (3.4%) |
| 3-Person Households | 11 (6.3%) | 0 (0.0%) |
| 4-Person Households | 28 (16.0%) | 0 (0.0%) |
| 5-Person Households | 2 (1.1%) | 0 (0.0%) |
| 6-Person Households | 0 (0.0%) | 0 (0.0%) |
| 7+ Person Households | 20 (11.4%) | 0 (0.0%) |
| Total | 124 (70.9%) | 51 (29.1%) |
Female Fertility in Jefferson City
Fertility by Age in Jefferson City
Average fertility rate in Jefferson City is 28.0 births per 1,000 women. Women in the age bracket of 20 to 34 years have the highest fertility rate with 61.0 births per 1,000 women. Women in the age bracket of 20 to 34 years acount for 100.0% of all women with births.
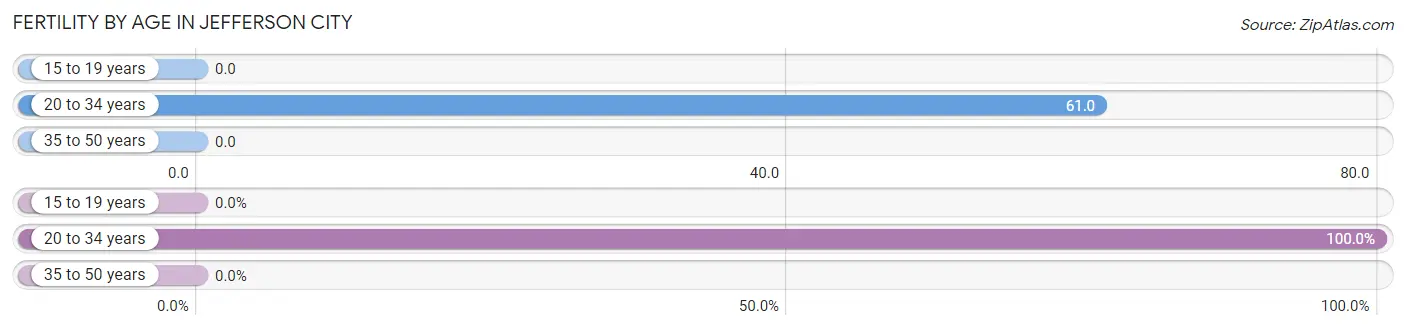
| Age Bracket | Women with Births | Births / 1,000 Women |
| 15 to 19 years | 0 (0.0%) | 0.0 |
| 20 to 34 years | 2 (100.0%) | 61.0 |
| 35 to 50 years | 0 (0.0%) | 0.0 |
| Total | 2 (100.0%) | 28.0 |
Fertility by Age by Marriage Status in Jefferson City
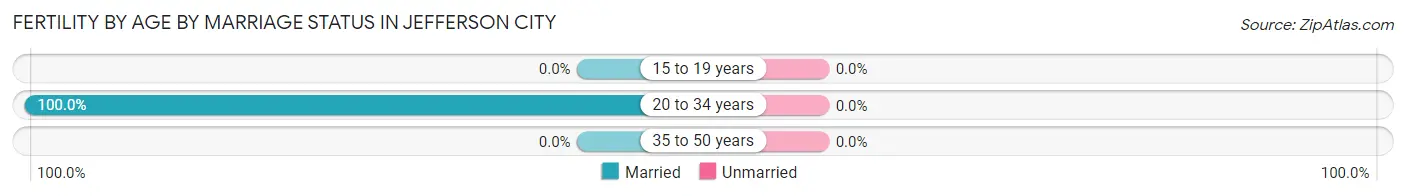
| Age Bracket | Married | Unmarried |
| 15 to 19 years | 0 (0.0%) | 0 (0.0%) |
| 20 to 34 years | 2 (100.0%) | 0 (0.0%) |
| 35 to 50 years | 0 (0.0%) | 0 (0.0%) |
| Total | 2 (100.0%) | 0 (0.0%) |
Fertility by Education in Jefferson City
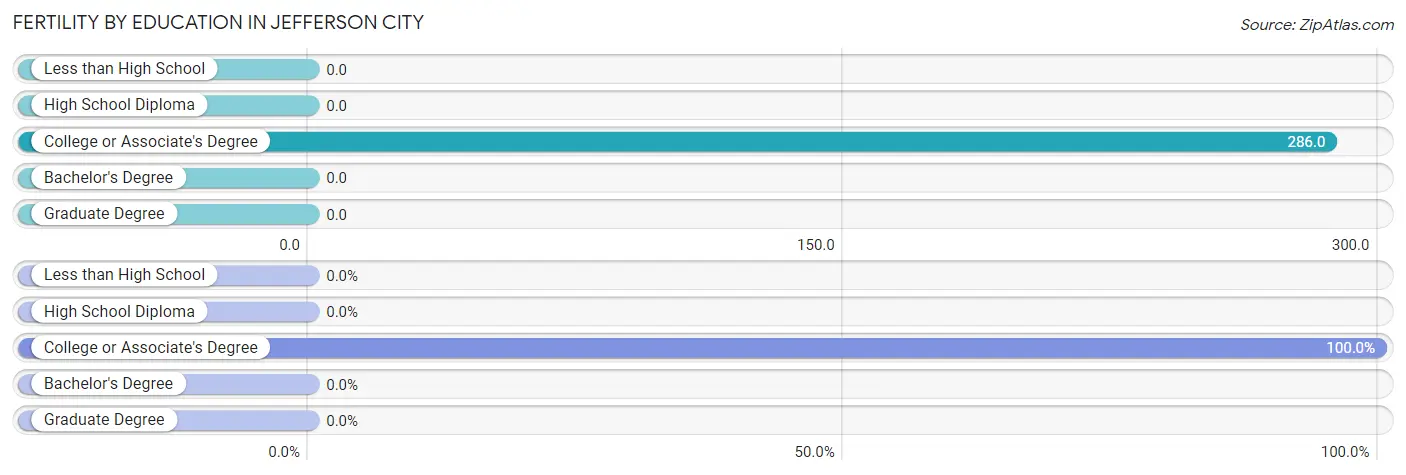
| Educational Attainment | Women with Births | Births / 1,000 Women |
| Less than High School | 0 (0.0%) | 0.0 |
| High School Diploma | 0 (0.0%) | 0.0 |
| College or Associate's Degree | 2 (100.0%) | 286.0 |
| Bachelor's Degree | 0 (0.0%) | 0.0 |
| Graduate Degree | 0 (0.0%) | 0.0 |
| Total | 2 (100.0%) | 28.0 |
Fertility by Education by Marriage Status in Jefferson City
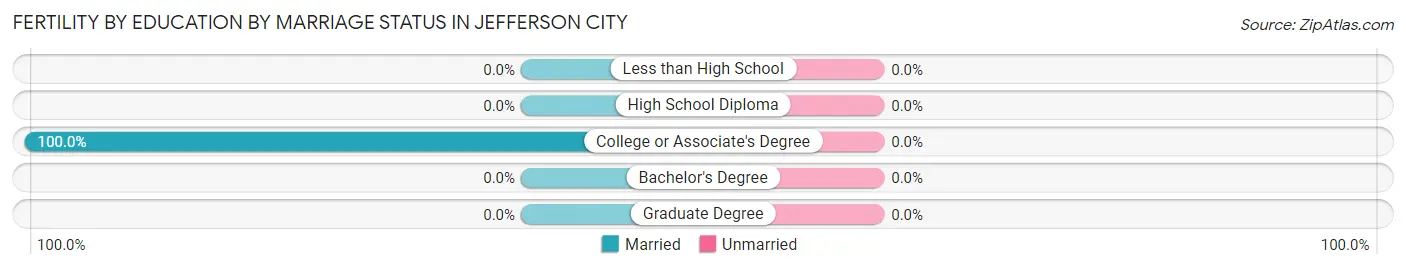
| Educational Attainment | Married | Unmarried |
| Less than High School | 0 (0.0%) | 0 (0.0%) |
| High School Diploma | 0 (0.0%) | 0 (0.0%) |
| College or Associate's Degree | 2 (100.0%) | 0 (0.0%) |
| Bachelor's Degree | 0 (0.0%) | 0 (0.0%) |
| Graduate Degree | 0 (0.0%) | 0 (0.0%) |
| Total | 2 (100.0%) | 0 (0.0%) |
Employment Characteristics in Jefferson City
Employment by Class of Employer in Jefferson City
Among the 165 employed individuals in Jefferson City, private company employees (84 | 50.9%), state government employees (32 | 19.4%), and self-employed (not incorporated) (19 | 11.5%) make up the most common classes of employment.
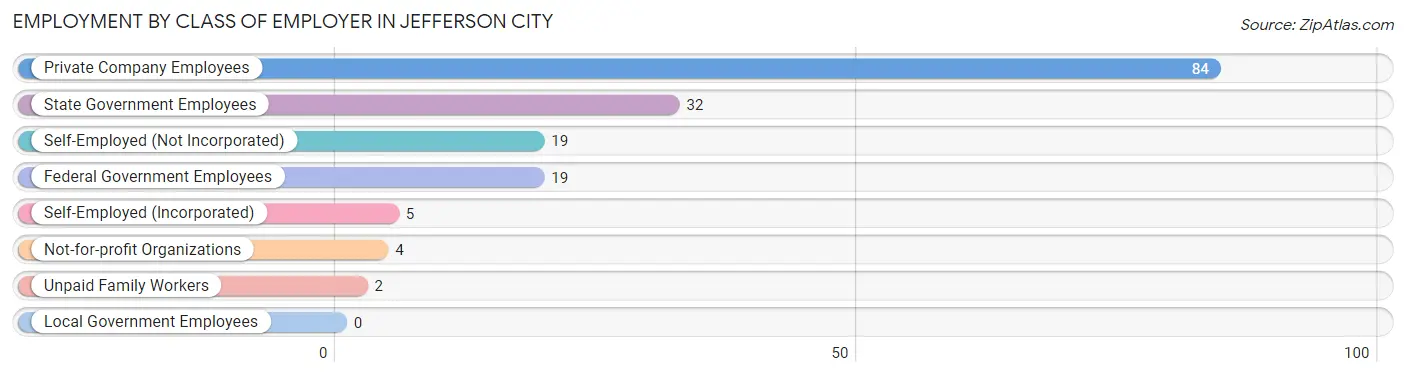
| Employer Class | # Employees | % Employees |
| Private Company Employees | 84 | 50.9% |
| Self-Employed (Incorporated) | 5 | 3.0% |
| Self-Employed (Not Incorporated) | 19 | 11.5% |
| Not-for-profit Organizations | 4 | 2.4% |
| Local Government Employees | 0 | 0.0% |
| State Government Employees | 32 | 19.4% |
| Federal Government Employees | 19 | 11.5% |
| Unpaid Family Workers | 2 | 1.2% |
| Total | 165 | 100.0% |
Employment Status by Age in Jefferson City
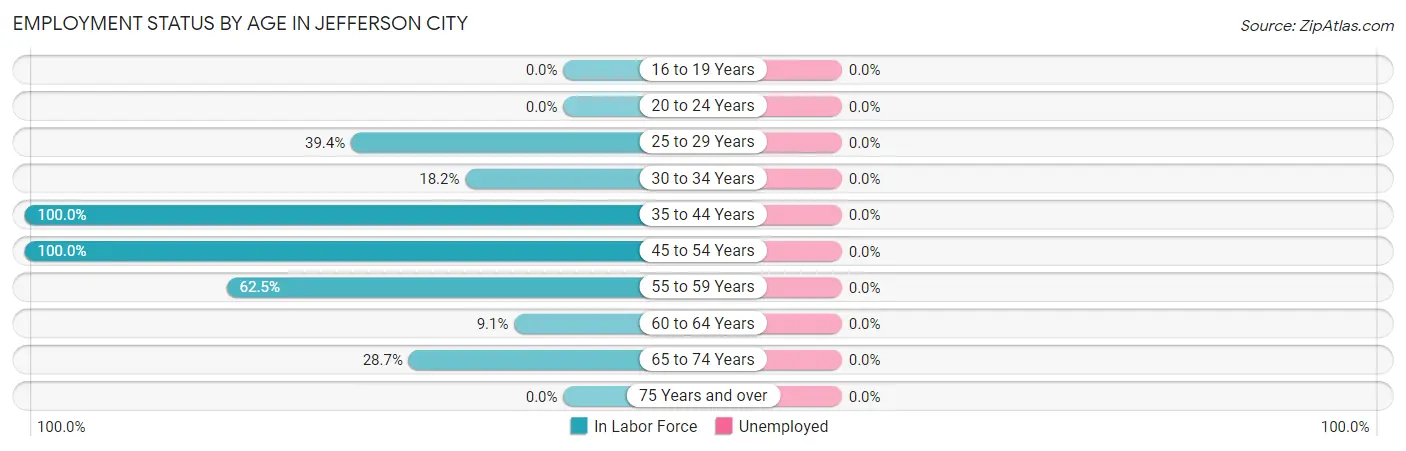
| Age Bracket | In Labor Force | Unemployed |
| 16 to 19 Years | 0 (0.0%) | 0 (0.0%) |
| 20 to 24 Years | 0 (0.0%) | 0 (0.0%) |
| 25 to 29 Years | 13 (39.4%) | 0 (0.0%) |
| 30 to 34 Years | 6 (18.2%) | 0 (0.0%) |
| 35 to 44 Years | 42 (100.0%) | 0 (0.0%) |
| 45 to 54 Years | 57 (100.0%) | 0 (0.0%) |
| 55 to 59 Years | 10 (62.5%) | 0 (0.0%) |
| 60 to 64 Years | 2 (9.1%) | 0 (0.0%) |
| 65 to 74 Years | 37 (28.7%) | 0 (0.0%) |
| 75 Years and over | 0 (0.0%) | 0 (0.0%) |
| Total | 167 (49.4%) | 0 (0.0%) |
Employment Status by Educational Attainment in Jefferson City
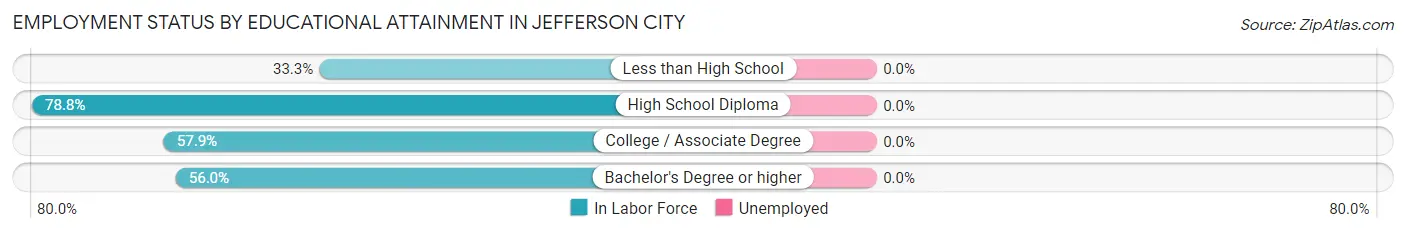
| Educational Attainment | In Labor Force | Unemployed |
| Less than High School | 5 (33.3%) | 0 (0.0%) |
| High School Diploma | 67 (78.8%) | 0 (0.0%) |
| College / Associate Degree | 11 (57.9%) | 0 (0.0%) |
| Bachelor's Degree or higher | 47 (56.0%) | 0 (0.0%) |
| Total | 130 (64.0%) | 0 (0.0%) |
Employment Occupations by Sex in Jefferson City
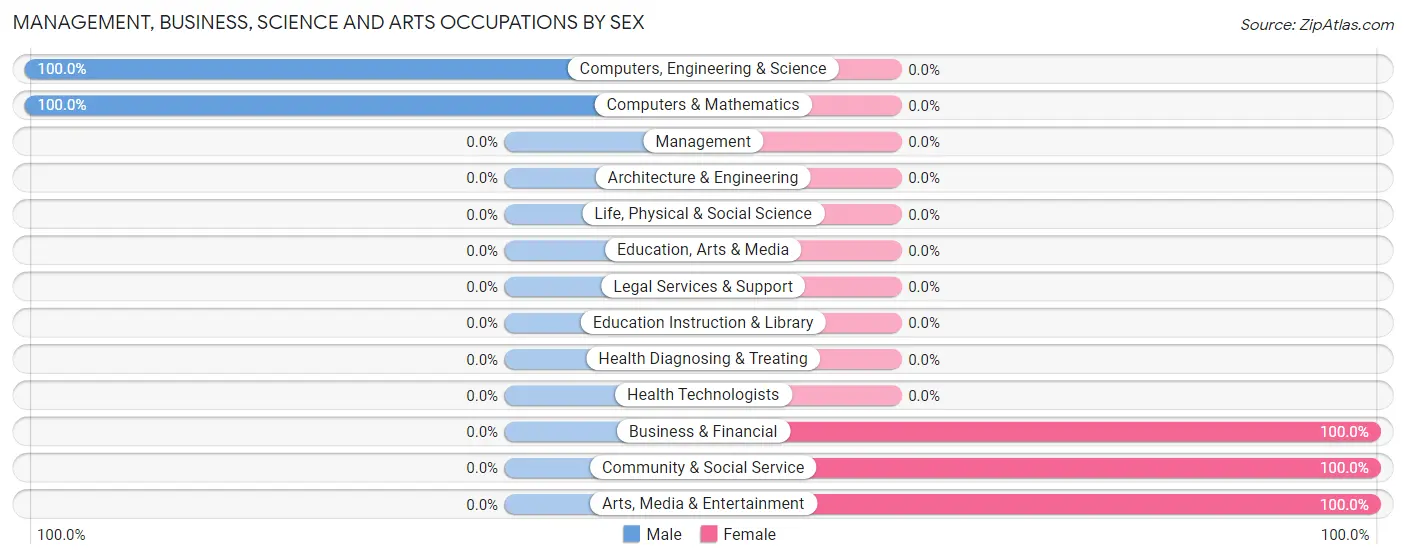
Management, Business, Science and Arts Occupations
The most common Management, Business, Science and Arts occupations in Jefferson City are Computers, Engineering & Science (22 | 13.2%), Computers & Mathematics (22 | 13.2%), Business & Financial (19 | 11.4%), Community & Social Service (5 | 3.0%), and Arts, Media & Entertainment (5 | 3.0%).
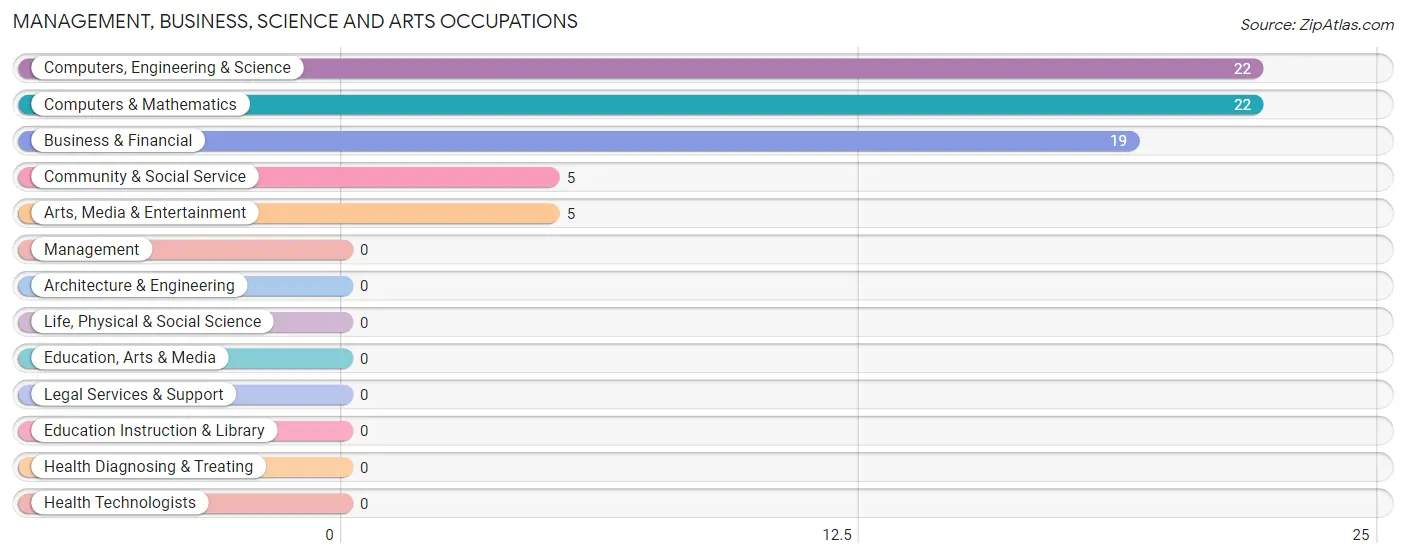
Management, Business, Science and Arts Occupations by Sex
Within the Management, Business, Science and Arts occupations in Jefferson City, the most male-oriented occupations are Computers, Engineering & Science (100.0%), and Computers & Mathematics (100.0%), while the most female-oriented occupations are Business & Financial (100.0%), Community & Social Service (100.0%), and Arts, Media & Entertainment (100.0%).
| Occupation | Male | Female |
| Management | 0 (0.0%) | 0 (0.0%) |
| Business & Financial | 0 (0.0%) | 19 (100.0%) |
| Computers, Engineering & Science | 22 (100.0%) | 0 (0.0%) |
| Computers & Mathematics | 22 (100.0%) | 0 (0.0%) |
| Architecture & Engineering | 0 (0.0%) | 0 (0.0%) |
| Life, Physical & Social Science | 0 (0.0%) | 0 (0.0%) |
| Community & Social Service | 0 (0.0%) | 5 (100.0%) |
| Education, Arts & Media | 0 (0.0%) | 0 (0.0%) |
| Legal Services & Support | 0 (0.0%) | 0 (0.0%) |
| Education Instruction & Library | 0 (0.0%) | 0 (0.0%) |
| Arts, Media & Entertainment | 0 (0.0%) | 5 (100.0%) |
| Health Diagnosing & Treating | 0 (0.0%) | 0 (0.0%) |
| Health Technologists | 0 (0.0%) | 0 (0.0%) |
| Total (Category) | 22 (47.8%) | 24 (52.2%) |
| Total (Overall) | 106 (63.5%) | 61 (36.5%) |
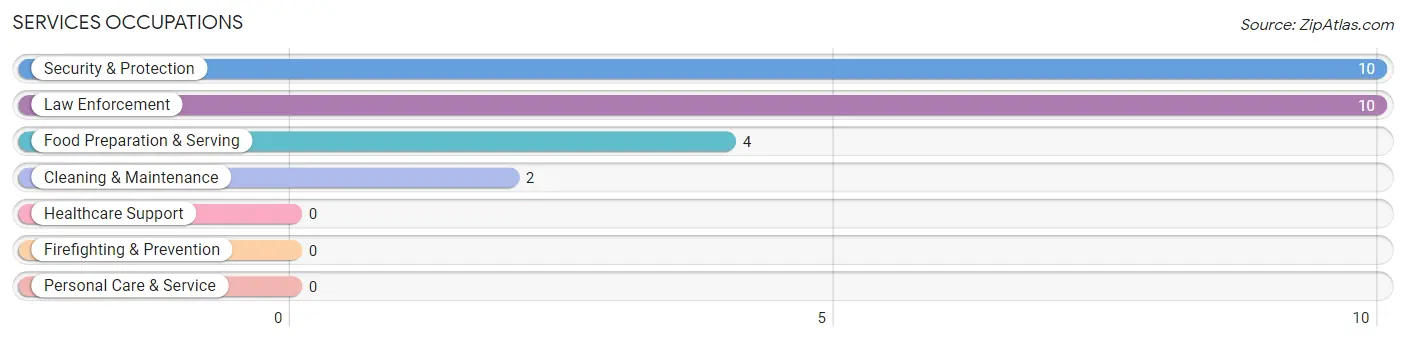
Services Occupations
The most common Services occupations in Jefferson City are Security & Protection (10 | 6.0%), Law Enforcement (10 | 6.0%), Food Preparation & Serving (4 | 2.4%), and Cleaning & Maintenance (2 | 1.2%).
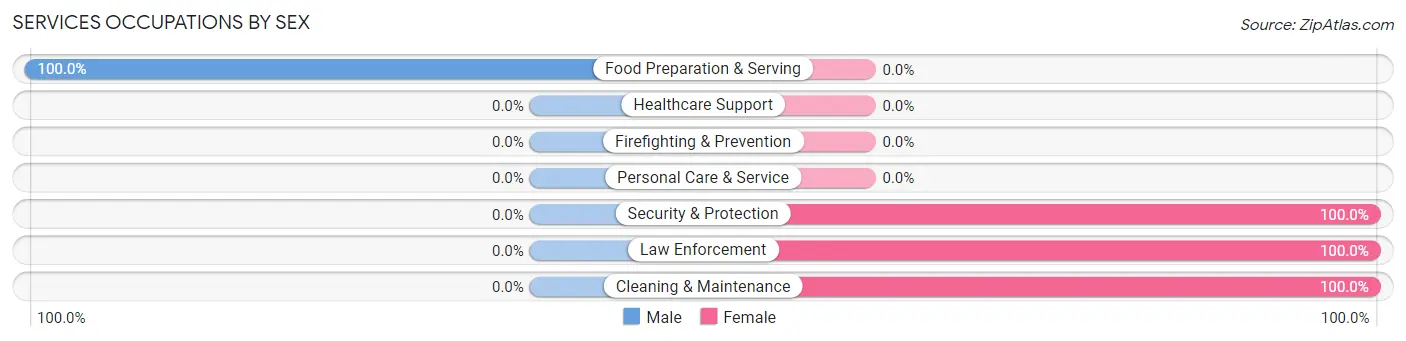
Services Occupations by Sex
| Occupation | Male | Female |
| Healthcare Support | 0 (0.0%) | 0 (0.0%) |
| Security & Protection | 0 (0.0%) | 10 (100.0%) |
| Firefighting & Prevention | 0 (0.0%) | 0 (0.0%) |
| Law Enforcement | 0 (0.0%) | 10 (100.0%) |
| Food Preparation & Serving | 4 (100.0%) | 0 (0.0%) |
| Cleaning & Maintenance | 0 (0.0%) | 2 (100.0%) |
| Personal Care & Service | 0 (0.0%) | 0 (0.0%) |
| Total (Category) | 4 (25.0%) | 12 (75.0%) |
| Total (Overall) | 106 (63.5%) | 61 (36.5%) |
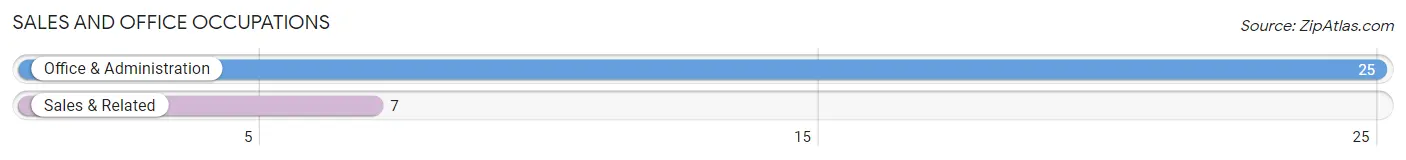
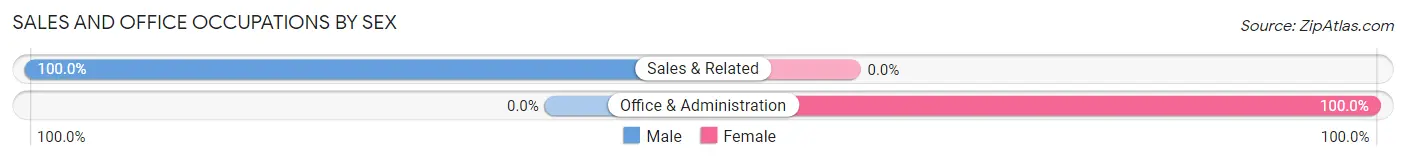
Sales and Office Occupations
The most common Sales and Office occupations in Jefferson City are Office & Administration (25 | 15.0%), and Sales & Related (7 | 4.2%).
Sales and Office Occupations by Sex
| Occupation | Male | Female |
| Sales & Related | 7 (100.0%) | 0 (0.0%) |
| Office & Administration | 0 (0.0%) | 25 (100.0%) |
| Total (Category) | 7 (21.9%) | 25 (78.1%) |
| Total (Overall) | 106 (63.5%) | 61 (36.5%) |
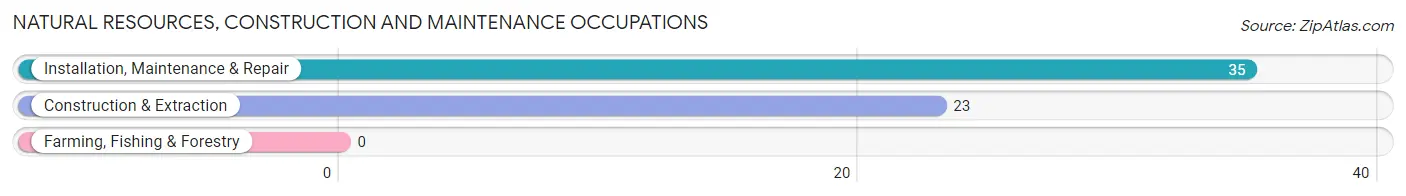
Natural Resources, Construction and Maintenance Occupations
The most common Natural Resources, Construction and Maintenance occupations in Jefferson City are Installation, Maintenance & Repair (35 | 21.0%), and Construction & Extraction (23 | 13.8%).
Natural Resources, Construction and Maintenance Occupations by Sex
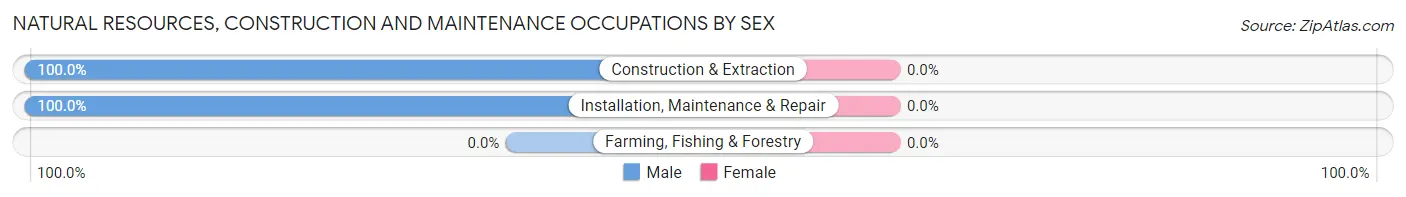
| Occupation | Male | Female |
| Farming, Fishing & Forestry | 0 (0.0%) | 0 (0.0%) |
| Construction & Extraction | 23 (100.0%) | 0 (0.0%) |
| Installation, Maintenance & Repair | 35 (100.0%) | 0 (0.0%) |
| Total (Category) | 58 (100.0%) | 0 (0.0%) |
| Total (Overall) | 106 (63.5%) | 61 (36.5%) |
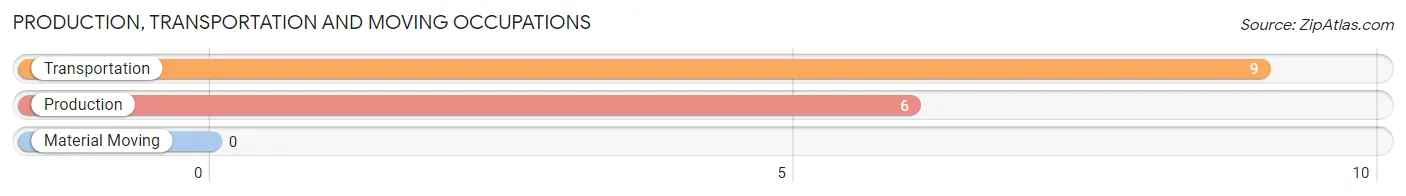
Production, Transportation and Moving Occupations
The most common Production, Transportation and Moving occupations in Jefferson City are Transportation (9 | 5.4%), and Production (6 | 3.6%).
Production, Transportation and Moving Occupations by Sex
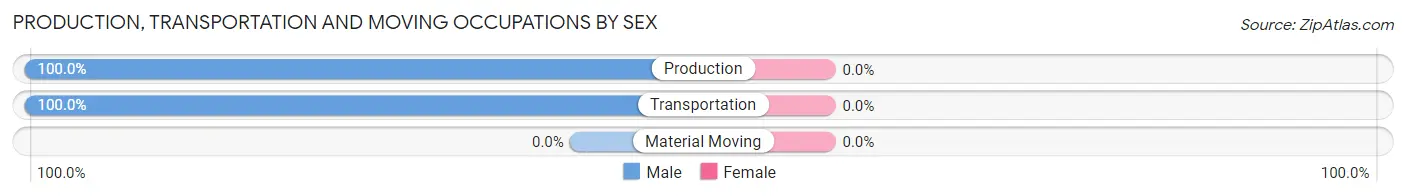
| Occupation | Male | Female |
| Production | 6 (100.0%) | 0 (0.0%) |
| Transportation | 9 (100.0%) | 0 (0.0%) |
| Material Moving | 0 (0.0%) | 0 (0.0%) |
| Total (Category) | 15 (100.0%) | 0 (0.0%) |
| Total (Overall) | 106 (63.5%) | 61 (36.5%) |
Employment Industries by Sex in Jefferson City
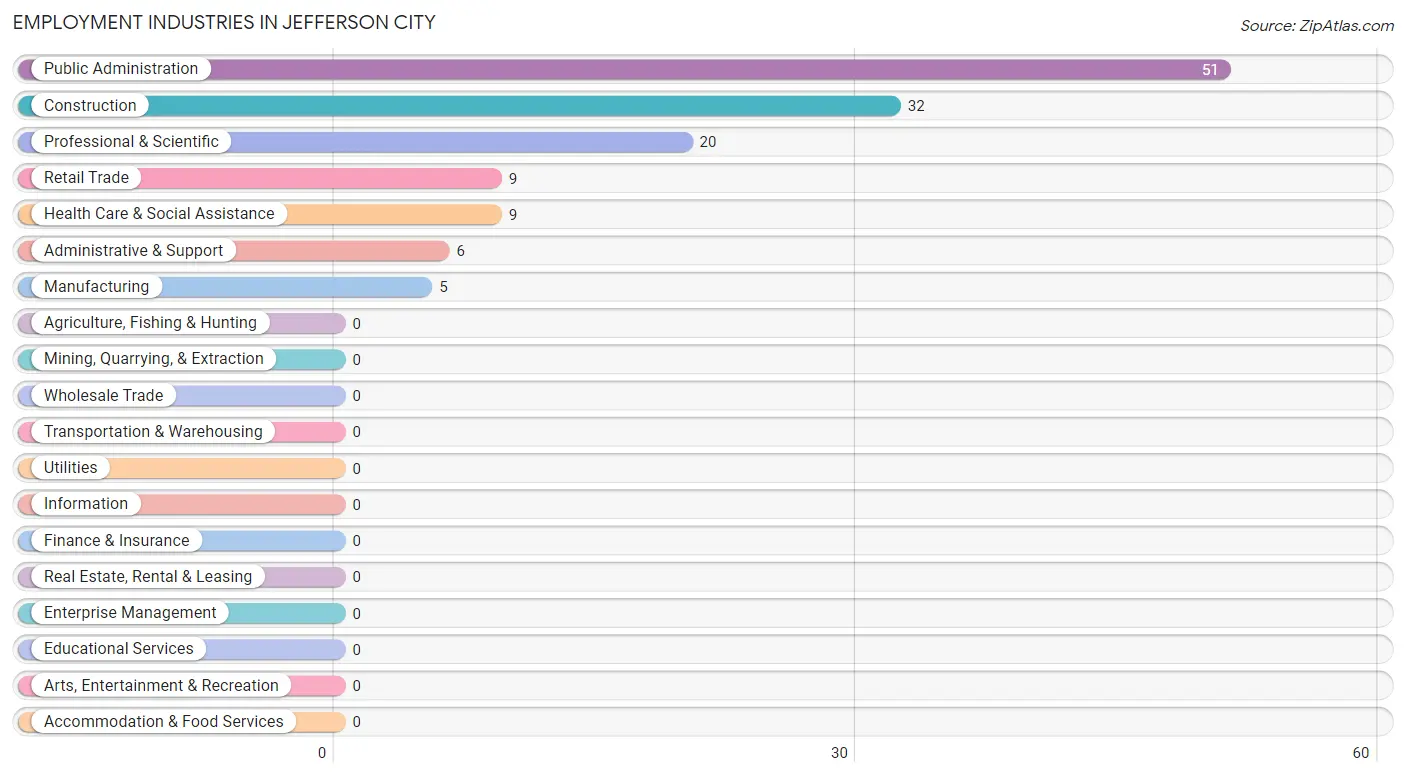
Employment Industries in Jefferson City
The major employment industries in Jefferson City include Public Administration (51 | 30.5%), Construction (32 | 19.2%), Professional & Scientific (20 | 12.0%), Retail Trade (9 | 5.4%), and Health Care & Social Assistance (9 | 5.4%).
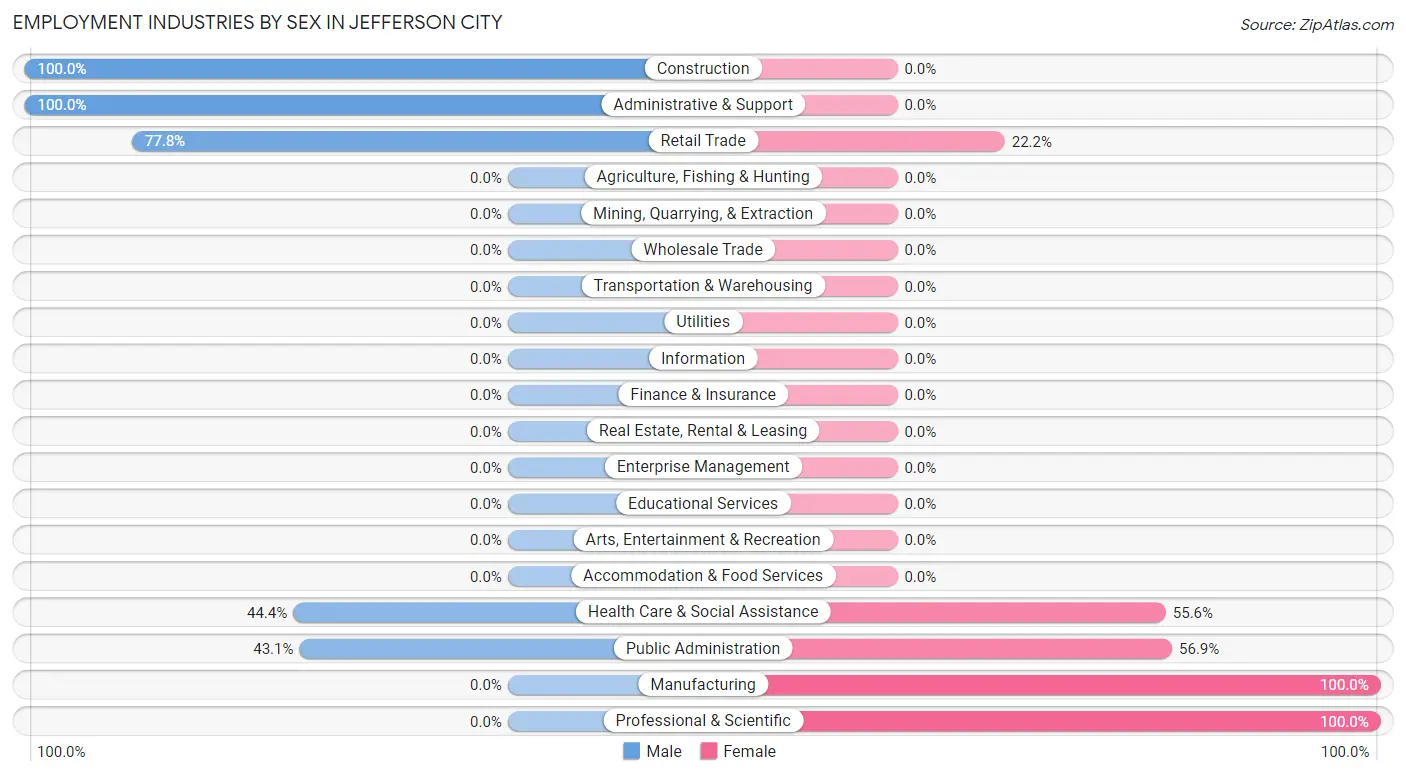
Employment Industries by Sex in Jefferson City
The Jefferson City industries that see more men than women are Construction (100.0%), Administrative & Support (100.0%), and Retail Trade (77.8%), whereas the industries that tend to have a higher number of women are Manufacturing (100.0%), Professional & Scientific (100.0%), and Public Administration (56.9%).
| Industry | Male | Female |
| Agriculture, Fishing & Hunting | 0 (0.0%) | 0 (0.0%) |
| Mining, Quarrying, & Extraction | 0 (0.0%) | 0 (0.0%) |
| Construction | 32 (100.0%) | 0 (0.0%) |
| Manufacturing | 0 (0.0%) | 5 (100.0%) |
| Wholesale Trade | 0 (0.0%) | 0 (0.0%) |
| Retail Trade | 7 (77.8%) | 2 (22.2%) |
| Transportation & Warehousing | 0 (0.0%) | 0 (0.0%) |
| Utilities | 0 (0.0%) | 0 (0.0%) |
| Information | 0 (0.0%) | 0 (0.0%) |
| Finance & Insurance | 0 (0.0%) | 0 (0.0%) |
| Real Estate, Rental & Leasing | 0 (0.0%) | 0 (0.0%) |
| Professional & Scientific | 0 (0.0%) | 20 (100.0%) |
| Enterprise Management | 0 (0.0%) | 0 (0.0%) |
| Administrative & Support | 6 (100.0%) | 0 (0.0%) |
| Educational Services | 0 (0.0%) | 0 (0.0%) |
| Health Care & Social Assistance | 4 (44.4%) | 5 (55.6%) |
| Arts, Entertainment & Recreation | 0 (0.0%) | 0 (0.0%) |
| Accommodation & Food Services | 0 (0.0%) | 0 (0.0%) |
| Public Administration | 22 (43.1%) | 29 (56.9%) |
| Total | 106 (63.5%) | 61 (36.5%) |
Education in Jefferson City
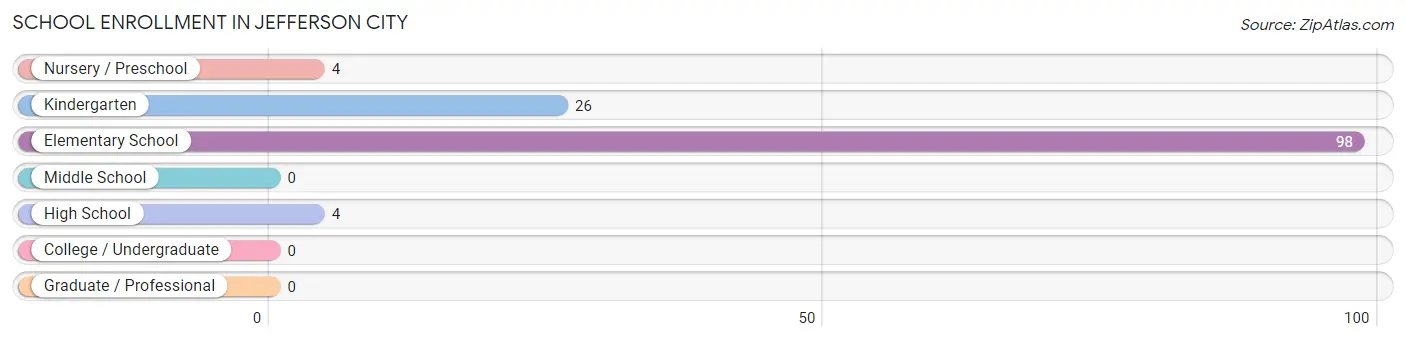
School Enrollment in Jefferson City
The most common levels of schooling among the 132 students in Jefferson City are elementary school (98 | 74.2%), kindergarten (26 | 19.7%), and nursery / preschool (4 | 3.0%).
| School Level | # Students | % Students |
| Nursery / Preschool | 4 | 3.0% |
| Kindergarten | 26 | 19.7% |
| Elementary School | 98 | 74.2% |
| Middle School | 0 | 0.0% |
| High School | 4 | 3.0% |
| College / Undergraduate | 0 | 0.0% |
| Graduate / Professional | 0 | 0.0% |
| Total | 132 | 100.0% |
School Enrollment by Age by Funding Source in Jefferson City
Out of a total of 132 students who are enrolled in schools in Jefferson City, 4 (3.0%) attend a private institution, while the remaining 128 (97.0%) are enrolled in public schools. The age group of 3 to 4 year olds has the highest likelihood of being enrolled in private schools, with 4 (100.0% in the age bracket) enrolled. Conversely, the age group of 5 to 9 year old has the lowest likelihood of being enrolled in a private school, with 101 (100.0% in the age bracket) attending a public institution.
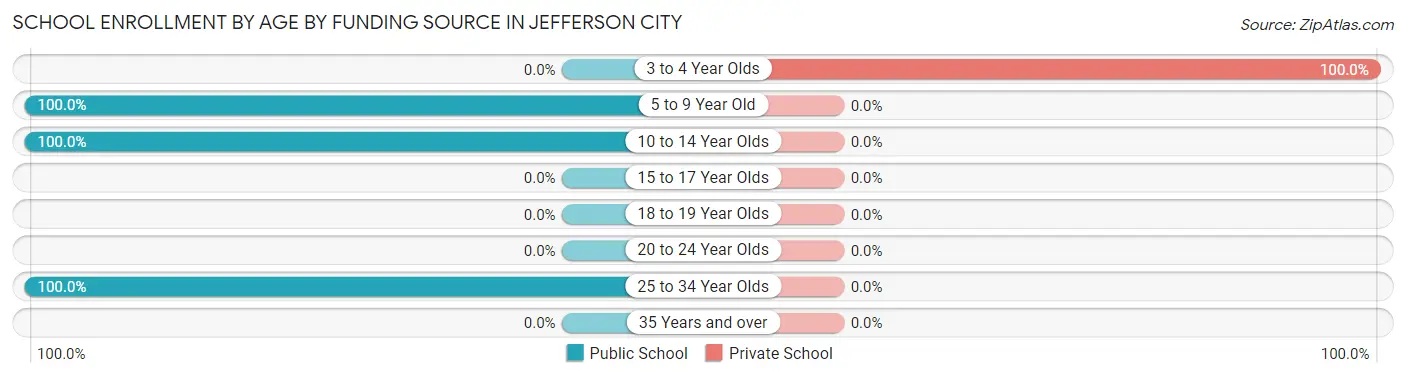
| Age Bracket | Public School | Private School |
| 3 to 4 Year Olds | 0 (0.0%) | 4 (100.0%) |
| 5 to 9 Year Old | 101 (100.0%) | 0 (0.0%) |
| 10 to 14 Year Olds | 23 (100.0%) | 0 (0.0%) |
| 15 to 17 Year Olds | 0 (0.0%) | 0 (0.0%) |
| 18 to 19 Year Olds | 0 (0.0%) | 0 (0.0%) |
| 20 to 24 Year Olds | 0 (0.0%) | 0 (0.0%) |
| 25 to 34 Year Olds | 4 (100.0%) | 0 (0.0%) |
| 35 Years and over | 0 (0.0%) | 0 (0.0%) |
| Total | 128 (97.0%) | 4 (3.0%) |
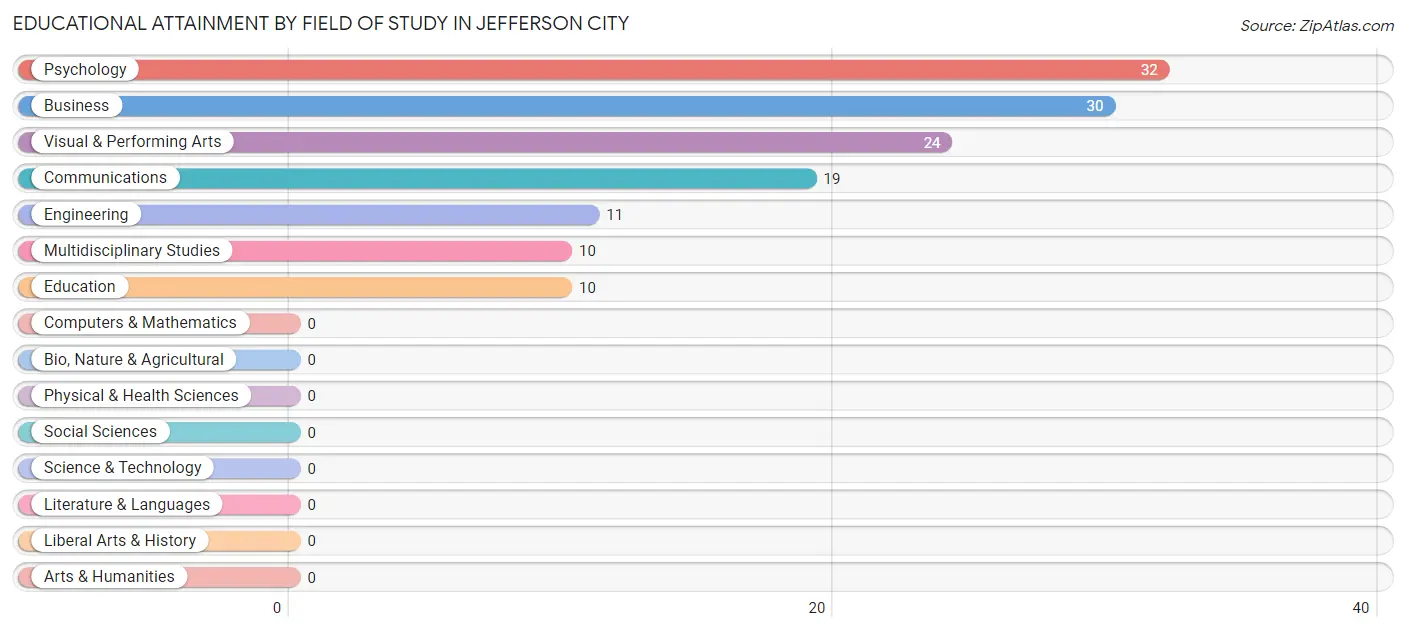
Educational Attainment by Field of Study in Jefferson City
Psychology (32 | 23.5%), business (30 | 22.1%), visual & performing arts (24 | 17.6%), communications (19 | 14.0%), and engineering (11 | 8.1%) are the most common fields of study among 136 individuals in Jefferson City who have obtained a bachelor's degree or higher.
| Field of Study | # Graduates | % Graduates |
| Computers & Mathematics | 0 | 0.0% |
| Bio, Nature & Agricultural | 0 | 0.0% |
| Physical & Health Sciences | 0 | 0.0% |
| Psychology | 32 | 23.5% |
| Social Sciences | 0 | 0.0% |
| Engineering | 11 | 8.1% |
| Multidisciplinary Studies | 10 | 7.3% |
| Science & Technology | 0 | 0.0% |
| Business | 30 | 22.1% |
| Education | 10 | 7.3% |
| Literature & Languages | 0 | 0.0% |
| Liberal Arts & History | 0 | 0.0% |
| Visual & Performing Arts | 24 | 17.6% |
| Communications | 19 | 14.0% |
| Arts & Humanities | 0 | 0.0% |
| Total | 136 | 100.0% |
Transportation & Commute in Jefferson City
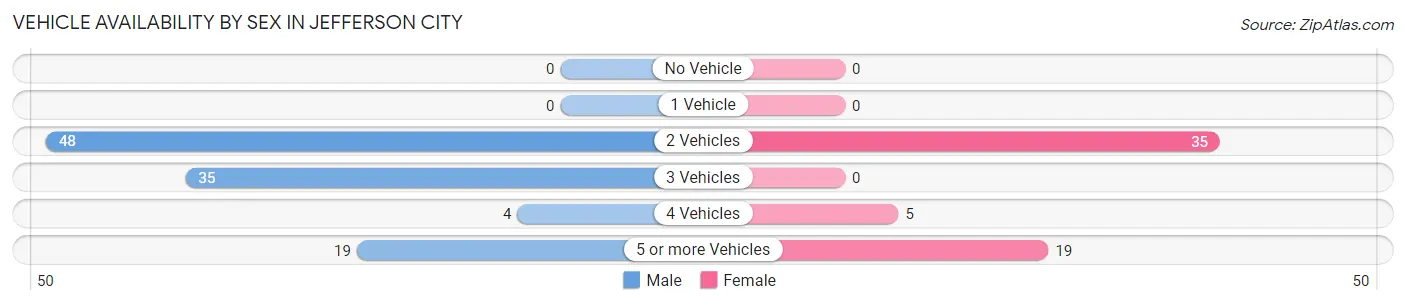
Vehicle Availability by Sex in Jefferson City
The most prevalent vehicle ownership categories in Jefferson City are males with 2 vehicles (48, accounting for 45.3%) and females with 2 vehicles (35, making up 81.4%).
| Vehicles Available | Male | Female |
| No Vehicle | 0 (0.0%) | 0 (0.0%) |
| 1 Vehicle | 0 (0.0%) | 0 (0.0%) |
| 2 Vehicles | 48 (45.3%) | 35 (59.3%) |
| 3 Vehicles | 35 (33.0%) | 0 (0.0%) |
| 4 Vehicles | 4 (3.8%) | 5 (8.5%) |
| 5 or more Vehicles | 19 (17.9%) | 19 (32.2%) |
| Total | 106 (100.0%) | 59 (100.0%) |
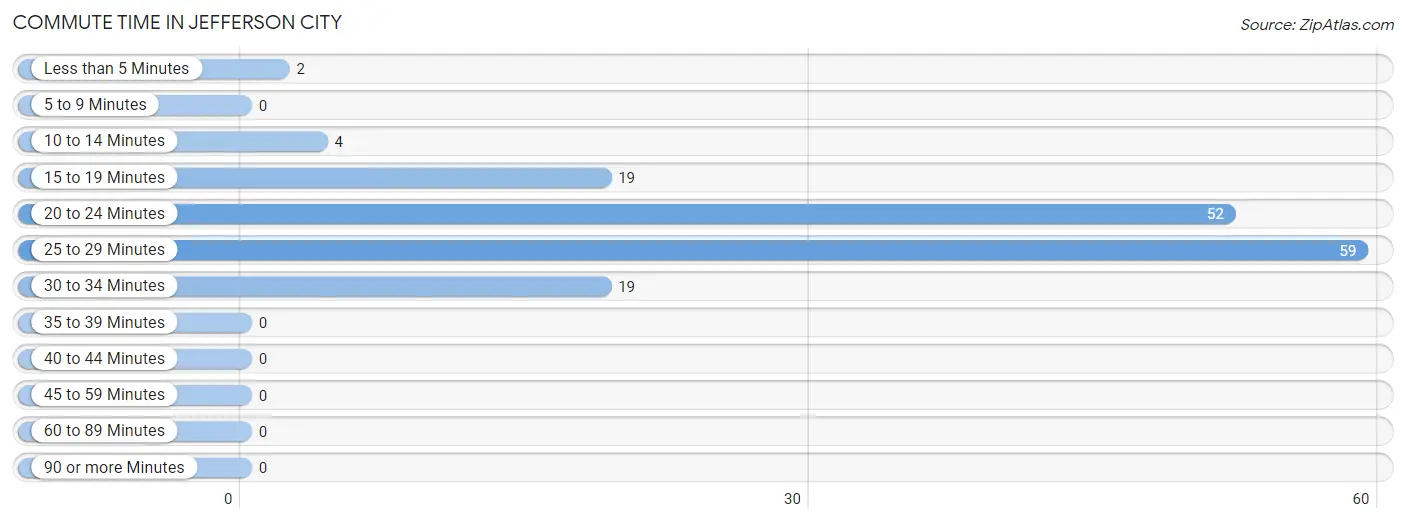
Commute Time in Jefferson City
The most frequently occuring commute durations in Jefferson City are 25 to 29 minutes (59 commuters, 38.1%), 20 to 24 minutes (52 commuters, 33.6%), and 15 to 19 minutes (19 commuters, 12.3%).
| Commute Time | # Commuters | % Commuters |
| Less than 5 Minutes | 2 | 1.3% |
| 5 to 9 Minutes | 0 | 0.0% |
| 10 to 14 Minutes | 4 | 2.6% |
| 15 to 19 Minutes | 19 | 12.3% |
| 20 to 24 Minutes | 52 | 33.6% |
| 25 to 29 Minutes | 59 | 38.1% |
| 30 to 34 Minutes | 19 | 12.3% |
| 35 to 39 Minutes | 0 | 0.0% |
| 40 to 44 Minutes | 0 | 0.0% |
| 45 to 59 Minutes | 0 | 0.0% |
| 60 to 89 Minutes | 0 | 0.0% |
| 90 or more Minutes | 0 | 0.0% |
Commute Time by Sex in Jefferson City
The most common commute times in Jefferson City are 20 to 24 minutes (47 commuters, 46.5%) for males and 25 to 29 minutes (20 commuters, 37.0%) for females.
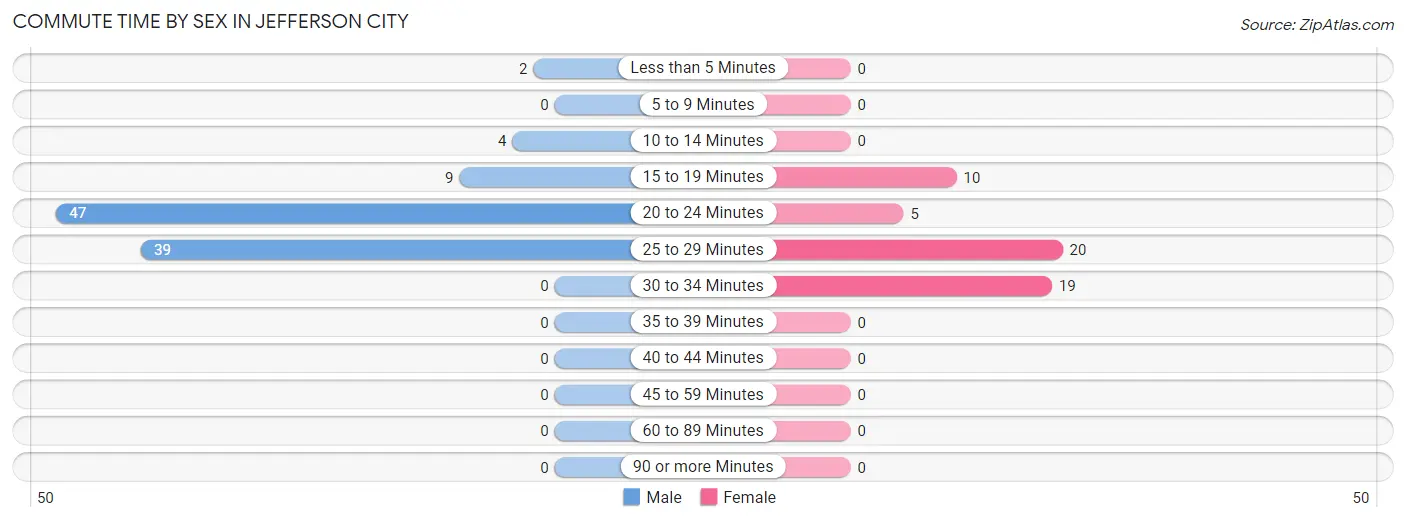
| Commute Time | Male | Female |
| Less than 5 Minutes | 2 (2.0%) | 0 (0.0%) |
| 5 to 9 Minutes | 0 (0.0%) | 0 (0.0%) |
| 10 to 14 Minutes | 4 (4.0%) | 0 (0.0%) |
| 15 to 19 Minutes | 9 (8.9%) | 10 (18.5%) |
| 20 to 24 Minutes | 47 (46.5%) | 5 (9.3%) |
| 25 to 29 Minutes | 39 (38.6%) | 20 (37.0%) |
| 30 to 34 Minutes | 0 (0.0%) | 19 (35.2%) |
| 35 to 39 Minutes | 0 (0.0%) | 0 (0.0%) |
| 40 to 44 Minutes | 0 (0.0%) | 0 (0.0%) |
| 45 to 59 Minutes | 0 (0.0%) | 0 (0.0%) |
| 60 to 89 Minutes | 0 (0.0%) | 0 (0.0%) |
| 90 or more Minutes | 0 (0.0%) | 0 (0.0%) |
Time of Departure to Work by Sex in Jefferson City
The most frequent times of departure to work in Jefferson City are 7:30 AM to 7:59 AM (57, 56.4%) for males and 8:00 AM to 8:29 AM (20, 37.0%) for females.
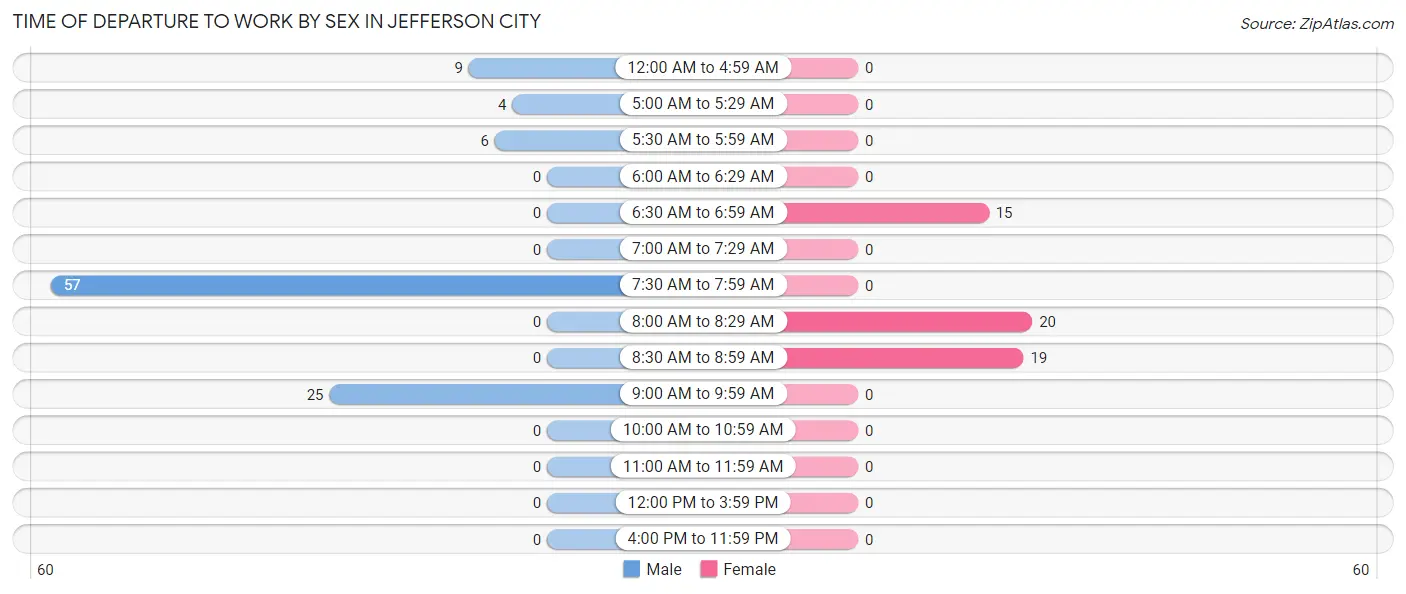
| Time of Departure | Male | Female |
| 12:00 AM to 4:59 AM | 9 (8.9%) | 0 (0.0%) |
| 5:00 AM to 5:29 AM | 4 (4.0%) | 0 (0.0%) |
| 5:30 AM to 5:59 AM | 6 (5.9%) | 0 (0.0%) |
| 6:00 AM to 6:29 AM | 0 (0.0%) | 0 (0.0%) |
| 6:30 AM to 6:59 AM | 0 (0.0%) | 15 (27.8%) |
| 7:00 AM to 7:29 AM | 0 (0.0%) | 0 (0.0%) |
| 7:30 AM to 7:59 AM | 57 (56.4%) | 0 (0.0%) |
| 8:00 AM to 8:29 AM | 0 (0.0%) | 20 (37.0%) |
| 8:30 AM to 8:59 AM | 0 (0.0%) | 19 (35.2%) |
| 9:00 AM to 9:59 AM | 25 (24.7%) | 0 (0.0%) |
| 10:00 AM to 10:59 AM | 0 (0.0%) | 0 (0.0%) |
| 11:00 AM to 11:59 AM | 0 (0.0%) | 0 (0.0%) |
| 12:00 PM to 3:59 PM | 0 (0.0%) | 0 (0.0%) |
| 4:00 PM to 11:59 PM | 0 (0.0%) | 0 (0.0%) |
| Total | 101 (100.0%) | 54 (100.0%) |
Housing Occupancy in Jefferson City
Occupancy by Ownership in Jefferson City
Of the total 175 dwellings in Jefferson City, owner-occupied units account for 156 (89.1%), while renter-occupied units make up 19 (10.9%).
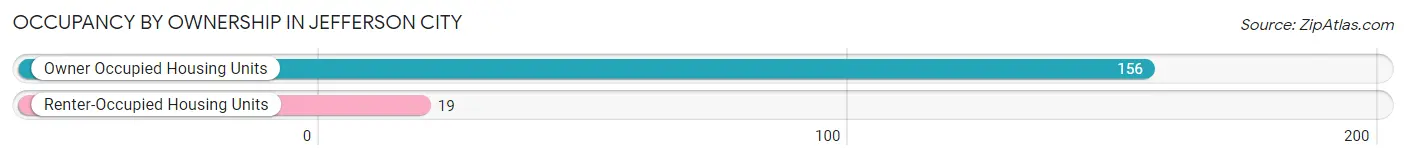
| Occupancy | # Housing Units | % Housing Units |
| Owner Occupied Housing Units | 156 | 89.1% |
| Renter-Occupied Housing Units | 19 | 10.9% |
| Total Occupied Housing Units | 175 | 100.0% |
Occupancy by Household Size in Jefferson City
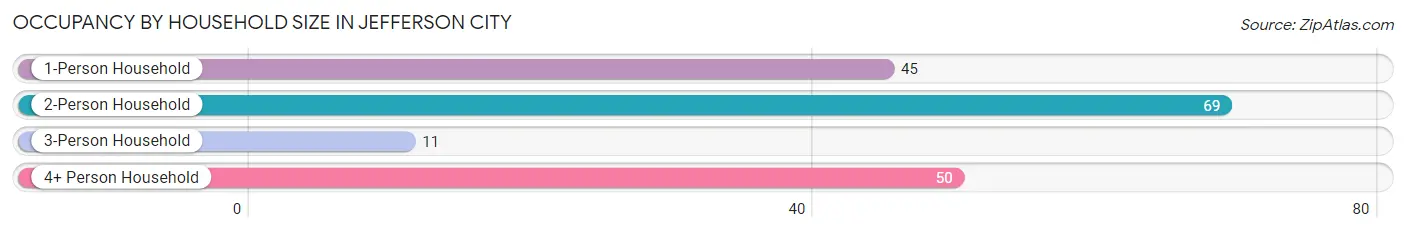
| Household Size | # Housing Units | % Housing Units |
| 1-Person Household | 45 | 25.7% |
| 2-Person Household | 69 | 39.4% |
| 3-Person Household | 11 | 6.3% |
| 4+ Person Household | 50 | 28.6% |
| Total Housing Units | 175 | 100.0% |
Occupancy by Ownership by Household Size in Jefferson City
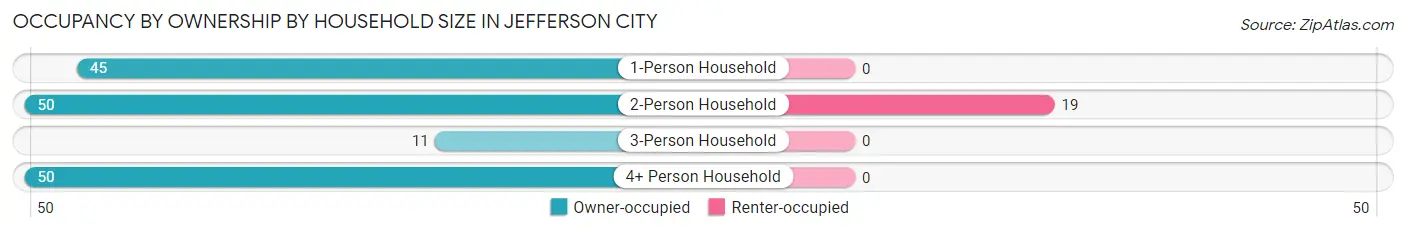
| Household Size | Owner-occupied | Renter-occupied |
| 1-Person Household | 45 (100.0%) | 0 (0.0%) |
| 2-Person Household | 50 (72.5%) | 19 (27.5%) |
| 3-Person Household | 11 (100.0%) | 0 (0.0%) |
| 4+ Person Household | 50 (100.0%) | 0 (0.0%) |
| Total Housing Units | 156 (89.1%) | 19 (10.9%) |
Occupancy by Educational Attainment in Jefferson City
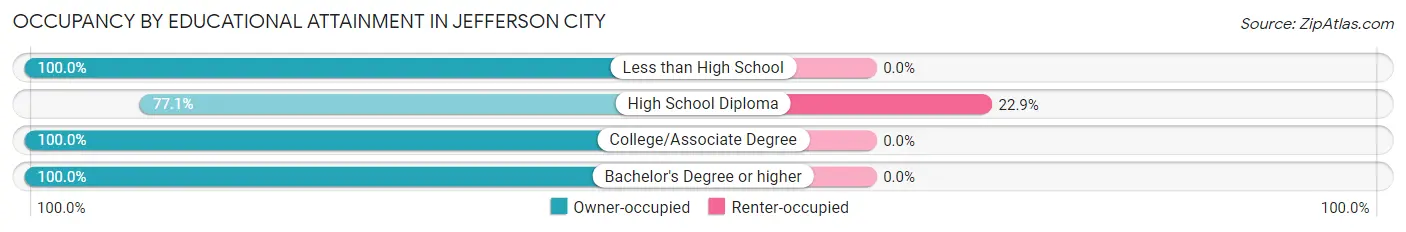
| Household Size | Owner-occupied | Renter-occupied |
| Less than High School | 10 (100.0%) | 0 (0.0%) |
| High School Diploma | 64 (77.1%) | 19 (22.9%) |
| College/Associate Degree | 34 (100.0%) | 0 (0.0%) |
| Bachelor's Degree or higher | 48 (100.0%) | 0 (0.0%) |
Occupancy by Age of Householder in Jefferson City
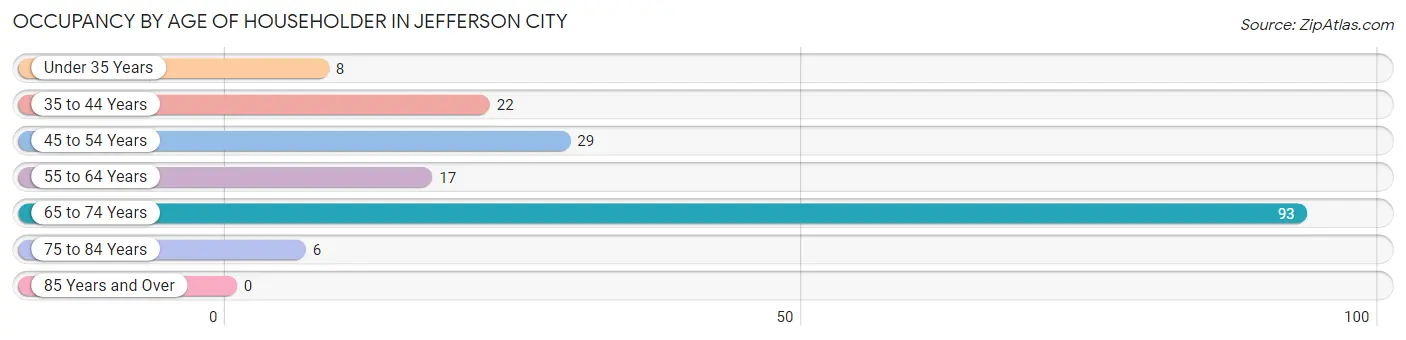
| Age Bracket | # Households | % Households |
| Under 35 Years | 8 | 4.6% |
| 35 to 44 Years | 22 | 12.6% |
| 45 to 54 Years | 29 | 16.6% |
| 55 to 64 Years | 17 | 9.7% |
| 65 to 74 Years | 93 | 53.1% |
| 75 to 84 Years | 6 | 3.4% |
| 85 Years and Over | 0 | 0.0% |
| Total | 175 | 100.0% |
Housing Finances in Jefferson City
Median Income by Occupancy in Jefferson City
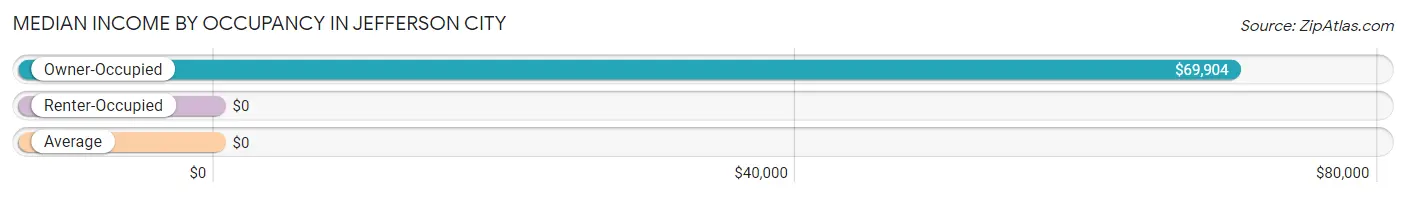
| Occupancy Type | # Households | Median Income |
| Owner-Occupied | 156 (89.1%) | $69,904 |
| Renter-Occupied | 19 (10.9%) | $0 |
| Average | 175 (100.0%) | $0 |
Occupancy by Householder Income Bracket in Jefferson City
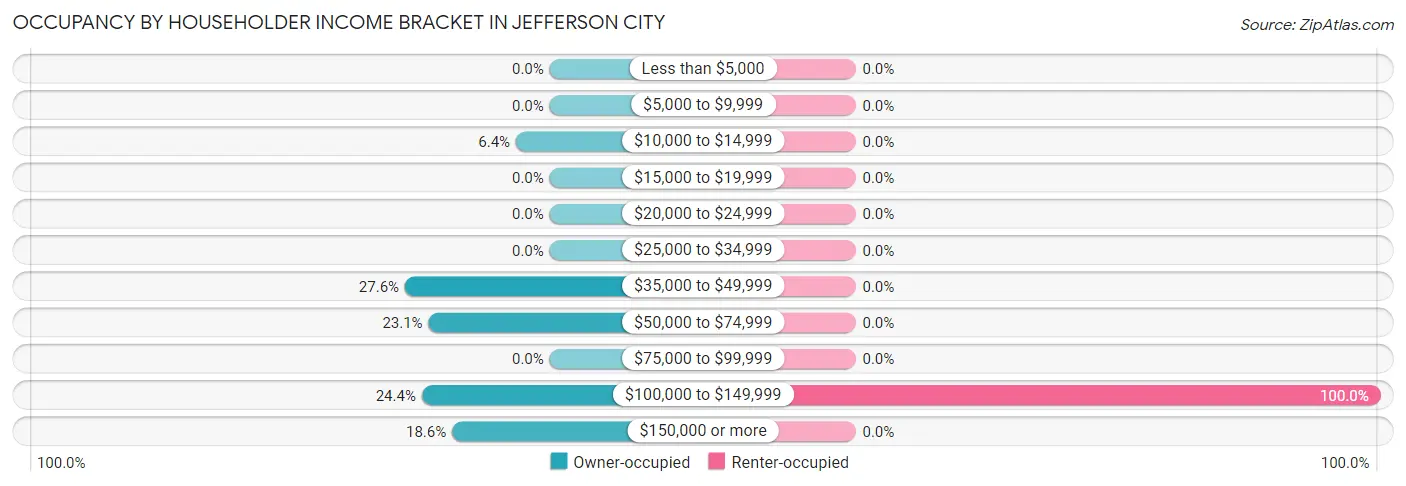
| Income Bracket | Owner-occupied | Renter-occupied |
| Less than $5,000 | 0 (0.0%) | 0 (0.0%) |
| $5,000 to $9,999 | 0 (0.0%) | 0 (0.0%) |
| $10,000 to $14,999 | 10 (6.4%) | 0 (0.0%) |
| $15,000 to $19,999 | 0 (0.0%) | 0 (0.0%) |
| $20,000 to $24,999 | 0 (0.0%) | 0 (0.0%) |
| $25,000 to $34,999 | 0 (0.0%) | 0 (0.0%) |
| $35,000 to $49,999 | 43 (27.6%) | 0 (0.0%) |
| $50,000 to $74,999 | 36 (23.1%) | 0 (0.0%) |
| $75,000 to $99,999 | 0 (0.0%) | 0 (0.0%) |
| $100,000 to $149,999 | 38 (24.4%) | 19 (100.0%) |
| $150,000 or more | 29 (18.6%) | 0 (0.0%) |
| Total | 156 (100.0%) | 19 (100.0%) |
Monthly Housing Cost Tiers in Jefferson City
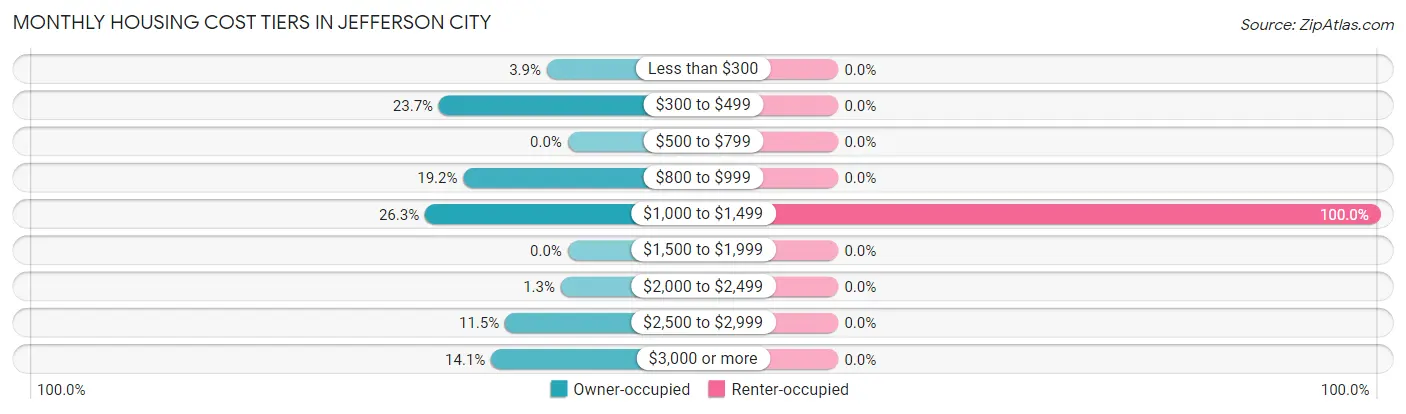
| Monthly Cost | Owner-occupied | Renter-occupied |
| Less than $300 | 6 (3.8%) | 0 (0.0%) |
| $300 to $499 | 37 (23.7%) | 0 (0.0%) |
| $500 to $799 | 0 (0.0%) | 0 (0.0%) |
| $800 to $999 | 30 (19.2%) | 0 (0.0%) |
| $1,000 to $1,499 | 41 (26.3%) | 19 (100.0%) |
| $1,500 to $1,999 | 0 (0.0%) | 0 (0.0%) |
| $2,000 to $2,499 | 2 (1.3%) | 0 (0.0%) |
| $2,500 to $2,999 | 18 (11.5%) | 0 (0.0%) |
| $3,000 or more | 22 (14.1%) | 0 (0.0%) |
| Total | 156 (100.0%) | 19 (100.0%) |
Physical Housing Characteristics in Jefferson City
Housing Structures in Jefferson City
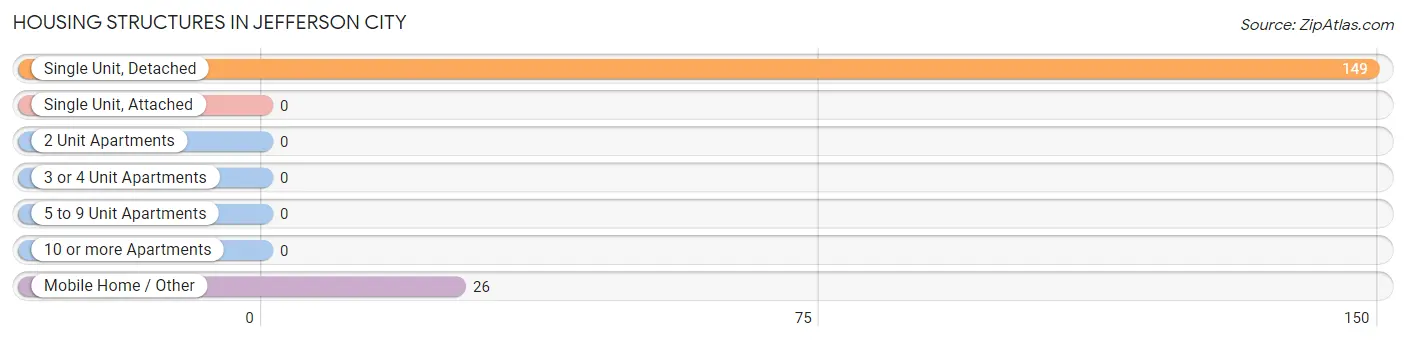
| Structure Type | # Housing Units | % Housing Units |
| Single Unit, Detached | 149 | 85.1% |
| Single Unit, Attached | 0 | 0.0% |
| 2 Unit Apartments | 0 | 0.0% |
| 3 or 4 Unit Apartments | 0 | 0.0% |
| 5 to 9 Unit Apartments | 0 | 0.0% |
| 10 or more Apartments | 0 | 0.0% |
| Mobile Home / Other | 26 | 14.9% |
| Total | 175 | 100.0% |
Housing Structures by Occupancy in Jefferson City
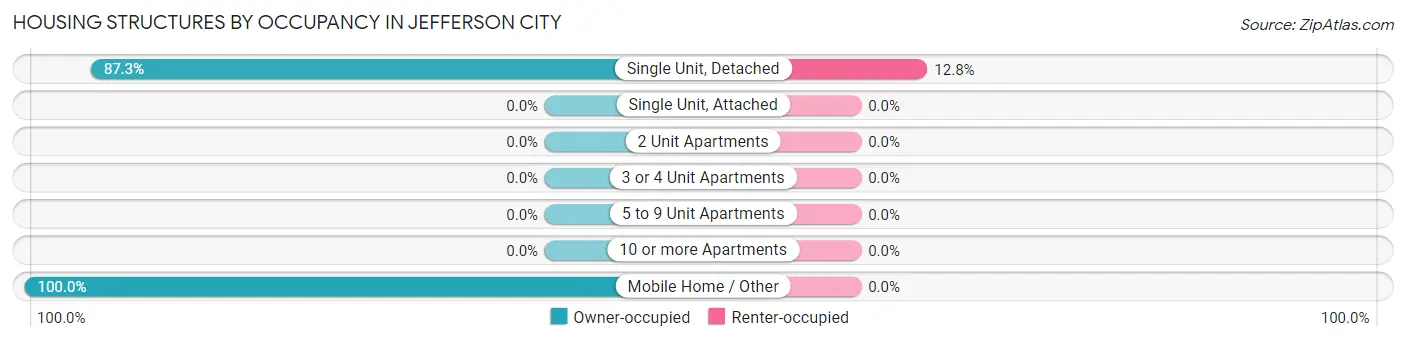
| Structure Type | Owner-occupied | Renter-occupied |
| Single Unit, Detached | 130 (87.3%) | 19 (12.8%) |
| Single Unit, Attached | 0 (0.0%) | 0 (0.0%) |
| 2 Unit Apartments | 0 (0.0%) | 0 (0.0%) |
| 3 or 4 Unit Apartments | 0 (0.0%) | 0 (0.0%) |
| 5 to 9 Unit Apartments | 0 (0.0%) | 0 (0.0%) |
| 10 or more Apartments | 0 (0.0%) | 0 (0.0%) |
| Mobile Home / Other | 26 (100.0%) | 0 (0.0%) |
| Total | 156 (89.1%) | 19 (10.9%) |
Housing Structures by Number of Rooms in Jefferson City
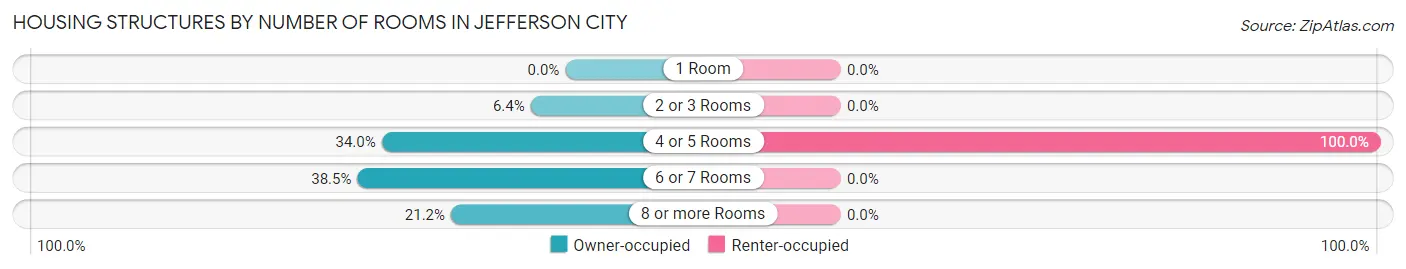
| Number of Rooms | Owner-occupied | Renter-occupied |
| 1 Room | 0 (0.0%) | 0 (0.0%) |
| 2 or 3 Rooms | 10 (6.4%) | 0 (0.0%) |
| 4 or 5 Rooms | 53 (34.0%) | 19 (100.0%) |
| 6 or 7 Rooms | 60 (38.5%) | 0 (0.0%) |
| 8 or more Rooms | 33 (21.1%) | 0 (0.0%) |
| Total | 156 (100.0%) | 19 (100.0%) |
Housing Structure by Heating Type in Jefferson City
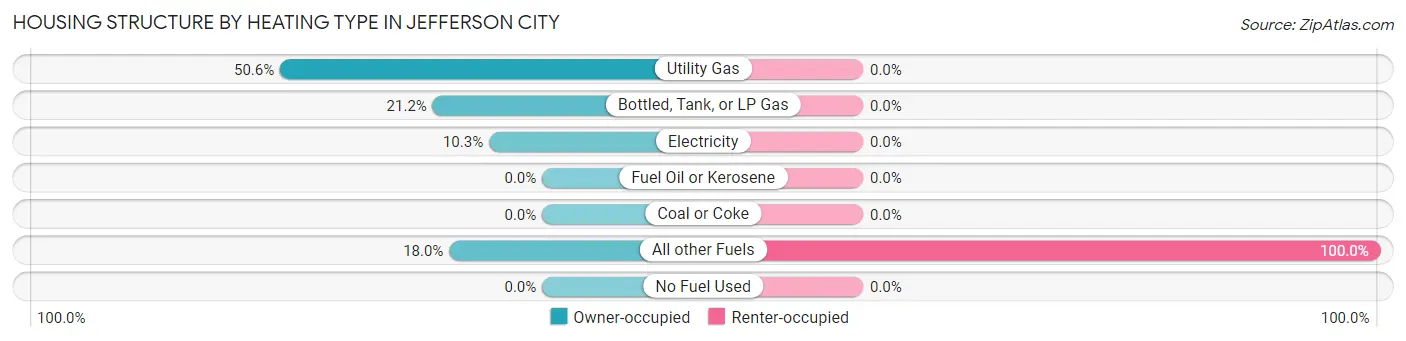
| Heating Type | Owner-occupied | Renter-occupied |
| Utility Gas | 79 (50.6%) | 0 (0.0%) |
| Bottled, Tank, or LP Gas | 33 (21.1%) | 0 (0.0%) |
| Electricity | 16 (10.3%) | 0 (0.0%) |
| Fuel Oil or Kerosene | 0 (0.0%) | 0 (0.0%) |
| Coal or Coke | 0 (0.0%) | 0 (0.0%) |
| All other Fuels | 28 (17.9%) | 19 (100.0%) |
| No Fuel Used | 0 (0.0%) | 0 (0.0%) |
| Total | 156 (100.0%) | 19 (100.0%) |
Household Vehicle Usage in Jefferson City
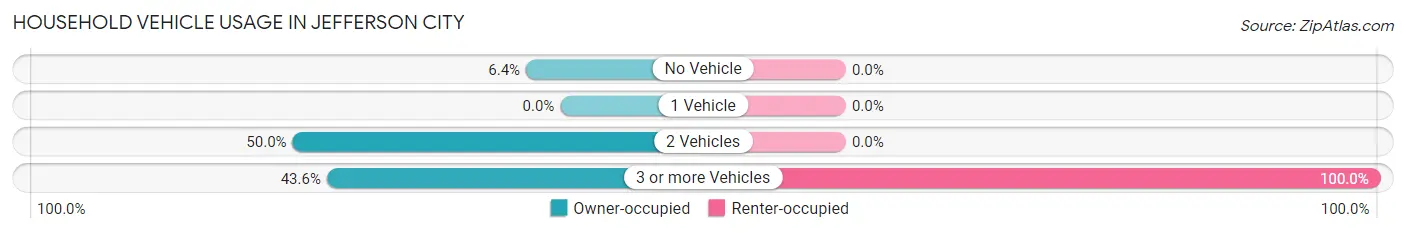
| Vehicles per Household | Owner-occupied | Renter-occupied |
| No Vehicle | 10 (6.4%) | 0 (0.0%) |
| 1 Vehicle | 0 (0.0%) | 0 (0.0%) |
| 2 Vehicles | 78 (50.0%) | 0 (0.0%) |
| 3 or more Vehicles | 68 (43.6%) | 19 (100.0%) |
| Total | 156 (100.0%) | 19 (100.0%) |
Real Estate & Mortgages in Jefferson City
Real Estate and Mortgage Overview in Jefferson City
| Characteristic | Without Mortgage | With Mortgage |
| Housing Units | 53 | 103 |
| Median Property Value | - | - |
| Median Household Income | $71,125 | $29 |
| Monthly Housing Costs | $421 | $22 |
| Real Estate Taxes | - | - |
Property Value by Mortgage Status in Jefferson City
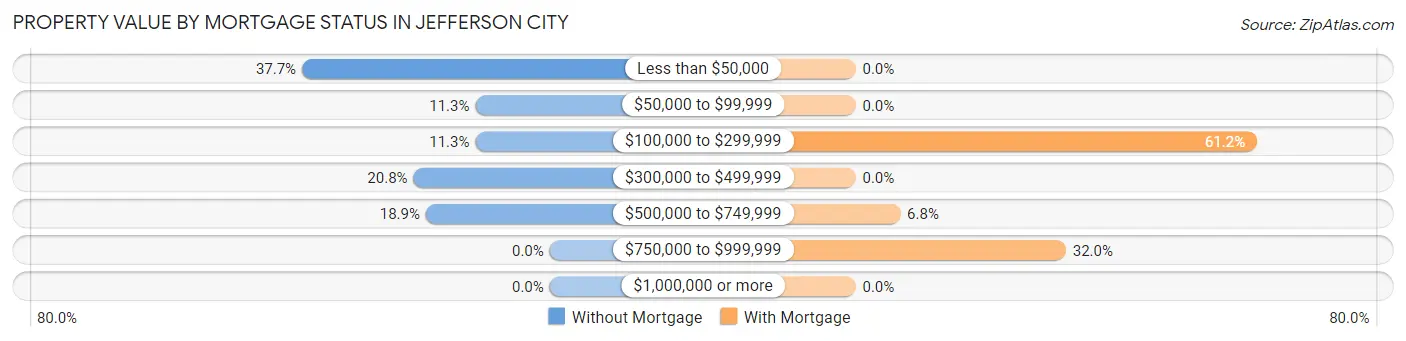
| Property Value | Without Mortgage | With Mortgage |
| Less than $50,000 | 20 (37.7%) | 0 (0.0%) |
| $50,000 to $99,999 | 6 (11.3%) | 0 (0.0%) |
| $100,000 to $299,999 | 6 (11.3%) | 63 (61.2%) |
| $300,000 to $499,999 | 11 (20.7%) | 0 (0.0%) |
| $500,000 to $749,999 | 10 (18.9%) | 7 (6.8%) |
| $750,000 to $999,999 | 0 (0.0%) | 33 (32.0%) |
| $1,000,000 or more | 0 (0.0%) | 0 (0.0%) |
| Total | 53 (100.0%) | 103 (100.0%) |
Household Income by Mortgage Status in Jefferson City
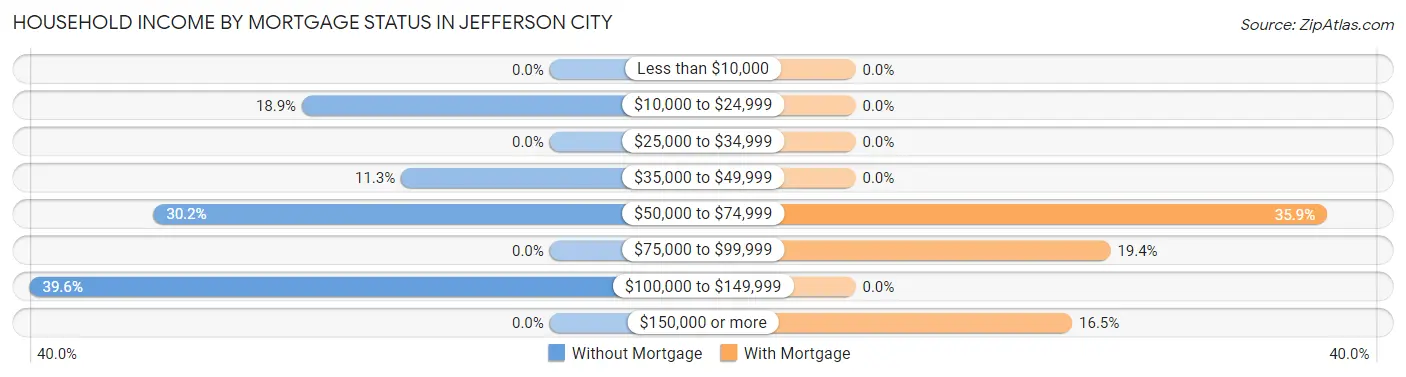
| Household Income | Without Mortgage | With Mortgage |
| Less than $10,000 | 0 (0.0%) | 0 (0.0%) |
| $10,000 to $24,999 | 10 (18.9%) | 0 (0.0%) |
| $25,000 to $34,999 | 0 (0.0%) | 0 (0.0%) |
| $35,000 to $49,999 | 6 (11.3%) | 0 (0.0%) |
| $50,000 to $74,999 | 16 (30.2%) | 37 (35.9%) |
| $75,000 to $99,999 | 0 (0.0%) | 20 (19.4%) |
| $100,000 to $149,999 | 21 (39.6%) | 0 (0.0%) |
| $150,000 or more | 0 (0.0%) | 17 (16.5%) |
| Total | 53 (100.0%) | 103 (100.0%) |
Property Value to Household Income Ratio in Jefferson City
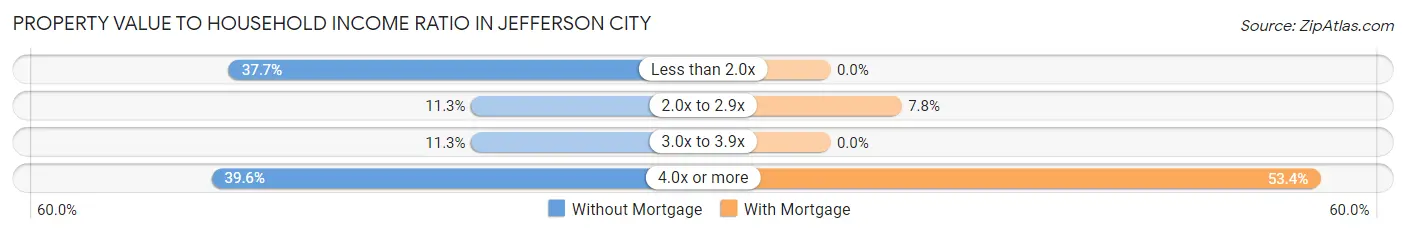
| Value-to-Income Ratio | Without Mortgage | With Mortgage |
| Less than 2.0x | 20 (37.7%) | 0 (0.0%) |
| 2.0x to 2.9x | 6 (11.3%) | 8 (7.8%) |
| 3.0x to 3.9x | 6 (11.3%) | 0 (0.0%) |
| 4.0x or more | 21 (39.6%) | 55 (53.4%) |
| Total | 53 (100.0%) | 103 (100.0%) |
Real Estate Taxes by Mortgage Status in Jefferson City
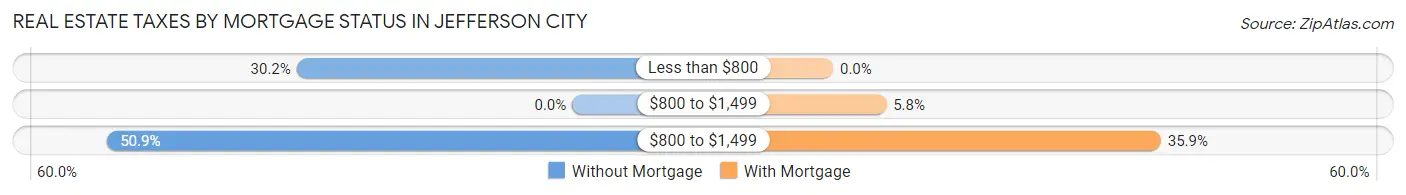
| Property Taxes | Without Mortgage | With Mortgage |
| Less than $800 | 16 (30.2%) | 0 (0.0%) |
| $800 to $1,499 | 0 (0.0%) | 6 (5.8%) |
| $800 to $1,499 | 27 (50.9%) | 37 (35.9%) |
| Total | 53 (100.0%) | 103 (100.0%) |
Health & Disability in Jefferson City
Health Insurance Coverage by Age in Jefferson City
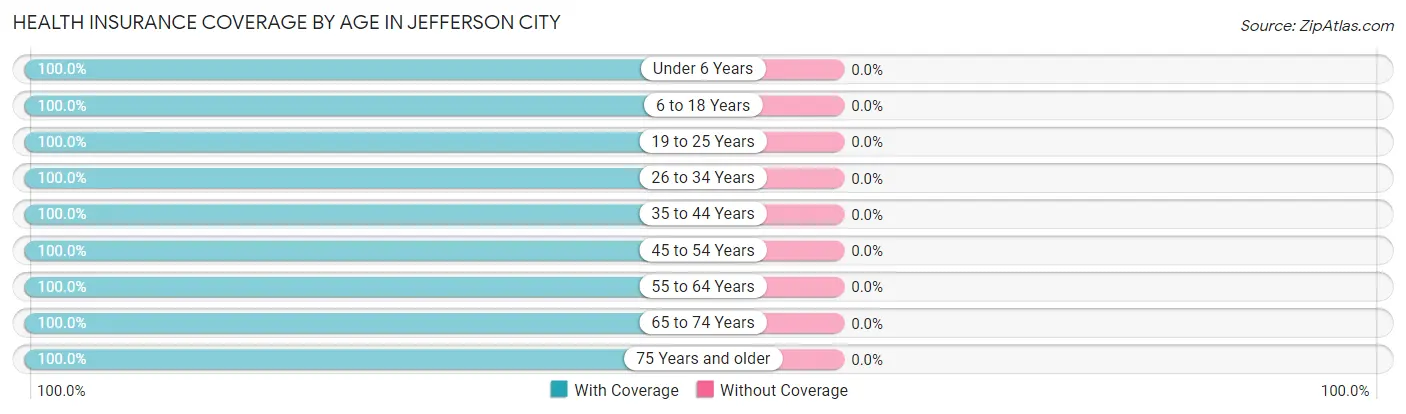
| Age Bracket | With Coverage | Without Coverage |
| Under 6 Years | 18 (100.0%) | 0 (0.0%) |
| 6 to 18 Years | 124 (100.0%) | 0 (0.0%) |
| 19 to 25 Years | 2 (100.0%) | 0 (0.0%) |
| 26 to 34 Years | 64 (100.0%) | 0 (0.0%) |
| 35 to 44 Years | 42 (100.0%) | 0 (0.0%) |
| 45 to 54 Years | 57 (100.0%) | 0 (0.0%) |
| 55 to 64 Years | 38 (100.0%) | 0 (0.0%) |
| 65 to 74 Years | 129 (100.0%) | 0 (0.0%) |
| 75 Years and older | 6 (100.0%) | 0 (0.0%) |
| Total | 480 (100.0%) | 0 (0.0%) |
Health Insurance Coverage by Citizenship Status in Jefferson City
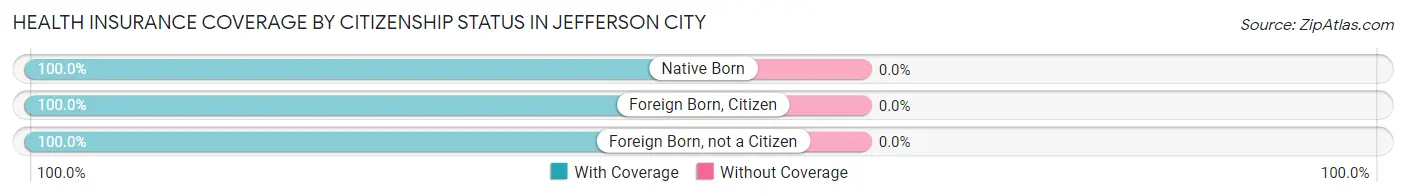
| Citizenship Status | With Coverage | Without Coverage |
| Native Born | 18 (100.0%) | 0 (0.0%) |
| Foreign Born, Citizen | 124 (100.0%) | 0 (0.0%) |
| Foreign Born, not a Citizen | 2 (100.0%) | 0 (0.0%) |
Health Insurance Coverage by Household Income in Jefferson City
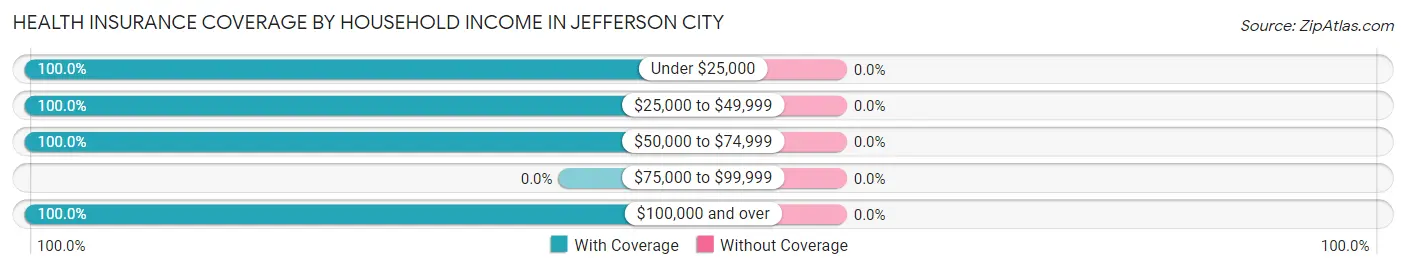
| Household Income | With Coverage | Without Coverage |
| Under $25,000 | 10 (100.0%) | 0 (0.0%) |
| $25,000 to $49,999 | 63 (100.0%) | 0 (0.0%) |
| $50,000 to $74,999 | 167 (100.0%) | 0 (0.0%) |
| $75,000 to $99,999 | 0 (0.0%) | 0 (0.0%) |
| $100,000 and over | 240 (100.0%) | 0 (0.0%) |
Public vs Private Health Insurance Coverage by Age in Jefferson City
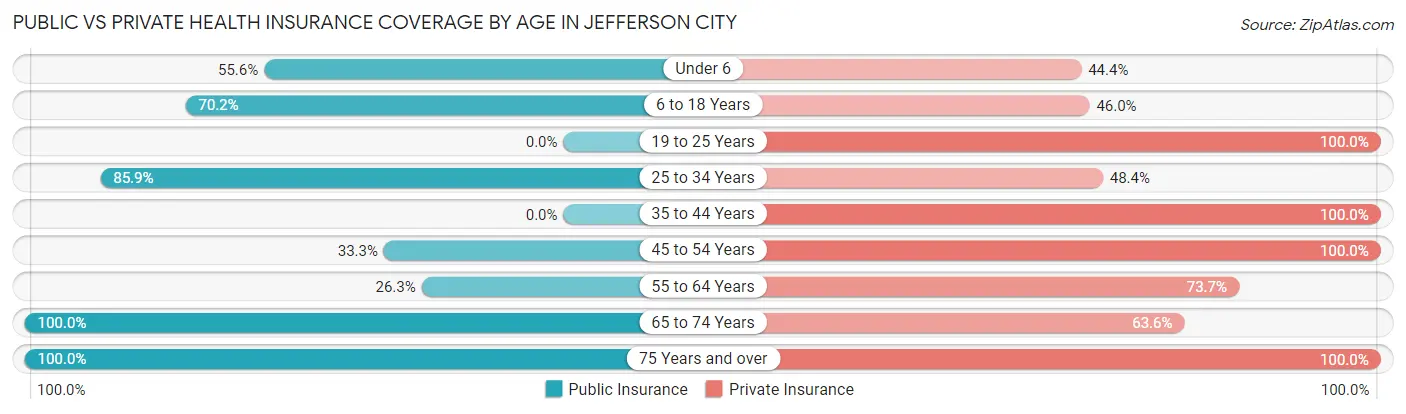
| Age Bracket | Public Insurance | Private Insurance |
| Under 6 | 10 (55.6%) | 8 (44.4%) |
| 6 to 18 Years | 87 (70.2%) | 57 (46.0%) |
| 19 to 25 Years | 0 (0.0%) | 2 (100.0%) |
| 25 to 34 Years | 55 (85.9%) | 31 (48.4%) |
| 35 to 44 Years | 0 (0.0%) | 42 (100.0%) |
| 45 to 54 Years | 19 (33.3%) | 57 (100.0%) |
| 55 to 64 Years | 10 (26.3%) | 28 (73.7%) |
| 65 to 74 Years | 129 (100.0%) | 82 (63.6%) |
| 75 Years and over | 6 (100.0%) | 6 (100.0%) |
| Total | 316 (65.8%) | 313 (65.2%) |
Disability Status by Sex by Age in Jefferson City
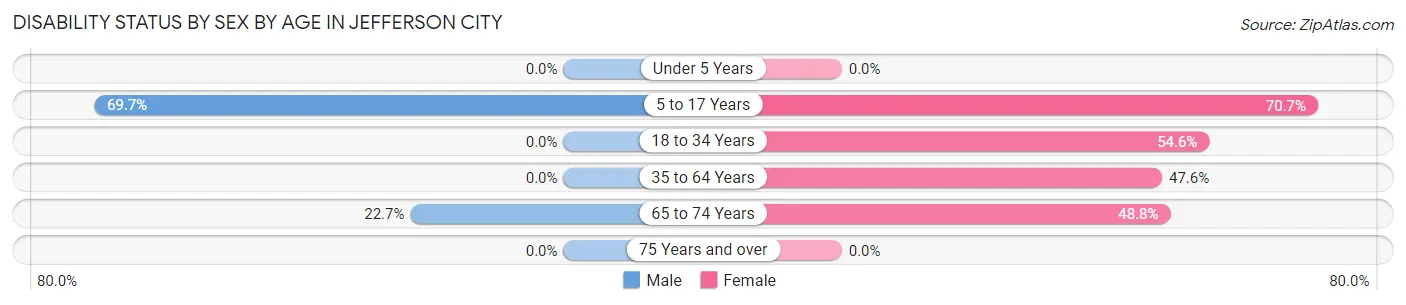
| Age Bracket | Male | Female |
| Under 5 Years | 0 (0.0%) | 0 (0.0%) |
| 5 to 17 Years | 46 (69.7%) | 41 (70.7%) |
| 18 to 34 Years | 0 (0.0%) | 18 (54.5%) |
| 35 to 64 Years | 0 (0.0%) | 39 (47.6%) |
| 65 to 74 Years | 20 (22.7%) | 20 (48.8%) |
| 75 Years and over | 0 (0.0%) | 0 (0.0%) |
Disability Class by Sex by Age in Jefferson City
Disability Class: Hearing Difficulty
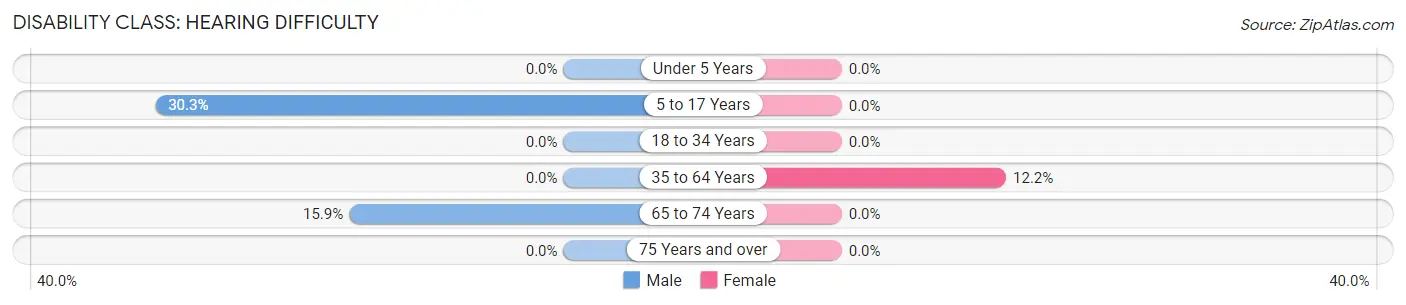
| Age Bracket | Male | Female |
| Under 5 Years | 0 (0.0%) | 0 (0.0%) |
| 5 to 17 Years | 20 (30.3%) | 0 (0.0%) |
| 18 to 34 Years | 0 (0.0%) | 0 (0.0%) |
| 35 to 64 Years | 0 (0.0%) | 10 (12.2%) |
| 65 to 74 Years | 14 (15.9%) | 0 (0.0%) |
| 75 Years and over | 0 (0.0%) | 0 (0.0%) |
Disability Class: Vision Difficulty
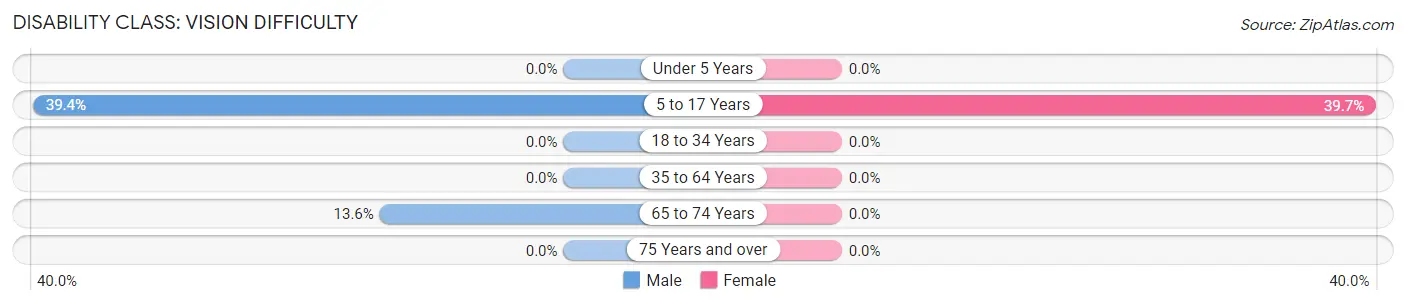
| Age Bracket | Male | Female |
| Under 5 Years | 0 (0.0%) | 0 (0.0%) |
| 5 to 17 Years | 26 (39.4%) | 23 (39.7%) |
| 18 to 34 Years | 0 (0.0%) | 0 (0.0%) |
| 35 to 64 Years | 0 (0.0%) | 0 (0.0%) |
| 65 to 74 Years | 12 (13.6%) | 0 (0.0%) |
| 75 Years and over | 0 (0.0%) | 0 (0.0%) |
Disability Class: Cognitive Difficulty
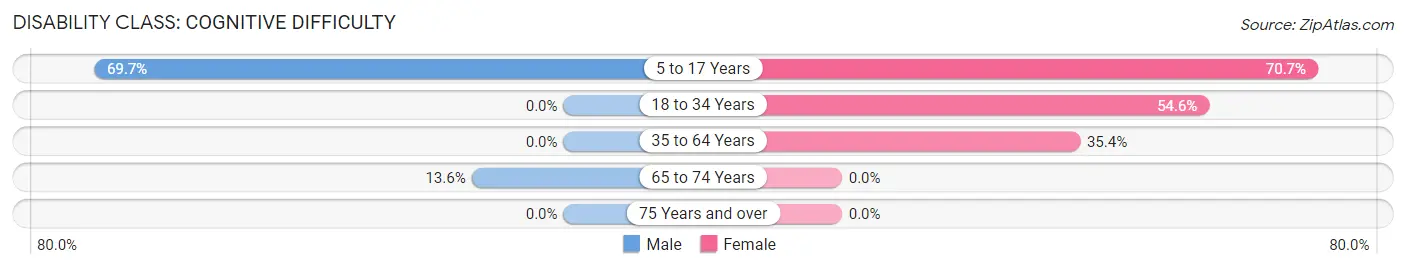
| Age Bracket | Male | Female |
| 5 to 17 Years | 46 (69.7%) | 41 (70.7%) |
| 18 to 34 Years | 0 (0.0%) | 18 (54.5%) |
| 35 to 64 Years | 0 (0.0%) | 29 (35.4%) |
| 65 to 74 Years | 12 (13.6%) | 0 (0.0%) |
| 75 Years and over | 0 (0.0%) | 0 (0.0%) |
Disability Class: Ambulatory Difficulty
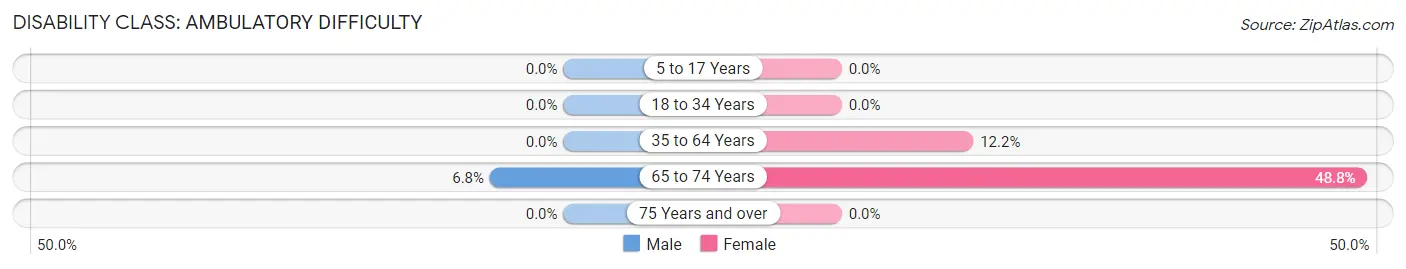
| Age Bracket | Male | Female |
| 5 to 17 Years | 0 (0.0%) | 0 (0.0%) |
| 18 to 34 Years | 0 (0.0%) | 0 (0.0%) |
| 35 to 64 Years | 0 (0.0%) | 10 (12.2%) |
| 65 to 74 Years | 6 (6.8%) | 20 (48.8%) |
| 75 Years and over | 0 (0.0%) | 0 (0.0%) |
Disability Class: Self-Care Difficulty
| Age Bracket | Male | Female |
| 5 to 17 Years | 0 (0.0%) | 0 (0.0%) |
| 18 to 34 Years | 0 (0.0%) | 0 (0.0%) |
| 35 to 64 Years | 0 (0.0%) | 0 (0.0%) |
| 65 to 74 Years | 0 (0.0%) | 0 (0.0%) |
| 75 Years and over | 0 (0.0%) | 0 (0.0%) |
Technology Access in Jefferson City
Computing Device Access in Jefferson City
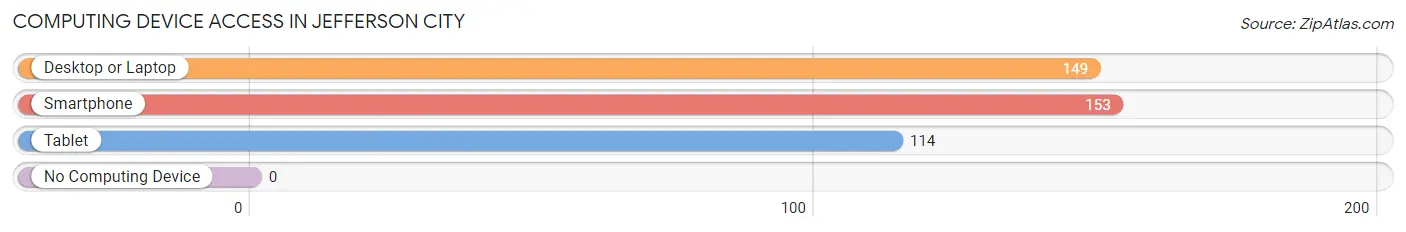
| Device Type | # Households | % Households |
| Desktop or Laptop | 149 | 85.1% |
| Smartphone | 153 | 87.4% |
| Tablet | 114 | 65.1% |
| No Computing Device | 0 | 0.0% |
| Total | 175 | 100.0% |
Internet Access in Jefferson City
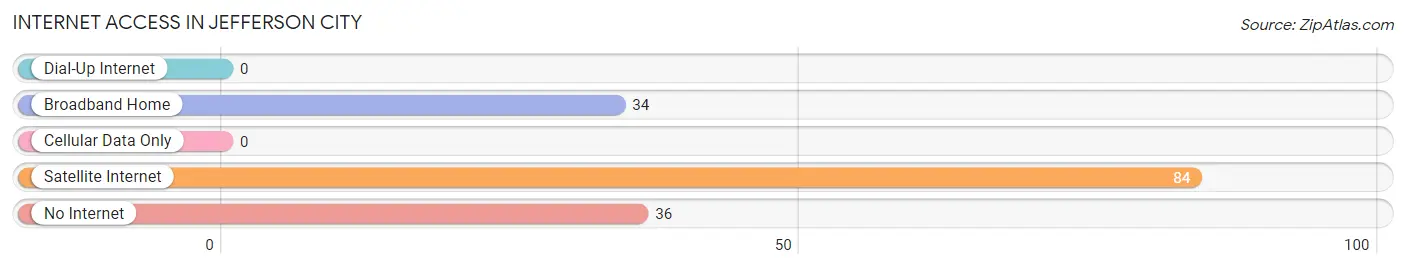
| Internet Type | # Households | % Households |
| Dial-Up Internet | 0 | 0.0% |
| Broadband Home | 34 | 19.4% |
| Cellular Data Only | 0 | 0.0% |
| Satellite Internet | 84 | 48.0% |
| No Internet | 36 | 20.6% |
| Total | 175 | 100.0% |
Jefferson City Summary
Jefferson City, Montana is a small city located in the western part of the state, near the Idaho border. It is the county seat of Jefferson County and is home to a population of just over 4,000 people. The city is situated in a valley surrounded by the Rocky Mountains and is known for its outdoor recreation opportunities.
History
Jefferson City was founded in 1864 by a group of settlers from the Midwest. The city was named after Thomas Jefferson, the third president of the United States. The city was originally a mining town, and the first gold was discovered in the area in 1865. The city quickly grew and by the late 1800s, it was a bustling center of commerce and industry.
In the early 1900s, the city experienced a period of decline as the mining industry began to decline. However, the city was able to rebound in the mid-1900s with the development of the nearby ski resort, Big Sky. This helped to bring in new businesses and tourists to the area, and the city has continued to grow since then.
Geography
Jefferson City is located in the western part of Montana, near the Idaho border. The city is situated in a valley surrounded by the Rocky Mountains. The city is located at an elevation of 4,890 feet and has a total area of 4.2 square miles. The city is located in a temperate climate, with hot summers and cold winters.
Economy
The economy of Jefferson City is largely based on tourism and outdoor recreation. The city is home to the Big Sky ski resort, which attracts visitors from all over the world. The city is also home to several other outdoor recreation businesses, such as fishing and hunting guides, rafting companies, and horseback riding stables.
In addition to tourism and outdoor recreation, Jefferson City is also home to several manufacturing and technology companies. The city is home to several large companies, such as the Montana Power Company, the Montana Rail Link, and the Montana Silversmiths.
Demographics
As of the 2010 census, the population of Jefferson City was 4,077. The population is predominantly white, with a small percentage of African Americans, Native Americans, and Asians. The median household income in the city is $45,000, and the median age is 39.
Jefferson City is a small city with a rich history and a vibrant economy. The city is home to a diverse population and offers a variety of outdoor recreation opportunities. The city is a great place to live, work, and play, and is a great place to visit for those looking for a unique experience.
Common Questions
What is Per Capita Income in Jefferson City?
Per Capita income in Jefferson City is $34,970.
What is the Median Family Income in Jefferson City?
Median Family Income in Jefferson City is $109,318.
What is Inequality or Gini Index in Jefferson City?
Inequality or Gini Index in Jefferson City is 0.32.
What is the Total Population of Jefferson City?
Total Population of Jefferson City is 480.
What is the Total Male Population of Jefferson City?
Total Male Population of Jefferson City is 260.
What is the Total Female Population of Jefferson City?
Total Female Population of Jefferson City is 220.
What is the Ratio of Males per 100 Females in Jefferson City?
There are 118.18 Males per 100 Females in Jefferson City.
What is the Ratio of Females per 100 Males in Jefferson City?
There are 84.62 Females per 100 Males in Jefferson City.
What is the Median Population Age in Jefferson City?
Median Population Age in Jefferson City is 38.5 Years.
What is the Average Family Size in Jefferson City
Average Family Size in Jefferson City is 3.4 People.
What is the Average Household Size in Jefferson City
Average Household Size in Jefferson City is 2.7 People.
How Large is the Labor Force in Jefferson City?
There are 167 People in the Labor Forcein in Jefferson City.
What is the Percentage of People in the Labor Force in Jefferson City?
49.4% of People are in the Labor Force in Jefferson City.