Highwood, MT Map & Demographics
Highwood Map
Highwood Overview
$29,492
PER CAPITA INCOME
$73,750
AVG FAMILY INCOME
$50,750
AVG HOUSEHOLD INCOME
21.7%
WAGE / INCOME GAP [ % ]
78.3¢/ $1
WAGE / INCOME GAP [ $ ]
0.39
INEQUALITY / GINI INDEX
179
TOTAL POPULATION
81
MALE POPULATION
98
FEMALE POPULATION
82.65
MALES / 100 FEMALES
120.99
FEMALES / 100 MALES
28.9
MEDIAN AGE
2.8
AVG FAMILY SIZE
2.5
AVG HOUSEHOLD SIZE
97
LABOR FORCE [ PEOPLE ]
74.6%
PERCENT IN LABOR FORCE
18.9%
UNEMPLOYMENT RATE
Highwood Zip Codes
Highwood Area Codes
Income in Highwood
Income Overview in Highwood
Per Capita Income in Highwood is $29,492, while median incomes of families and households are $73,750 and $50,750 respectively.
| Characteristic | Number | Measure |
| Per Capita Income | 179 | $29,492 |
| Median Family Income | 55 | $73,750 |
| Mean Family Income | 55 | $81,362 |
| Median Household Income | 73 | $50,750 |
| Mean Household Income | 73 | $71,792 |
| Income Deficit | 55 | $0 |
| Wage / Income Gap (%) | 179 | 21.69% |
| Wage / Income Gap ($) | 179 | 78.31¢ per $1 |
| Gini / Inequality Index | 179 | 0.39 |
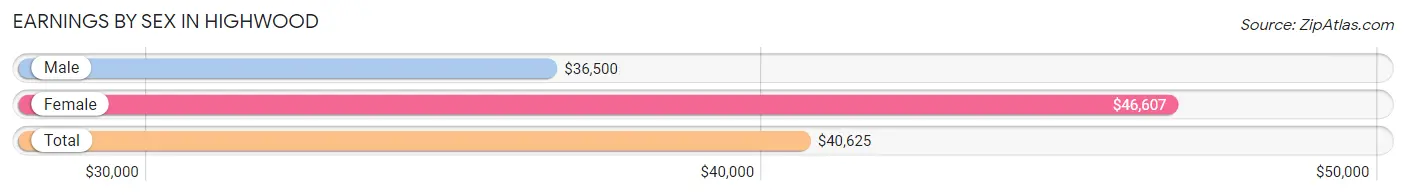
Earnings by Sex in Highwood
Average Earnings in Highwood are $40,625, $36,500 for men and $46,607 for women, a difference of 21.7%.
| Sex | Number | Average Earnings |
| Male | 48 (57.8%) | $36,500 |
| Female | 35 (42.2%) | $46,607 |
| Total | 83 (100.0%) | $40,625 |
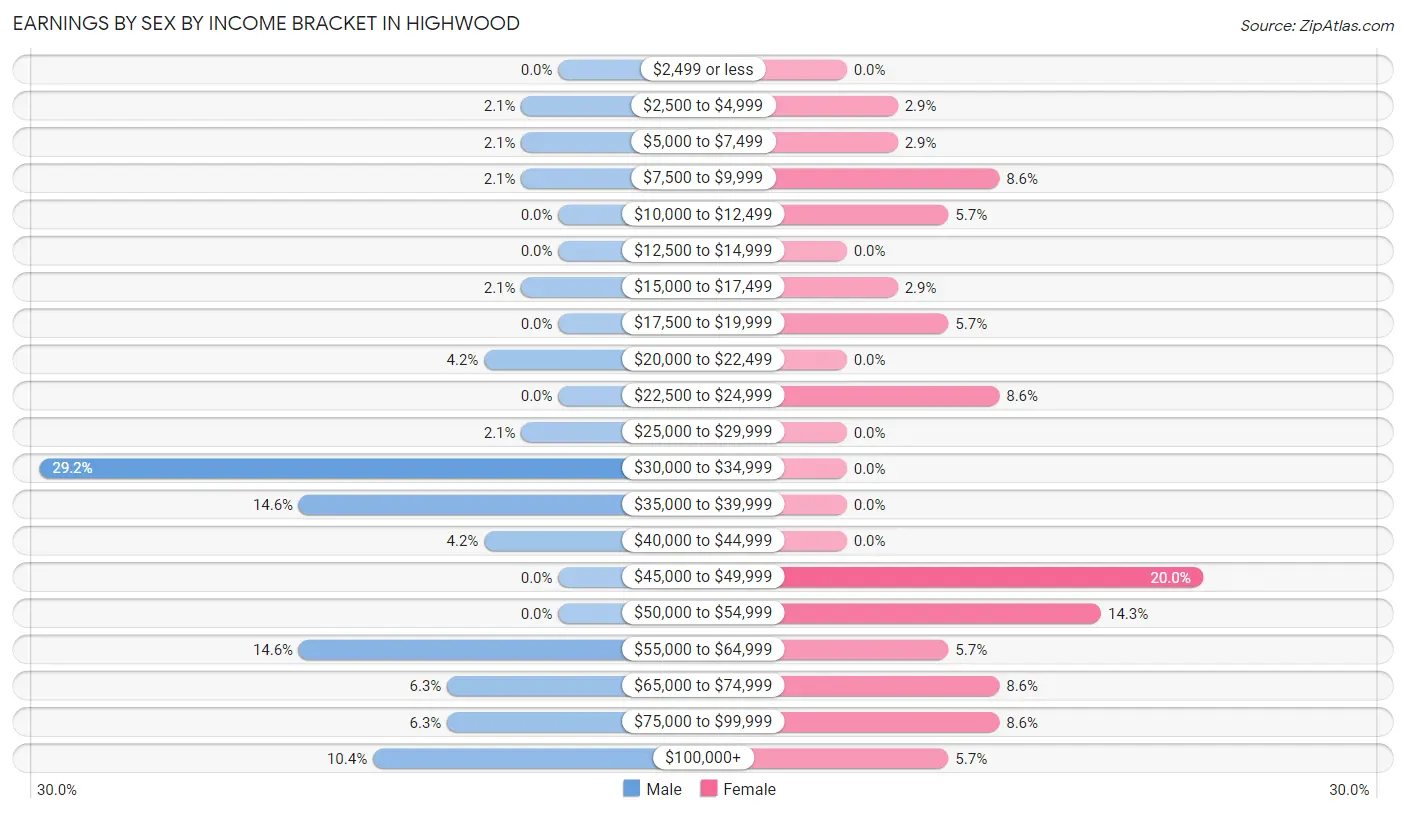
Earnings by Sex by Income Bracket in Highwood
The most common earnings brackets in Highwood are $30,000 to $34,999 for men (14 | 29.2%) and $45,000 to $49,999 for women (7 | 20.0%).
| Income | Male | Female |
| $2,499 or less | 0 (0.0%) | 0 (0.0%) |
| $2,500 to $4,999 | 1 (2.1%) | 1 (2.9%) |
| $5,000 to $7,499 | 1 (2.1%) | 1 (2.9%) |
| $7,500 to $9,999 | 1 (2.1%) | 3 (8.6%) |
| $10,000 to $12,499 | 0 (0.0%) | 2 (5.7%) |
| $12,500 to $14,999 | 0 (0.0%) | 0 (0.0%) |
| $15,000 to $17,499 | 1 (2.1%) | 1 (2.9%) |
| $17,500 to $19,999 | 0 (0.0%) | 2 (5.7%) |
| $20,000 to $22,499 | 2 (4.2%) | 0 (0.0%) |
| $22,500 to $24,999 | 0 (0.0%) | 3 (8.6%) |
| $25,000 to $29,999 | 1 (2.1%) | 0 (0.0%) |
| $30,000 to $34,999 | 14 (29.2%) | 0 (0.0%) |
| $35,000 to $39,999 | 7 (14.6%) | 0 (0.0%) |
| $40,000 to $44,999 | 2 (4.2%) | 0 (0.0%) |
| $45,000 to $49,999 | 0 (0.0%) | 7 (20.0%) |
| $50,000 to $54,999 | 0 (0.0%) | 5 (14.3%) |
| $55,000 to $64,999 | 7 (14.6%) | 2 (5.7%) |
| $65,000 to $74,999 | 3 (6.2%) | 3 (8.6%) |
| $75,000 to $99,999 | 3 (6.2%) | 3 (8.6%) |
| $100,000+ | 5 (10.4%) | 2 (5.7%) |
| Total | 48 (100.0%) | 35 (100.0%) |
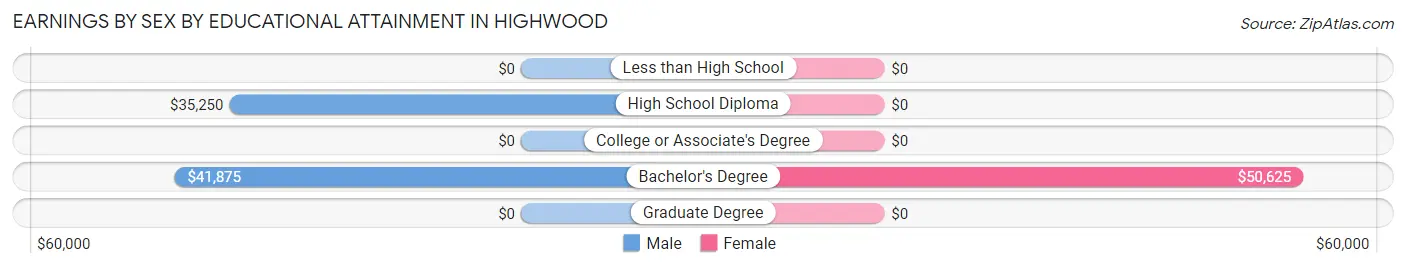
Earnings by Sex by Educational Attainment in Highwood
Average earnings in Highwood are $36,750 for men and $46,964 for women, a difference of 21.7%. Men with an educational attainment of bachelor's degree enjoy the highest average annual earnings of $41,875, while those with high school diploma education earn the least with $35,250. Women with an educational attainment of bachelor's degree earn the most with the average annual earnings of $50,625, while those with bachelor's degree education have the smallest earnings of $50,625.
| Educational Attainment | Male Income | Female Income |
| Less than High School | - | - |
| High School Diploma | $35,250 | $0 |
| College or Associate's Degree | - | - |
| Bachelor's Degree | $41,875 | $50,625 |
| Graduate Degree | - | - |
| Total | $36,750 | $46,964 |
Family Income in Highwood
Family Income Brackets in Highwood
According to the Highwood family income data, there are 18 families falling into the $25,000 to $34,999 income range, which is the most common income bracket and makes up 32.7% of all families.
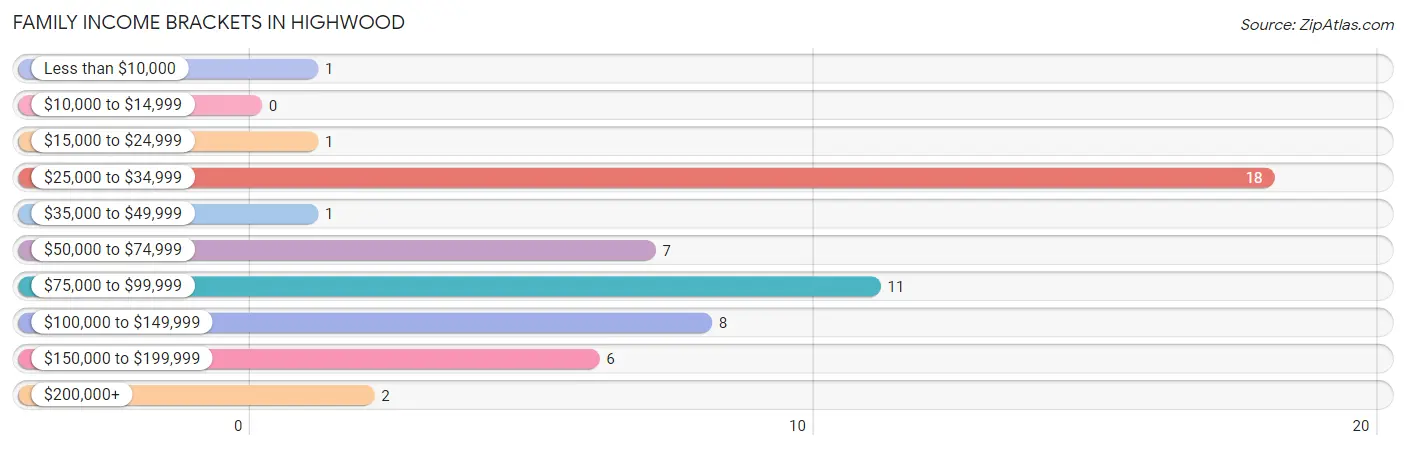
| Income Bracket | # Families | % Families |
| Less than $10,000 | 1 | 1.8% |
| $10,000 to $14,999 | 0 | 0.0% |
| $15,000 to $24,999 | 1 | 1.8% |
| $25,000 to $34,999 | 18 | 32.7% |
| $35,000 to $49,999 | 1 | 1.8% |
| $50,000 to $74,999 | 7 | 12.7% |
| $75,000 to $99,999 | 11 | 20.0% |
| $100,000 to $149,999 | 8 | 14.5% |
| $150,000 to $199,999 | 6 | 10.9% |
| $200,000+ | 2 | 3.6% |
Family Income by Famaliy Size in Highwood
2-person families (21 | 38.2%) account for the highest median family income in Highwood with $145,417 per family, while 2-person families (21 | 38.2%) have the highest median income of $72,708 per family member.
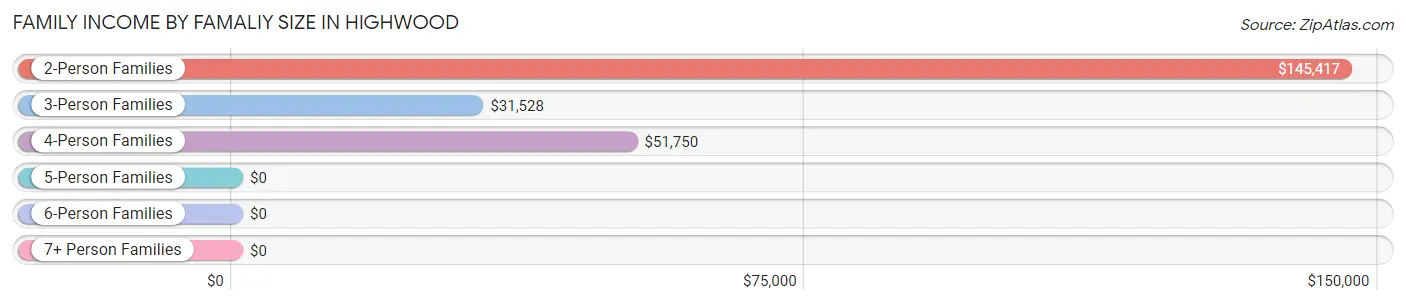
| Income Bracket | # Families | Median Income |
| 2-Person Families | 21 (38.2%) | $145,417 |
| 3-Person Families | 22 (40.0%) | $31,528 |
| 4-Person Families | 9 (16.4%) | $51,750 |
| 5-Person Families | 3 (5.4%) | $0 |
| 6-Person Families | 0 (0.0%) | $0 |
| 7+ Person Families | 0 (0.0%) | $0 |
| Total | 55 (100.0%) | $73,750 |
Family Income by Number of Earners in Highwood
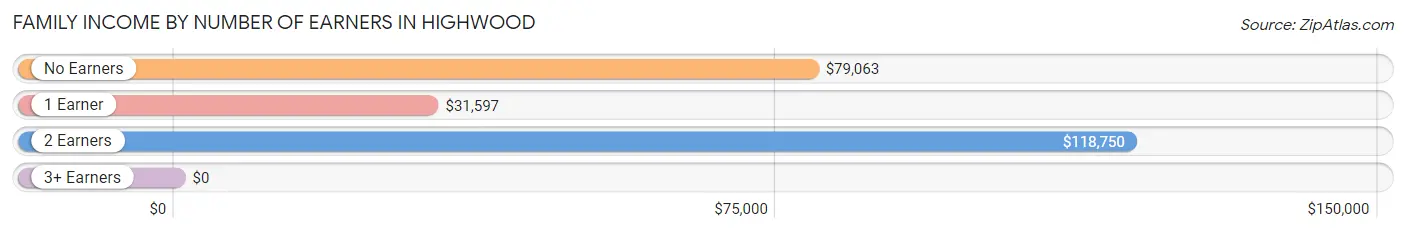
| Number of Earners | # Families | Median Income |
| No Earners | 7 (12.7%) | $79,063 |
| 1 Earner | 25 (45.5%) | $31,597 |
| 2 Earners | 23 (41.8%) | $118,750 |
| 3+ Earners | 0 (0.0%) | $0 |
| Total | 55 (100.0%) | $73,750 |
Household Income in Highwood
Household Income Brackets in Highwood
With 25 households falling in the category, the $25,000 to $34,999 income range is the most frequent in Highwood, accounting for 34.3% of all households.
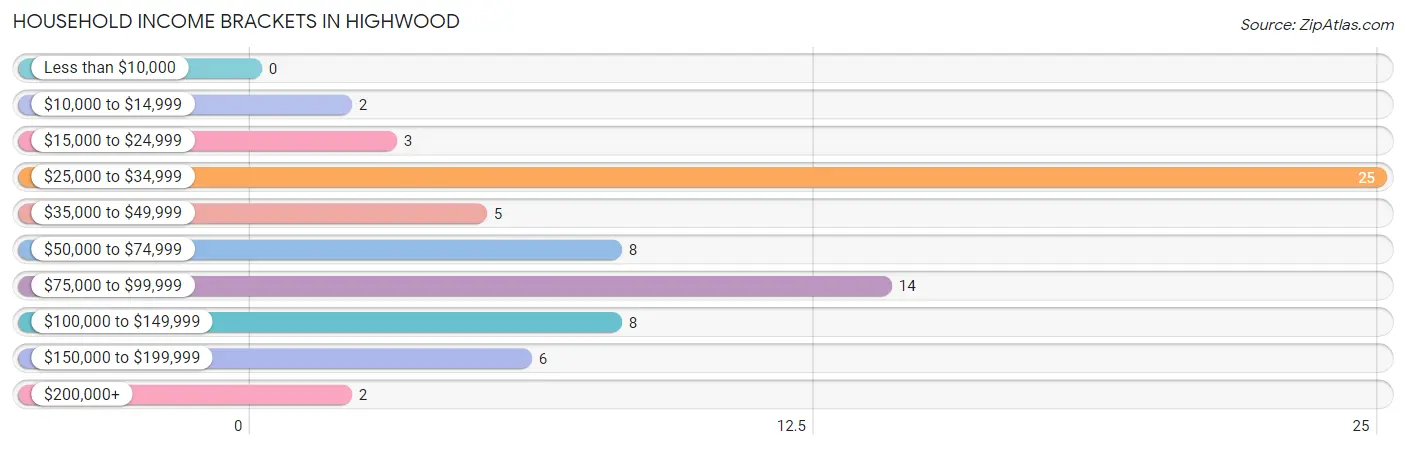
| Income Bracket | # Households | % Households |
| Less than $10,000 | 0 | 0.0% |
| $10,000 to $14,999 | 2 | 2.7% |
| $15,000 to $24,999 | 3 | 4.1% |
| $25,000 to $34,999 | 25 | 34.2% |
| $35,000 to $49,999 | 5 | 6.8% |
| $50,000 to $74,999 | 8 | 11.0% |
| $75,000 to $99,999 | 14 | 19.2% |
| $100,000 to $149,999 | 8 | 11.0% |
| $150,000 to $199,999 | 6 | 8.2% |
| $200,000+ | 2 | 2.7% |
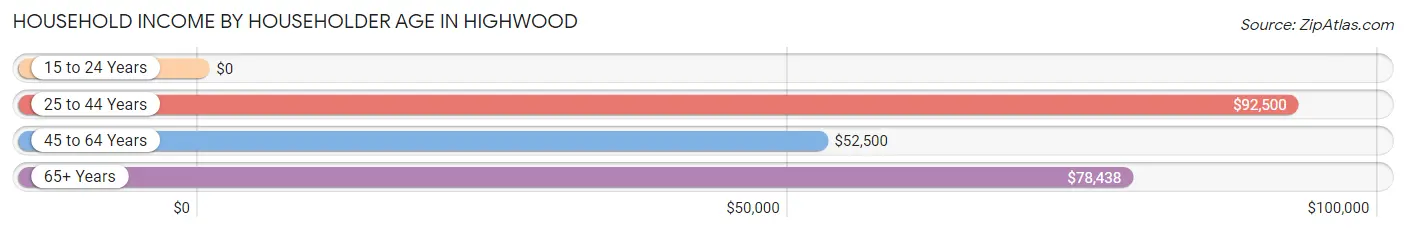
Household Income by Householder Age in Highwood
The median household income in Highwood is $50,750, with the highest median household income of $92,500 found in the 25 to 44 years age bracket for the primary householder. A total of 22 households (30.1%) fall into this category. Meanwhile, the 15 to 24 years age bracket for the primary householder has the lowest median household income of $0, with 18 households (24.7%) in this group.
| Income Bracket | # Households | Median Income |
| 15 to 24 Years | 18 (24.7%) | $0 |
| 25 to 44 Years | 22 (30.1%) | $92,500 |
| 45 to 64 Years | 10 (13.7%) | $52,500 |
| 65+ Years | 23 (31.5%) | $78,438 |
| Total | 73 (100.0%) | $50,750 |
Poverty in Highwood
Income Below Poverty by Sex and Age in Highwood
With 4.9% poverty level for males and 7.1% for females among the residents of Highwood, 16 and 17 year old males and 12 to 14 year old females are the most vulnerable to poverty, with 1 males (100.0%) and 2 females (50.0%) in their respective age groups living below the poverty level.
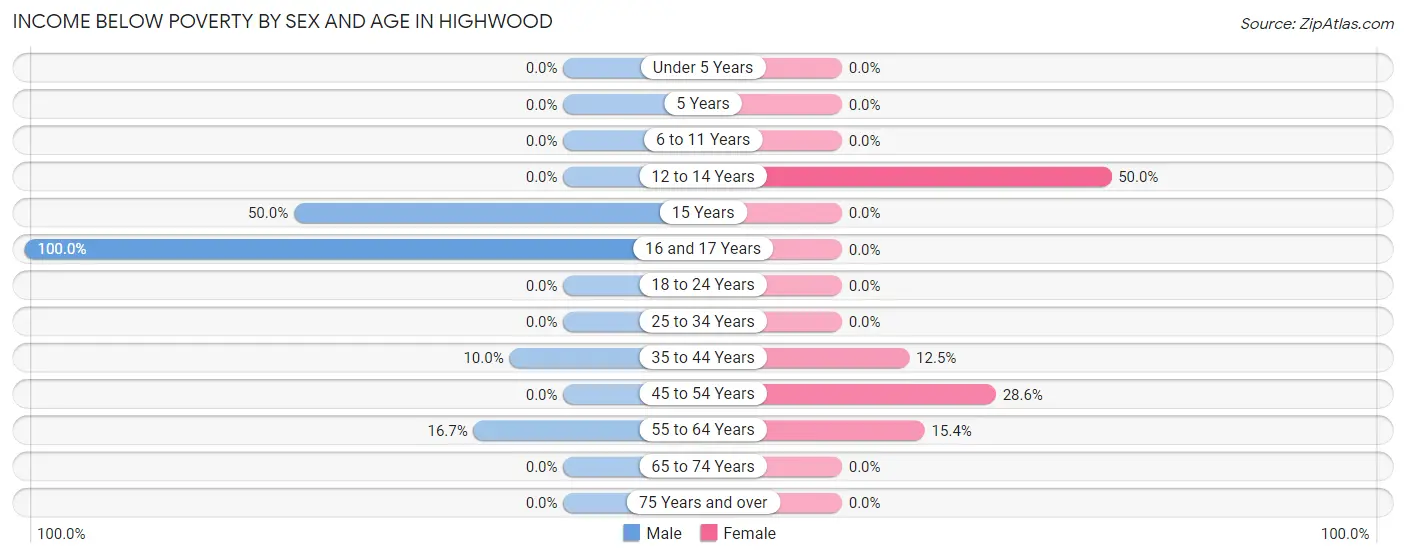
| Age Bracket | Male | Female |
| Under 5 Years | 0 (0.0%) | 0 (0.0%) |
| 5 Years | 0 (0.0%) | 0 (0.0%) |
| 6 to 11 Years | 0 (0.0%) | 0 (0.0%) |
| 12 to 14 Years | 0 (0.0%) | 2 (50.0%) |
| 15 Years | 1 (50.0%) | 0 (0.0%) |
| 16 and 17 Years | 1 (100.0%) | 0 (0.0%) |
| 18 to 24 Years | 0 (0.0%) | 0 (0.0%) |
| 25 to 34 Years | 0 (0.0%) | 0 (0.0%) |
| 35 to 44 Years | 1 (10.0%) | 1 (12.5%) |
| 45 to 54 Years | 0 (0.0%) | 2 (28.6%) |
| 55 to 64 Years | 1 (16.7%) | 2 (15.4%) |
| 65 to 74 Years | 0 (0.0%) | 0 (0.0%) |
| 75 Years and over | 0 (0.0%) | 0 (0.0%) |
| Total | 4 (4.9%) | 7 (7.1%) |
Income Above Poverty by Sex and Age in Highwood
According to the poverty statistics in Highwood, males aged under 5 years and females aged under 5 years are the age groups that are most secure financially, with 100.0% of males and 100.0% of females in these age groups living above the poverty line.
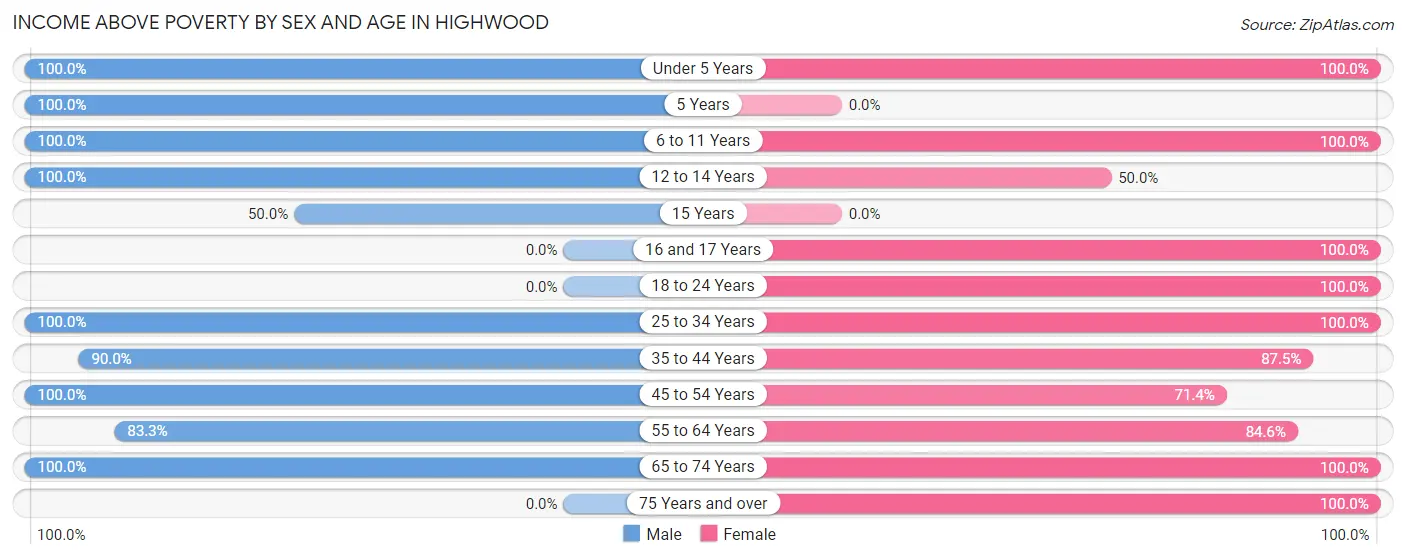
| Age Bracket | Male | Female |
| Under 5 Years | 6 (100.0%) | 12 (100.0%) |
| 5 Years | 7 (100.0%) | 0 (0.0%) |
| 6 to 11 Years | 5 (100.0%) | 11 (100.0%) |
| 12 to 14 Years | 2 (100.0%) | 2 (50.0%) |
| 15 Years | 1 (50.0%) | 0 (0.0%) |
| 16 and 17 Years | 0 (0.0%) | 2 (100.0%) |
| 18 to 24 Years | 0 (0.0%) | 18 (100.0%) |
| 25 to 34 Years | 27 (100.0%) | 10 (100.0%) |
| 35 to 44 Years | 9 (90.0%) | 7 (87.5%) |
| 45 to 54 Years | 2 (100.0%) | 5 (71.4%) |
| 55 to 64 Years | 5 (83.3%) | 11 (84.6%) |
| 65 to 74 Years | 13 (100.0%) | 11 (100.0%) |
| 75 Years and over | 0 (0.0%) | 2 (100.0%) |
| Total | 77 (95.1%) | 91 (92.9%) |
Income Below Poverty Among Married-Couple Families in Highwood
The poverty statistics for married-couple families in Highwood show that 1.9% or 1 of the total 52 families live below the poverty line. Families with no children have the highest poverty rate of 5.0%, comprising of 1 families. On the other hand, families with 1 or 2 children have the lowest poverty rate of 0.0%, which includes 0 families.
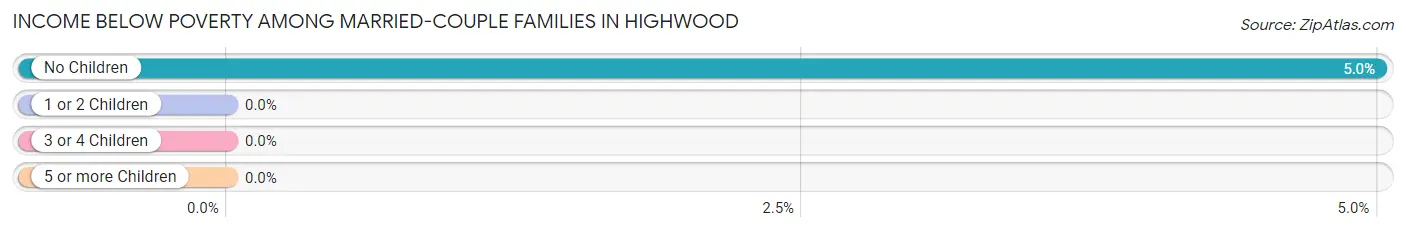
| Children | Above Poverty | Below Poverty |
| No Children | 19 (95.0%) | 1 (5.0%) |
| 1 or 2 Children | 29 (100.0%) | 0 (0.0%) |
| 3 or 4 Children | 3 (100.0%) | 0 (0.0%) |
| 5 or more Children | 0 (0.0%) | 0 (0.0%) |
| Total | 51 (98.1%) | 1 (1.9%) |
Income Below Poverty Among Single-Parent Households in Highwood
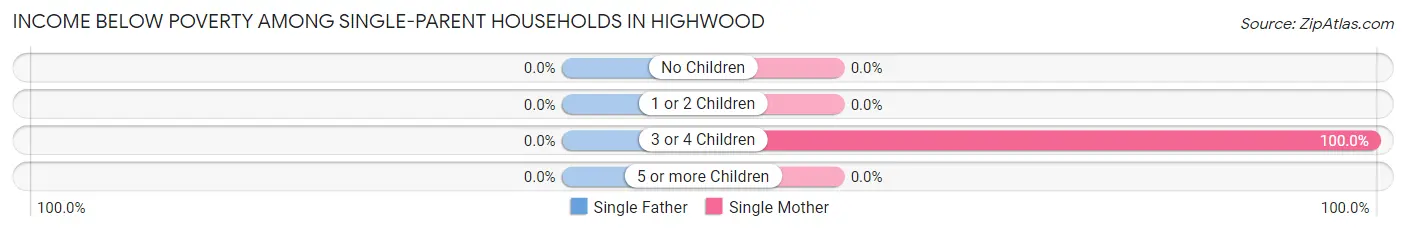
| Children | Single Father | Single Mother |
| No Children | 0 (0.0%) | 0 (0.0%) |
| 1 or 2 Children | 0 (0.0%) | 0 (0.0%) |
| 3 or 4 Children | 0 (0.0%) | 1 (100.0%) |
| 5 or more Children | 0 (0.0%) | 0 (0.0%) |
| Total | 0 (0.0%) | 1 (50.0%) |
Income Below Poverty Among Married-Couple vs Single-Parent Households in Highwood
The poverty data for Highwood shows that 1 of the married-couple family households (1.9%) and 1 of the single-parent households (33.3%) are living below the poverty level. Within the married-couple family households, those with no children have the highest poverty rate, with 1 households (5.0%) falling below the poverty line. Among the single-parent households, those with 3 or 4 children have the highest poverty rate, with 1 household (100.0%) living below poverty.
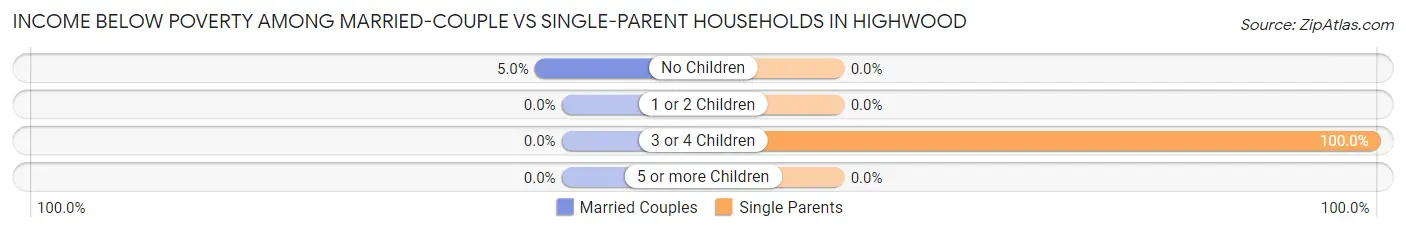
| Children | Married-Couple Families | Single-Parent Households |
| No Children | 1 (5.0%) | 0 (0.0%) |
| 1 or 2 Children | 0 (0.0%) | 0 (0.0%) |
| 3 or 4 Children | 0 (0.0%) | 1 (100.0%) |
| 5 or more Children | 0 (0.0%) | 0 (0.0%) |
| Total | 1 (1.9%) | 1 (33.3%) |
Race in Highwood
The most populous races in Highwood are White / Caucasian (174 | 97.2%), Asian (3 | 1.7%), and Hispanic or Latino (3 | 1.7%).
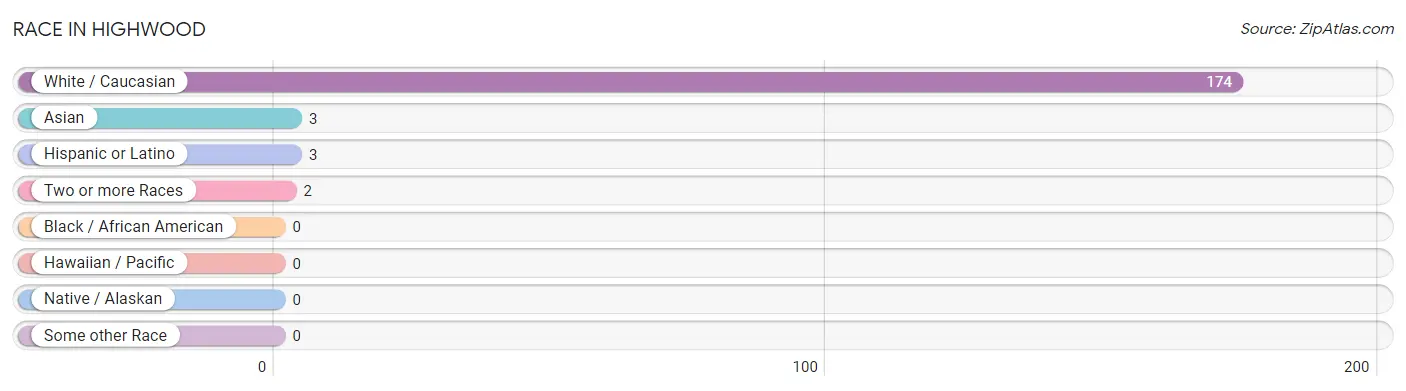
| Race | # Population | % Population |
| Asian | 3 | 1.7% |
| Black / African American | 0 | 0.0% |
| Hawaiian / Pacific | 0 | 0.0% |
| Hispanic or Latino | 3 | 1.7% |
| Native / Alaskan | 0 | 0.0% |
| White / Caucasian | 174 | 97.2% |
| Two or more Races | 2 | 1.1% |
| Some other Race | 0 | 0.0% |
| Total | 179 | 100.0% |
Ancestry in Highwood
The most populous ancestries reported in Highwood are German (54 | 30.2%), Irish (34 | 19.0%), American (24 | 13.4%), English (23 | 12.9%), and Norwegian (23 | 12.9%), together accounting for 88.3% of all Highwood residents.
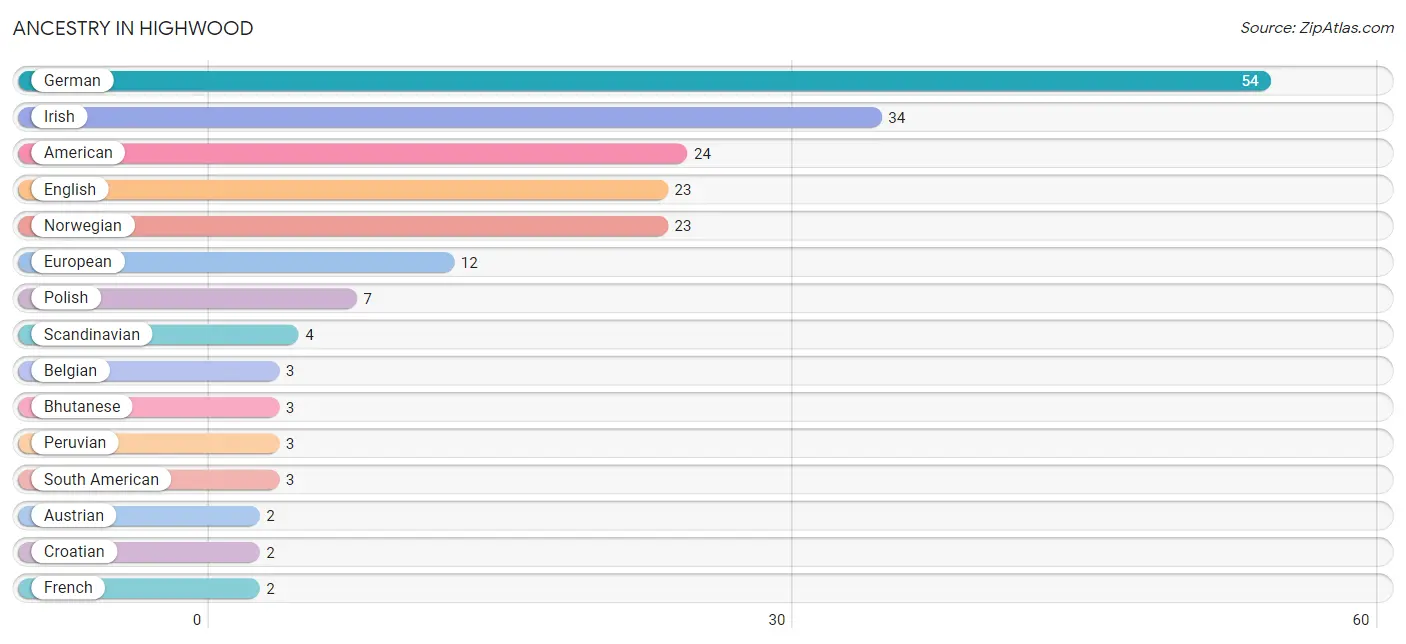
| Ancestry | # Population | % Population |
| American | 24 | 13.4% |
| Apache | 1 | 0.6% |
| Austrian | 2 | 1.1% |
| Belgian | 3 | 1.7% |
| Bhutanese | 3 | 1.7% |
| Croatian | 2 | 1.1% |
| Dutch | 1 | 0.6% |
| English | 23 | 12.9% |
| European | 12 | 6.7% |
| French | 2 | 1.1% |
| German | 54 | 30.2% |
| Irish | 34 | 19.0% |
| Northern European | 1 | 0.6% |
| Norwegian | 23 | 12.9% |
| Paiute | 1 | 0.6% |
| Peruvian | 3 | 1.7% |
| Polish | 7 | 3.9% |
| Portuguese | 1 | 0.6% |
| Russian | 1 | 0.6% |
| Scandinavian | 4 | 2.2% |
| Scotch-Irish | 2 | 1.1% |
| Scottish | 2 | 1.1% |
| South American | 3 | 1.7% |
| Swedish | 2 | 1.1% |
| Yugoslavian | 2 | 1.1% | View All 25 Rows |
Immigrants in Highwood
The most numerous immigrant groups reported in Highwood came from Latin America (3 | 1.7%), Peru (3 | 1.7%), and South America (3 | 1.7%), together accounting for 5.0% of all Highwood residents.

| Immigration Origin | # Population | % Population |
| Latin America | 3 | 1.7% |
| Peru | 3 | 1.7% |
| South America | 3 | 1.7% | View All 3 Rows |
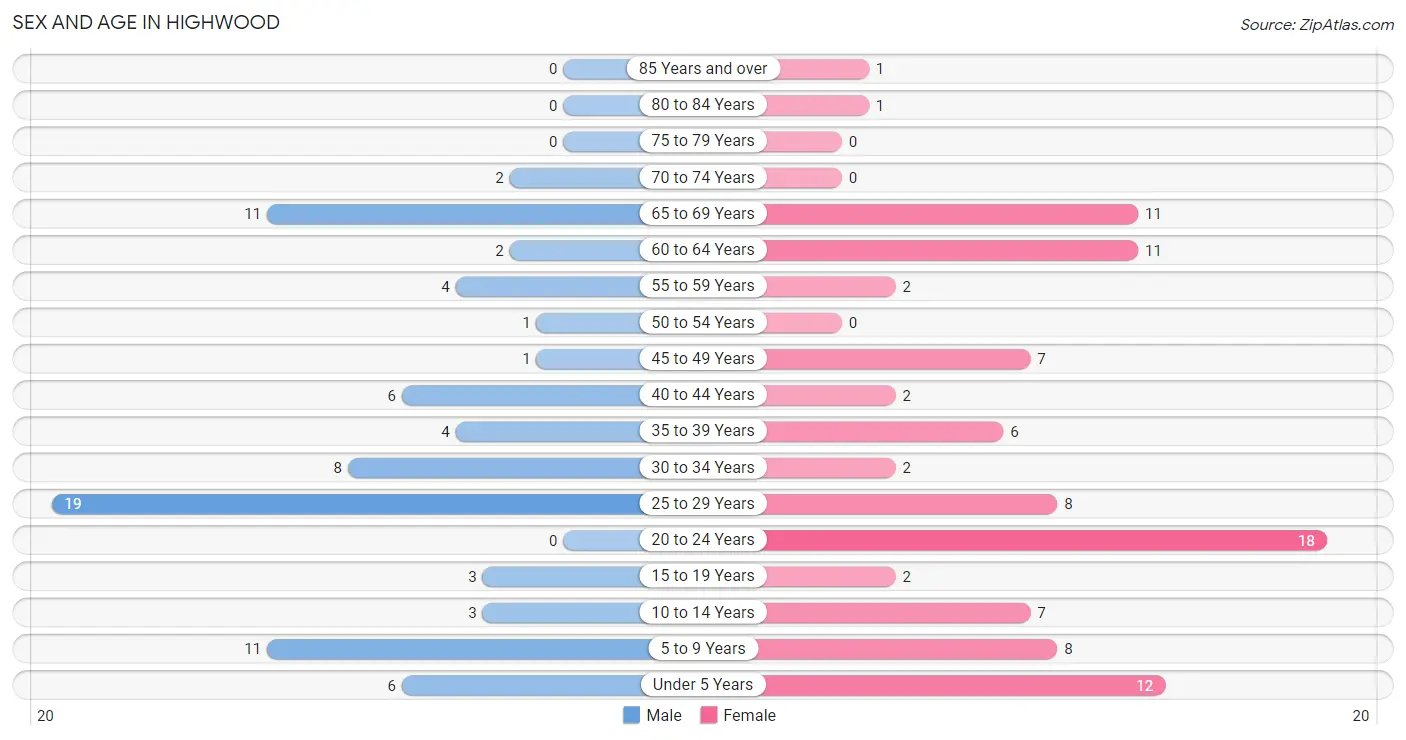
Sex and Age in Highwood
Sex and Age in Highwood
The most populous age groups in Highwood are 25 to 29 Years (19 | 23.5%) for men and 20 to 24 Years (18 | 18.4%) for women.
| Age Bracket | Male | Female |
| Under 5 Years | 6 (7.4%) | 12 (12.2%) |
| 5 to 9 Years | 11 (13.6%) | 8 (8.2%) |
| 10 to 14 Years | 3 (3.7%) | 7 (7.1%) |
| 15 to 19 Years | 3 (3.7%) | 2 (2.0%) |
| 20 to 24 Years | 0 (0.0%) | 18 (18.4%) |
| 25 to 29 Years | 19 (23.5%) | 8 (8.2%) |
| 30 to 34 Years | 8 (9.9%) | 2 (2.0%) |
| 35 to 39 Years | 4 (4.9%) | 6 (6.1%) |
| 40 to 44 Years | 6 (7.4%) | 2 (2.0%) |
| 45 to 49 Years | 1 (1.2%) | 7 (7.1%) |
| 50 to 54 Years | 1 (1.2%) | 0 (0.0%) |
| 55 to 59 Years | 4 (4.9%) | 2 (2.0%) |
| 60 to 64 Years | 2 (2.5%) | 11 (11.2%) |
| 65 to 69 Years | 11 (13.6%) | 11 (11.2%) |
| 70 to 74 Years | 2 (2.5%) | 0 (0.0%) |
| 75 to 79 Years | 0 (0.0%) | 0 (0.0%) |
| 80 to 84 Years | 0 (0.0%) | 1 (1.0%) |
| 85 Years and over | 0 (0.0%) | 1 (1.0%) |
| Total | 81 (100.0%) | 98 (100.0%) |
Families and Households in Highwood
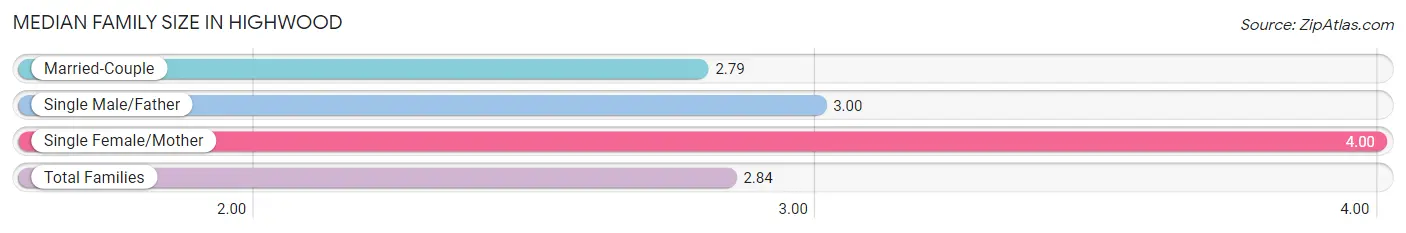
Median Family Size in Highwood
The median family size in Highwood is 2.84 persons per family, with single female/mother families (2 | 3.6%) accounting for the largest median family size of 4 persons per family. On the other hand, married-couple families (52 | 94.6%) represent the smallest median family size with 2.79 persons per family.
| Family Type | # Families | Family Size |
| Married-Couple | 52 (94.6%) | 2.79 |
| Single Male/Father | 1 (1.8%) | 3.00 |
| Single Female/Mother | 2 (3.6%) | 4.00 |
| Total Families | 55 (100.0%) | 2.84 |
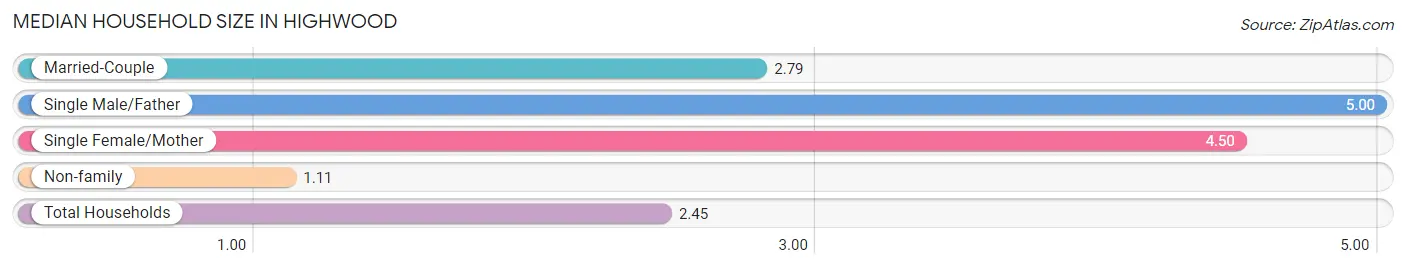
Median Household Size in Highwood
The median household size in Highwood is 2.45 persons per household, with single male/father households (1 | 1.4%) accounting for the largest median household size of 5 persons per household. non-family households (18 | 24.7%) represent the smallest median household size with 1.11 persons per household.
| Household Type | # Households | Household Size |
| Married-Couple | 52 (71.2%) | 2.79 |
| Single Male/Father | 1 (1.4%) | 5.00 |
| Single Female/Mother | 2 (2.7%) | 4.50 |
| Non-family | 18 (24.7%) | 1.11 |
| Total Households | 73 (100.0%) | 2.45 |
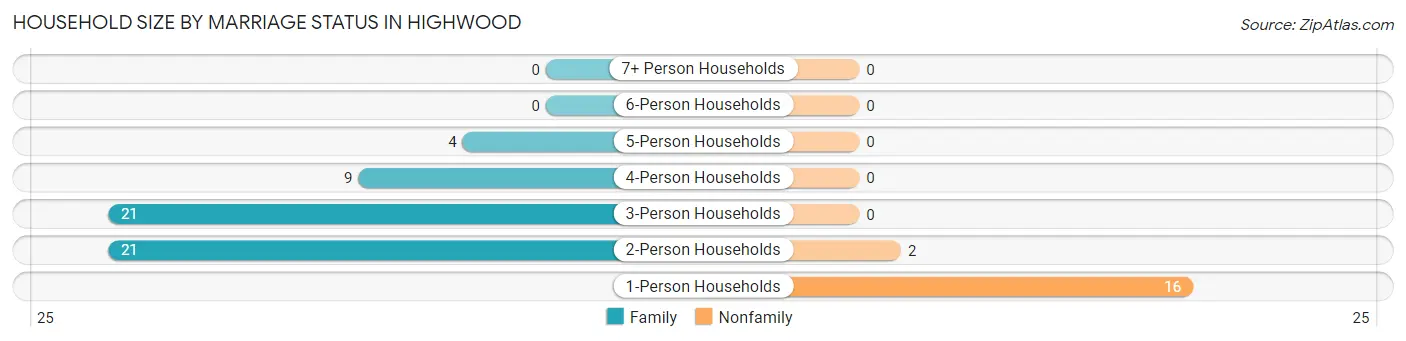
Household Size by Marriage Status in Highwood
Out of a total of 73 households in Highwood, 55 (75.3%) are family households, while 18 (24.7%) are nonfamily households. The most numerous type of family households are 2-person households, comprising 21, and the most common type of nonfamily households are 1-person households, comprising 16.
| Household Size | Family Households | Nonfamily Households |
| 1-Person Households | - | 16 (21.9%) |
| 2-Person Households | 21 (28.8%) | 2 (2.7%) |
| 3-Person Households | 21 (28.8%) | 0 (0.0%) |
| 4-Person Households | 9 (12.3%) | 0 (0.0%) |
| 5-Person Households | 4 (5.5%) | 0 (0.0%) |
| 6-Person Households | 0 (0.0%) | 0 (0.0%) |
| 7+ Person Households | 0 (0.0%) | 0 (0.0%) |
| Total | 55 (75.3%) | 18 (24.7%) |
Female Fertility in Highwood
Fertility by Age in Highwood
Average fertility rate in Highwood is 22.0 births per 1,000 women. Women in the age bracket of 20 to 34 years have the highest fertility rate with 36.0 births per 1,000 women. Women in the age bracket of 20 to 34 years acount for 100.0% of all women with births.
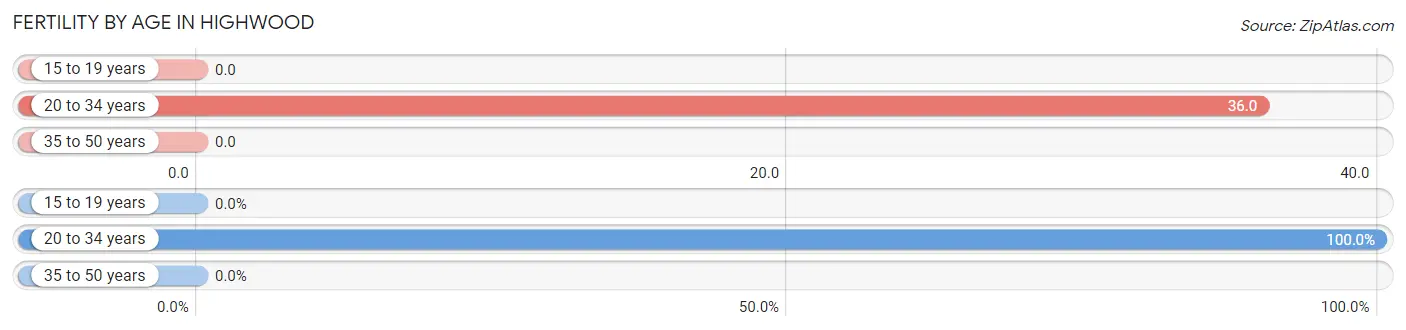
| Age Bracket | Women with Births | Births / 1,000 Women |
| 15 to 19 years | 0 (0.0%) | 0.0 |
| 20 to 34 years | 1 (100.0%) | 36.0 |
| 35 to 50 years | 0 (0.0%) | 0.0 |
| Total | 1 (100.0%) | 22.0 |
Fertility by Age by Marriage Status in Highwood
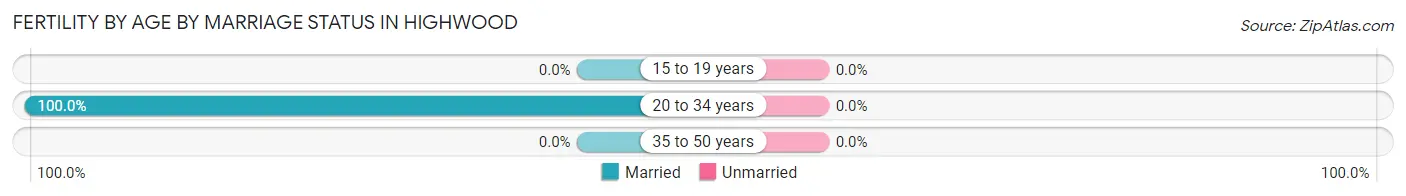
| Age Bracket | Married | Unmarried |
| 15 to 19 years | 0 (0.0%) | 0 (0.0%) |
| 20 to 34 years | 1 (100.0%) | 0 (0.0%) |
| 35 to 50 years | 0 (0.0%) | 0 (0.0%) |
| Total | 1 (100.0%) | 0 (0.0%) |
Fertility by Education in Highwood
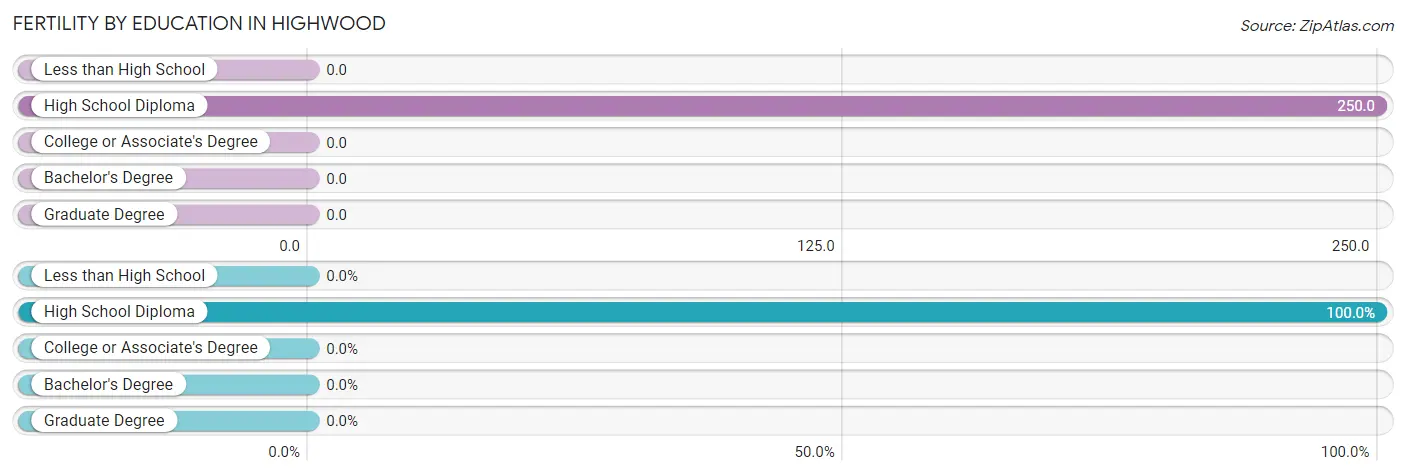
| Educational Attainment | Women with Births | Births / 1,000 Women |
| Less than High School | 0 (0.0%) | 0.0 |
| High School Diploma | 1 (100.0%) | 250.0 |
| College or Associate's Degree | 0 (0.0%) | 0.0 |
| Bachelor's Degree | 0 (0.0%) | 0.0 |
| Graduate Degree | 0 (0.0%) | 0.0 |
| Total | 1 (100.0%) | 22.0 |
Fertility by Education by Marriage Status in Highwood
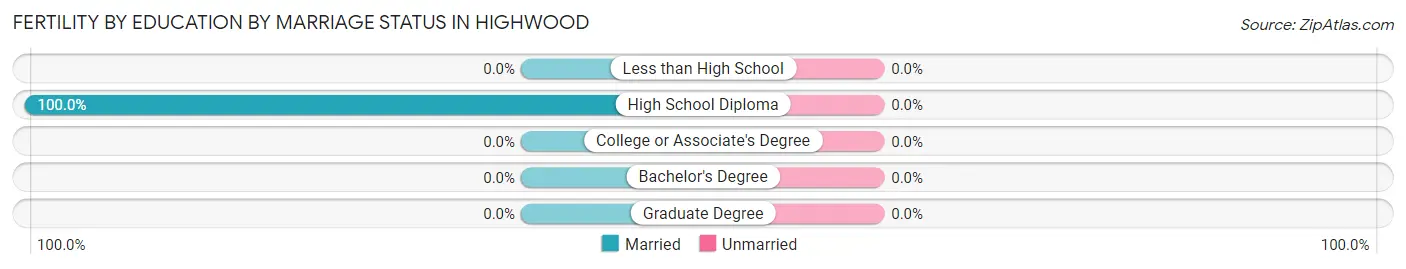
| Educational Attainment | Married | Unmarried |
| Less than High School | 0 (0.0%) | 0 (0.0%) |
| High School Diploma | 1 (100.0%) | 0 (0.0%) |
| College or Associate's Degree | 0 (0.0%) | 0 (0.0%) |
| Bachelor's Degree | 0 (0.0%) | 0 (0.0%) |
| Graduate Degree | 0 (0.0%) | 0 (0.0%) |
| Total | 1 (100.0%) | 0 (0.0%) |
Employment Characteristics in Highwood
Employment by Class of Employer in Highwood
Among the 79 employed individuals in Highwood, private company employees (23 | 29.1%), not-for-profit organizations (23 | 29.1%), and local government employees (16 | 20.3%) make up the most common classes of employment.
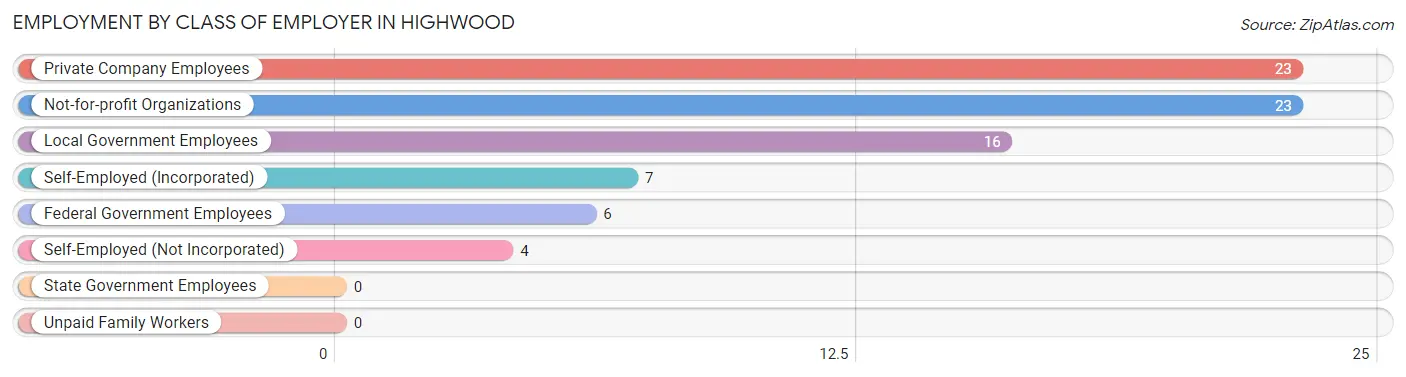
| Employer Class | # Employees | % Employees |
| Private Company Employees | 23 | 29.1% |
| Self-Employed (Incorporated) | 7 | 8.9% |
| Self-Employed (Not Incorporated) | 4 | 5.1% |
| Not-for-profit Organizations | 23 | 29.1% |
| Local Government Employees | 16 | 20.3% |
| State Government Employees | 0 | 0.0% |
| Federal Government Employees | 6 | 7.6% |
| Unpaid Family Workers | 0 | 0.0% |
| Total | 79 | 100.0% |
Employment Status by Age in Highwood
According to the labor force statistics for Highwood, out of the total population over 16 years of age (130), 74.6% or 97 individuals are in the labor force, with 18.9% or 18 of them unemployed. The age group with the highest labor force participation rate is 20 to 24 years, with 100.0% or 18 individuals in the labor force. Within the labor force, the 20 to 24 years age range has the highest percentage of unemployed individuals, with 100.0% or 18 of them being unemployed.
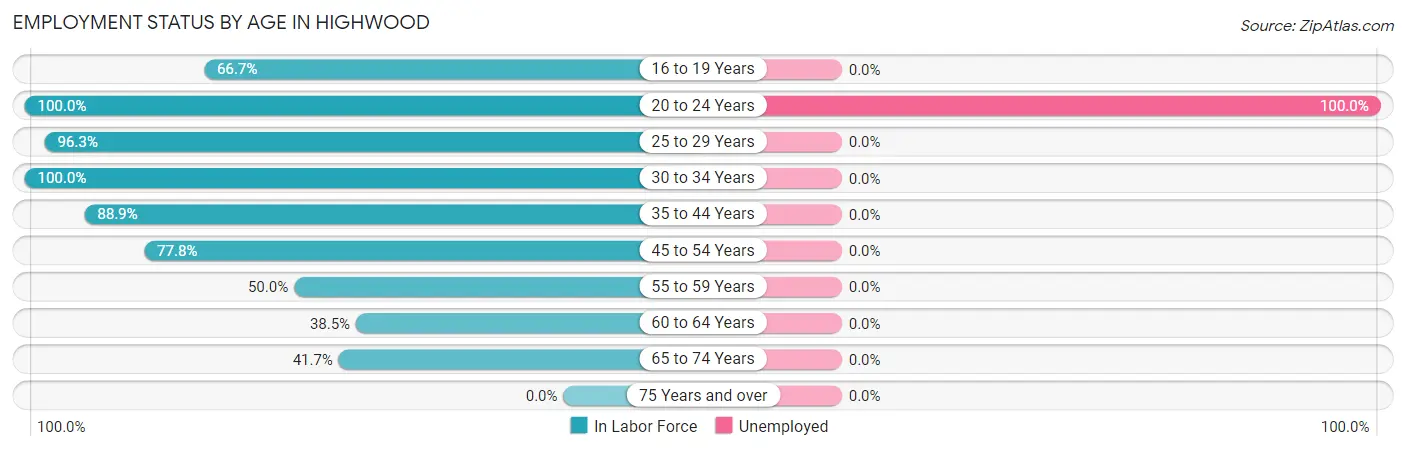
| Age Bracket | In Labor Force | Unemployed |
| 16 to 19 Years | 2 (66.7%) | 0 (0.0%) |
| 20 to 24 Years | 18 (100.0%) | 18 (100.0%) |
| 25 to 29 Years | 26 (96.3%) | 0 (0.0%) |
| 30 to 34 Years | 10 (100.0%) | 0 (0.0%) |
| 35 to 44 Years | 16 (88.9%) | 0 (0.0%) |
| 45 to 54 Years | 7 (77.8%) | 0 (0.0%) |
| 55 to 59 Years | 3 (50.0%) | 0 (0.0%) |
| 60 to 64 Years | 5 (38.5%) | 0 (0.0%) |
| 65 to 74 Years | 10 (41.7%) | 0 (0.0%) |
| 75 Years and over | 0 (0.0%) | 0 (0.0%) |
| Total | 97 (74.6%) | 18 (18.9%) |
Employment Status by Educational Attainment in Highwood
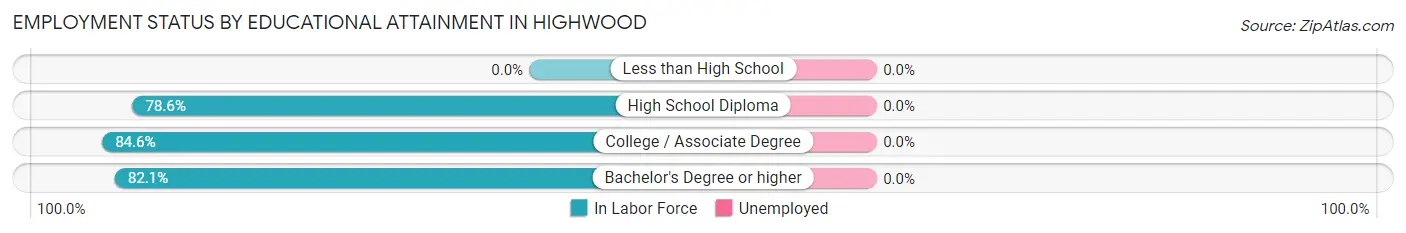
| Educational Attainment | In Labor Force | Unemployed |
| Less than High School | 0 (0.0%) | 0 (0.0%) |
| High School Diploma | 33 (78.6%) | 0 (0.0%) |
| College / Associate Degree | 11 (84.6%) | 0 (0.0%) |
| Bachelor's Degree or higher | 23 (82.1%) | 0 (0.0%) |
| Total | 67 (80.7%) | 0 (0.0%) |
Employment Occupations by Sex in Highwood
Management, Business, Science and Arts Occupations
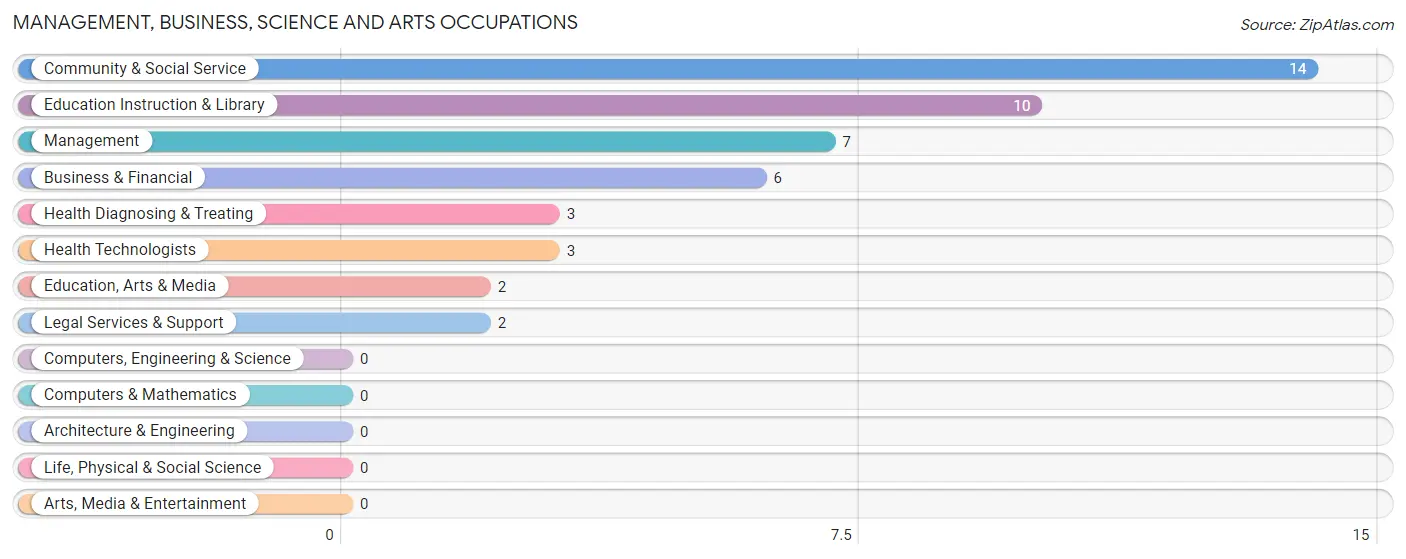
The most common Management, Business, Science and Arts occupations in Highwood are Community & Social Service (14 | 18.2%), Education Instruction & Library (10 | 13.0%), Management (7 | 9.1%), Business & Financial (6 | 7.8%), and Health Diagnosing & Treating (3 | 3.9%).
Management, Business, Science and Arts Occupations by Sex
Within the Management, Business, Science and Arts occupations in Highwood, the most male-oriented occupations are Management (85.7%), Education Instruction & Library (20.0%), and Community & Social Service (14.3%), while the most female-oriented occupations are Business & Financial (100.0%), Education, Arts & Media (100.0%), and Legal Services & Support (100.0%).
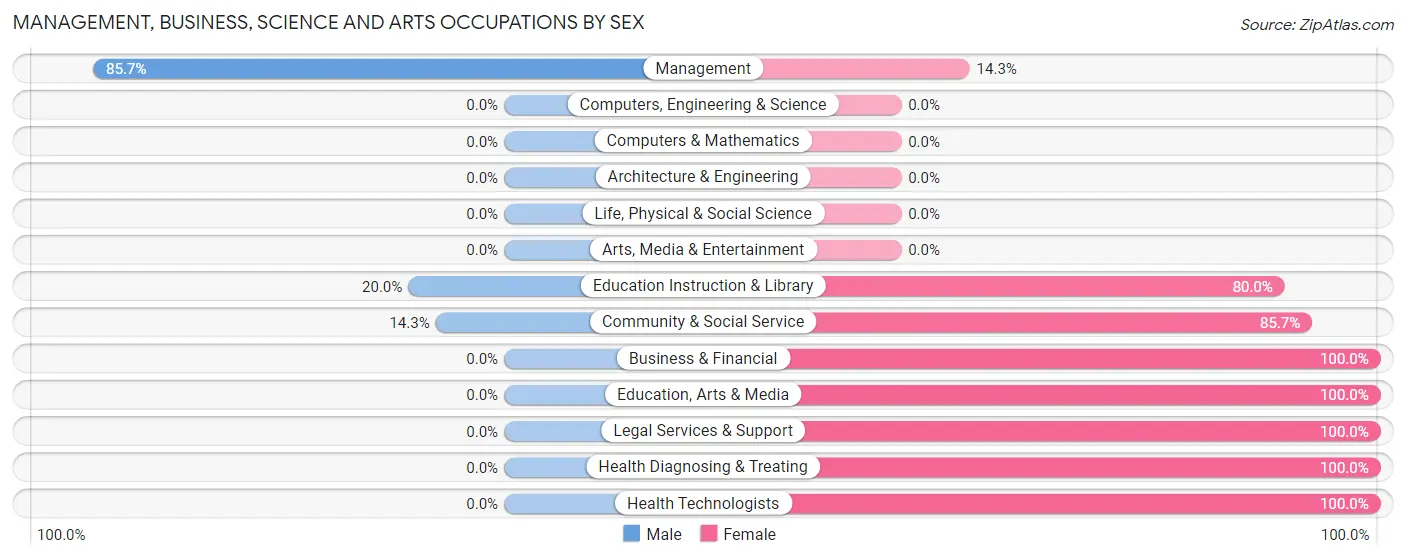
| Occupation | Male | Female |
| Management | 6 (85.7%) | 1 (14.3%) |
| Business & Financial | 0 (0.0%) | 6 (100.0%) |
| Computers, Engineering & Science | 0 (0.0%) | 0 (0.0%) |
| Computers & Mathematics | 0 (0.0%) | 0 (0.0%) |
| Architecture & Engineering | 0 (0.0%) | 0 (0.0%) |
| Life, Physical & Social Science | 0 (0.0%) | 0 (0.0%) |
| Community & Social Service | 2 (14.3%) | 12 (85.7%) |
| Education, Arts & Media | 0 (0.0%) | 2 (100.0%) |
| Legal Services & Support | 0 (0.0%) | 2 (100.0%) |
| Education Instruction & Library | 2 (20.0%) | 8 (80.0%) |
| Arts, Media & Entertainment | 0 (0.0%) | 0 (0.0%) |
| Health Diagnosing & Treating | 0 (0.0%) | 3 (100.0%) |
| Health Technologists | 0 (0.0%) | 3 (100.0%) |
| Total (Category) | 8 (26.7%) | 22 (73.3%) |
| Total (Overall) | 47 (61.0%) | 30 (39.0%) |
Services Occupations
The most common Services occupations in Highwood are , and Cleaning & Maintenance (3 | 3.9%).
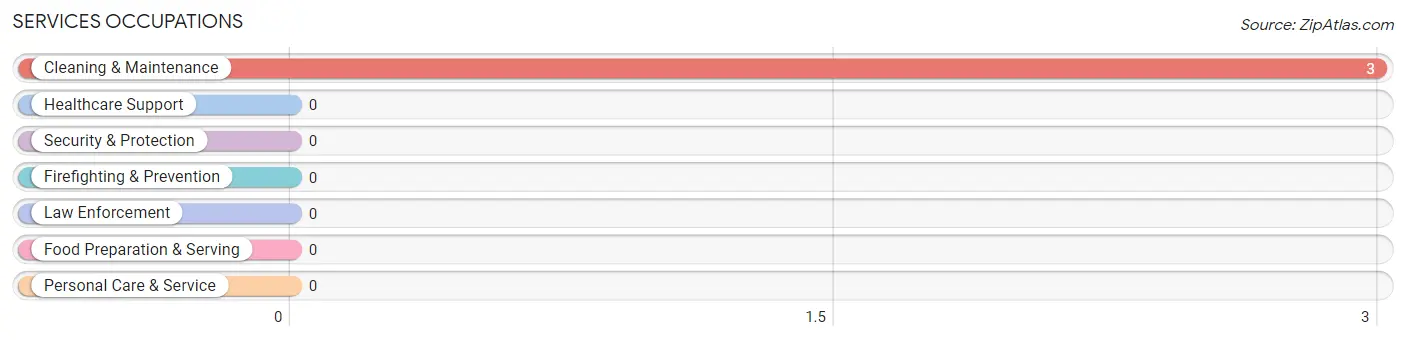
Services Occupations by Sex
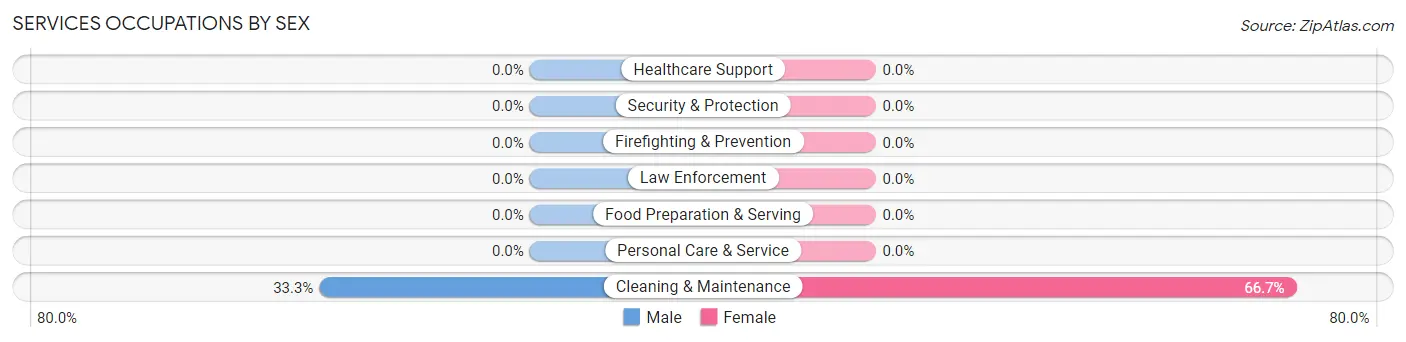
| Occupation | Male | Female |
| Healthcare Support | 0 (0.0%) | 0 (0.0%) |
| Security & Protection | 0 (0.0%) | 0 (0.0%) |
| Firefighting & Prevention | 0 (0.0%) | 0 (0.0%) |
| Law Enforcement | 0 (0.0%) | 0 (0.0%) |
| Food Preparation & Serving | 0 (0.0%) | 0 (0.0%) |
| Cleaning & Maintenance | 1 (33.3%) | 2 (66.7%) |
| Personal Care & Service | 0 (0.0%) | 0 (0.0%) |
| Total (Category) | 1 (33.3%) | 2 (66.7%) |
| Total (Overall) | 47 (61.0%) | 30 (39.0%) |
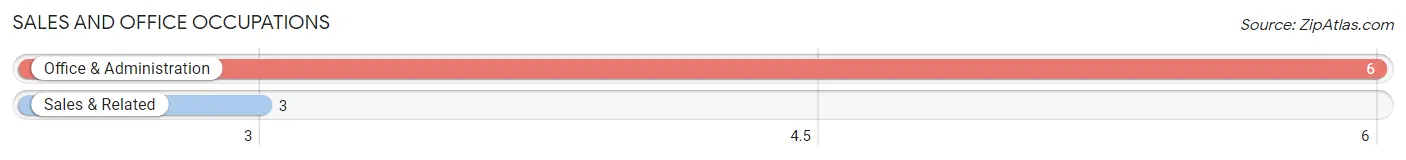
Sales and Office Occupations
The most common Sales and Office occupations in Highwood are Office & Administration (6 | 7.8%), and Sales & Related (3 | 3.9%).
Sales and Office Occupations by Sex
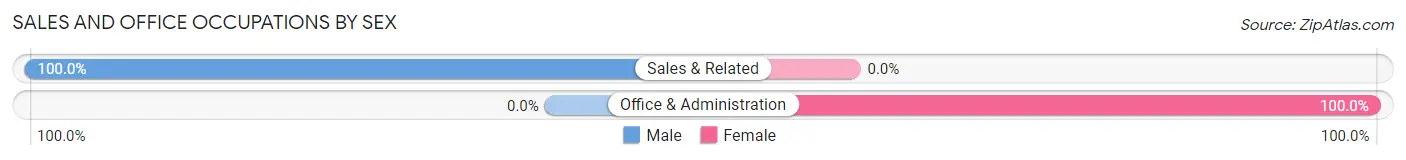
| Occupation | Male | Female |
| Sales & Related | 3 (100.0%) | 0 (0.0%) |
| Office & Administration | 0 (0.0%) | 6 (100.0%) |
| Total (Category) | 3 (33.3%) | 6 (66.7%) |
| Total (Overall) | 47 (61.0%) | 30 (39.0%) |
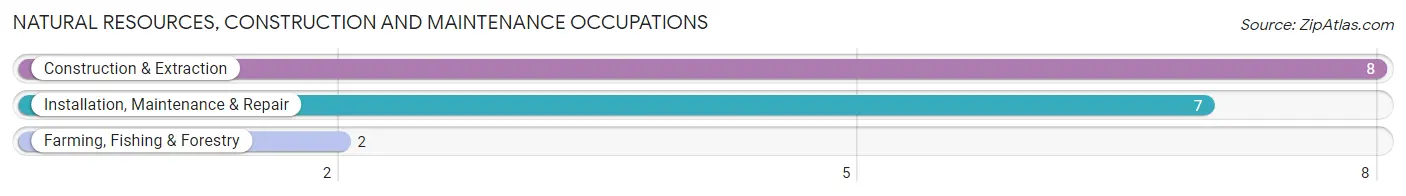
Natural Resources, Construction and Maintenance Occupations
The most common Natural Resources, Construction and Maintenance occupations in Highwood are Construction & Extraction (8 | 10.4%), Installation, Maintenance & Repair (7 | 9.1%), and Farming, Fishing & Forestry (2 | 2.6%).
Natural Resources, Construction and Maintenance Occupations by Sex
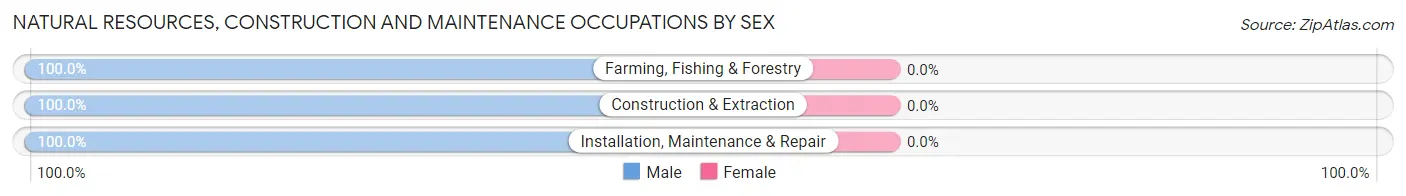
| Occupation | Male | Female |
| Farming, Fishing & Forestry | 2 (100.0%) | 0 (0.0%) |
| Construction & Extraction | 8 (100.0%) | 0 (0.0%) |
| Installation, Maintenance & Repair | 7 (100.0%) | 0 (0.0%) |
| Total (Category) | 17 (100.0%) | 0 (0.0%) |
| Total (Overall) | 47 (61.0%) | 30 (39.0%) |
Production, Transportation and Moving Occupations
The most common Production, Transportation and Moving occupations in Highwood are , and Transportation (18 | 23.4%).
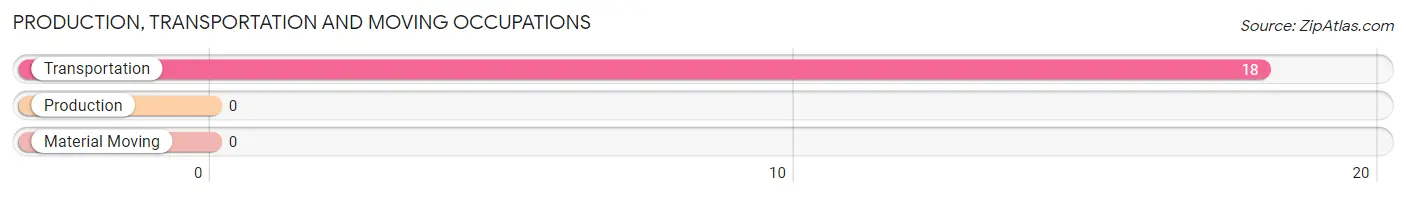
Production, Transportation and Moving Occupations by Sex
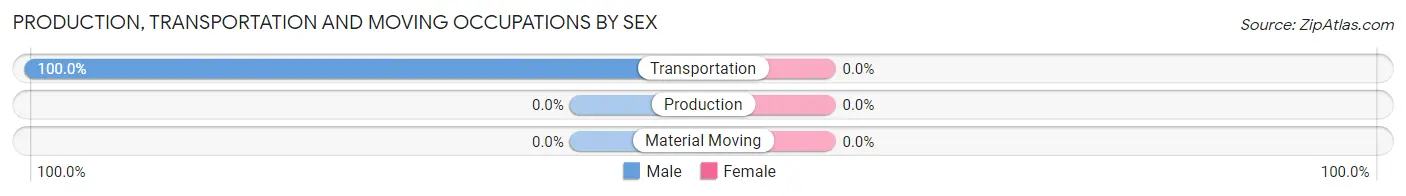
| Occupation | Male | Female |
| Production | 0 (0.0%) | 0 (0.0%) |
| Transportation | 18 (100.0%) | 0 (0.0%) |
| Material Moving | 0 (0.0%) | 0 (0.0%) |
| Total (Category) | 18 (100.0%) | 0 (0.0%) |
| Total (Overall) | 47 (61.0%) | 30 (39.0%) |
Employment Industries by Sex in Highwood
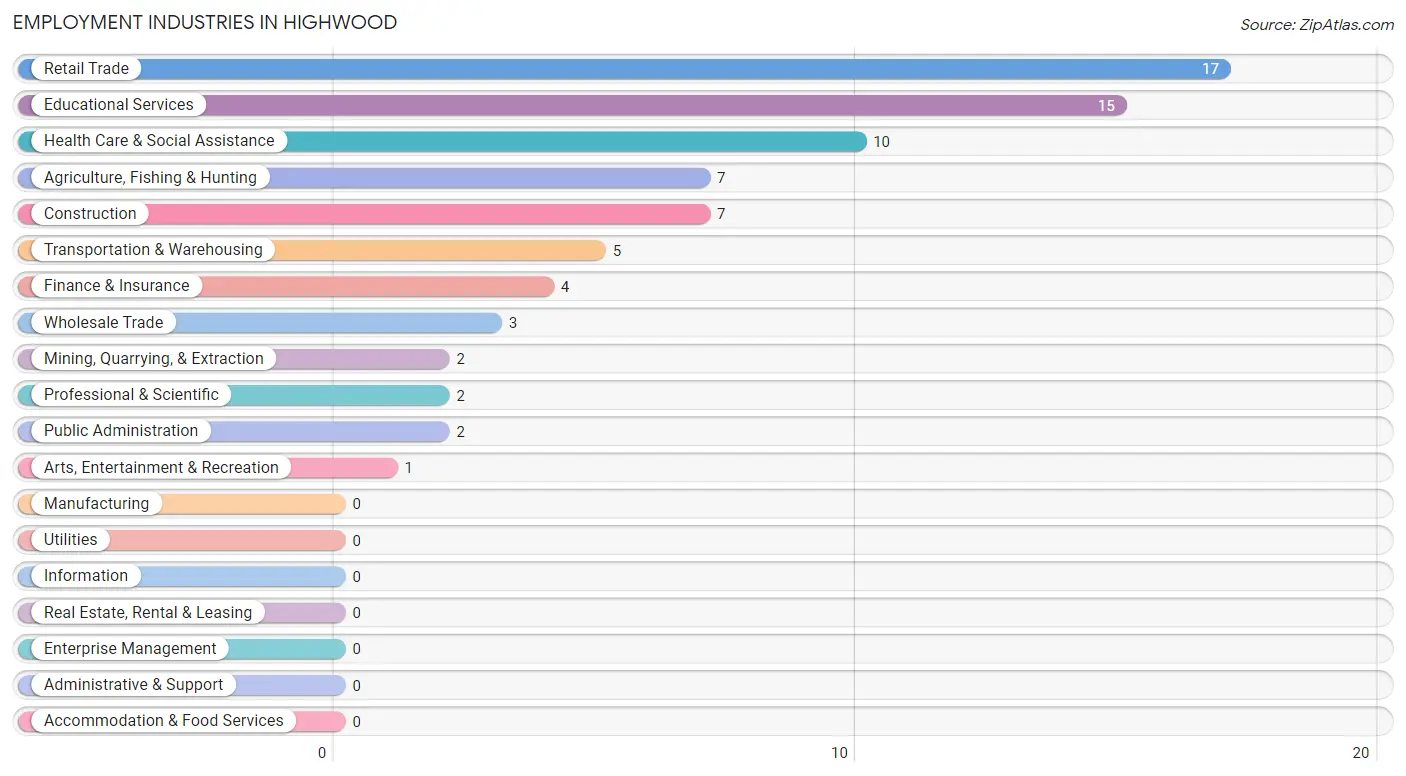
Employment Industries in Highwood
The major employment industries in Highwood include Retail Trade (17 | 22.1%), Educational Services (15 | 19.5%), Health Care & Social Assistance (10 | 13.0%), Agriculture, Fishing & Hunting (7 | 9.1%), and Construction (7 | 9.1%).
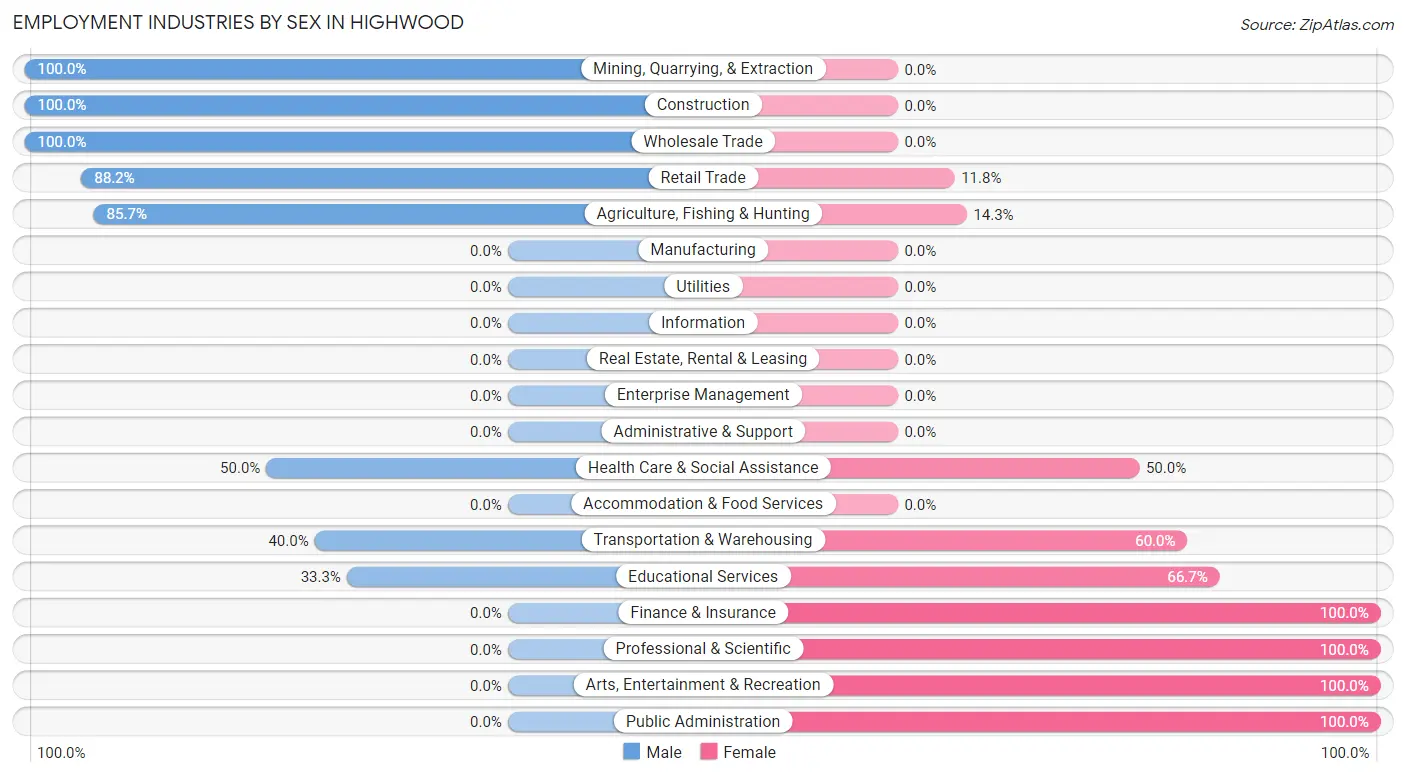
Employment Industries by Sex in Highwood
The Highwood industries that see more men than women are Mining, Quarrying, & Extraction (100.0%), Construction (100.0%), and Wholesale Trade (100.0%), whereas the industries that tend to have a higher number of women are Finance & Insurance (100.0%), Professional & Scientific (100.0%), and Arts, Entertainment & Recreation (100.0%).
| Industry | Male | Female |
| Agriculture, Fishing & Hunting | 6 (85.7%) | 1 (14.3%) |
| Mining, Quarrying, & Extraction | 2 (100.0%) | 0 (0.0%) |
| Construction | 7 (100.0%) | 0 (0.0%) |
| Manufacturing | 0 (0.0%) | 0 (0.0%) |
| Wholesale Trade | 3 (100.0%) | 0 (0.0%) |
| Retail Trade | 15 (88.2%) | 2 (11.8%) |
| Transportation & Warehousing | 2 (40.0%) | 3 (60.0%) |
| Utilities | 0 (0.0%) | 0 (0.0%) |
| Information | 0 (0.0%) | 0 (0.0%) |
| Finance & Insurance | 0 (0.0%) | 4 (100.0%) |
| Real Estate, Rental & Leasing | 0 (0.0%) | 0 (0.0%) |
| Professional & Scientific | 0 (0.0%) | 2 (100.0%) |
| Enterprise Management | 0 (0.0%) | 0 (0.0%) |
| Administrative & Support | 0 (0.0%) | 0 (0.0%) |
| Educational Services | 5 (33.3%) | 10 (66.7%) |
| Health Care & Social Assistance | 5 (50.0%) | 5 (50.0%) |
| Arts, Entertainment & Recreation | 0 (0.0%) | 1 (100.0%) |
| Accommodation & Food Services | 0 (0.0%) | 0 (0.0%) |
| Public Administration | 0 (0.0%) | 2 (100.0%) |
| Total | 47 (61.0%) | 30 (39.0%) |
Education in Highwood
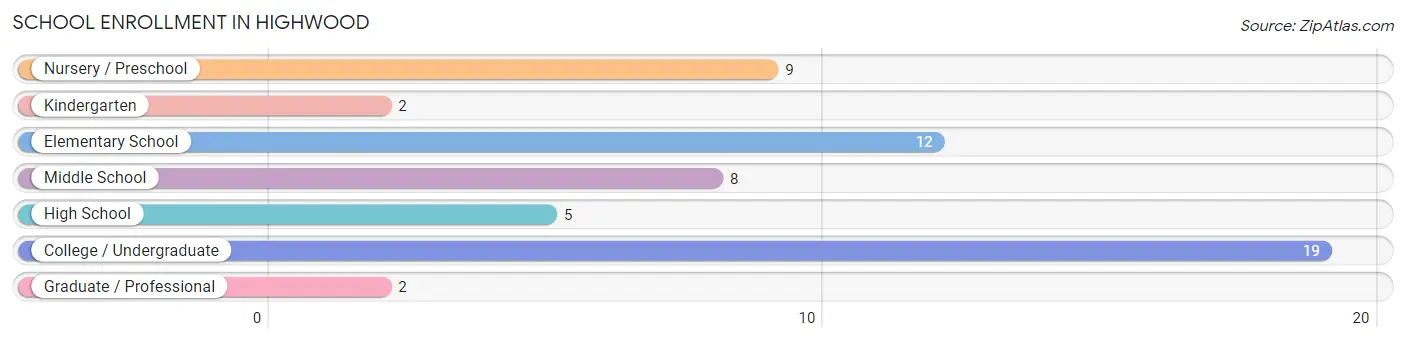
School Enrollment in Highwood
The most common levels of schooling among the 57 students in Highwood are college / undergraduate (19 | 33.3%), elementary school (12 | 21.0%), and nursery / preschool (9 | 15.8%).
| School Level | # Students | % Students |
| Nursery / Preschool | 9 | 15.8% |
| Kindergarten | 2 | 3.5% |
| Elementary School | 12 | 21.0% |
| Middle School | 8 | 14.0% |
| High School | 5 | 8.8% |
| College / Undergraduate | 19 | 33.3% |
| Graduate / Professional | 2 | 3.5% |
| Total | 57 | 100.0% |
School Enrollment by Age by Funding Source in Highwood
Out of a total of 57 students who are enrolled in schools in Highwood, 5 (8.8%) attend a private institution, while the remaining 52 (91.2%) are enrolled in public schools. The age group of 5 to 9 year old has the highest likelihood of being enrolled in private schools, with 5 (26.3% in the age bracket) enrolled. Conversely, the age group of 3 to 4 year olds has the lowest likelihood of being enrolled in a private school, with 2 (100.0% in the age bracket) attending a public institution.
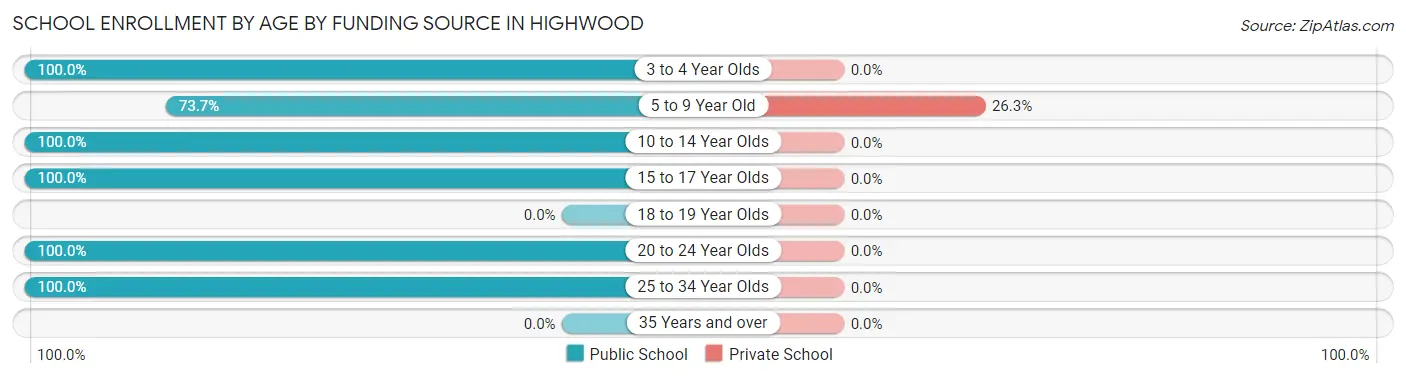
| Age Bracket | Public School | Private School |
| 3 to 4 Year Olds | 2 (100.0%) | 0 (0.0%) |
| 5 to 9 Year Old | 14 (73.7%) | 5 (26.3%) |
| 10 to 14 Year Olds | 10 (100.0%) | 0 (0.0%) |
| 15 to 17 Year Olds | 5 (100.0%) | 0 (0.0%) |
| 18 to 19 Year Olds | 0 (0.0%) | 0 (0.0%) |
| 20 to 24 Year Olds | 18 (100.0%) | 0 (0.0%) |
| 25 to 34 Year Olds | 3 (100.0%) | 0 (0.0%) |
| 35 Years and over | 0 (0.0%) | 0 (0.0%) |
| Total | 52 (91.2%) | 5 (8.8%) |
Educational Attainment by Field of Study in Highwood
Education (12 | 33.3%), bio, nature & agricultural (7 | 19.4%), literature & languages (4 | 11.1%), psychology (3 | 8.3%), and business (2 | 5.6%) are the most common fields of study among 36 individuals in Highwood who have obtained a bachelor's degree or higher.
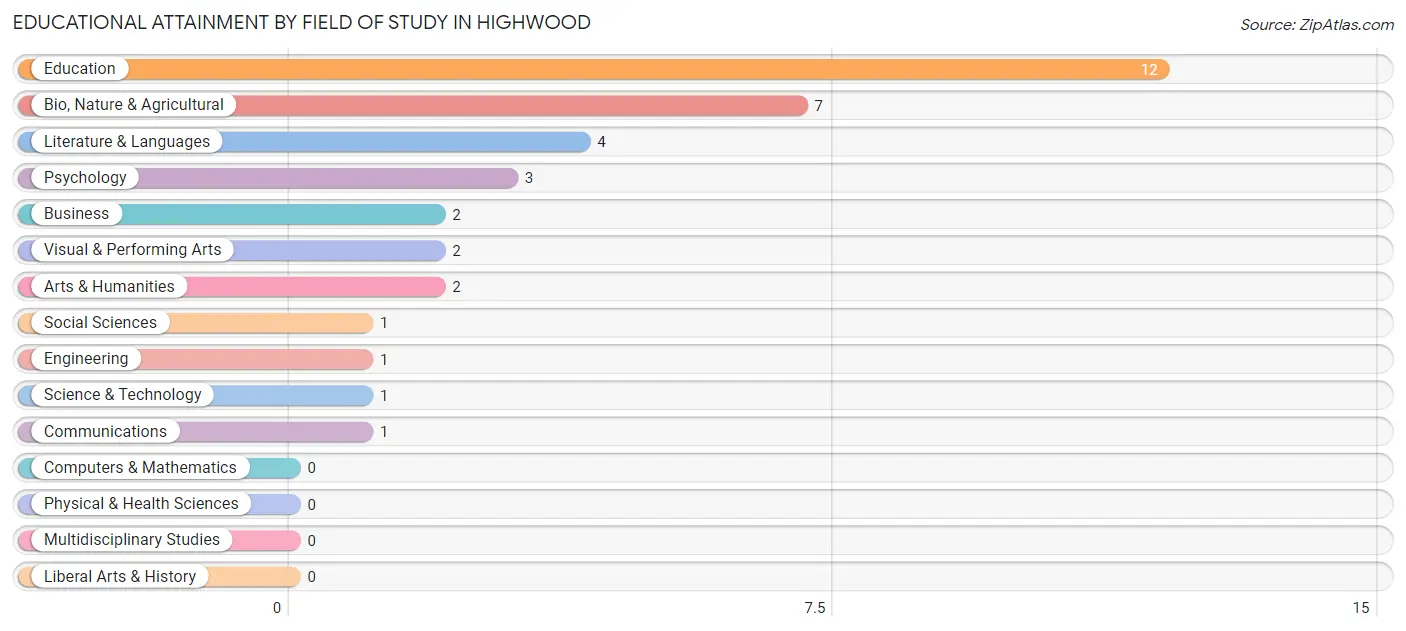
| Field of Study | # Graduates | % Graduates |
| Computers & Mathematics | 0 | 0.0% |
| Bio, Nature & Agricultural | 7 | 19.4% |
| Physical & Health Sciences | 0 | 0.0% |
| Psychology | 3 | 8.3% |
| Social Sciences | 1 | 2.8% |
| Engineering | 1 | 2.8% |
| Multidisciplinary Studies | 0 | 0.0% |
| Science & Technology | 1 | 2.8% |
| Business | 2 | 5.6% |
| Education | 12 | 33.3% |
| Literature & Languages | 4 | 11.1% |
| Liberal Arts & History | 0 | 0.0% |
| Visual & Performing Arts | 2 | 5.6% |
| Communications | 1 | 2.8% |
| Arts & Humanities | 2 | 5.6% |
| Total | 36 | 100.0% |
Transportation & Commute in Highwood
Vehicle Availability by Sex in Highwood
The most prevalent vehicle ownership categories in Highwood are males with 1 vehicle (18, accounting for 38.3%) and females with 1 vehicle (1, making up 56.2%).
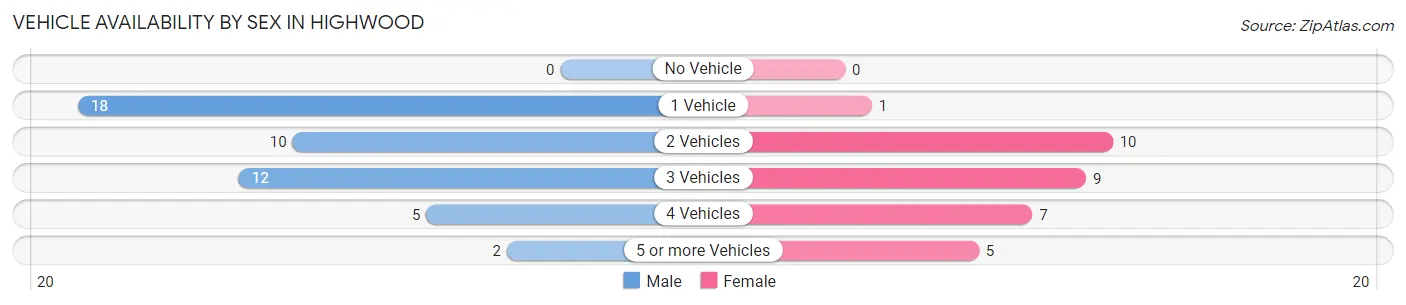
| Vehicles Available | Male | Female |
| No Vehicle | 0 (0.0%) | 0 (0.0%) |
| 1 Vehicle | 18 (38.3%) | 1 (3.1%) |
| 2 Vehicles | 10 (21.3%) | 10 (31.2%) |
| 3 Vehicles | 12 (25.5%) | 9 (28.1%) |
| 4 Vehicles | 5 (10.6%) | 7 (21.9%) |
| 5 or more Vehicles | 2 (4.3%) | 5 (15.6%) |
| Total | 47 (100.0%) | 32 (100.0%) |
Commute Time in Highwood
The most frequently occuring commute durations in Highwood are less than 5 minutes (21 commuters, 30.4%), 30 to 34 minutes (16 commuters, 23.2%), and 35 to 39 minutes (7 commuters, 10.1%).
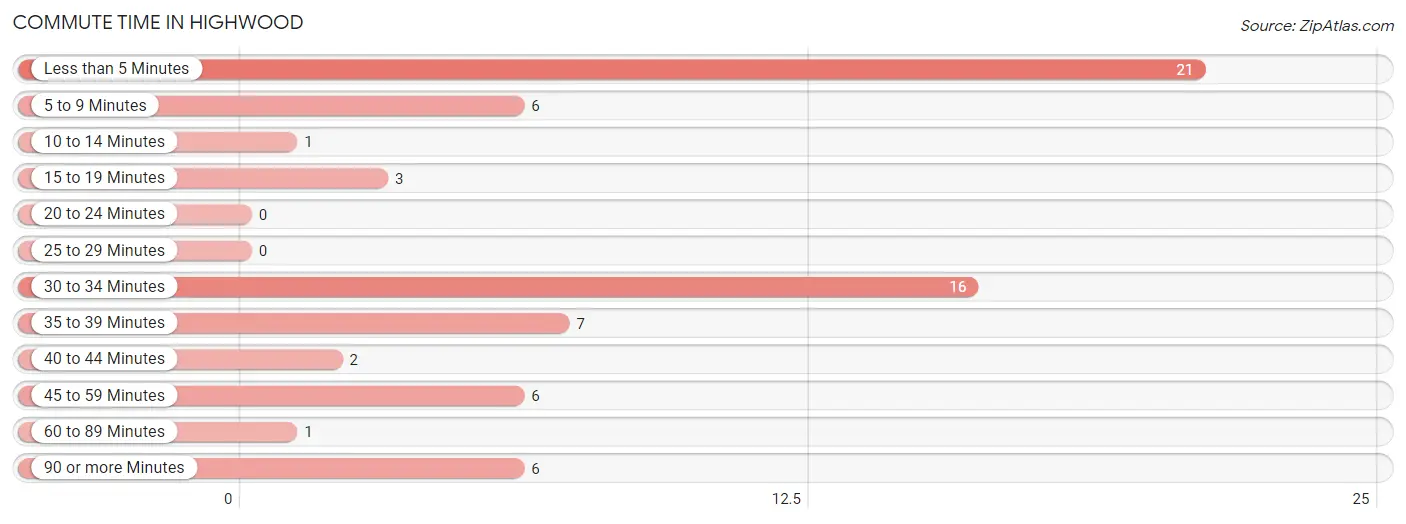
| Commute Time | # Commuters | % Commuters |
| Less than 5 Minutes | 21 | 30.4% |
| 5 to 9 Minutes | 6 | 8.7% |
| 10 to 14 Minutes | 1 | 1.5% |
| 15 to 19 Minutes | 3 | 4.3% |
| 20 to 24 Minutes | 0 | 0.0% |
| 25 to 29 Minutes | 0 | 0.0% |
| 30 to 34 Minutes | 16 | 23.2% |
| 35 to 39 Minutes | 7 | 10.1% |
| 40 to 44 Minutes | 2 | 2.9% |
| 45 to 59 Minutes | 6 | 8.7% |
| 60 to 89 Minutes | 1 | 1.5% |
| 90 or more Minutes | 6 | 8.7% |
Commute Time by Sex in Highwood
The most common commute times in Highwood are 30 to 34 minutes (15 commuters, 34.1%) for males and less than 5 minutes (9 commuters, 36.0%) for females.
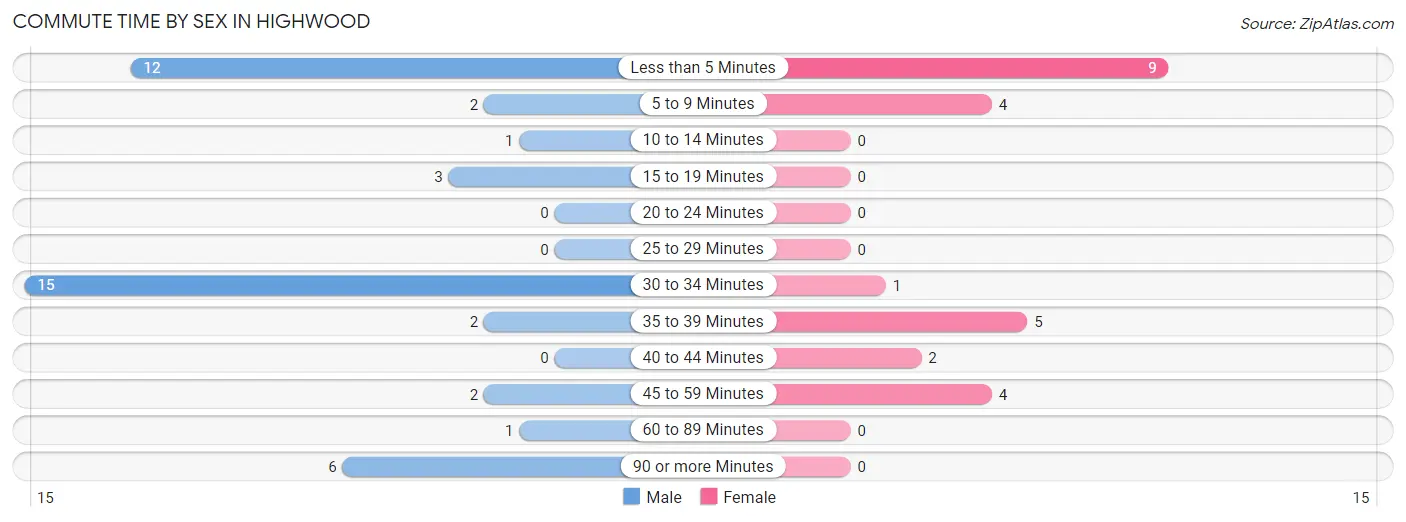
| Commute Time | Male | Female |
| Less than 5 Minutes | 12 (27.3%) | 9 (36.0%) |
| 5 to 9 Minutes | 2 (4.5%) | 4 (16.0%) |
| 10 to 14 Minutes | 1 (2.3%) | 0 (0.0%) |
| 15 to 19 Minutes | 3 (6.8%) | 0 (0.0%) |
| 20 to 24 Minutes | 0 (0.0%) | 0 (0.0%) |
| 25 to 29 Minutes | 0 (0.0%) | 0 (0.0%) |
| 30 to 34 Minutes | 15 (34.1%) | 1 (4.0%) |
| 35 to 39 Minutes | 2 (4.5%) | 5 (20.0%) |
| 40 to 44 Minutes | 0 (0.0%) | 2 (8.0%) |
| 45 to 59 Minutes | 2 (4.5%) | 4 (16.0%) |
| 60 to 89 Minutes | 1 (2.3%) | 0 (0.0%) |
| 90 or more Minutes | 6 (13.6%) | 0 (0.0%) |
Time of Departure to Work by Sex in Highwood
The most frequent times of departure to work in Highwood are 8:30 AM to 8:59 AM (14, 31.8%) for males and 7:30 AM to 7:59 AM (11, 44.0%) for females.
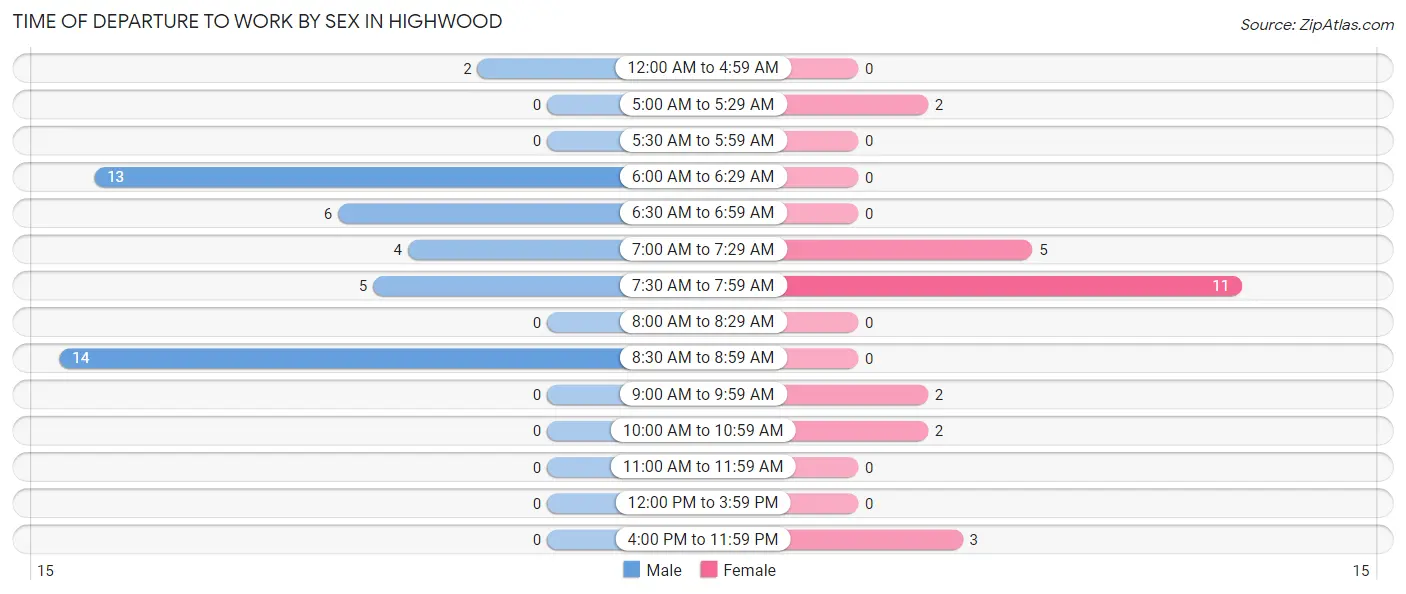
| Time of Departure | Male | Female |
| 12:00 AM to 4:59 AM | 2 (4.5%) | 0 (0.0%) |
| 5:00 AM to 5:29 AM | 0 (0.0%) | 2 (8.0%) |
| 5:30 AM to 5:59 AM | 0 (0.0%) | 0 (0.0%) |
| 6:00 AM to 6:29 AM | 13 (29.5%) | 0 (0.0%) |
| 6:30 AM to 6:59 AM | 6 (13.6%) | 0 (0.0%) |
| 7:00 AM to 7:29 AM | 4 (9.1%) | 5 (20.0%) |
| 7:30 AM to 7:59 AM | 5 (11.4%) | 11 (44.0%) |
| 8:00 AM to 8:29 AM | 0 (0.0%) | 0 (0.0%) |
| 8:30 AM to 8:59 AM | 14 (31.8%) | 0 (0.0%) |
| 9:00 AM to 9:59 AM | 0 (0.0%) | 2 (8.0%) |
| 10:00 AM to 10:59 AM | 0 (0.0%) | 2 (8.0%) |
| 11:00 AM to 11:59 AM | 0 (0.0%) | 0 (0.0%) |
| 12:00 PM to 3:59 PM | 0 (0.0%) | 0 (0.0%) |
| 4:00 PM to 11:59 PM | 0 (0.0%) | 3 (12.0%) |
| Total | 44 (100.0%) | 25 (100.0%) |
Housing Occupancy in Highwood
Occupancy by Ownership in Highwood
Of the total 73 dwellings in Highwood, owner-occupied units account for 50 (68.5%), while renter-occupied units make up 23 (31.5%).
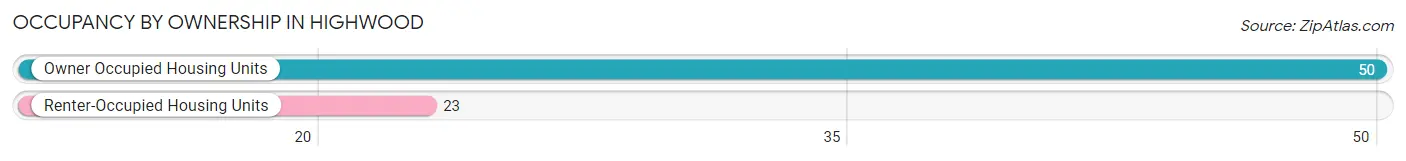
| Occupancy | # Housing Units | % Housing Units |
| Owner Occupied Housing Units | 50 | 68.5% |
| Renter-Occupied Housing Units | 23 | 31.5% |
| Total Occupied Housing Units | 73 | 100.0% |
Occupancy by Household Size in Highwood
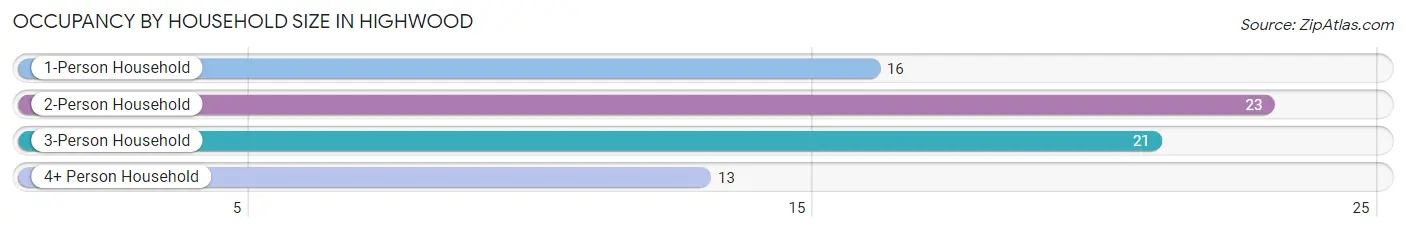
| Household Size | # Housing Units | % Housing Units |
| 1-Person Household | 16 | 21.9% |
| 2-Person Household | 23 | 31.5% |
| 3-Person Household | 21 | 28.8% |
| 4+ Person Household | 13 | 17.8% |
| Total Housing Units | 73 | 100.0% |
Occupancy by Ownership by Household Size in Highwood
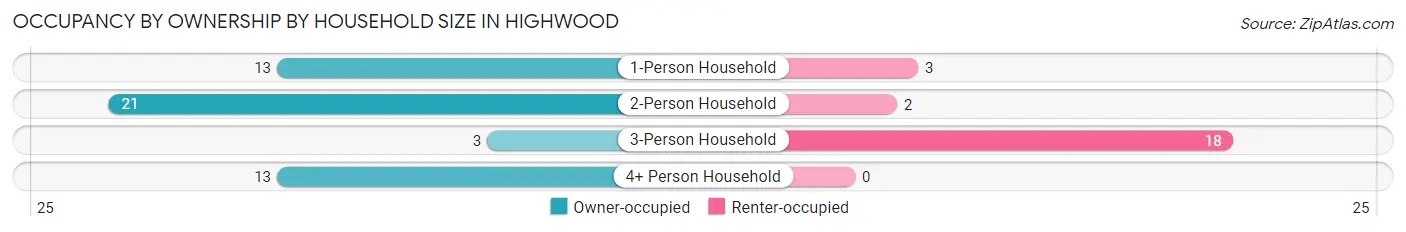
| Household Size | Owner-occupied | Renter-occupied |
| 1-Person Household | 13 (81.2%) | 3 (18.8%) |
| 2-Person Household | 21 (91.3%) | 2 (8.7%) |
| 3-Person Household | 3 (14.3%) | 18 (85.7%) |
| 4+ Person Household | 13 (100.0%) | 0 (0.0%) |
| Total Housing Units | 50 (68.5%) | 23 (31.5%) |
Occupancy by Educational Attainment in Highwood
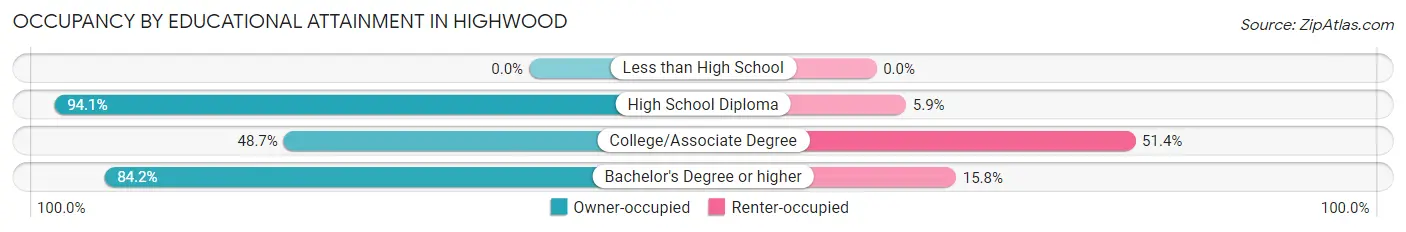
| Household Size | Owner-occupied | Renter-occupied |
| Less than High School | 0 (0.0%) | 0 (0.0%) |
| High School Diploma | 16 (94.1%) | 1 (5.9%) |
| College/Associate Degree | 18 (48.6%) | 19 (51.3%) |
| Bachelor's Degree or higher | 16 (84.2%) | 3 (15.8%) |
Occupancy by Age of Householder in Highwood
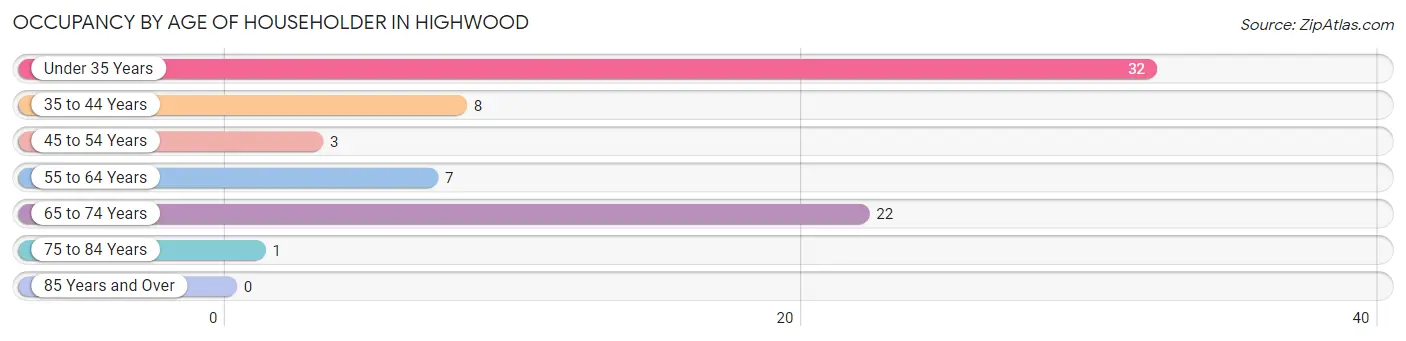
| Age Bracket | # Households | % Households |
| Under 35 Years | 32 | 43.8% |
| 35 to 44 Years | 8 | 11.0% |
| 45 to 54 Years | 3 | 4.1% |
| 55 to 64 Years | 7 | 9.6% |
| 65 to 74 Years | 22 | 30.1% |
| 75 to 84 Years | 1 | 1.4% |
| 85 Years and Over | 0 | 0.0% |
| Total | 73 | 100.0% |
Housing Finances in Highwood
Median Income by Occupancy in Highwood
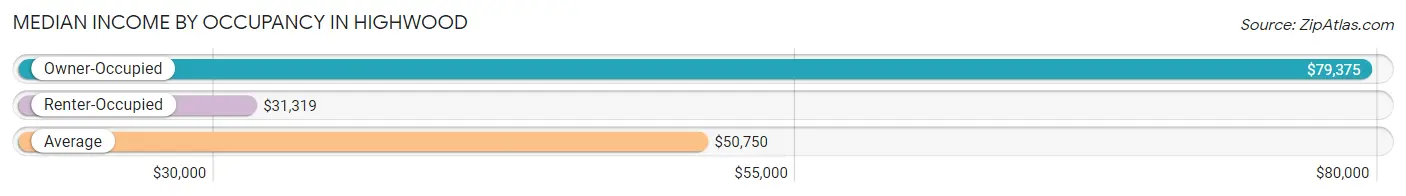
| Occupancy Type | # Households | Median Income |
| Owner-Occupied | 50 (68.5%) | $79,375 |
| Renter-Occupied | 23 (31.5%) | $31,319 |
| Average | 73 (100.0%) | $50,750 |
Occupancy by Householder Income Bracket in Highwood
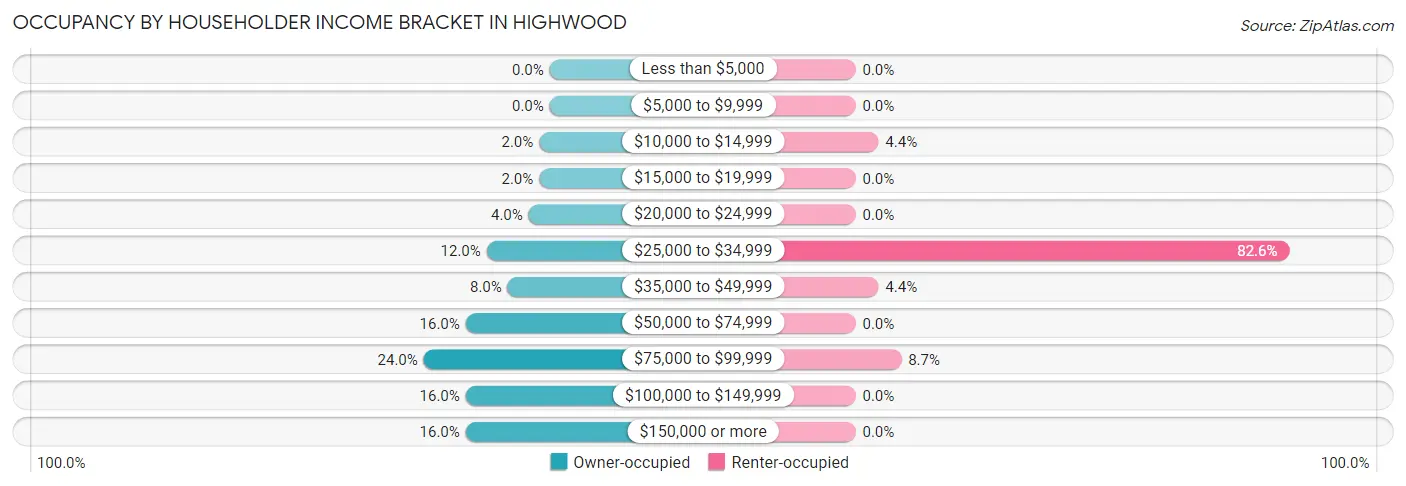
| Income Bracket | Owner-occupied | Renter-occupied |
| Less than $5,000 | 0 (0.0%) | 0 (0.0%) |
| $5,000 to $9,999 | 0 (0.0%) | 0 (0.0%) |
| $10,000 to $14,999 | 1 (2.0%) | 1 (4.3%) |
| $15,000 to $19,999 | 1 (2.0%) | 0 (0.0%) |
| $20,000 to $24,999 | 2 (4.0%) | 0 (0.0%) |
| $25,000 to $34,999 | 6 (12.0%) | 19 (82.6%) |
| $35,000 to $49,999 | 4 (8.0%) | 1 (4.3%) |
| $50,000 to $74,999 | 8 (16.0%) | 0 (0.0%) |
| $75,000 to $99,999 | 12 (24.0%) | 2 (8.7%) |
| $100,000 to $149,999 | 8 (16.0%) | 0 (0.0%) |
| $150,000 or more | 8 (16.0%) | 0 (0.0%) |
| Total | 50 (100.0%) | 23 (100.0%) |
Monthly Housing Cost Tiers in Highwood
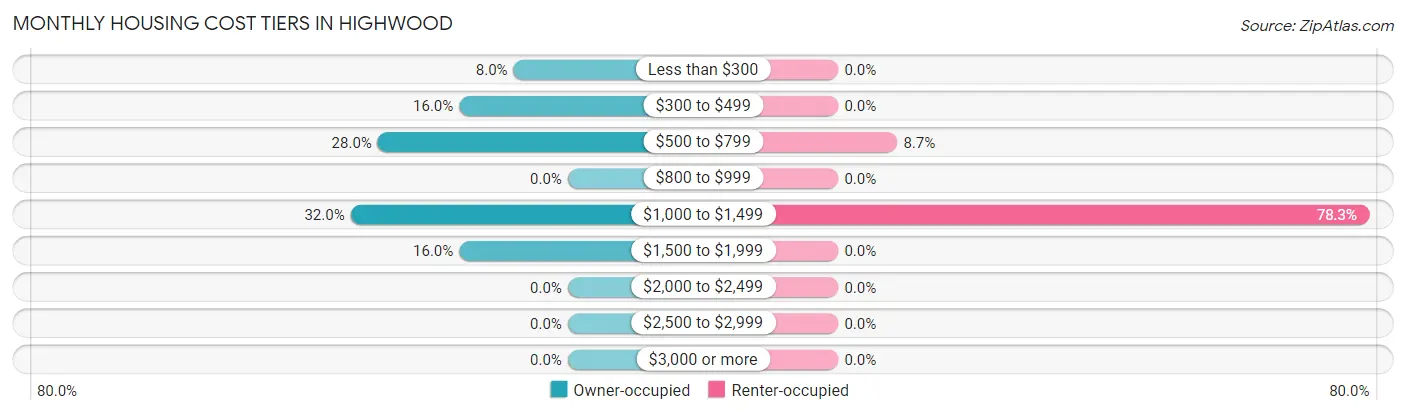
| Monthly Cost | Owner-occupied | Renter-occupied |
| Less than $300 | 4 (8.0%) | 0 (0.0%) |
| $300 to $499 | 8 (16.0%) | 0 (0.0%) |
| $500 to $799 | 14 (28.0%) | 2 (8.7%) |
| $800 to $999 | 0 (0.0%) | 0 (0.0%) |
| $1,000 to $1,499 | 16 (32.0%) | 18 (78.3%) |
| $1,500 to $1,999 | 8 (16.0%) | 0 (0.0%) |
| $2,000 to $2,499 | 0 (0.0%) | 0 (0.0%) |
| $2,500 to $2,999 | 0 (0.0%) | 0 (0.0%) |
| $3,000 or more | 0 (0.0%) | 0 (0.0%) |
| Total | 50 (100.0%) | 23 (100.0%) |
Physical Housing Characteristics in Highwood
Housing Structures in Highwood
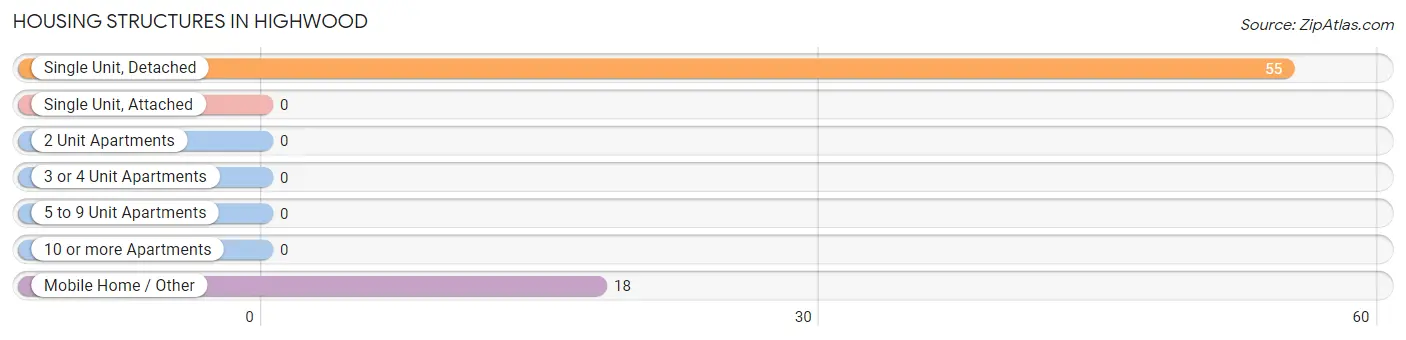
| Structure Type | # Housing Units | % Housing Units |
| Single Unit, Detached | 55 | 75.3% |
| Single Unit, Attached | 0 | 0.0% |
| 2 Unit Apartments | 0 | 0.0% |
| 3 or 4 Unit Apartments | 0 | 0.0% |
| 5 to 9 Unit Apartments | 0 | 0.0% |
| 10 or more Apartments | 0 | 0.0% |
| Mobile Home / Other | 18 | 24.7% |
| Total | 73 | 100.0% |
Housing Structures by Occupancy in Highwood
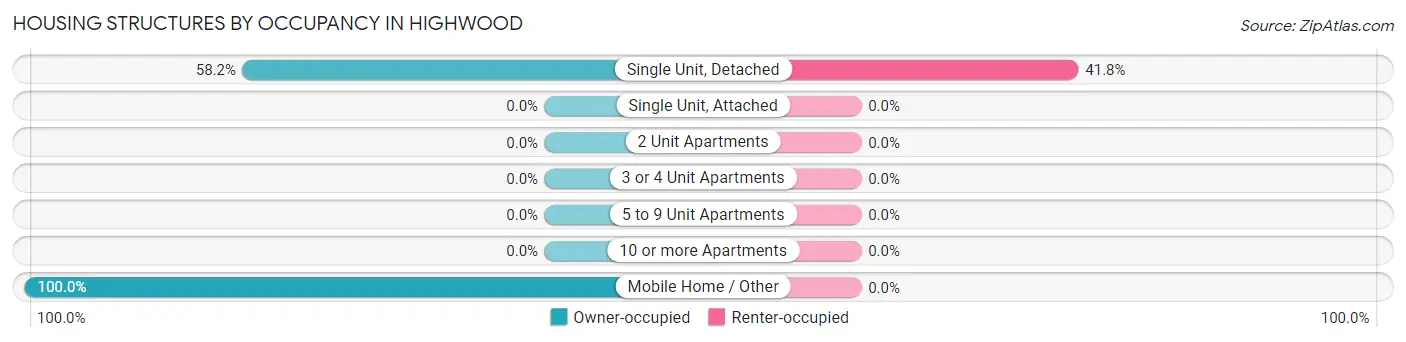
| Structure Type | Owner-occupied | Renter-occupied |
| Single Unit, Detached | 32 (58.2%) | 23 (41.8%) |
| Single Unit, Attached | 0 (0.0%) | 0 (0.0%) |
| 2 Unit Apartments | 0 (0.0%) | 0 (0.0%) |
| 3 or 4 Unit Apartments | 0 (0.0%) | 0 (0.0%) |
| 5 to 9 Unit Apartments | 0 (0.0%) | 0 (0.0%) |
| 10 or more Apartments | 0 (0.0%) | 0 (0.0%) |
| Mobile Home / Other | 18 (100.0%) | 0 (0.0%) |
| Total | 50 (68.5%) | 23 (31.5%) |
Housing Structures by Number of Rooms in Highwood
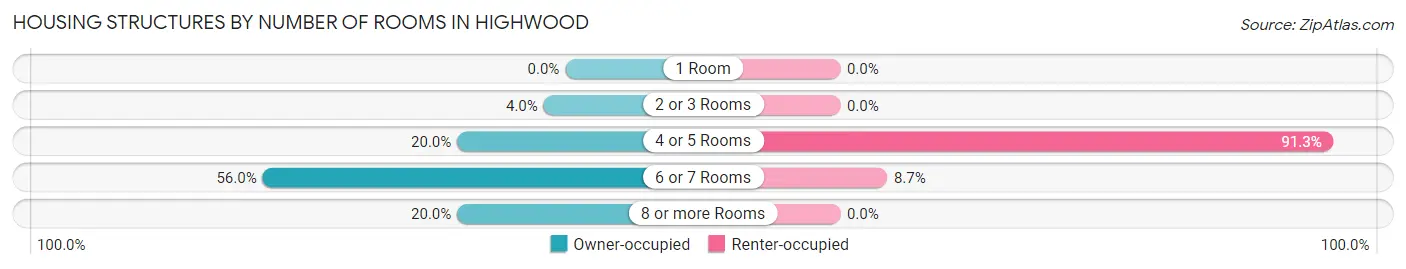
| Number of Rooms | Owner-occupied | Renter-occupied |
| 1 Room | 0 (0.0%) | 0 (0.0%) |
| 2 or 3 Rooms | 2 (4.0%) | 0 (0.0%) |
| 4 or 5 Rooms | 10 (20.0%) | 21 (91.3%) |
| 6 or 7 Rooms | 28 (56.0%) | 2 (8.7%) |
| 8 or more Rooms | 10 (20.0%) | 0 (0.0%) |
| Total | 50 (100.0%) | 23 (100.0%) |
Housing Structure by Heating Type in Highwood
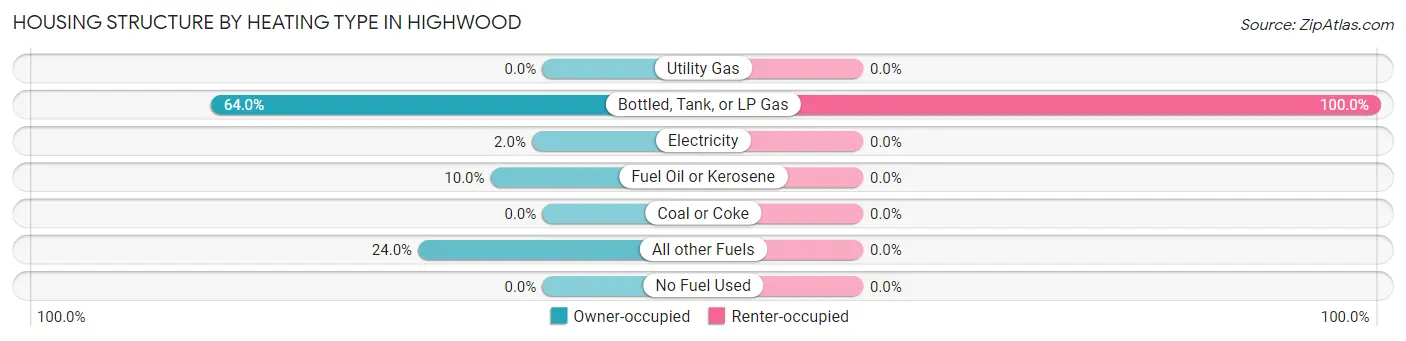
| Heating Type | Owner-occupied | Renter-occupied |
| Utility Gas | 0 (0.0%) | 0 (0.0%) |
| Bottled, Tank, or LP Gas | 32 (64.0%) | 23 (100.0%) |
| Electricity | 1 (2.0%) | 0 (0.0%) |
| Fuel Oil or Kerosene | 5 (10.0%) | 0 (0.0%) |
| Coal or Coke | 0 (0.0%) | 0 (0.0%) |
| All other Fuels | 12 (24.0%) | 0 (0.0%) |
| No Fuel Used | 0 (0.0%) | 0 (0.0%) |
| Total | 50 (100.0%) | 23 (100.0%) |
Household Vehicle Usage in Highwood
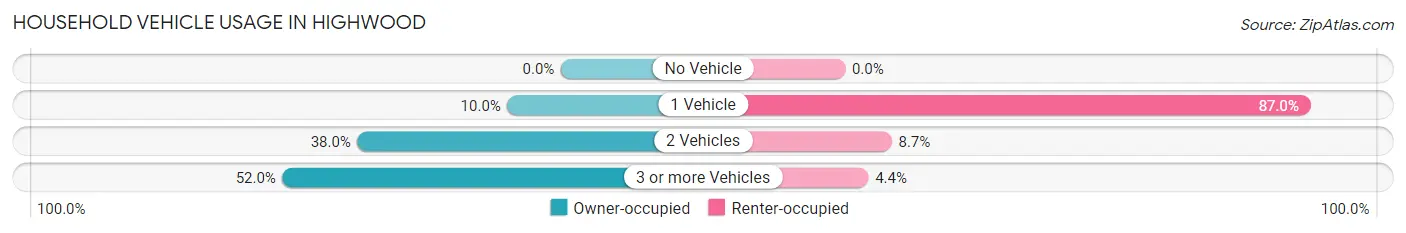
| Vehicles per Household | Owner-occupied | Renter-occupied |
| No Vehicle | 0 (0.0%) | 0 (0.0%) |
| 1 Vehicle | 5 (10.0%) | 20 (87.0%) |
| 2 Vehicles | 19 (38.0%) | 2 (8.7%) |
| 3 or more Vehicles | 26 (52.0%) | 1 (4.3%) |
| Total | 50 (100.0%) | 23 (100.0%) |
Real Estate & Mortgages in Highwood
Real Estate and Mortgage Overview in Highwood
| Characteristic | Without Mortgage | With Mortgage |
| Housing Units | 21 | 29 |
| Median Property Value | $164,600 | $164,100 |
| Median Household Income | $98,125 | $4 |
| Monthly Housing Costs | $481 | $0 |
| Real Estate Taxes | $783 | $0 |
Property Value by Mortgage Status in Highwood
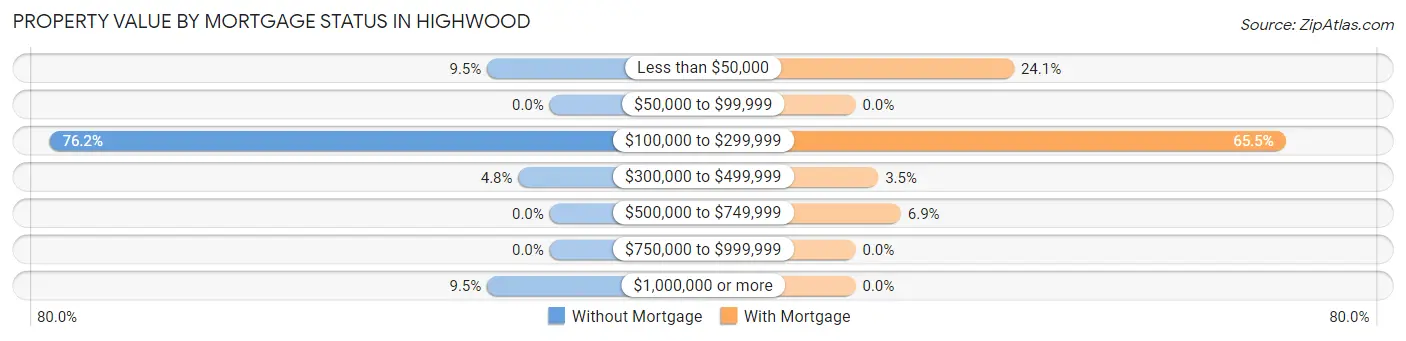
| Property Value | Without Mortgage | With Mortgage |
| Less than $50,000 | 2 (9.5%) | 7 (24.1%) |
| $50,000 to $99,999 | 0 (0.0%) | 0 (0.0%) |
| $100,000 to $299,999 | 16 (76.2%) | 19 (65.5%) |
| $300,000 to $499,999 | 1 (4.8%) | 1 (3.5%) |
| $500,000 to $749,999 | 0 (0.0%) | 2 (6.9%) |
| $750,000 to $999,999 | 0 (0.0%) | 0 (0.0%) |
| $1,000,000 or more | 2 (9.5%) | 0 (0.0%) |
| Total | 21 (100.0%) | 29 (100.0%) |
Household Income by Mortgage Status in Highwood
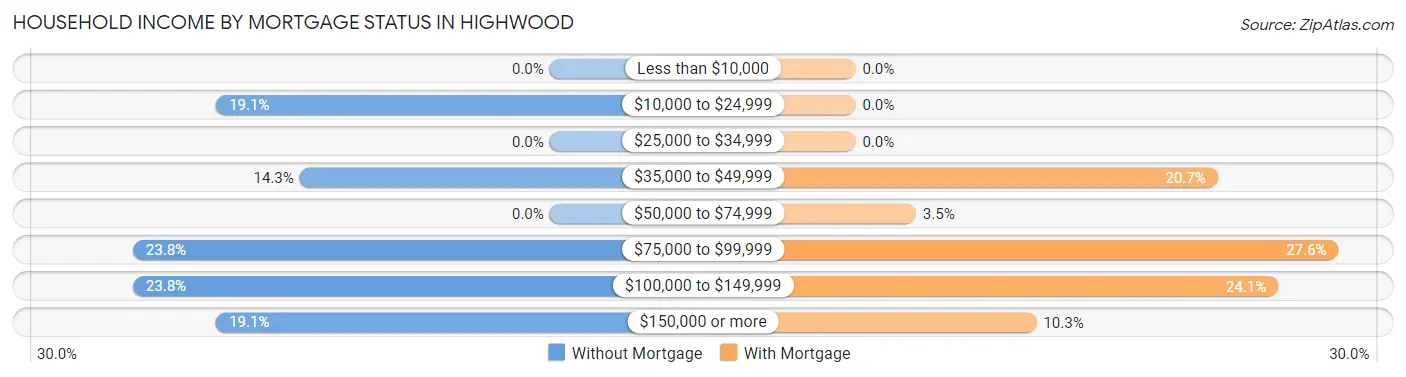
| Household Income | Without Mortgage | With Mortgage |
| Less than $10,000 | 0 (0.0%) | 0 (0.0%) |
| $10,000 to $24,999 | 4 (19.1%) | 0 (0.0%) |
| $25,000 to $34,999 | 0 (0.0%) | 0 (0.0%) |
| $35,000 to $49,999 | 3 (14.3%) | 6 (20.7%) |
| $50,000 to $74,999 | 0 (0.0%) | 1 (3.5%) |
| $75,000 to $99,999 | 5 (23.8%) | 8 (27.6%) |
| $100,000 to $149,999 | 5 (23.8%) | 7 (24.1%) |
| $150,000 or more | 4 (19.1%) | 3 (10.3%) |
| Total | 21 (100.0%) | 29 (100.0%) |
Property Value to Household Income Ratio in Highwood
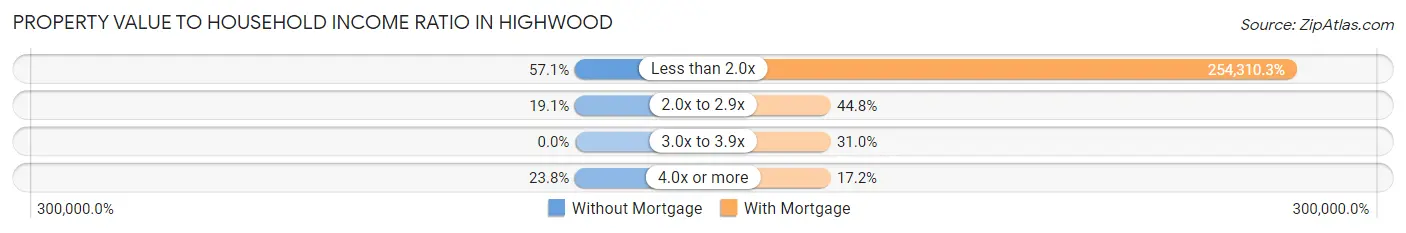
| Value-to-Income Ratio | Without Mortgage | With Mortgage |
| Less than 2.0x | 12 (57.1%) | 73,750 (254,310.3%) |
| 2.0x to 2.9x | 4 (19.1%) | 13 (44.8%) |
| 3.0x to 3.9x | 0 (0.0%) | 9 (31.0%) |
| 4.0x or more | 5 (23.8%) | 5 (17.2%) |
| Total | 21 (100.0%) | 29 (100.0%) |
Real Estate Taxes by Mortgage Status in Highwood
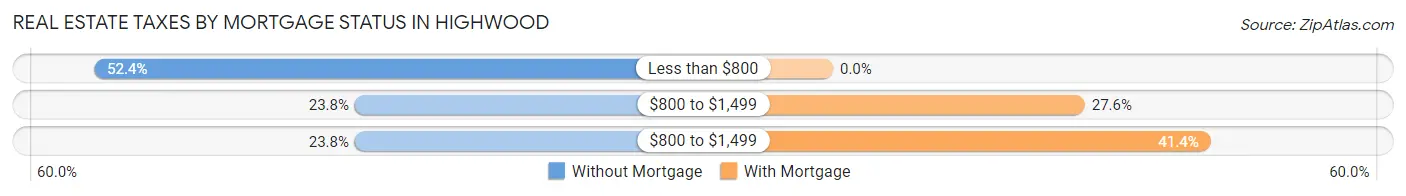
| Property Taxes | Without Mortgage | With Mortgage |
| Less than $800 | 11 (52.4%) | 0 (0.0%) |
| $800 to $1,499 | 5 (23.8%) | 8 (27.6%) |
| $800 to $1,499 | 5 (23.8%) | 12 (41.4%) |
| Total | 21 (100.0%) | 29 (100.0%) |
Health & Disability in Highwood
Health Insurance Coverage by Age in Highwood
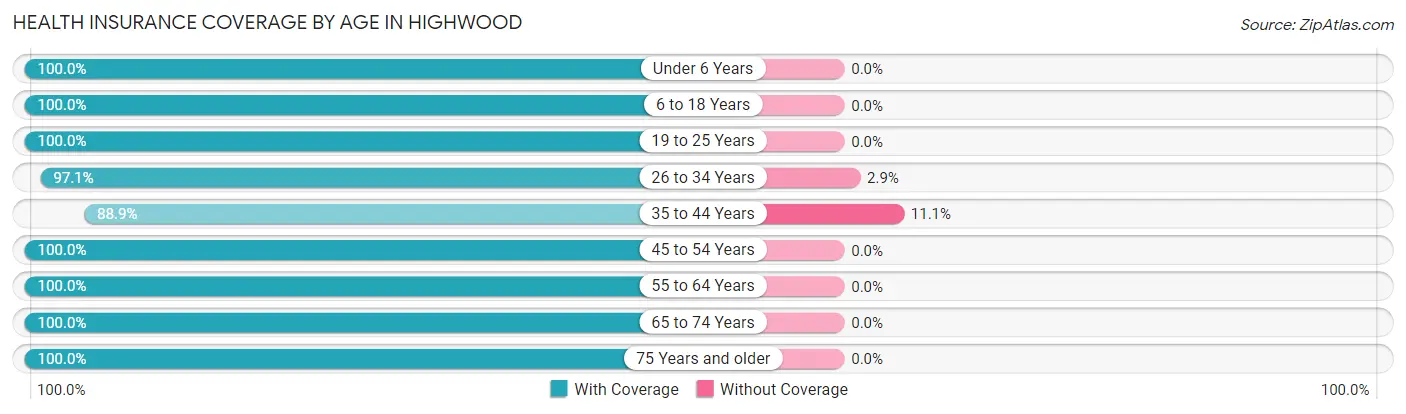
| Age Bracket | With Coverage | Without Coverage |
| Under 6 Years | 25 (100.0%) | 0 (0.0%) |
| 6 to 18 Years | 27 (100.0%) | 0 (0.0%) |
| 19 to 25 Years | 19 (100.0%) | 0 (0.0%) |
| 26 to 34 Years | 33 (97.1%) | 1 (2.9%) |
| 35 to 44 Years | 16 (88.9%) | 2 (11.1%) |
| 45 to 54 Years | 9 (100.0%) | 0 (0.0%) |
| 55 to 64 Years | 19 (100.0%) | 0 (0.0%) |
| 65 to 74 Years | 24 (100.0%) | 0 (0.0%) |
| 75 Years and older | 2 (100.0%) | 0 (0.0%) |
| Total | 174 (98.3%) | 3 (1.7%) |
Health Insurance Coverage by Citizenship Status in Highwood
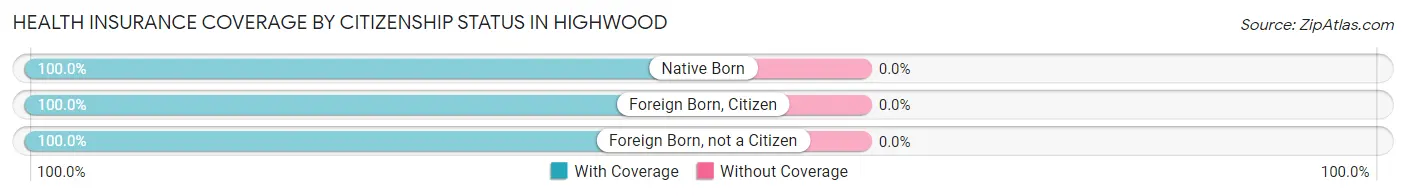
| Citizenship Status | With Coverage | Without Coverage |
| Native Born | 25 (100.0%) | 0 (0.0%) |
| Foreign Born, Citizen | 27 (100.0%) | 0 (0.0%) |
| Foreign Born, not a Citizen | 19 (100.0%) | 0 (0.0%) |
Health Insurance Coverage by Household Income in Highwood
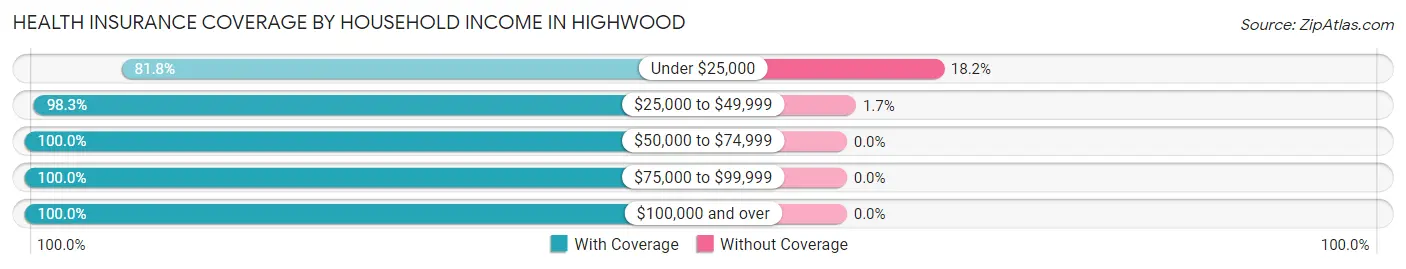
| Household Income | With Coverage | Without Coverage |
| Under $25,000 | 9 (81.8%) | 2 (18.2%) |
| $25,000 to $49,999 | 57 (98.3%) | 1 (1.7%) |
| $50,000 to $74,999 | 24 (100.0%) | 0 (0.0%) |
| $75,000 to $99,999 | 35 (100.0%) | 0 (0.0%) |
| $100,000 and over | 49 (100.0%) | 0 (0.0%) |
Public vs Private Health Insurance Coverage by Age in Highwood
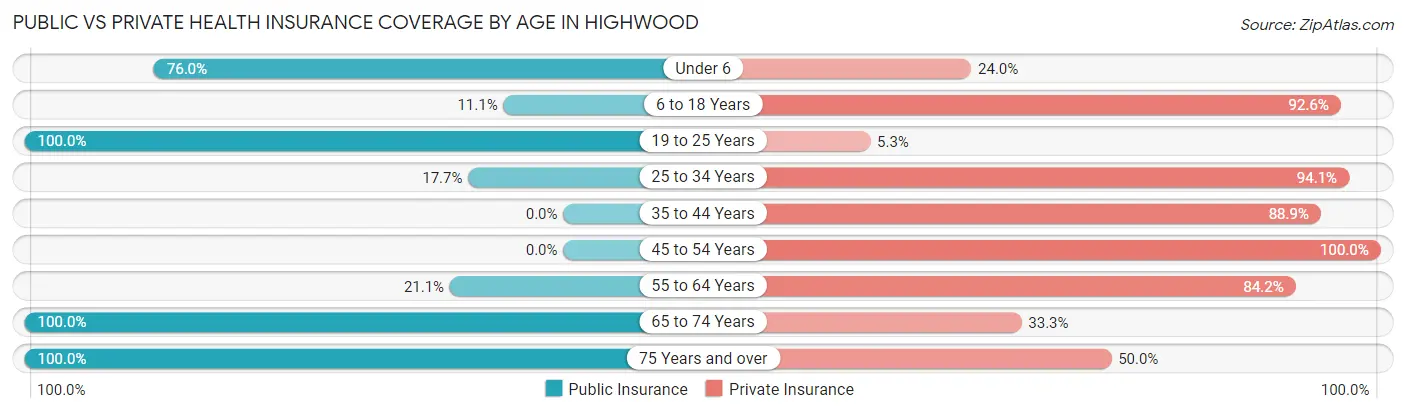
| Age Bracket | Public Insurance | Private Insurance |
| Under 6 | 19 (76.0%) | 6 (24.0%) |
| 6 to 18 Years | 3 (11.1%) | 25 (92.6%) |
| 19 to 25 Years | 19 (100.0%) | 1 (5.3%) |
| 25 to 34 Years | 6 (17.6%) | 32 (94.1%) |
| 35 to 44 Years | 0 (0.0%) | 16 (88.9%) |
| 45 to 54 Years | 0 (0.0%) | 9 (100.0%) |
| 55 to 64 Years | 4 (21.0%) | 16 (84.2%) |
| 65 to 74 Years | 24 (100.0%) | 8 (33.3%) |
| 75 Years and over | 2 (100.0%) | 1 (50.0%) |
| Total | 77 (43.5%) | 114 (64.4%) |
Disability Status by Sex by Age in Highwood
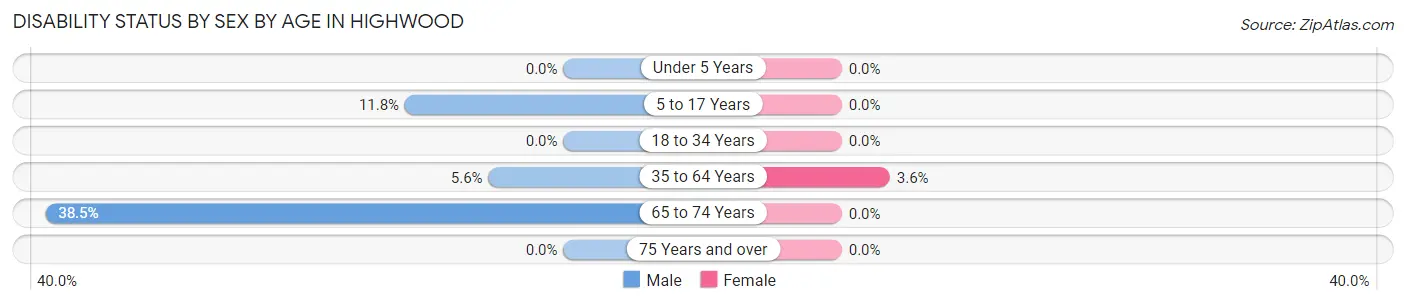
| Age Bracket | Male | Female |
| Under 5 Years | 0 (0.0%) | 0 (0.0%) |
| 5 to 17 Years | 2 (11.8%) | 0 (0.0%) |
| 18 to 34 Years | 0 (0.0%) | 0 (0.0%) |
| 35 to 64 Years | 1 (5.6%) | 1 (3.6%) |
| 65 to 74 Years | 5 (38.5%) | 0 (0.0%) |
| 75 Years and over | 0 (0.0%) | 0 (0.0%) |
Disability Class by Sex by Age in Highwood
Disability Class: Hearing Difficulty
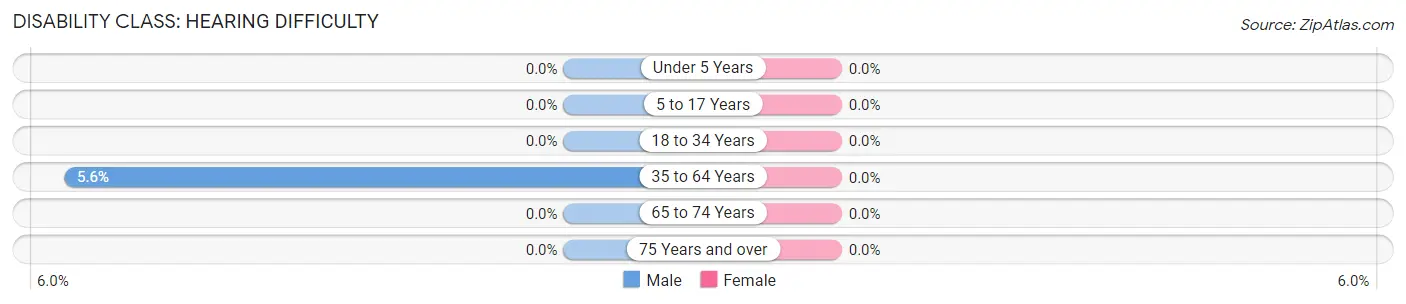
| Age Bracket | Male | Female |
| Under 5 Years | 0 (0.0%) | 0 (0.0%) |
| 5 to 17 Years | 0 (0.0%) | 0 (0.0%) |
| 18 to 34 Years | 0 (0.0%) | 0 (0.0%) |
| 35 to 64 Years | 1 (5.6%) | 0 (0.0%) |
| 65 to 74 Years | 0 (0.0%) | 0 (0.0%) |
| 75 Years and over | 0 (0.0%) | 0 (0.0%) |
Disability Class: Vision Difficulty
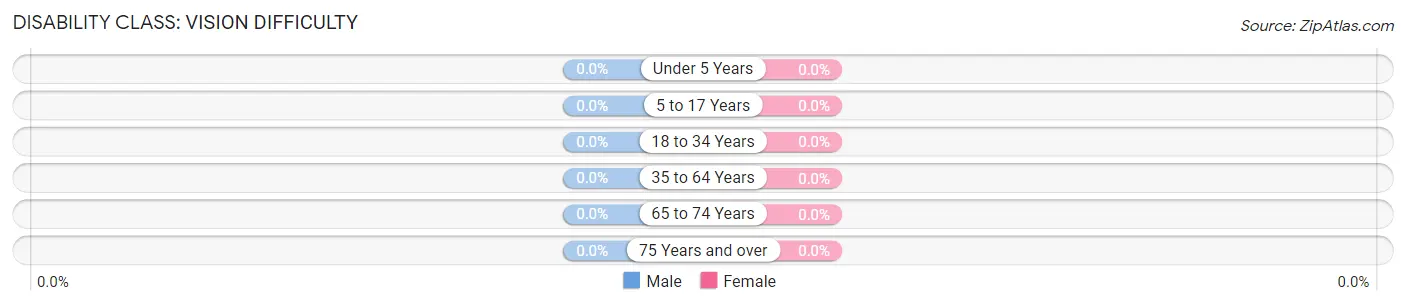
| Age Bracket | Male | Female |
| Under 5 Years | 0 (0.0%) | 0 (0.0%) |
| 5 to 17 Years | 0 (0.0%) | 0 (0.0%) |
| 18 to 34 Years | 0 (0.0%) | 0 (0.0%) |
| 35 to 64 Years | 0 (0.0%) | 0 (0.0%) |
| 65 to 74 Years | 0 (0.0%) | 0 (0.0%) |
| 75 Years and over | 0 (0.0%) | 0 (0.0%) |
Disability Class: Cognitive Difficulty
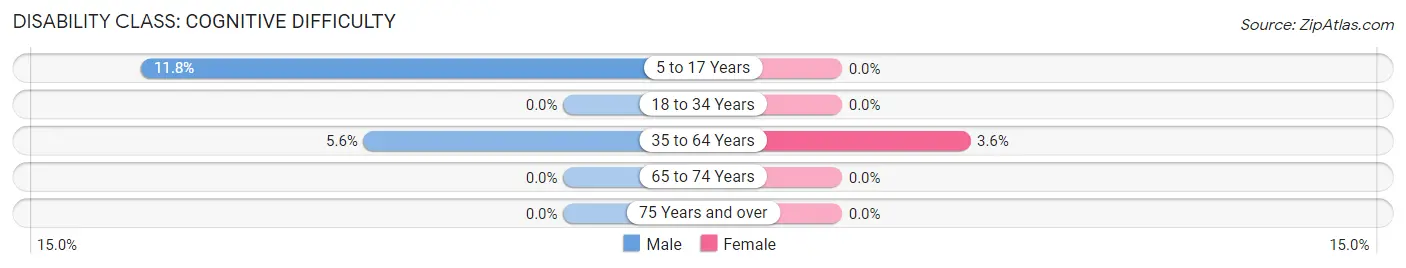
| Age Bracket | Male | Female |
| 5 to 17 Years | 2 (11.8%) | 0 (0.0%) |
| 18 to 34 Years | 0 (0.0%) | 0 (0.0%) |
| 35 to 64 Years | 1 (5.6%) | 1 (3.6%) |
| 65 to 74 Years | 0 (0.0%) | 0 (0.0%) |
| 75 Years and over | 0 (0.0%) | 0 (0.0%) |
Disability Class: Ambulatory Difficulty
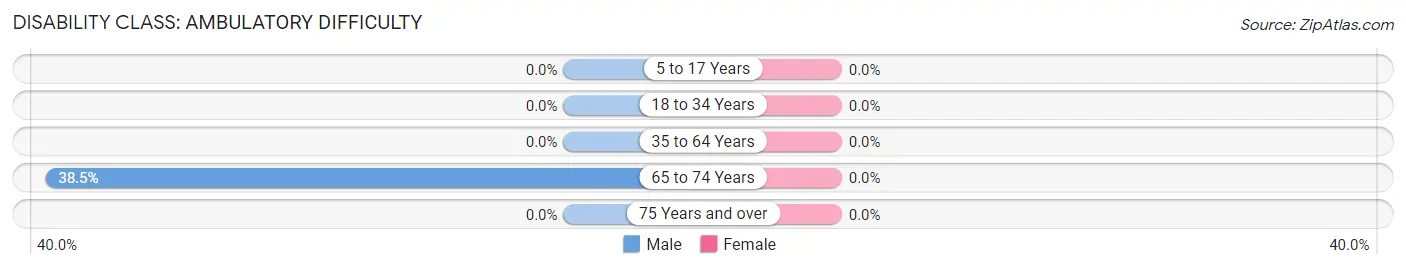
| Age Bracket | Male | Female |
| 5 to 17 Years | 0 (0.0%) | 0 (0.0%) |
| 18 to 34 Years | 0 (0.0%) | 0 (0.0%) |
| 35 to 64 Years | 0 (0.0%) | 0 (0.0%) |
| 65 to 74 Years | 5 (38.5%) | 0 (0.0%) |
| 75 Years and over | 0 (0.0%) | 0 (0.0%) |
Disability Class: Self-Care Difficulty
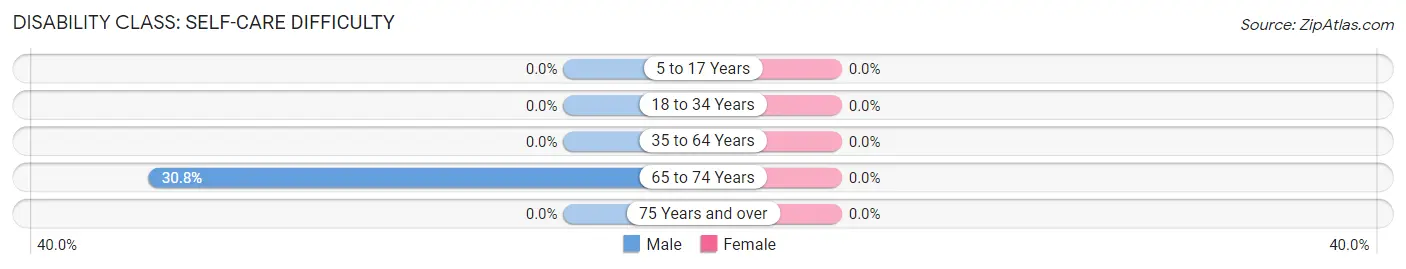
| Age Bracket | Male | Female |
| 5 to 17 Years | 0 (0.0%) | 0 (0.0%) |
| 18 to 34 Years | 0 (0.0%) | 0 (0.0%) |
| 35 to 64 Years | 0 (0.0%) | 0 (0.0%) |
| 65 to 74 Years | 4 (30.8%) | 0 (0.0%) |
| 75 Years and over | 0 (0.0%) | 0 (0.0%) |
Technology Access in Highwood
Computing Device Access in Highwood
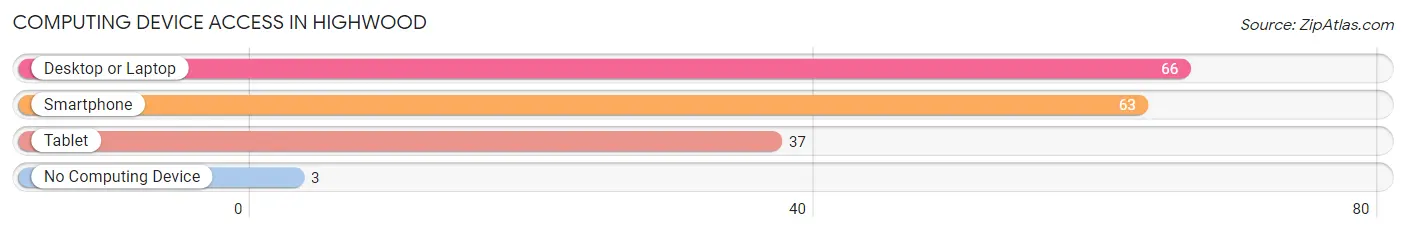
| Device Type | # Households | % Households |
| Desktop or Laptop | 66 | 90.4% |
| Smartphone | 63 | 86.3% |
| Tablet | 37 | 50.7% |
| No Computing Device | 3 | 4.1% |
| Total | 73 | 100.0% |
Internet Access in Highwood
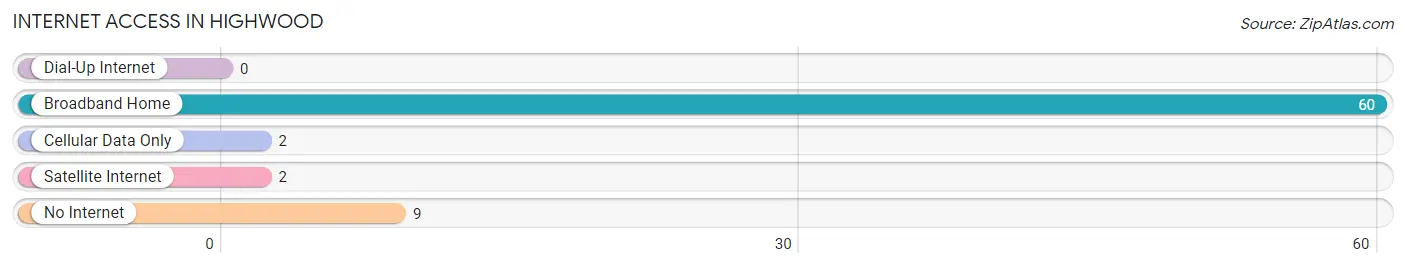
| Internet Type | # Households | % Households |
| Dial-Up Internet | 0 | 0.0% |
| Broadband Home | 60 | 82.2% |
| Cellular Data Only | 2 | 2.7% |
| Satellite Internet | 2 | 2.7% |
| No Internet | 9 | 12.3% |
| Total | 73 | 100.0% |
Highwood Summary
Highwood, Montana is a small town located in Choteau County, Montana. It is situated in the foothills of the Rocky Mountains, approximately 30 miles south of Great Falls. The town was founded in 1882 and has a population of approximately 500 people.
Highwood is located in a region of Montana known as the Golden Triangle, which is an area of rich agricultural land. The town is situated on the banks of the Highwood River, which is a tributary of the Missouri River. The town is surrounded by rolling hills and is home to a variety of wildlife, including deer, elk, and antelope.
Highwood has a rich history that dates back to the late 1800s. The town was founded by a group of homesteaders who were looking for a place to settle and start a new life. The town was named after the Highwood River, which was named after the high wooded hills that surrounded the area. The town was originally a farming community, but over the years it has become a popular tourist destination.
Highwood is home to a variety of businesses, including a grocery store, a hardware store, a bank, and a post office. The town also has a few restaurants, a gas station, and a few small shops. The town is also home to a number of churches, including the Highwood United Methodist Church, the Highwood Baptist Church, and the Highwood Lutheran Church.
Highwood has a mild climate, with temperatures ranging from the low twenties in the winter to the high eighties in the summer. The town receives an average of 18 inches of precipitation each year, with most of it falling in the form of snow.
Highwood has a strong economy that is based primarily on agriculture and tourism. The town is home to a number of farms, which produce a variety of crops, including wheat, barley, oats, and hay. The town is also home to a number of tourist attractions, including the Highwood Museum, the Highwood Golf Course, and the Highwood Wildlife Refuge.
Highwood has a population of approximately 500 people, with the majority of the population being of European descent. The town has a median household income of $37,000, and the median age is 44. The town has a low unemployment rate, and the majority of the population is employed in the agricultural and tourism industries.
Highwood is a small town with a rich history and a strong economy. The town is home to a variety of businesses, churches, and tourist attractions, and it is a popular destination for those looking to experience the beauty of the Rocky Mountains. The town has a mild climate and a population of approximately 500 people, and it is a great place to live and work.
Common Questions
What is Per Capita Income in Highwood?
Per Capita income in Highwood is $29,492.
What is the Median Family Income in Highwood?
Median Family Income in Highwood is $73,750.
What is the Median Household income in Highwood?
Median Household Income in Highwood is $50,750.
What is Income or Wage Gap in Highwood?
Income or Wage Gap in Highwood is 21.7%.
Women in Highwood earn 78.3 cents for every dollar earned by a man.
What is Inequality or Gini Index in Highwood?
Inequality or Gini Index in Highwood is 0.39.
What is the Total Population of Highwood?
Total Population of Highwood is 179.
What is the Total Male Population of Highwood?
Total Male Population of Highwood is 81.
What is the Total Female Population of Highwood?
Total Female Population of Highwood is 98.
What is the Ratio of Males per 100 Females in Highwood?
There are 82.65 Males per 100 Females in Highwood.
What is the Ratio of Females per 100 Males in Highwood?
There are 120.99 Females per 100 Males in Highwood.
What is the Median Population Age in Highwood?
Median Population Age in Highwood is 28.9 Years.
What is the Average Family Size in Highwood
Average Family Size in Highwood is 2.8 People.
What is the Average Household Size in Highwood
Average Household Size in Highwood is 2.5 People.
How Large is the Labor Force in Highwood?
There are 97 People in the Labor Forcein in Highwood.
What is the Percentage of People in the Labor Force in Highwood?
74.6% of People are in the Labor Force in Highwood.
What is the Unemployment Rate in Highwood?
Unemployment Rate in Highwood is 18.9%.