Fallon, MT Map & Demographics
Fallon Map
Fallon Overview
$14,093
PER CAPITA INCOME
75.5%
WAGE / INCOME GAP [ % ]
24.5¢/ $1
WAGE / INCOME GAP [ $ ]
0.60
INEQUALITY / GINI INDEX
360
TOTAL POPULATION
171
MALE POPULATION
189
FEMALE POPULATION
90.48
MALES / 100 FEMALES
110.53
FEMALES / 100 MALES
37.1
MEDIAN AGE
4.0
AVG FAMILY SIZE
4.5
AVG HOUSEHOLD SIZE
67
LABOR FORCE [ PEOPLE ]
32.5%
PERCENT IN LABOR FORCE
Fallon Zip Codes
Fallon Area Codes
Income in Fallon
Income Overview in Fallon
| Characteristic | Number | Measure |
| Per Capita Income | 360 | $14,093 |
| Median Family Income | 77 | $0 |
| Mean Family Income | 77 | $60,532 |
| Median Household Income | 80 | $0 |
| Mean Household Income | 80 | $61,350 |
| Income Deficit | 77 | $0 |
| Wage / Income Gap (%) | 360 | 75.51% |
| Wage / Income Gap ($) | 360 | 24.49¢ per $1 |
| Gini / Inequality Index | 360 | 0.60 |
Earnings by Sex in Fallon
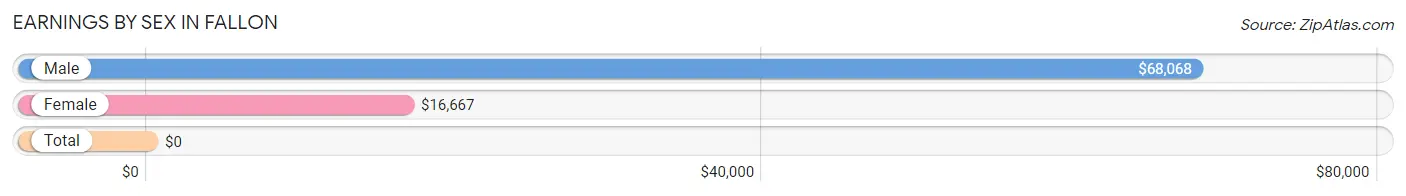
| Sex | Number | Average Earnings |
| Male | 48 (68.6%) | $68,068 |
| Female | 22 (31.4%) | $16,667 |
| Total | 70 (100.0%) | $0 |
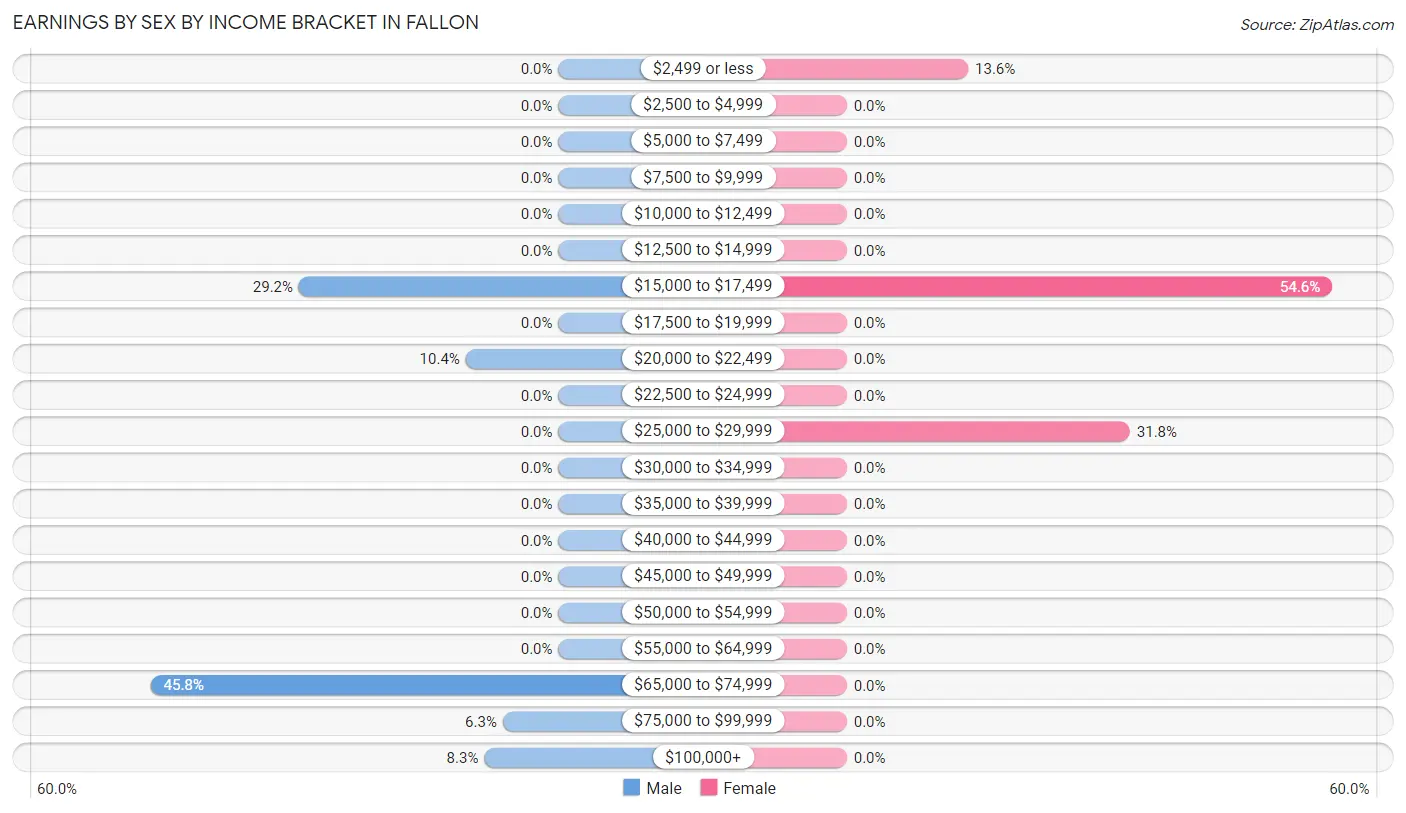
Earnings by Sex by Income Bracket in Fallon
The most common earnings brackets in Fallon are $65,000 to $74,999 for men (22 | 45.8%) and $15,000 to $17,499 for women (12 | 54.5%).
| Income | Male | Female |
| $2,499 or less | 0 (0.0%) | 3 (13.6%) |
| $2,500 to $4,999 | 0 (0.0%) | 0 (0.0%) |
| $5,000 to $7,499 | 0 (0.0%) | 0 (0.0%) |
| $7,500 to $9,999 | 0 (0.0%) | 0 (0.0%) |
| $10,000 to $12,499 | 0 (0.0%) | 0 (0.0%) |
| $12,500 to $14,999 | 0 (0.0%) | 0 (0.0%) |
| $15,000 to $17,499 | 14 (29.2%) | 12 (54.5%) |
| $17,500 to $19,999 | 0 (0.0%) | 0 (0.0%) |
| $20,000 to $22,499 | 5 (10.4%) | 0 (0.0%) |
| $22,500 to $24,999 | 0 (0.0%) | 0 (0.0%) |
| $25,000 to $29,999 | 0 (0.0%) | 7 (31.8%) |
| $30,000 to $34,999 | 0 (0.0%) | 0 (0.0%) |
| $35,000 to $39,999 | 0 (0.0%) | 0 (0.0%) |
| $40,000 to $44,999 | 0 (0.0%) | 0 (0.0%) |
| $45,000 to $49,999 | 0 (0.0%) | 0 (0.0%) |
| $50,000 to $54,999 | 0 (0.0%) | 0 (0.0%) |
| $55,000 to $64,999 | 0 (0.0%) | 0 (0.0%) |
| $65,000 to $74,999 | 22 (45.8%) | 0 (0.0%) |
| $75,000 to $99,999 | 3 (6.2%) | 0 (0.0%) |
| $100,000+ | 4 (8.3%) | 0 (0.0%) |
| Total | 48 (100.0%) | 22 (100.0%) |
Earnings by Sex by Educational Attainment in Fallon
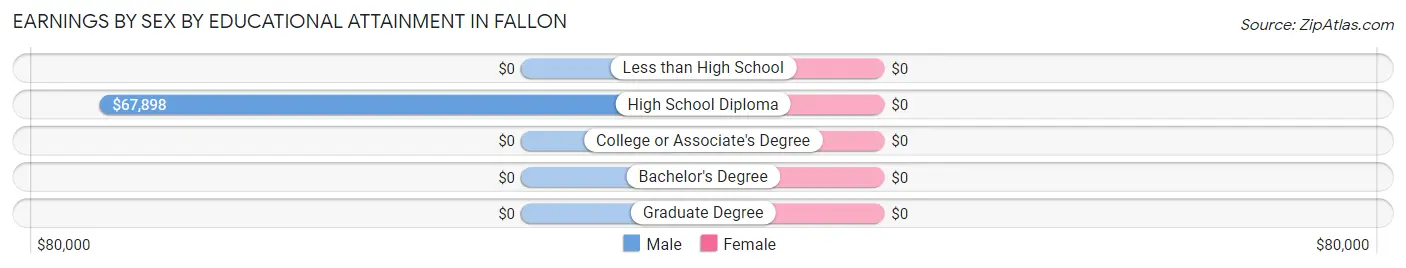
| Educational Attainment | Male Income | Female Income |
| Less than High School | - | - |
| High School Diploma | $67,898 | $0 |
| College or Associate's Degree | - | - |
| Bachelor's Degree | - | - |
| Graduate Degree | - | - |
| Total | $68,068 | $16,667 |
Family Income in Fallon
Family Income Brackets in Fallon
According to the Fallon family income data, there are 32 families falling into the $15,000 to $24,999 income range, which is the most common income bracket and makes up 41.6% of all families.
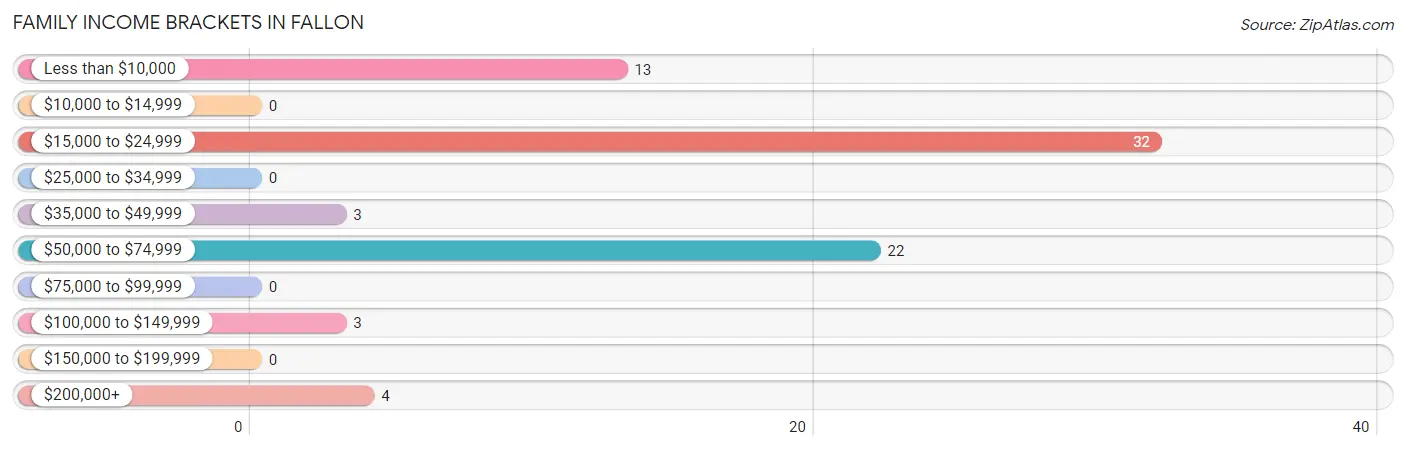
| Income Bracket | # Families | % Families |
| Less than $10,000 | 13 | 16.9% |
| $10,000 to $14,999 | 0 | 0.0% |
| $15,000 to $24,999 | 32 | 41.6% |
| $25,000 to $34,999 | 0 | 0.0% |
| $35,000 to $49,999 | 3 | 3.9% |
| $50,000 to $74,999 | 22 | 28.6% |
| $75,000 to $99,999 | 0 | 0.0% |
| $100,000 to $149,999 | 3 | 3.9% |
| $150,000 to $199,999 | 0 | 0.0% |
| $200,000+ | 4 | 5.2% |
Family Income by Famaliy Size in Fallon
2-person families (52 | 67.5%) account for the highest median family income in Fallon with $16,016 per family, while 2-person families (52 | 67.5%) have the highest median income of $8,008 per family member.
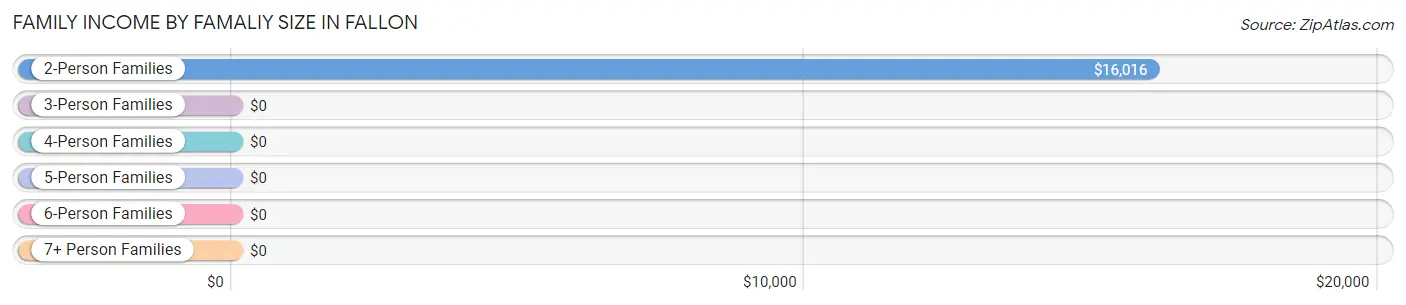
| Income Bracket | # Families | Median Income |
| 2-Person Families | 52 (67.5%) | $16,016 |
| 3-Person Families | 3 (3.9%) | $0 |
| 4-Person Families | 0 (0.0%) | $0 |
| 5-Person Families | 0 (0.0%) | $0 |
| 6-Person Families | 0 (0.0%) | $0 |
| 7+ Person Families | 22 (28.6%) | $0 |
| Total | 77 (100.0%) | $0 |
Family Income by Number of Earners in Fallon
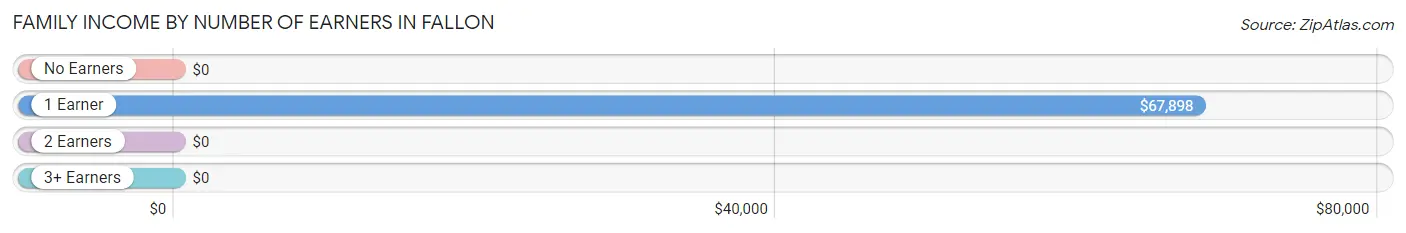
| Number of Earners | # Families | Median Income |
| No Earners | 33 (42.9%) | $0 |
| 1 Earner | 37 (48.0%) | $67,898 |
| 2 Earners | 7 (9.1%) | $0 |
| 3+ Earners | 0 (0.0%) | $0 |
| Total | 77 (100.0%) | $0 |
Household Income in Fallon
Household Income Brackets in Fallon
With 45 households falling in the category, the $15,000 to $24,999 income range is the most frequent in Fallon, accounting for 56.2% of all households.
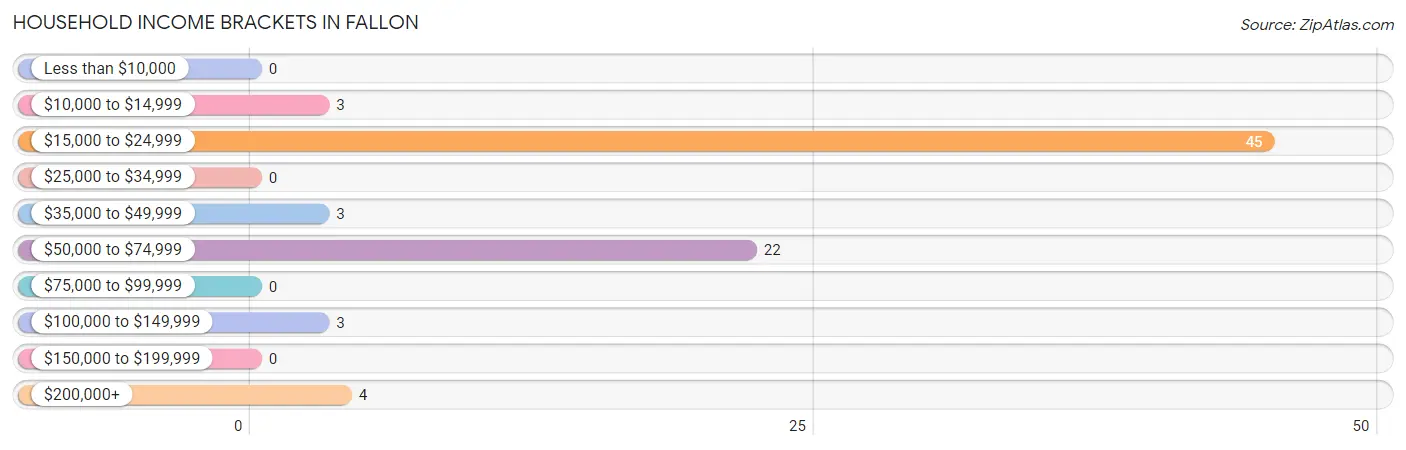
| Income Bracket | # Households | % Households |
| Less than $10,000 | 0 | 0.0% |
| $10,000 to $14,999 | 3 | 3.8% |
| $15,000 to $24,999 | 45 | 56.3% |
| $25,000 to $34,999 | 0 | 0.0% |
| $35,000 to $49,999 | 3 | 3.8% |
| $50,000 to $74,999 | 22 | 27.5% |
| $75,000 to $99,999 | 0 | 0.0% |
| $100,000 to $149,999 | 3 | 3.8% |
| $150,000 to $199,999 | 0 | 0.0% |
| $200,000+ | 4 | 5.0% |
Household Income by Householder Age in Fallon
The median household income in Fallon is $0, with the highest median household income of $16,250 found in the 65+ years age bracket for the primary householder. A total of 26 households (32.5%) fall into this category.
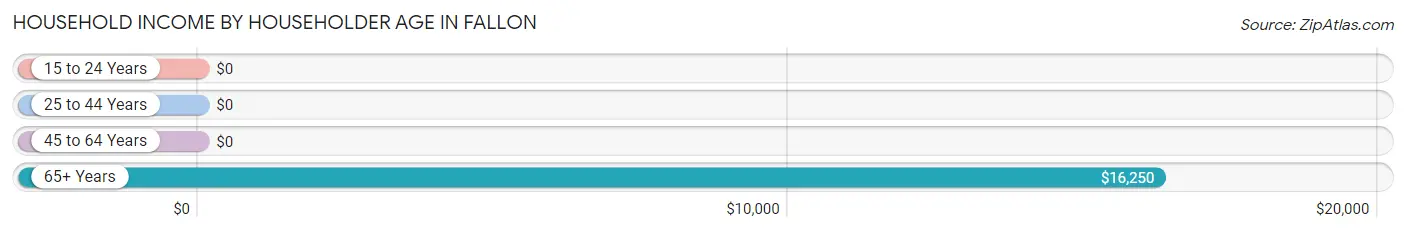
| Income Bracket | # Households | Median Income |
| 15 to 24 Years | 0 (0.0%) | $0 |
| 25 to 44 Years | 47 (58.8%) | $0 |
| 45 to 64 Years | 7 (8.7%) | $0 |
| 65+ Years | 26 (32.5%) | $16,250 |
| Total | 80 (100.0%) | $0 |
Poverty in Fallon
Income Below Poverty by Sex and Age in Fallon
With 44.4% poverty level for males and 31.2% for females among the residents of Fallon, under 5 year old males and 65 to 74 year old females are the most vulnerable to poverty, with 23 males (100.0%) and 23 females (92.0%) in their respective age groups living below the poverty level.
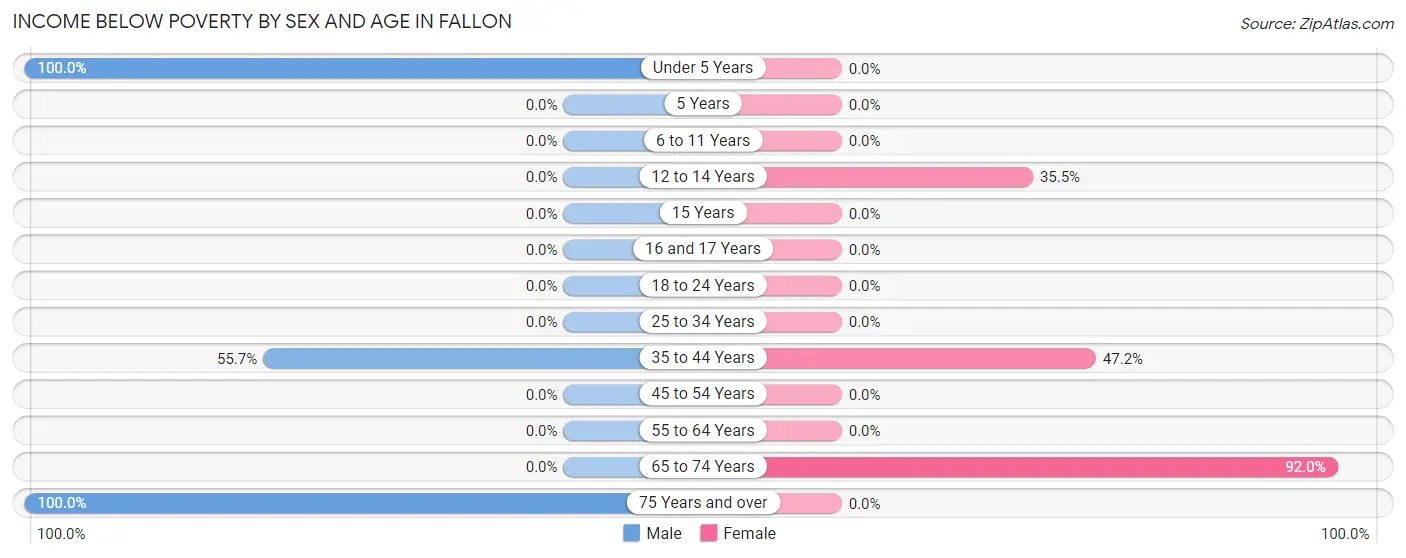
| Age Bracket | Male | Female |
| Under 5 Years | 23 (100.0%) | 0 (0.0%) |
| 5 Years | 0 (0.0%) | 0 (0.0%) |
| 6 to 11 Years | 0 (0.0%) | 0 (0.0%) |
| 12 to 14 Years | 0 (0.0%) | 11 (35.5%) |
| 15 Years | 0 (0.0%) | 0 (0.0%) |
| 16 and 17 Years | 0 (0.0%) | 0 (0.0%) |
| 18 to 24 Years | 0 (0.0%) | 0 (0.0%) |
| 25 to 34 Years | 0 (0.0%) | 0 (0.0%) |
| 35 to 44 Years | 34 (55.7%) | 25 (47.2%) |
| 45 to 54 Years | 0 (0.0%) | 0 (0.0%) |
| 55 to 64 Years | 0 (0.0%) | 0 (0.0%) |
| 65 to 74 Years | 0 (0.0%) | 23 (92.0%) |
| 75 Years and over | 19 (100.0%) | 0 (0.0%) |
| Total | 76 (44.4%) | 59 (31.2%) |
Income Above Poverty by Sex and Age in Fallon
According to the poverty statistics in Fallon, males aged 6 to 11 years and females aged under 5 years are the age groups that are most secure financially, with 100.0% of males and 100.0% of females in these age groups living above the poverty line.
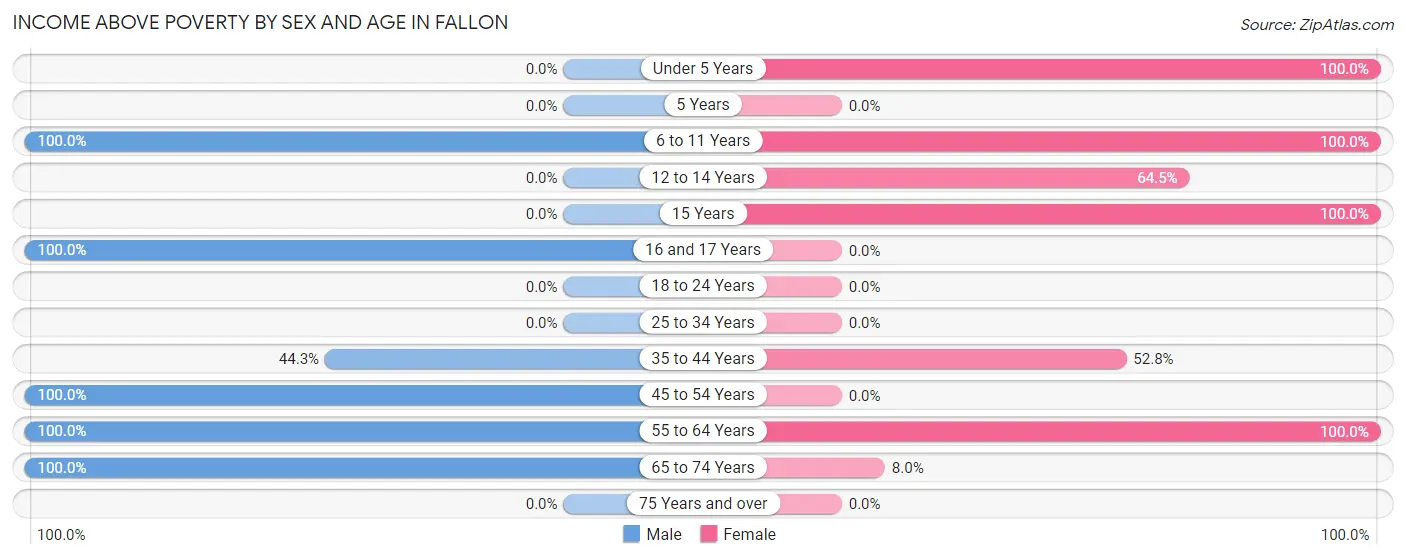
| Age Bracket | Male | Female |
| Under 5 Years | 0 (0.0%) | 21 (100.0%) |
| 5 Years | 0 (0.0%) | 0 (0.0%) |
| 6 to 11 Years | 23 (100.0%) | 39 (100.0%) |
| 12 to 14 Years | 0 (0.0%) | 20 (64.5%) |
| 15 Years | 0 (0.0%) | 17 (100.0%) |
| 16 and 17 Years | 21 (100.0%) | 0 (0.0%) |
| 18 to 24 Years | 0 (0.0%) | 0 (0.0%) |
| 25 to 34 Years | 0 (0.0%) | 0 (0.0%) |
| 35 to 44 Years | 27 (44.3%) | 28 (52.8%) |
| 45 to 54 Years | 14 (100.0%) | 0 (0.0%) |
| 55 to 64 Years | 7 (100.0%) | 3 (100.0%) |
| 65 to 74 Years | 3 (100.0%) | 2 (8.0%) |
| 75 Years and over | 0 (0.0%) | 0 (0.0%) |
| Total | 95 (55.6%) | 130 (68.8%) |
Income Below Poverty Among Married-Couple Families in Fallon
The poverty statistics for married-couple families in Fallon show that 38.5% or 20 of the total 52 families live below the poverty line. Families with no children have the highest poverty rate of 66.7%, comprising of 20 families. On the other hand, families with 5 or more children have the lowest poverty rate of 0.0%, which includes 0 families.
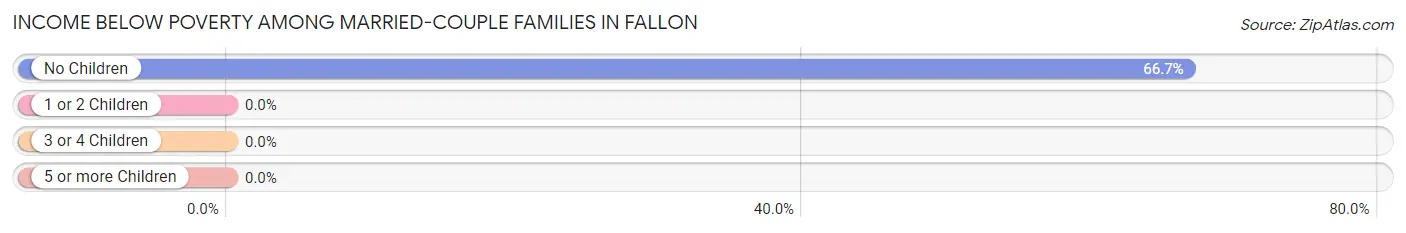
| Children | Above Poverty | Below Poverty |
| No Children | 10 (33.3%) | 20 (66.7%) |
| 1 or 2 Children | 0 (0.0%) | 0 (0.0%) |
| 3 or 4 Children | 0 (0.0%) | 0 (0.0%) |
| 5 or more Children | 22 (100.0%) | 0 (0.0%) |
| Total | 32 (61.5%) | 20 (38.5%) |
Income Below Poverty Among Single-Parent Households in Fallon
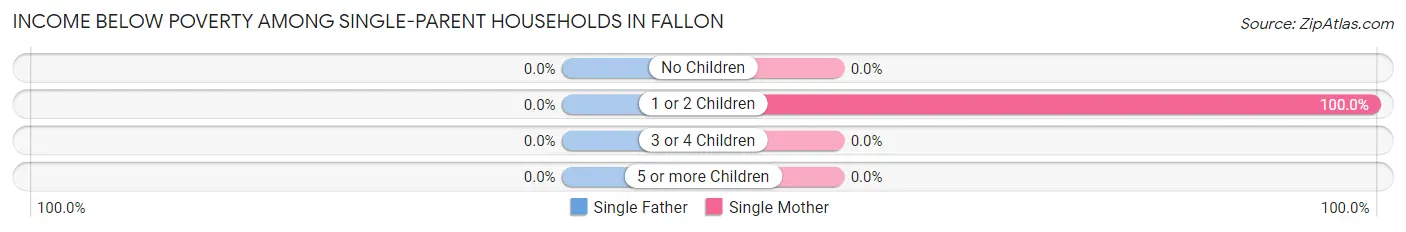
| Children | Single Father | Single Mother |
| No Children | 0 (0.0%) | 0 (0.0%) |
| 1 or 2 Children | 0 (0.0%) | 25 (100.0%) |
| 3 or 4 Children | 0 (0.0%) | 0 (0.0%) |
| 5 or more Children | 0 (0.0%) | 0 (0.0%) |
| Total | 0 (0.0%) | 25 (100.0%) |
Income Below Poverty Among Married-Couple vs Single-Parent Households in Fallon
The poverty data for Fallon shows that 20 of the married-couple family households (38.5%) and 25 of the single-parent households (100.0%) are living below the poverty level. Within the married-couple family households, those with no children have the highest poverty rate, with 20 households (66.7%) falling below the poverty line. Among the single-parent households, those with 1 or 2 children have the highest poverty rate, with 25 household (100.0%) living below poverty.
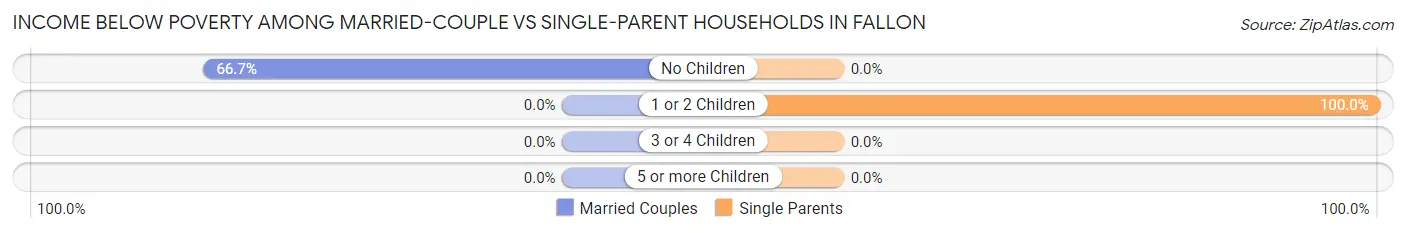
| Children | Married-Couple Families | Single-Parent Households |
| No Children | 20 (66.7%) | 0 (0.0%) |
| 1 or 2 Children | 0 (0.0%) | 25 (100.0%) |
| 3 or 4 Children | 0 (0.0%) | 0 (0.0%) |
| 5 or more Children | 0 (0.0%) | 0 (0.0%) |
| Total | 20 (38.5%) | 25 (100.0%) |
Race in Fallon
The most populous races in Fallon are White / Caucasian (319 | 88.6%), Asian (34 | 9.4%), and Hispanic or Latino (7 | 1.9%).
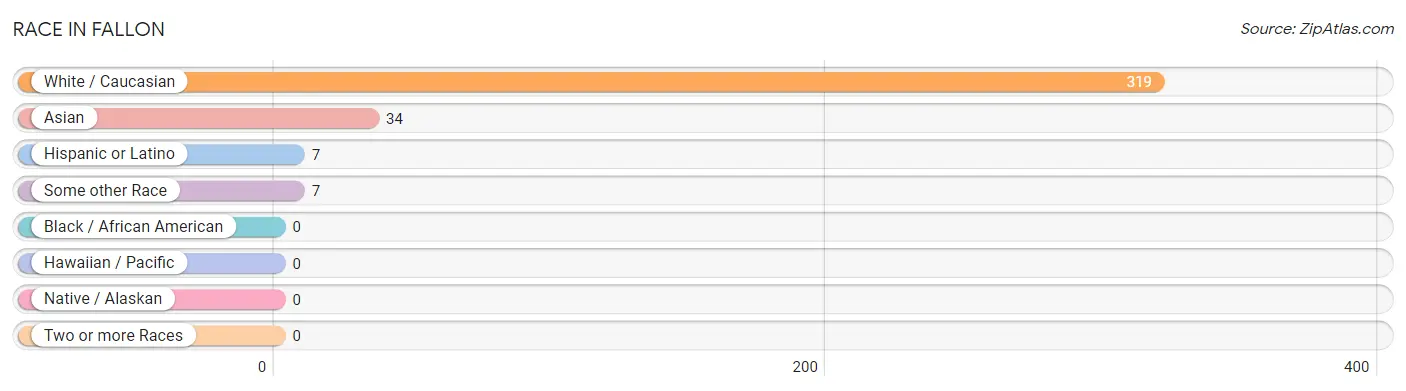
| Race | # Population | % Population |
| Asian | 34 | 9.4% |
| Black / African American | 0 | 0.0% |
| Hawaiian / Pacific | 0 | 0.0% |
| Hispanic or Latino | 7 | 1.9% |
| Native / Alaskan | 0 | 0.0% |
| White / Caucasian | 319 | 88.6% |
| Two or more Races | 0 | 0.0% |
| Some other Race | 7 | 1.9% |
| Total | 360 | 100.0% |
Ancestry in Fallon
The most populous ancestries reported in Fallon are American (39 | 10.8%), Burmese (34 | 9.4%), German (33 | 9.2%), Irish (24 | 6.7%), and Norwegian (11 | 3.1%), together accounting for 39.2% of all Fallon residents.
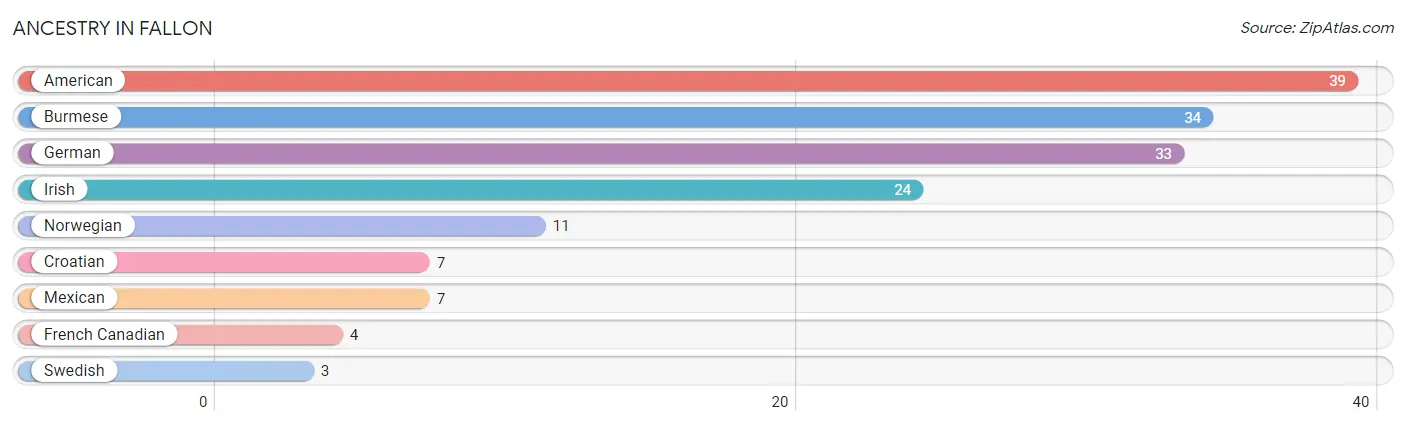
| Ancestry | # Population | % Population |
| American | 39 | 10.8% |
| Burmese | 34 | 9.4% |
| Croatian | 7 | 1.9% |
| French Canadian | 4 | 1.1% |
| German | 33 | 9.2% |
| Irish | 24 | 6.7% |
| Mexican | 7 | 1.9% |
| Norwegian | 11 | 3.1% |
| Swedish | 3 | 0.8% | View All 9 Rows |
Immigrants in Fallon
The most numerous immigrant groups reported in Fallon came from Asia (34 | 9.4%), Eastern Asia (34 | 9.4%), Korea (34 | 9.4%), Central America (7 | 1.9%), and Latin America (7 | 1.9%), together accounting for 32.2% of all Fallon residents.
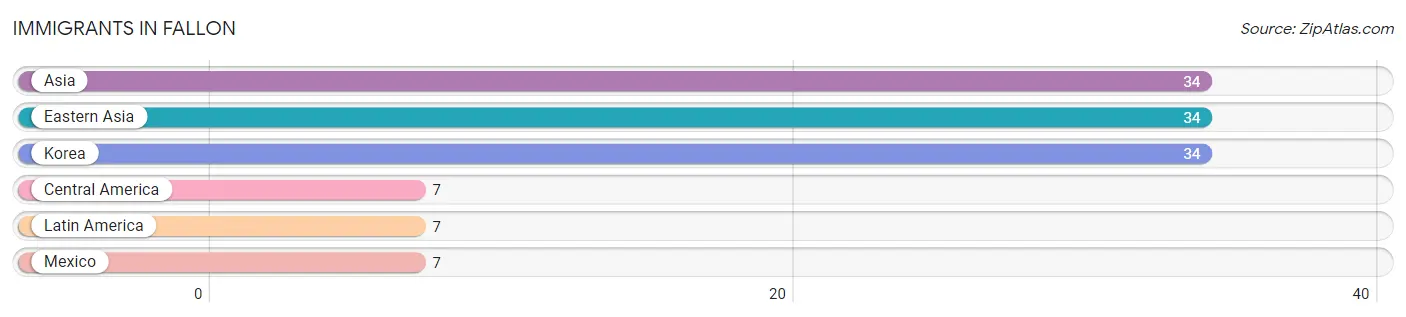
| Immigration Origin | # Population | % Population |
| Asia | 34 | 9.4% |
| Central America | 7 | 1.9% |
| Eastern Asia | 34 | 9.4% |
| Korea | 34 | 9.4% |
| Latin America | 7 | 1.9% |
| Mexico | 7 | 1.9% | View All 6 Rows |
Sex and Age in Fallon
Sex and Age in Fallon
The most populous age groups in Fallon are 35 to 39 Years (39 | 22.8%) for men and 10 to 14 Years (50 | 26.5%) for women.
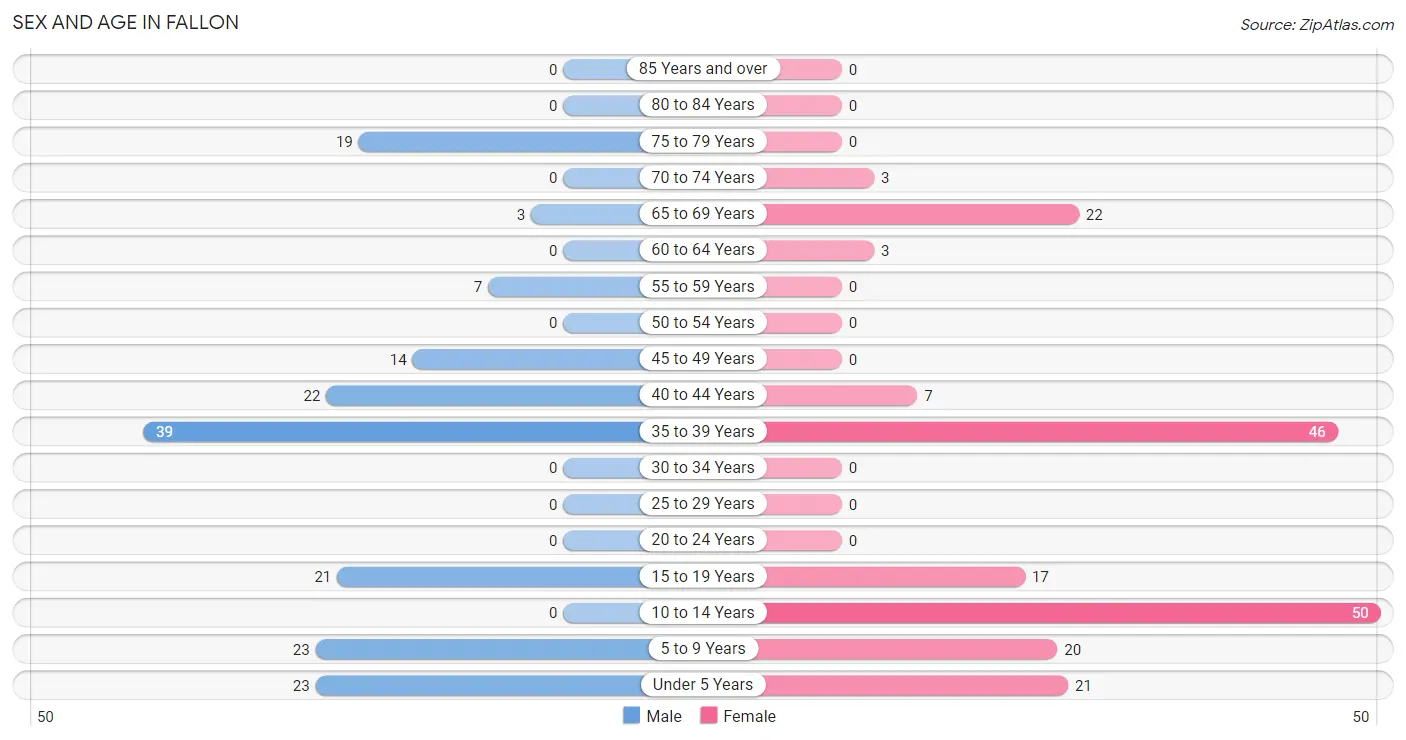
| Age Bracket | Male | Female |
| Under 5 Years | 23 (13.5%) | 21 (11.1%) |
| 5 to 9 Years | 23 (13.5%) | 20 (10.6%) |
| 10 to 14 Years | 0 (0.0%) | 50 (26.5%) |
| 15 to 19 Years | 21 (12.3%) | 17 (9.0%) |
| 20 to 24 Years | 0 (0.0%) | 0 (0.0%) |
| 25 to 29 Years | 0 (0.0%) | 0 (0.0%) |
| 30 to 34 Years | 0 (0.0%) | 0 (0.0%) |
| 35 to 39 Years | 39 (22.8%) | 46 (24.3%) |
| 40 to 44 Years | 22 (12.9%) | 7 (3.7%) |
| 45 to 49 Years | 14 (8.2%) | 0 (0.0%) |
| 50 to 54 Years | 0 (0.0%) | 0 (0.0%) |
| 55 to 59 Years | 7 (4.1%) | 0 (0.0%) |
| 60 to 64 Years | 0 (0.0%) | 3 (1.6%) |
| 65 to 69 Years | 3 (1.8%) | 22 (11.6%) |
| 70 to 74 Years | 0 (0.0%) | 3 (1.6%) |
| 75 to 79 Years | 19 (11.1%) | 0 (0.0%) |
| 80 to 84 Years | 0 (0.0%) | 0 (0.0%) |
| 85 Years and over | 0 (0.0%) | 0 (0.0%) |
| Total | 171 (100.0%) | 189 (100.0%) |
Families and Households in Fallon
Median Family Size in Fallon
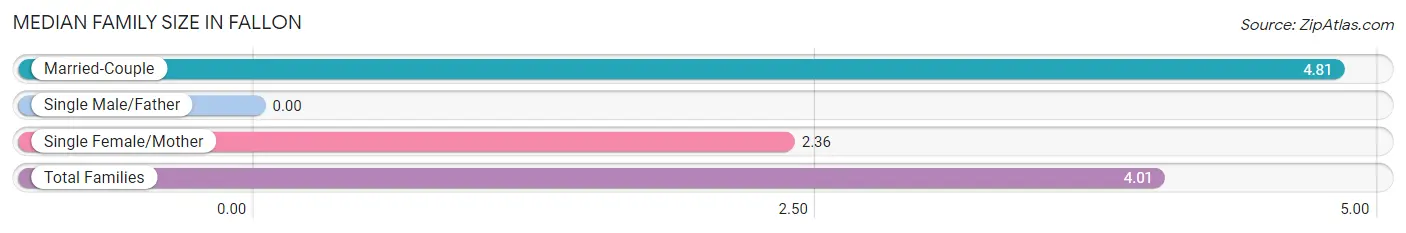
| Family Type | # Families | Family Size |
| Married-Couple | 52 (67.5%) | 4.81 |
| Single Male/Father | 0 (0.0%) | - |
| Single Female/Mother | 25 (32.5%) | 2.36 |
| Total Families | 77 (100.0%) | 4.01 |
Median Household Size in Fallon
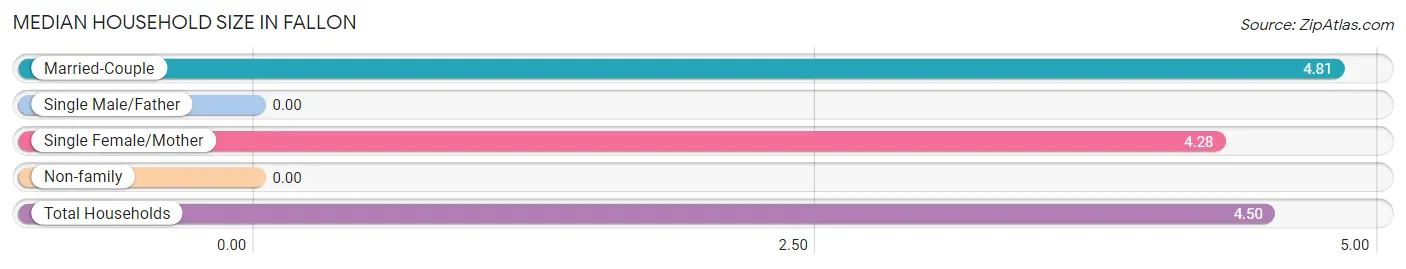
| Household Type | # Households | Household Size |
| Married-Couple | 52 (65.0%) | 4.81 |
| Single Male/Father | 0 (0.0%) | - |
| Single Female/Mother | 25 (31.2%) | 4.28 |
| Non-family | 3 (3.7%) | - |
| Total Households | 80 (100.0%) | 4.50 |
Household Size by Marriage Status in Fallon
Out of a total of 80 households in Fallon, 77 (96.3%) are family households, while 3 (3.7%) are nonfamily households. The most numerous type of family households are 3-person households, comprising 28, and the most common type of nonfamily households are 1-person households, comprising 3.
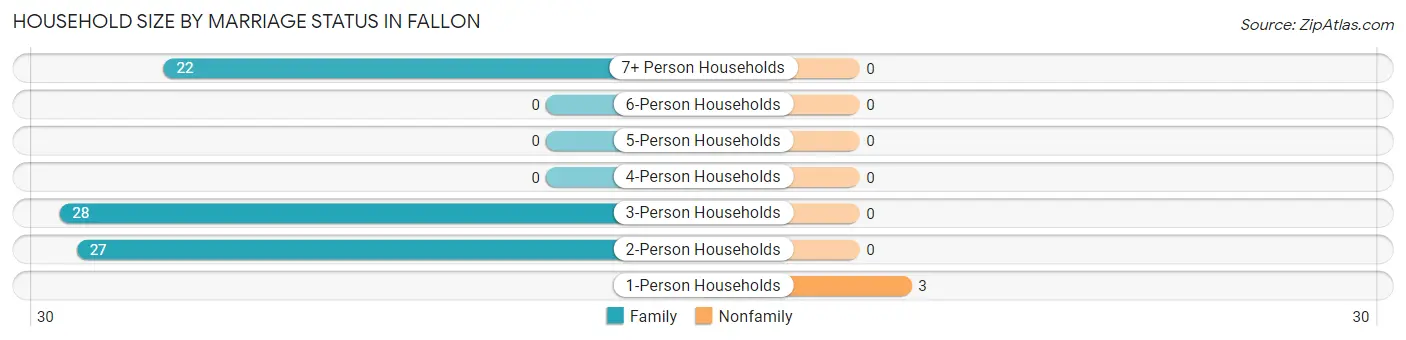
| Household Size | Family Households | Nonfamily Households |
| 1-Person Households | - | 3 (3.7%) |
| 2-Person Households | 27 (33.8%) | 0 (0.0%) |
| 3-Person Households | 28 (35.0%) | 0 (0.0%) |
| 4-Person Households | 0 (0.0%) | 0 (0.0%) |
| 5-Person Households | 0 (0.0%) | 0 (0.0%) |
| 6-Person Households | 0 (0.0%) | 0 (0.0%) |
| 7+ Person Households | 22 (27.5%) | 0 (0.0%) |
| Total | 77 (96.3%) | 3 (3.7%) |
Female Fertility in Fallon
Fertility by Age in Fallon
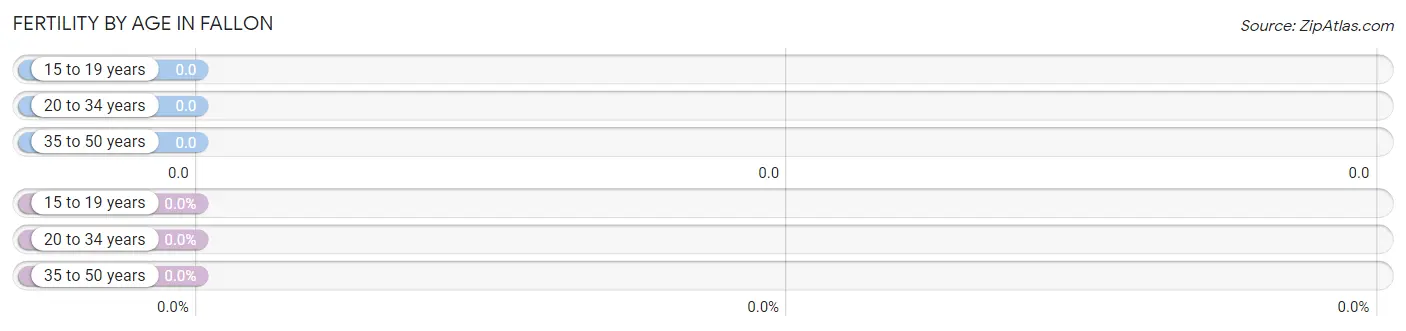
| Age Bracket | Women with Births | Births / 1,000 Women |
| 15 to 19 years | 0 (0.0%) | 0.0 |
| 20 to 34 years | 0 (0.0%) | 0.0 |
| 35 to 50 years | 0 (0.0%) | 0.0 |
| Total | 0 (0.0%) | 0.0 |
Fertility by Age by Marriage Status in Fallon
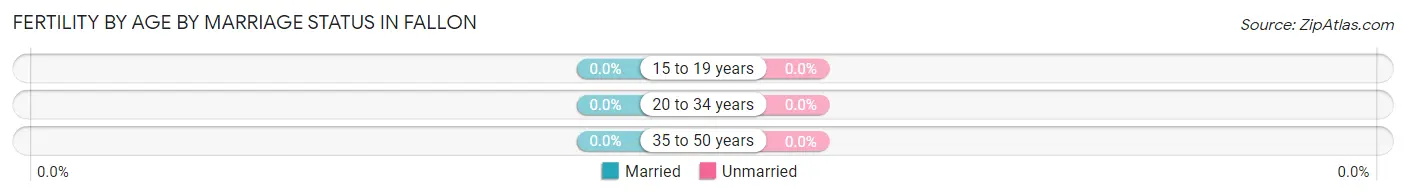
| Age Bracket | Married | Unmarried |
| 15 to 19 years | 0 (0.0%) | 0 (0.0%) |
| 20 to 34 years | 0 (0.0%) | 0 (0.0%) |
| 35 to 50 years | 0 (0.0%) | 0 (0.0%) |
| Total | 0 (0.0%) | 0 (0.0%) |
Fertility by Education in Fallon
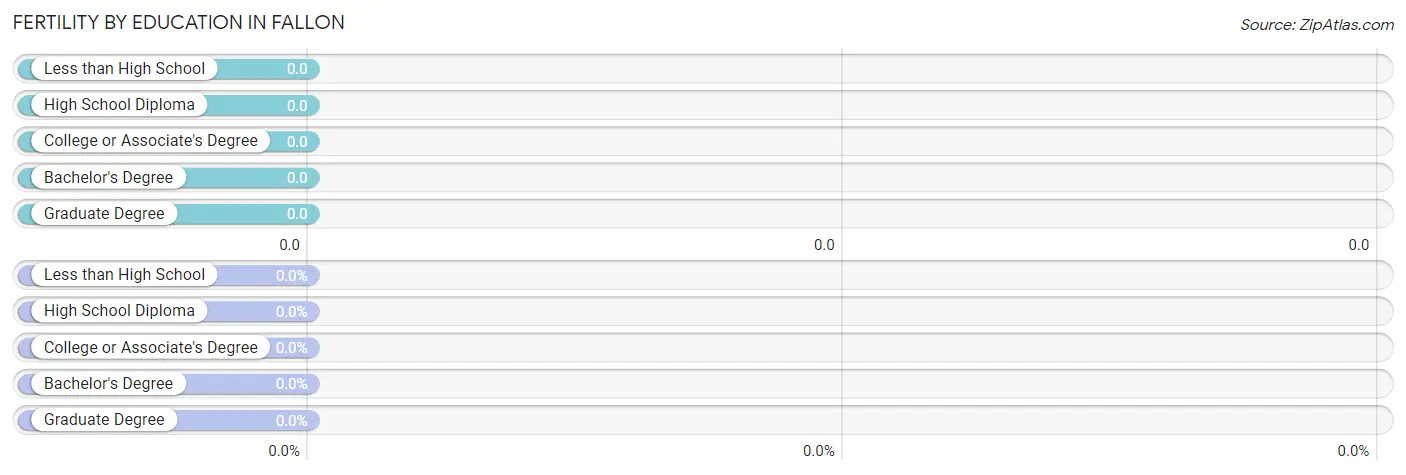
| Educational Attainment | Women with Births | Births / 1,000 Women |
| Less than High School | 0 (0.0%) | 0.0 |
| High School Diploma | 0 (0.0%) | 0.0 |
| College or Associate's Degree | 0 (0.0%) | 0.0 |
| Bachelor's Degree | 0 (0.0%) | 0.0 |
| Graduate Degree | 0 (0.0%) | 0.0 |
| Total | 0 (0.0%) | 0.0 |
Fertility by Education by Marriage Status in Fallon
| Educational Attainment | Married | Unmarried |
| Less than High School | 0 (0.0%) | 0 (0.0%) |
| High School Diploma | 0 (0.0%) | 0 (0.0%) |
| College or Associate's Degree | 0 (0.0%) | 0 (0.0%) |
| Bachelor's Degree | 0 (0.0%) | 0 (0.0%) |
| Graduate Degree | 0 (0.0%) | 0 (0.0%) |
| Total | 0 (0.0%) | 0 (0.0%) |
Employment Characteristics in Fallon
Employment by Class of Employer in Fallon
Among the 67 employed individuals in Fallon, private company employees (48 | 71.6%), self-employed (incorporated) (14 | 20.9%), and local government employees (5 | 7.5%) make up the most common classes of employment.
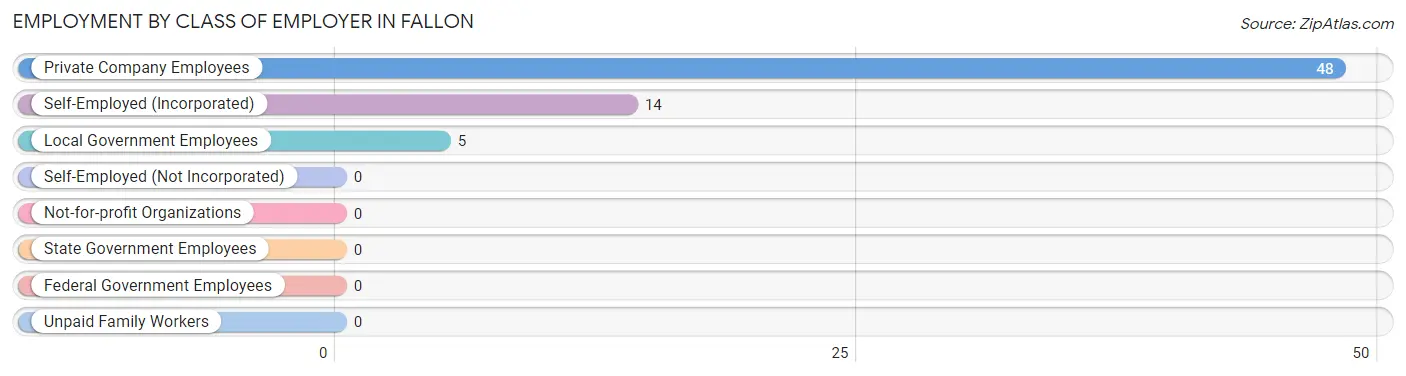
| Employer Class | # Employees | % Employees |
| Private Company Employees | 48 | 71.6% |
| Self-Employed (Incorporated) | 14 | 20.9% |
| Self-Employed (Not Incorporated) | 0 | 0.0% |
| Not-for-profit Organizations | 0 | 0.0% |
| Local Government Employees | 5 | 7.5% |
| State Government Employees | 0 | 0.0% |
| Federal Government Employees | 0 | 0.0% |
| Unpaid Family Workers | 0 | 0.0% |
| Total | 67 | 100.0% |
Employment Status by Age in Fallon
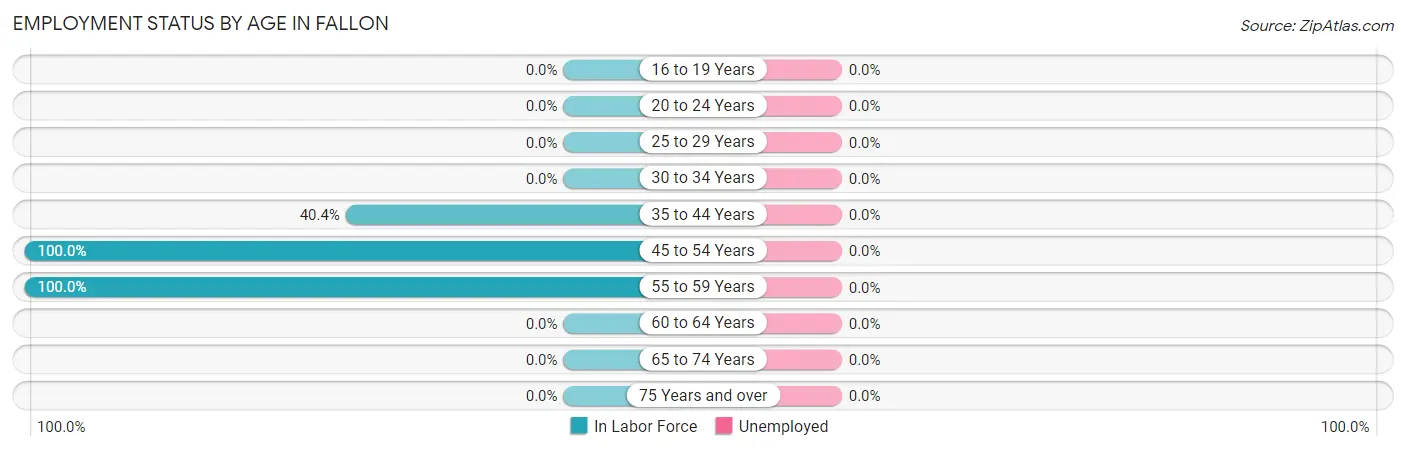
| Age Bracket | In Labor Force | Unemployed |
| 16 to 19 Years | 0 (0.0%) | 0 (0.0%) |
| 20 to 24 Years | 0 (0.0%) | 0 (0.0%) |
| 25 to 29 Years | 0 (0.0%) | 0 (0.0%) |
| 30 to 34 Years | 0 (0.0%) | 0 (0.0%) |
| 35 to 44 Years | 46 (40.4%) | 0 (0.0%) |
| 45 to 54 Years | 14 (100.0%) | 0 (0.0%) |
| 55 to 59 Years | 7 (100.0%) | 0 (0.0%) |
| 60 to 64 Years | 0 (0.0%) | 0 (0.0%) |
| 65 to 74 Years | 0 (0.0%) | 0 (0.0%) |
| 75 Years and over | 0 (0.0%) | 0 (0.0%) |
| Total | 67 (32.5%) | 0 (0.0%) |
Employment Status by Educational Attainment in Fallon
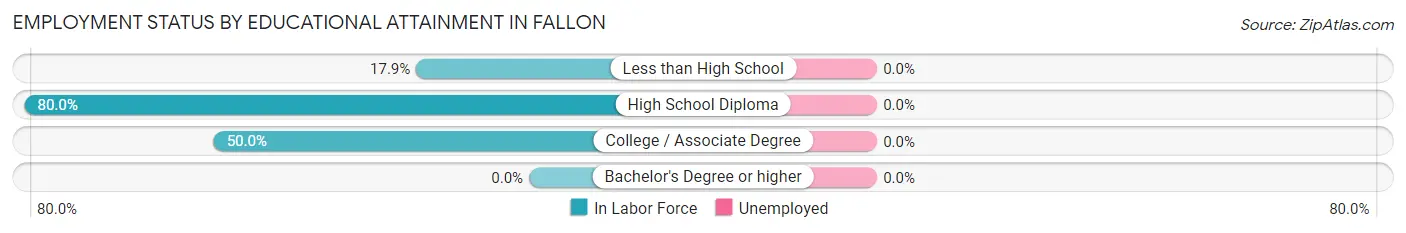
| Educational Attainment | In Labor Force | Unemployed |
| Less than High School | 12 (17.9%) | 0 (0.0%) |
| High School Diploma | 52 (80.0%) | 0 (0.0%) |
| College / Associate Degree | 3 (50.0%) | 0 (0.0%) |
| Bachelor's Degree or higher | 0 (0.0%) | 0 (0.0%) |
| Total | 67 (48.6%) | 0 (0.0%) |
Employment Occupations by Sex in Fallon
Management, Business, Science and Arts Occupations
The most common Management, Business, Science and Arts occupations in Fallon are , and Management (22 | 32.8%).
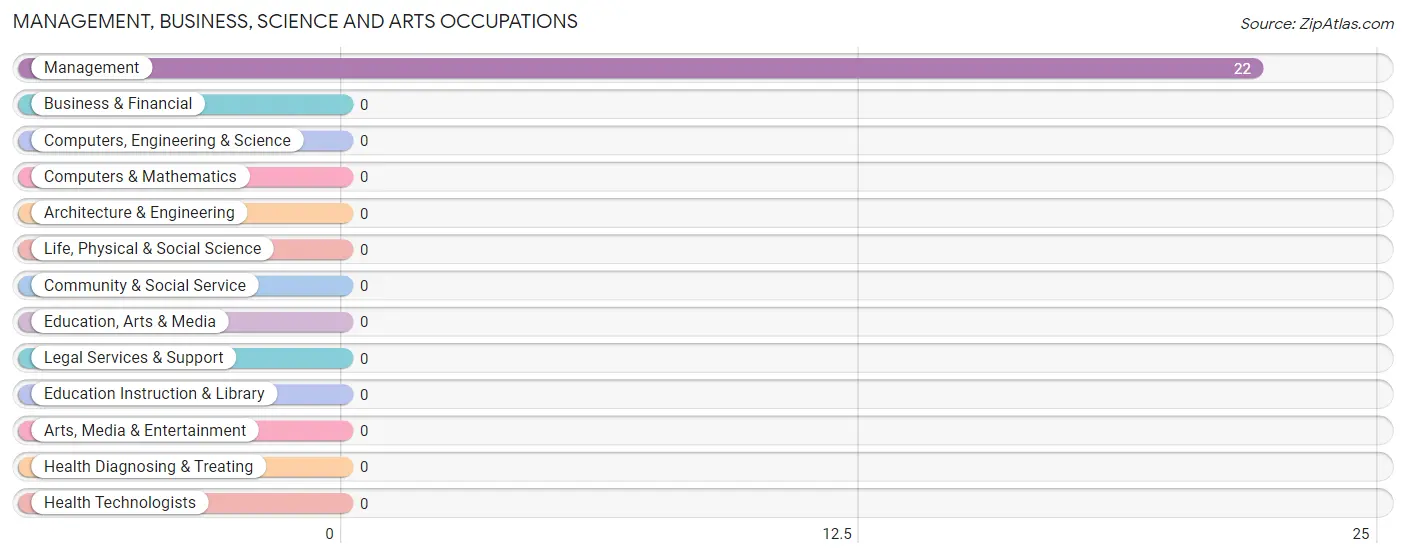
Management, Business, Science and Arts Occupations by Sex
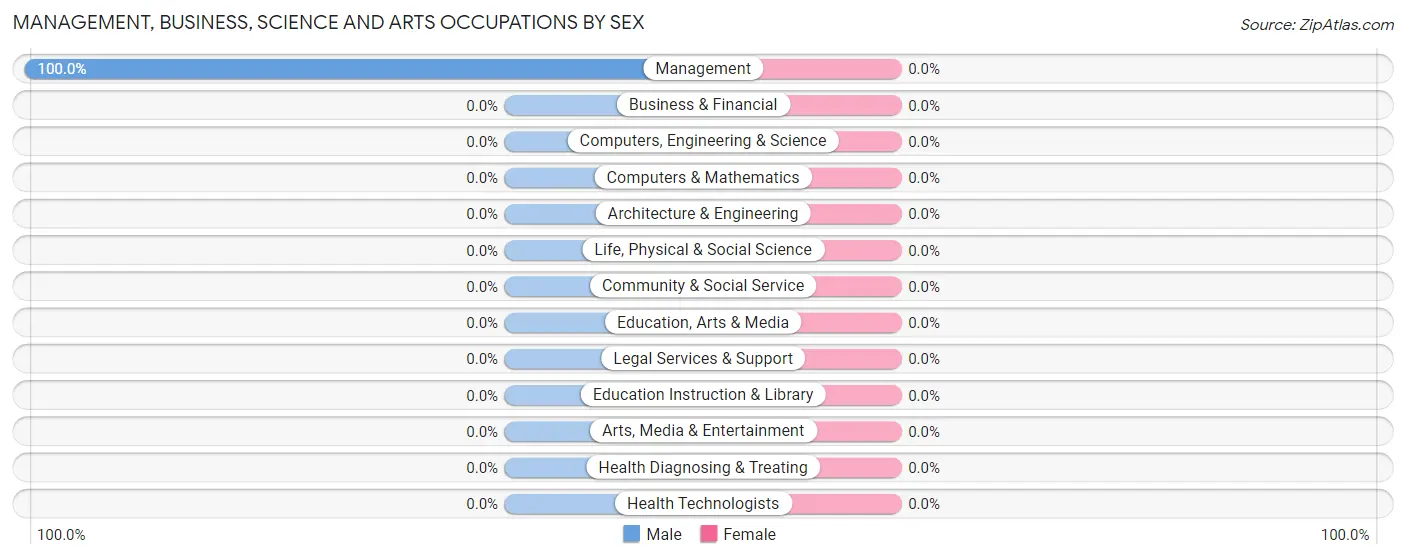
| Occupation | Male | Female |
| Management | 22 (100.0%) | 0 (0.0%) |
| Business & Financial | 0 (0.0%) | 0 (0.0%) |
| Computers, Engineering & Science | 0 (0.0%) | 0 (0.0%) |
| Computers & Mathematics | 0 (0.0%) | 0 (0.0%) |
| Architecture & Engineering | 0 (0.0%) | 0 (0.0%) |
| Life, Physical & Social Science | 0 (0.0%) | 0 (0.0%) |
| Community & Social Service | 0 (0.0%) | 0 (0.0%) |
| Education, Arts & Media | 0 (0.0%) | 0 (0.0%) |
| Legal Services & Support | 0 (0.0%) | 0 (0.0%) |
| Education Instruction & Library | 0 (0.0%) | 0 (0.0%) |
| Arts, Media & Entertainment | 0 (0.0%) | 0 (0.0%) |
| Health Diagnosing & Treating | 0 (0.0%) | 0 (0.0%) |
| Health Technologists | 0 (0.0%) | 0 (0.0%) |
| Total (Category) | 22 (100.0%) | 0 (0.0%) |
| Total (Overall) | 48 (71.6%) | 19 (28.4%) |
Services Occupations
The most common Services occupations in Fallon are Cleaning & Maintenance (17 | 25.4%), and Healthcare Support (7 | 10.4%).
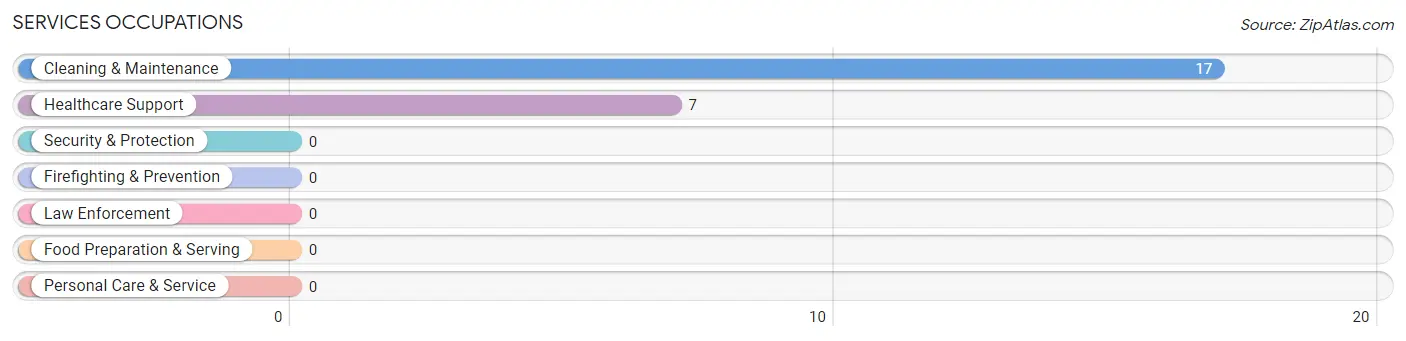
Services Occupations by Sex
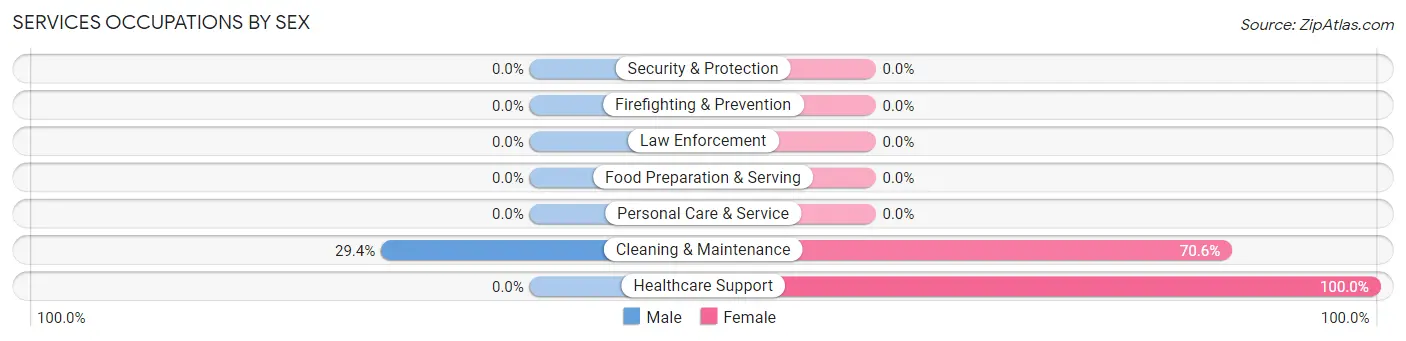
| Occupation | Male | Female |
| Healthcare Support | 0 (0.0%) | 7 (100.0%) |
| Security & Protection | 0 (0.0%) | 0 (0.0%) |
| Firefighting & Prevention | 0 (0.0%) | 0 (0.0%) |
| Law Enforcement | 0 (0.0%) | 0 (0.0%) |
| Food Preparation & Serving | 0 (0.0%) | 0 (0.0%) |
| Cleaning & Maintenance | 5 (29.4%) | 12 (70.6%) |
| Personal Care & Service | 0 (0.0%) | 0 (0.0%) |
| Total (Category) | 5 (20.8%) | 19 (79.2%) |
| Total (Overall) | 48 (71.6%) | 19 (28.4%) |
Sales and Office Occupations
The most common Sales and Office occupations in Fallon are , and Sales & Related (4 | 6.0%).
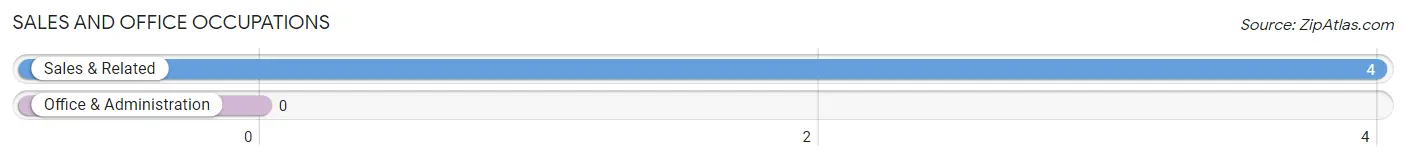
Sales and Office Occupations by Sex

| Occupation | Male | Female |
| Sales & Related | 4 (100.0%) | 0 (0.0%) |
| Office & Administration | 0 (0.0%) | 0 (0.0%) |
| Total (Category) | 4 (100.0%) | 0 (0.0%) |
| Total (Overall) | 48 (71.6%) | 19 (28.4%) |
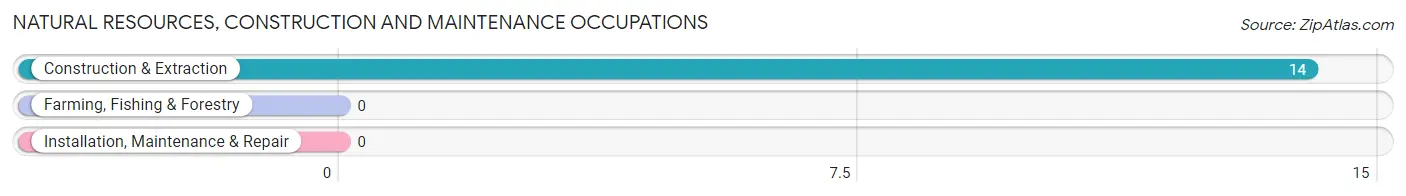
Natural Resources, Construction and Maintenance Occupations
The most common Natural Resources, Construction and Maintenance occupations in Fallon are , and Construction & Extraction (14 | 20.9%).
Natural Resources, Construction and Maintenance Occupations by Sex
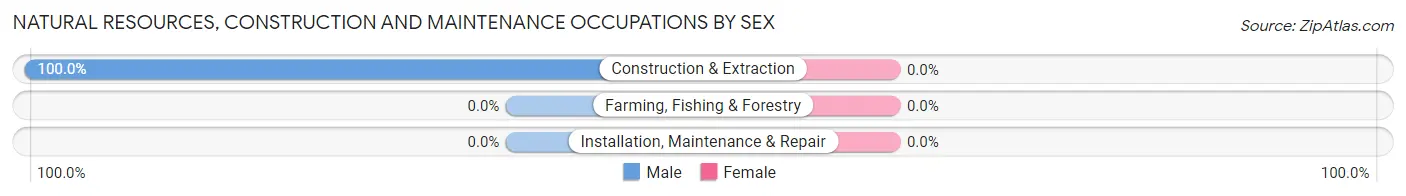
| Occupation | Male | Female |
| Farming, Fishing & Forestry | 0 (0.0%) | 0 (0.0%) |
| Construction & Extraction | 14 (100.0%) | 0 (0.0%) |
| Installation, Maintenance & Repair | 0 (0.0%) | 0 (0.0%) |
| Total (Category) | 14 (100.0%) | 0 (0.0%) |
| Total (Overall) | 48 (71.6%) | 19 (28.4%) |
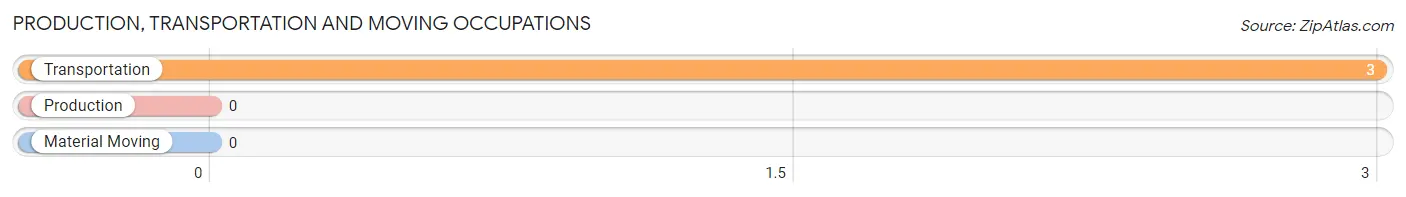
Production, Transportation and Moving Occupations
The most common Production, Transportation and Moving occupations in Fallon are , and Transportation (3 | 4.5%).
Production, Transportation and Moving Occupations by Sex
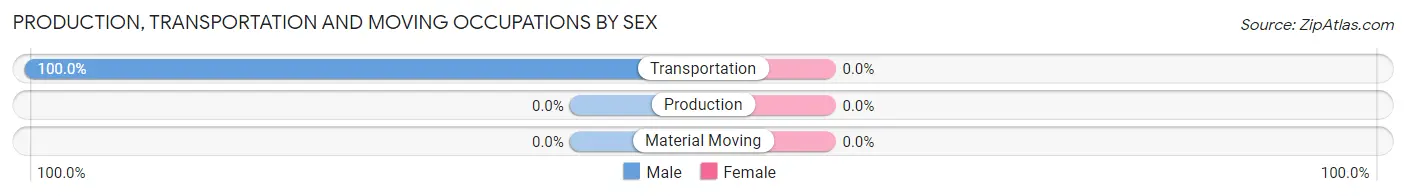
| Occupation | Male | Female |
| Production | 0 (0.0%) | 0 (0.0%) |
| Transportation | 3 (100.0%) | 0 (0.0%) |
| Material Moving | 0 (0.0%) | 0 (0.0%) |
| Total (Category) | 3 (100.0%) | 0 (0.0%) |
| Total (Overall) | 48 (71.6%) | 19 (28.4%) |
Employment Industries by Sex in Fallon
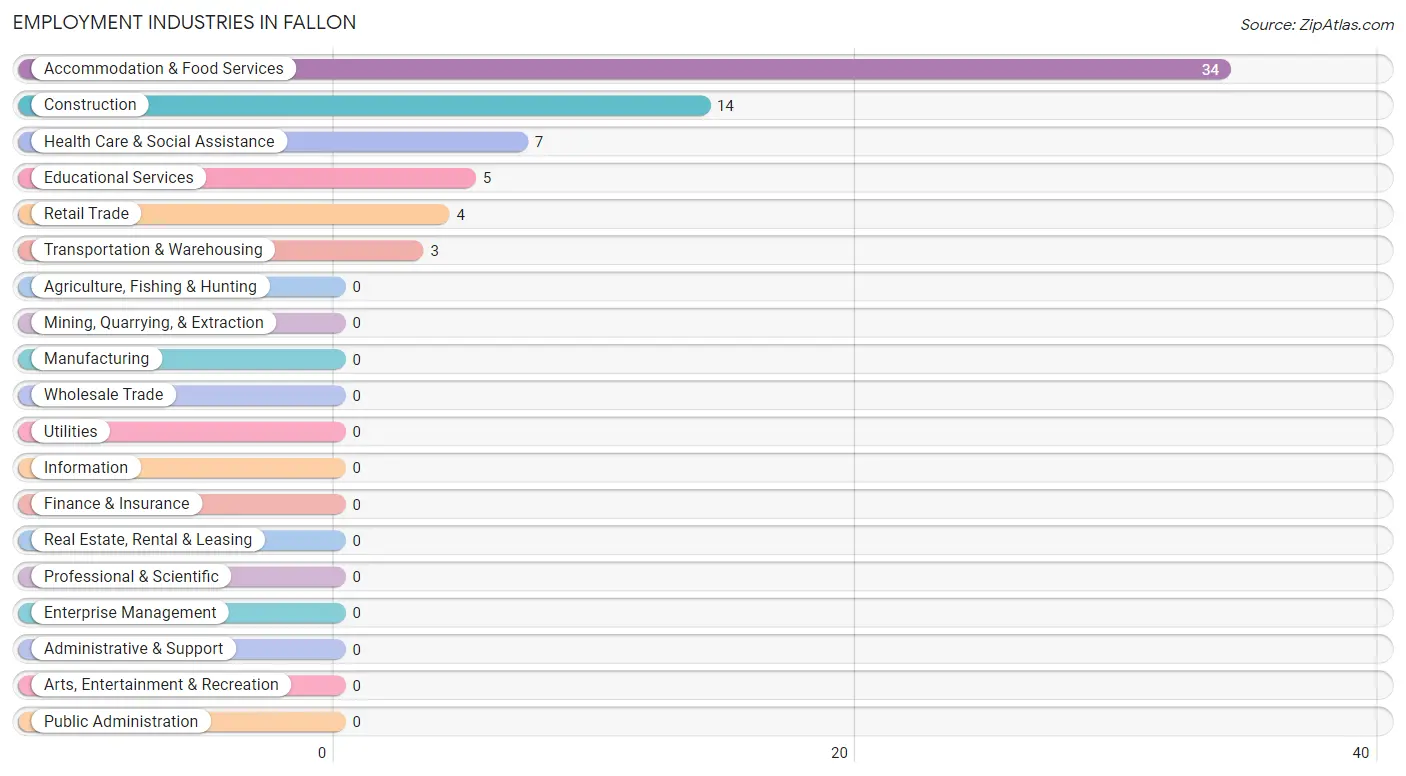
Employment Industries in Fallon
The major employment industries in Fallon include Accommodation & Food Services (34 | 50.7%), Construction (14 | 20.9%), Health Care & Social Assistance (7 | 10.4%), Educational Services (5 | 7.5%), and Retail Trade (4 | 6.0%).
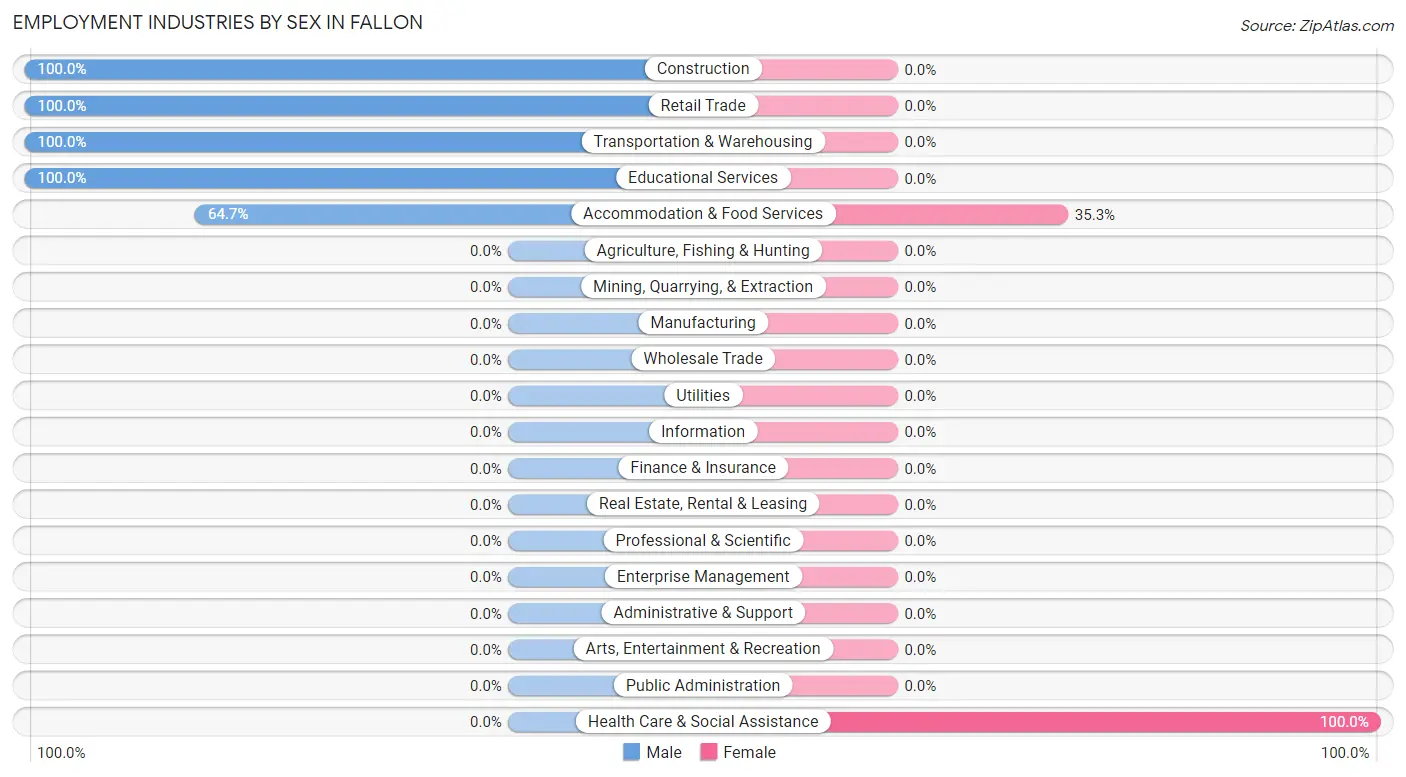
Employment Industries by Sex in Fallon
The Fallon industries that see more men than women are Construction (100.0%), Retail Trade (100.0%), and Transportation & Warehousing (100.0%), whereas the industries that tend to have a higher number of women are Health Care & Social Assistance (100.0%), and Accommodation & Food Services (35.3%).
| Industry | Male | Female |
| Agriculture, Fishing & Hunting | 0 (0.0%) | 0 (0.0%) |
| Mining, Quarrying, & Extraction | 0 (0.0%) | 0 (0.0%) |
| Construction | 14 (100.0%) | 0 (0.0%) |
| Manufacturing | 0 (0.0%) | 0 (0.0%) |
| Wholesale Trade | 0 (0.0%) | 0 (0.0%) |
| Retail Trade | 4 (100.0%) | 0 (0.0%) |
| Transportation & Warehousing | 3 (100.0%) | 0 (0.0%) |
| Utilities | 0 (0.0%) | 0 (0.0%) |
| Information | 0 (0.0%) | 0 (0.0%) |
| Finance & Insurance | 0 (0.0%) | 0 (0.0%) |
| Real Estate, Rental & Leasing | 0 (0.0%) | 0 (0.0%) |
| Professional & Scientific | 0 (0.0%) | 0 (0.0%) |
| Enterprise Management | 0 (0.0%) | 0 (0.0%) |
| Administrative & Support | 0 (0.0%) | 0 (0.0%) |
| Educational Services | 5 (100.0%) | 0 (0.0%) |
| Health Care & Social Assistance | 0 (0.0%) | 7 (100.0%) |
| Arts, Entertainment & Recreation | 0 (0.0%) | 0 (0.0%) |
| Accommodation & Food Services | 22 (64.7%) | 12 (35.3%) |
| Public Administration | 0 (0.0%) | 0 (0.0%) |
| Total | 48 (71.6%) | 19 (28.4%) |
Education in Fallon
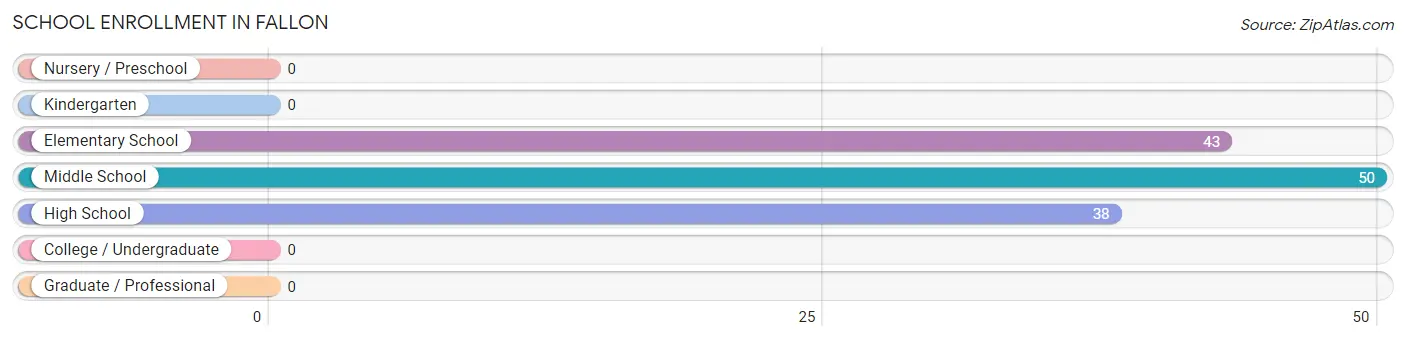
School Enrollment in Fallon
The most common levels of schooling among the 131 students in Fallon are middle school (50 | 38.2%), elementary school (43 | 32.8%), and high school (38 | 29.0%).
| School Level | # Students | % Students |
| Nursery / Preschool | 0 | 0.0% |
| Kindergarten | 0 | 0.0% |
| Elementary School | 43 | 32.8% |
| Middle School | 50 | 38.2% |
| High School | 38 | 29.0% |
| College / Undergraduate | 0 | 0.0% |
| Graduate / Professional | 0 | 0.0% |
| Total | 131 | 100.0% |
School Enrollment by Age by Funding Source in Fallon
Out of a total of 131 students who are enrolled in schools in Fallon, 58 (44.3%) attend a private institution, while the remaining 73 (55.7%) are enrolled in public schools. The age group of 15 to 17 year olds has the highest likelihood of being enrolled in private schools, with 38 (100.0% in the age bracket) enrolled. Conversely, the age group of 5 to 9 year old has the lowest likelihood of being enrolled in a private school, with 43 (100.0% in the age bracket) attending a public institution.
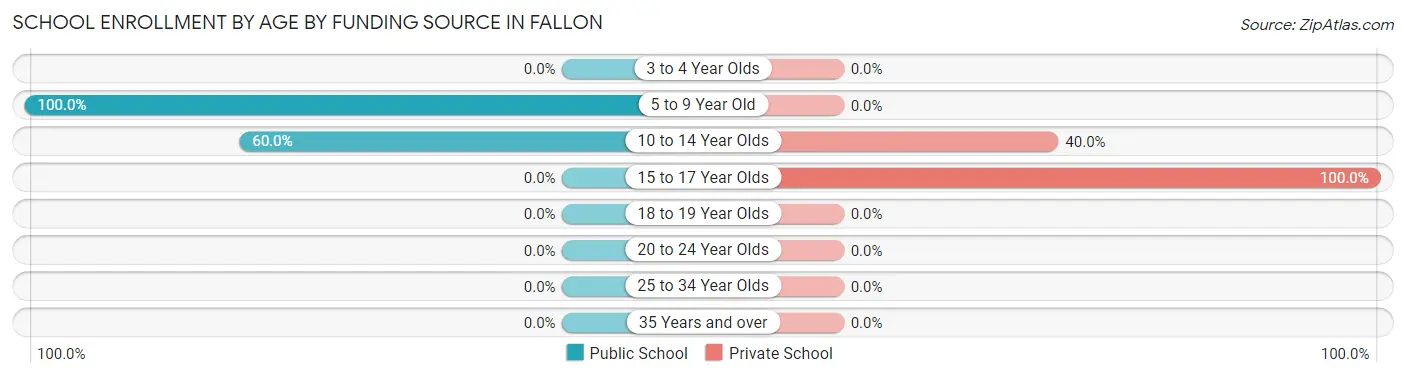
| Age Bracket | Public School | Private School |
| 3 to 4 Year Olds | 0 (0.0%) | 0 (0.0%) |
| 5 to 9 Year Old | 43 (100.0%) | 0 (0.0%) |
| 10 to 14 Year Olds | 30 (60.0%) | 20 (40.0%) |
| 15 to 17 Year Olds | 0 (0.0%) | 38 (100.0%) |
| 18 to 19 Year Olds | 0 (0.0%) | 0 (0.0%) |
| 20 to 24 Year Olds | 0 (0.0%) | 0 (0.0%) |
| 25 to 34 Year Olds | 0 (0.0%) | 0 (0.0%) |
| 35 Years and over | 0 (0.0%) | 0 (0.0%) |
| Total | 73 (55.7%) | 58 (44.3%) |
Educational Attainment by Field of Study in Fallon
| Field of Study | # Graduates | % Graduates |
| Computers & Mathematics | 0 | 0.0% |
| Bio, Nature & Agricultural | 0 | 0.0% |
| Physical & Health Sciences | 0 | 0.0% |
| Psychology | 0 | 0.0% |
| Social Sciences | 0 | 0.0% |
| Engineering | 0 | 0.0% |
| Multidisciplinary Studies | 0 | 0.0% |
| Science & Technology | 0 | 0.0% |
| Business | 0 | 0.0% |
| Education | 0 | 0.0% |
| Literature & Languages | 0 | 0.0% |
| Liberal Arts & History | 0 | 0.0% |
| Visual & Performing Arts | 0 | 0.0% |
| Communications | 0 | 0.0% |
| Arts & Humanities | 0 | 0.0% |
| Total | 0 | 0.0% |
Transportation & Commute in Fallon
Vehicle Availability by Sex in Fallon
The most prevalent vehicle ownership categories in Fallon are males with 3 vehicles (29, accounting for 60.4%) and females with 3 vehicles (7, making up 152.6%).
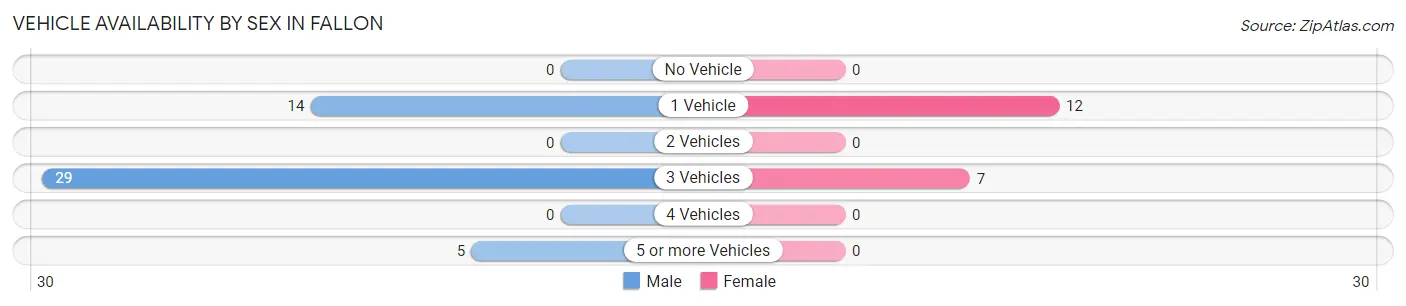
| Vehicles Available | Male | Female |
| No Vehicle | 0 (0.0%) | 0 (0.0%) |
| 1 Vehicle | 14 (29.2%) | 12 (63.2%) |
| 2 Vehicles | 0 (0.0%) | 0 (0.0%) |
| 3 Vehicles | 29 (60.4%) | 7 (36.8%) |
| 4 Vehicles | 0 (0.0%) | 0 (0.0%) |
| 5 or more Vehicles | 5 (10.4%) | 0 (0.0%) |
| Total | 48 (100.0%) | 19 (100.0%) |
Commute Time in Fallon
The most frequently occuring commute durations in Fallon are less than 5 minutes (36 commuters, 53.7%), 25 to 29 minutes (12 commuters, 17.9%), and 15 to 19 minutes (7 commuters, 10.4%).
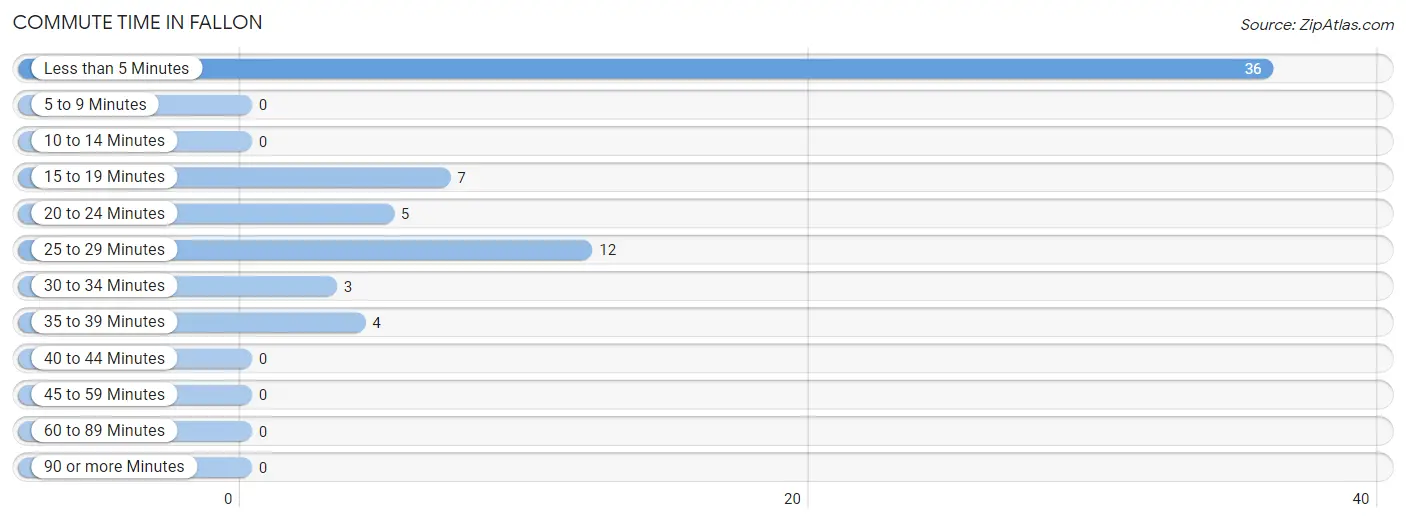
| Commute Time | # Commuters | % Commuters |
| Less than 5 Minutes | 36 | 53.7% |
| 5 to 9 Minutes | 0 | 0.0% |
| 10 to 14 Minutes | 0 | 0.0% |
| 15 to 19 Minutes | 7 | 10.4% |
| 20 to 24 Minutes | 5 | 7.5% |
| 25 to 29 Minutes | 12 | 17.9% |
| 30 to 34 Minutes | 3 | 4.5% |
| 35 to 39 Minutes | 4 | 6.0% |
| 40 to 44 Minutes | 0 | 0.0% |
| 45 to 59 Minutes | 0 | 0.0% |
| 60 to 89 Minutes | 0 | 0.0% |
| 90 or more Minutes | 0 | 0.0% |
Commute Time by Sex in Fallon
The most common commute times in Fallon are less than 5 minutes (36 commuters, 75.0%) for males and 25 to 29 minutes (12 commuters, 63.2%) for females.
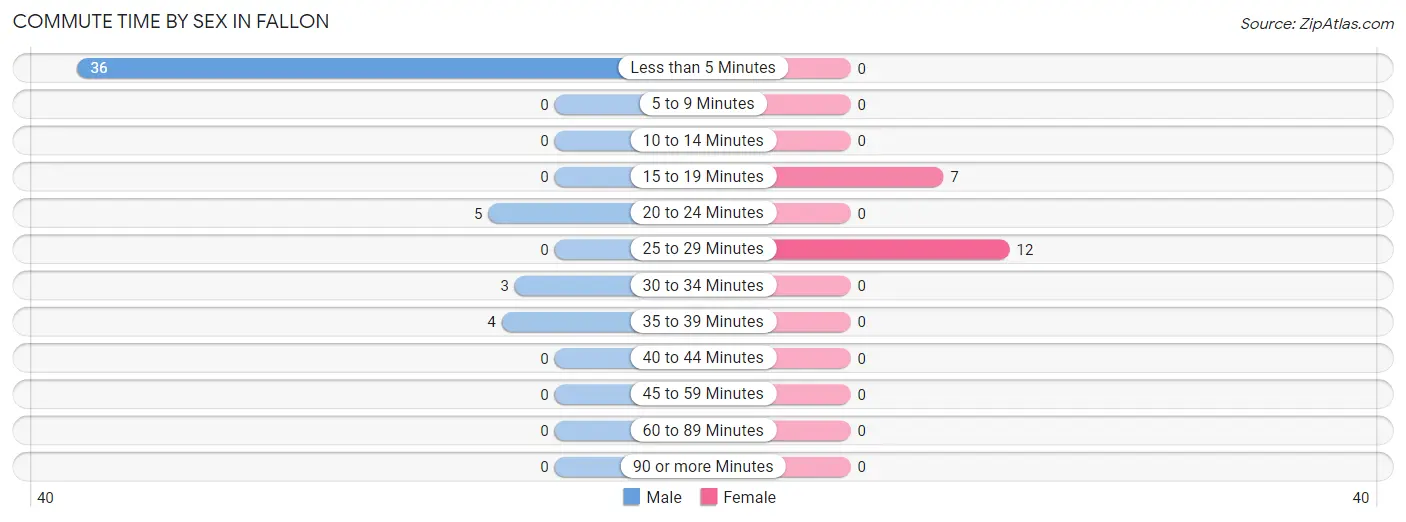
| Commute Time | Male | Female |
| Less than 5 Minutes | 36 (75.0%) | 0 (0.0%) |
| 5 to 9 Minutes | 0 (0.0%) | 0 (0.0%) |
| 10 to 14 Minutes | 0 (0.0%) | 0 (0.0%) |
| 15 to 19 Minutes | 0 (0.0%) | 7 (36.8%) |
| 20 to 24 Minutes | 5 (10.4%) | 0 (0.0%) |
| 25 to 29 Minutes | 0 (0.0%) | 12 (63.2%) |
| 30 to 34 Minutes | 3 (6.2%) | 0 (0.0%) |
| 35 to 39 Minutes | 4 (8.3%) | 0 (0.0%) |
| 40 to 44 Minutes | 0 (0.0%) | 0 (0.0%) |
| 45 to 59 Minutes | 0 (0.0%) | 0 (0.0%) |
| 60 to 89 Minutes | 0 (0.0%) | 0 (0.0%) |
| 90 or more Minutes | 0 (0.0%) | 0 (0.0%) |
Time of Departure to Work by Sex in Fallon
The most frequent times of departure to work in Fallon are 8:30 AM to 8:59 AM (22, 45.8%) for males and 8:00 AM to 8:29 AM (12, 63.2%) for females.
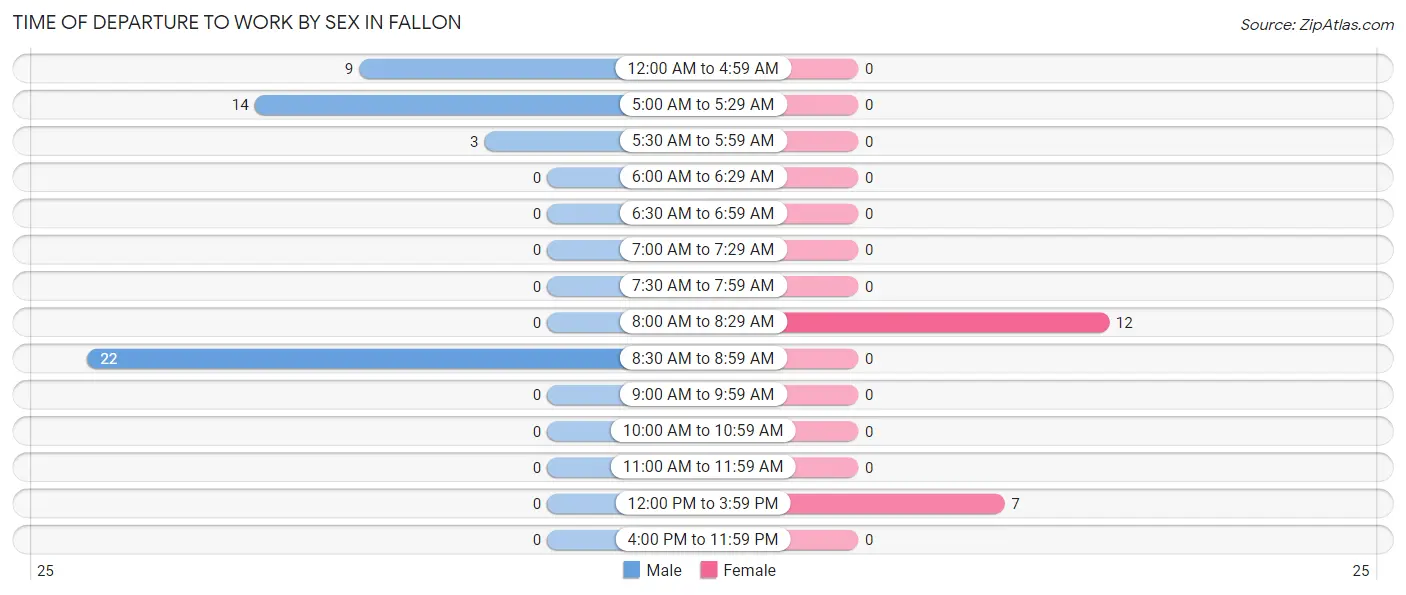
| Time of Departure | Male | Female |
| 12:00 AM to 4:59 AM | 9 (18.8%) | 0 (0.0%) |
| 5:00 AM to 5:29 AM | 14 (29.2%) | 0 (0.0%) |
| 5:30 AM to 5:59 AM | 3 (6.2%) | 0 (0.0%) |
| 6:00 AM to 6:29 AM | 0 (0.0%) | 0 (0.0%) |
| 6:30 AM to 6:59 AM | 0 (0.0%) | 0 (0.0%) |
| 7:00 AM to 7:29 AM | 0 (0.0%) | 0 (0.0%) |
| 7:30 AM to 7:59 AM | 0 (0.0%) | 0 (0.0%) |
| 8:00 AM to 8:29 AM | 0 (0.0%) | 12 (63.2%) |
| 8:30 AM to 8:59 AM | 22 (45.8%) | 0 (0.0%) |
| 9:00 AM to 9:59 AM | 0 (0.0%) | 0 (0.0%) |
| 10:00 AM to 10:59 AM | 0 (0.0%) | 0 (0.0%) |
| 11:00 AM to 11:59 AM | 0 (0.0%) | 0 (0.0%) |
| 12:00 PM to 3:59 PM | 0 (0.0%) | 7 (36.8%) |
| 4:00 PM to 11:59 PM | 0 (0.0%) | 0 (0.0%) |
| Total | 48 (100.0%) | 19 (100.0%) |
Housing Occupancy in Fallon
Occupancy by Ownership in Fallon
Of the total 80 dwellings in Fallon, owner-occupied units account for 33 (41.2%), while renter-occupied units make up 47 (58.8%).
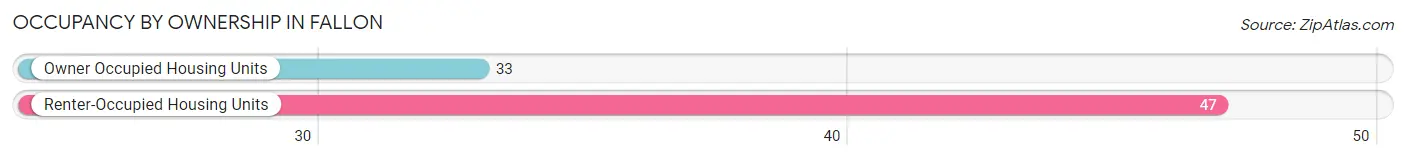
| Occupancy | # Housing Units | % Housing Units |
| Owner Occupied Housing Units | 33 | 41.2% |
| Renter-Occupied Housing Units | 47 | 58.8% |
| Total Occupied Housing Units | 80 | 100.0% |
Occupancy by Household Size in Fallon
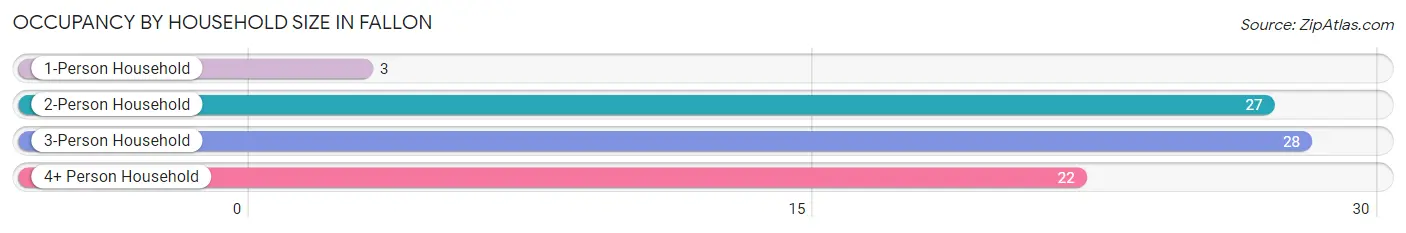
| Household Size | # Housing Units | % Housing Units |
| 1-Person Household | 3 | 3.7% |
| 2-Person Household | 27 | 33.8% |
| 3-Person Household | 28 | 35.0% |
| 4+ Person Household | 22 | 27.5% |
| Total Housing Units | 80 | 100.0% |
Occupancy by Ownership by Household Size in Fallon
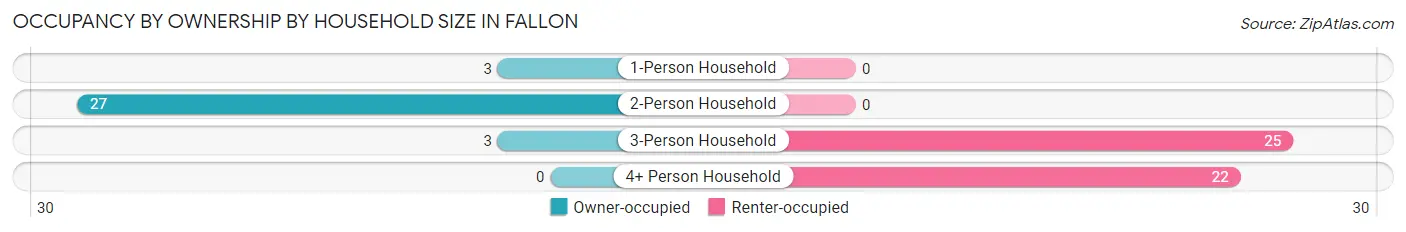
| Household Size | Owner-occupied | Renter-occupied |
| 1-Person Household | 3 (100.0%) | 0 (0.0%) |
| 2-Person Household | 27 (100.0%) | 0 (0.0%) |
| 3-Person Household | 3 (10.7%) | 25 (89.3%) |
| 4+ Person Household | 0 (0.0%) | 22 (100.0%) |
| Total Housing Units | 33 (41.2%) | 47 (58.8%) |
Occupancy by Educational Attainment in Fallon
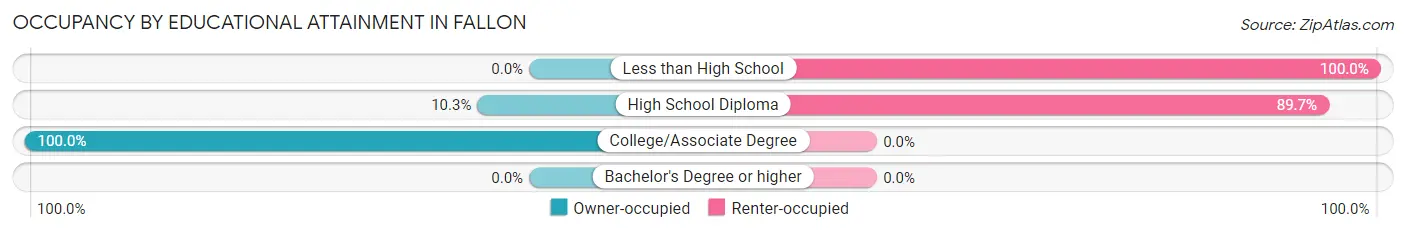
| Household Size | Owner-occupied | Renter-occupied |
| Less than High School | 0 (0.0%) | 12 (100.0%) |
| High School Diploma | 4 (10.3%) | 35 (89.7%) |
| College/Associate Degree | 29 (100.0%) | 0 (0.0%) |
| Bachelor's Degree or higher | 0 (0.0%) | 0 (0.0%) |
Occupancy by Age of Householder in Fallon
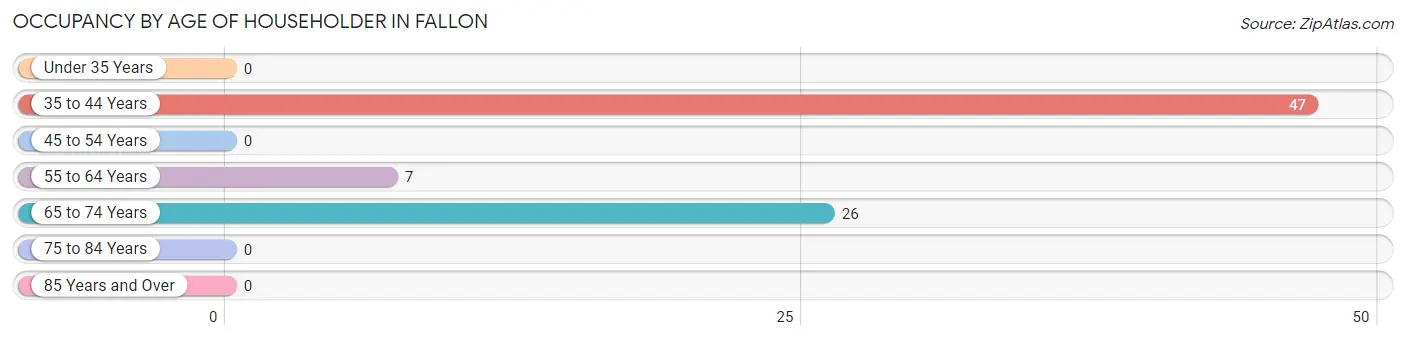
| Age Bracket | # Households | % Households |
| Under 35 Years | 0 | 0.0% |
| 35 to 44 Years | 47 | 58.8% |
| 45 to 54 Years | 0 | 0.0% |
| 55 to 64 Years | 7 | 8.7% |
| 65 to 74 Years | 26 | 32.5% |
| 75 to 84 Years | 0 | 0.0% |
| 85 Years and Over | 0 | 0.0% |
| Total | 80 | 100.0% |
Housing Finances in Fallon
Median Income by Occupancy in Fallon
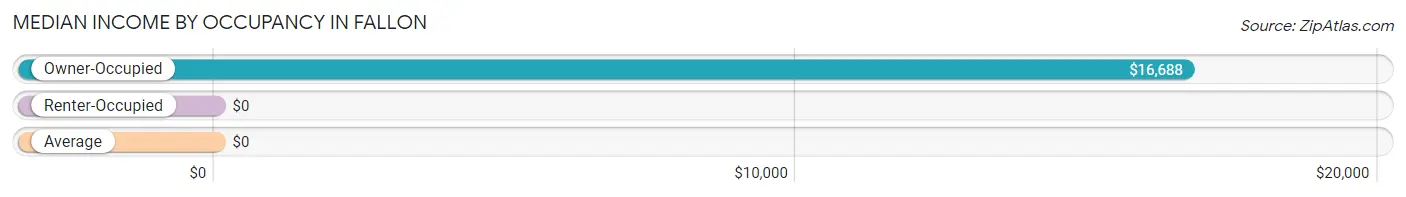
| Occupancy Type | # Households | Median Income |
| Owner-Occupied | 33 (41.2%) | $16,688 |
| Renter-Occupied | 47 (58.8%) | $0 |
| Average | 80 (100.0%) | $0 |
Occupancy by Householder Income Bracket in Fallon
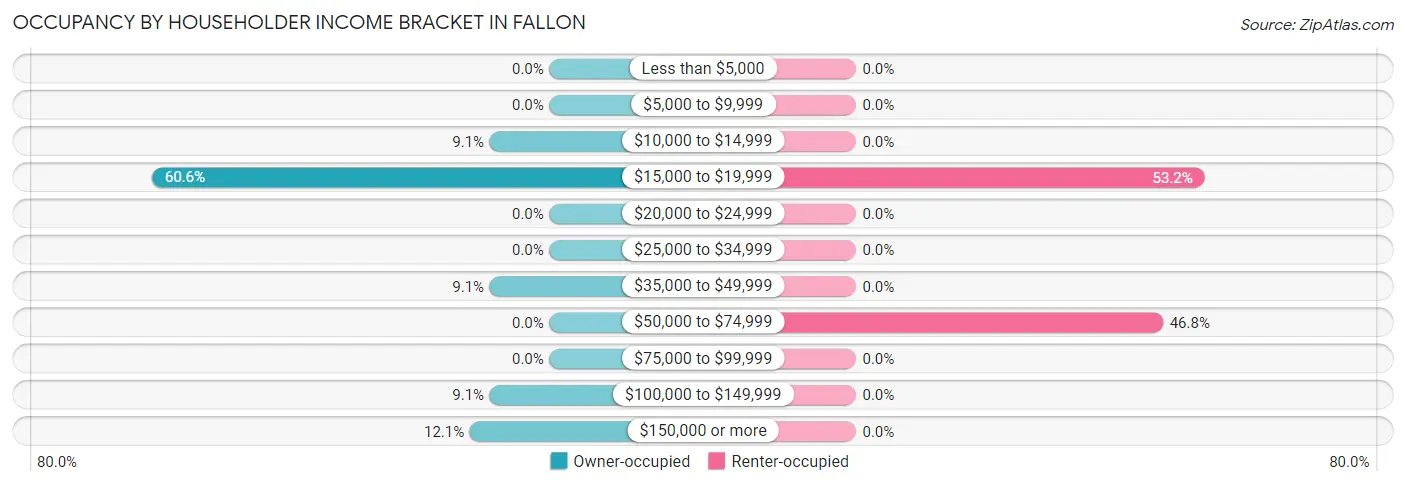
| Income Bracket | Owner-occupied | Renter-occupied |
| Less than $5,000 | 0 (0.0%) | 0 (0.0%) |
| $5,000 to $9,999 | 0 (0.0%) | 0 (0.0%) |
| $10,000 to $14,999 | 3 (9.1%) | 0 (0.0%) |
| $15,000 to $19,999 | 20 (60.6%) | 25 (53.2%) |
| $20,000 to $24,999 | 0 (0.0%) | 0 (0.0%) |
| $25,000 to $34,999 | 0 (0.0%) | 0 (0.0%) |
| $35,000 to $49,999 | 3 (9.1%) | 0 (0.0%) |
| $50,000 to $74,999 | 0 (0.0%) | 22 (46.8%) |
| $75,000 to $99,999 | 0 (0.0%) | 0 (0.0%) |
| $100,000 to $149,999 | 3 (9.1%) | 0 (0.0%) |
| $150,000 or more | 4 (12.1%) | 0 (0.0%) |
| Total | 33 (100.0%) | 47 (100.0%) |
Monthly Housing Cost Tiers in Fallon
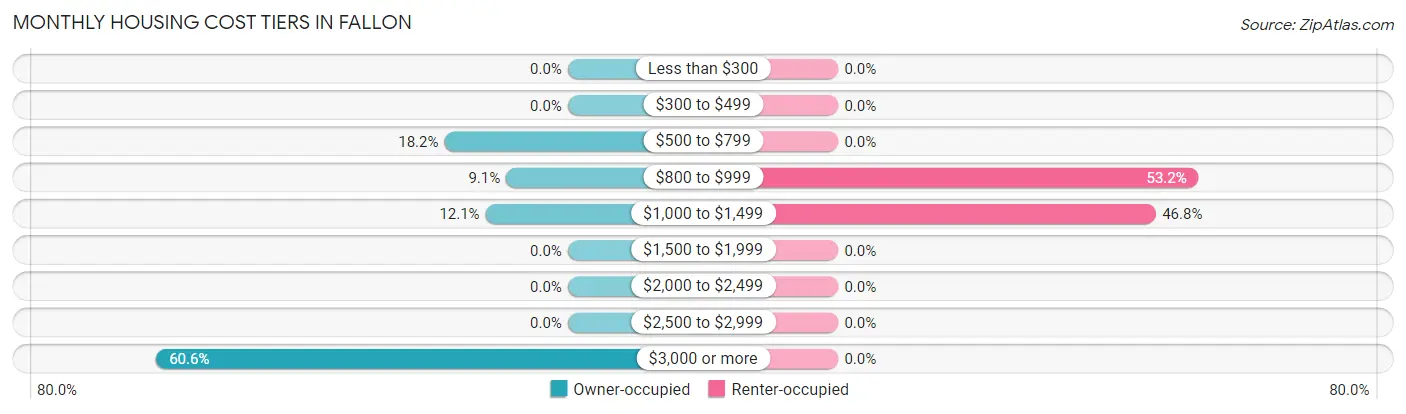
| Monthly Cost | Owner-occupied | Renter-occupied |
| Less than $300 | 0 (0.0%) | 0 (0.0%) |
| $300 to $499 | 0 (0.0%) | 0 (0.0%) |
| $500 to $799 | 6 (18.2%) | 0 (0.0%) |
| $800 to $999 | 3 (9.1%) | 25 (53.2%) |
| $1,000 to $1,499 | 4 (12.1%) | 22 (46.8%) |
| $1,500 to $1,999 | 0 (0.0%) | 0 (0.0%) |
| $2,000 to $2,499 | 0 (0.0%) | 0 (0.0%) |
| $2,500 to $2,999 | 0 (0.0%) | 0 (0.0%) |
| $3,000 or more | 20 (60.6%) | 0 (0.0%) |
| Total | 33 (100.0%) | 47 (100.0%) |
Physical Housing Characteristics in Fallon
Housing Structures in Fallon
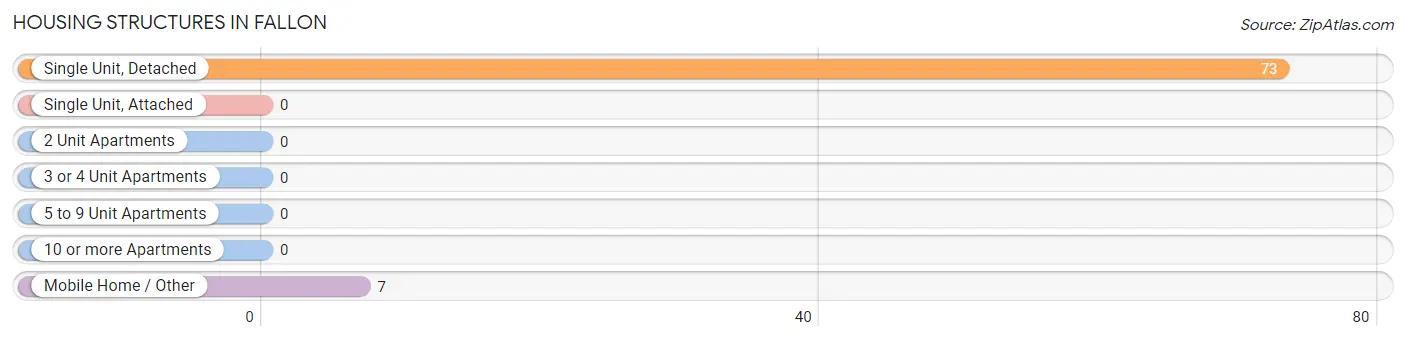
| Structure Type | # Housing Units | % Housing Units |
| Single Unit, Detached | 73 | 91.2% |
| Single Unit, Attached | 0 | 0.0% |
| 2 Unit Apartments | 0 | 0.0% |
| 3 or 4 Unit Apartments | 0 | 0.0% |
| 5 to 9 Unit Apartments | 0 | 0.0% |
| 10 or more Apartments | 0 | 0.0% |
| Mobile Home / Other | 7 | 8.7% |
| Total | 80 | 100.0% |
Housing Structures by Occupancy in Fallon
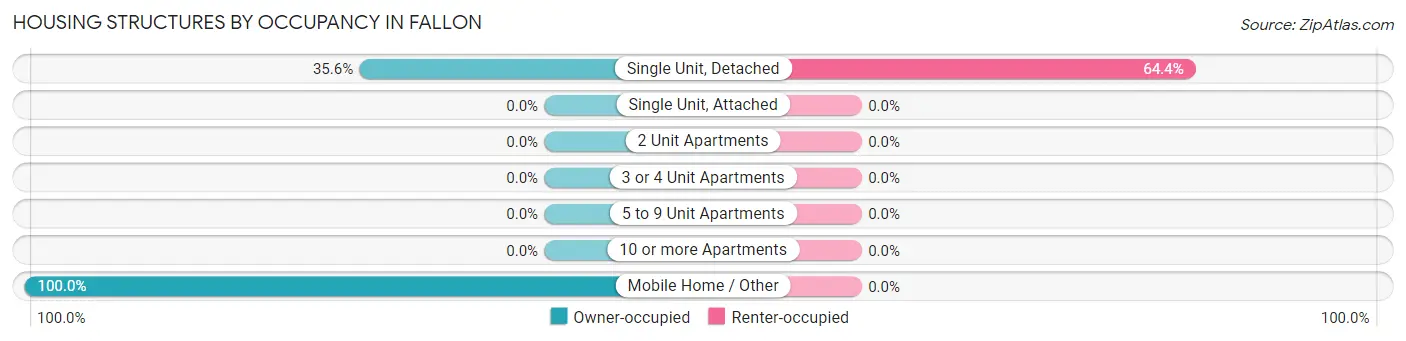
| Structure Type | Owner-occupied | Renter-occupied |
| Single Unit, Detached | 26 (35.6%) | 47 (64.4%) |
| Single Unit, Attached | 0 (0.0%) | 0 (0.0%) |
| 2 Unit Apartments | 0 (0.0%) | 0 (0.0%) |
| 3 or 4 Unit Apartments | 0 (0.0%) | 0 (0.0%) |
| 5 to 9 Unit Apartments | 0 (0.0%) | 0 (0.0%) |
| 10 or more Apartments | 0 (0.0%) | 0 (0.0%) |
| Mobile Home / Other | 7 (100.0%) | 0 (0.0%) |
| Total | 33 (41.2%) | 47 (58.8%) |
Housing Structures by Number of Rooms in Fallon
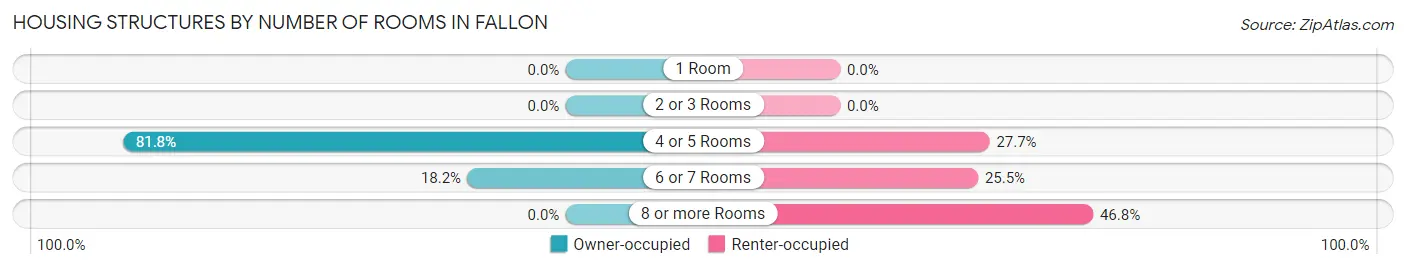
| Number of Rooms | Owner-occupied | Renter-occupied |
| 1 Room | 0 (0.0%) | 0 (0.0%) |
| 2 or 3 Rooms | 0 (0.0%) | 0 (0.0%) |
| 4 or 5 Rooms | 27 (81.8%) | 13 (27.7%) |
| 6 or 7 Rooms | 6 (18.2%) | 12 (25.5%) |
| 8 or more Rooms | 0 (0.0%) | 22 (46.8%) |
| Total | 33 (100.0%) | 47 (100.0%) |
Housing Structure by Heating Type in Fallon
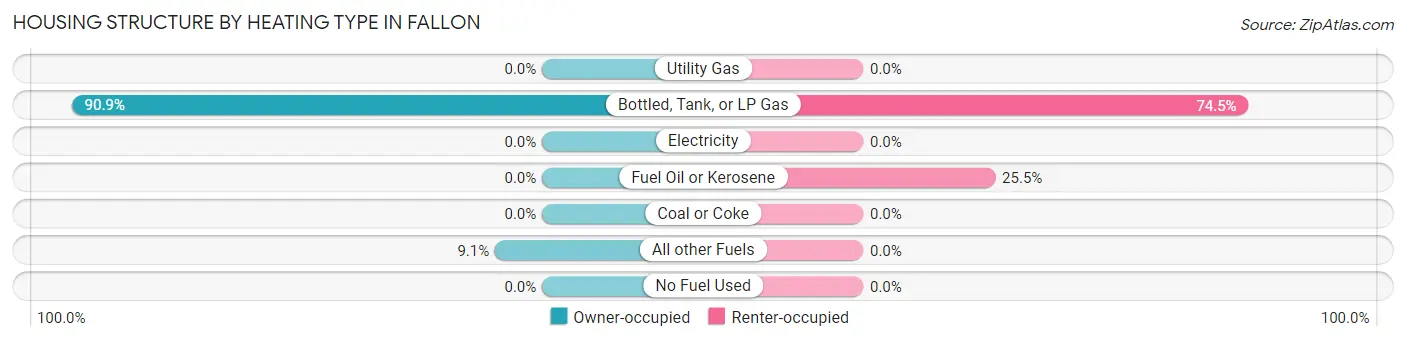
| Heating Type | Owner-occupied | Renter-occupied |
| Utility Gas | 0 (0.0%) | 0 (0.0%) |
| Bottled, Tank, or LP Gas | 30 (90.9%) | 35 (74.5%) |
| Electricity | 0 (0.0%) | 0 (0.0%) |
| Fuel Oil or Kerosene | 0 (0.0%) | 12 (25.5%) |
| Coal or Coke | 0 (0.0%) | 0 (0.0%) |
| All other Fuels | 3 (9.1%) | 0 (0.0%) |
| No Fuel Used | 0 (0.0%) | 0 (0.0%) |
| Total | 33 (100.0%) | 47 (100.0%) |
Household Vehicle Usage in Fallon
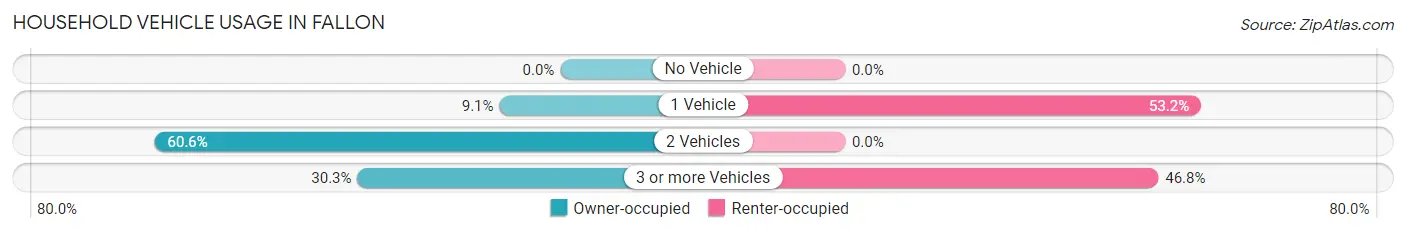
| Vehicles per Household | Owner-occupied | Renter-occupied |
| No Vehicle | 0 (0.0%) | 0 (0.0%) |
| 1 Vehicle | 3 (9.1%) | 25 (53.2%) |
| 2 Vehicles | 20 (60.6%) | 0 (0.0%) |
| 3 or more Vehicles | 10 (30.3%) | 22 (46.8%) |
| Total | 33 (100.0%) | 47 (100.0%) |
Real Estate & Mortgages in Fallon
Real Estate and Mortgage Overview in Fallon
| Characteristic | Without Mortgage | With Mortgage |
| Housing Units | 26 | 7 |
| Median Property Value | $217,500 | $0 |
| Median Household Income | - | - |
| Monthly Housing Costs | $1,501 | $0 |
| Real Estate Taxes | $1,675 | $0 |
Property Value by Mortgage Status in Fallon
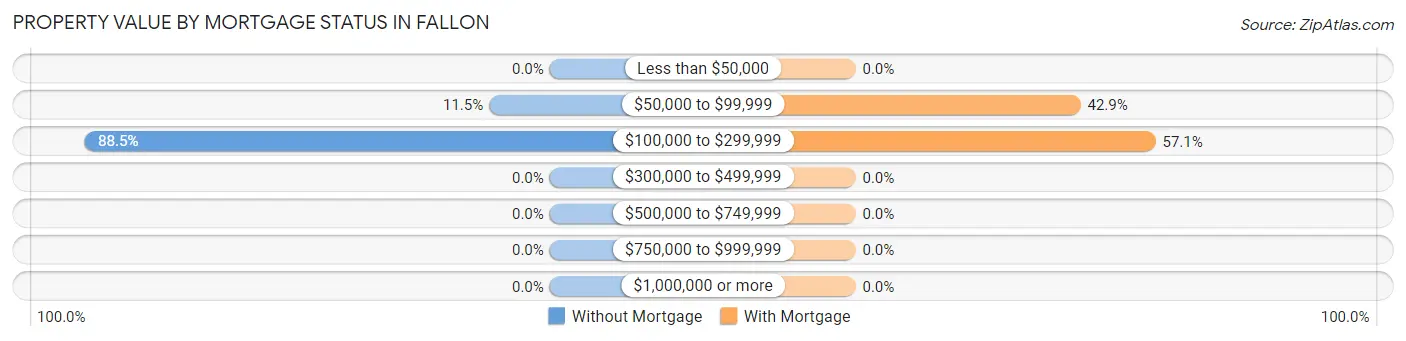
| Property Value | Without Mortgage | With Mortgage |
| Less than $50,000 | 0 (0.0%) | 0 (0.0%) |
| $50,000 to $99,999 | 3 (11.5%) | 3 (42.9%) |
| $100,000 to $299,999 | 23 (88.5%) | 4 (57.1%) |
| $300,000 to $499,999 | 0 (0.0%) | 0 (0.0%) |
| $500,000 to $749,999 | 0 (0.0%) | 0 (0.0%) |
| $750,000 to $999,999 | 0 (0.0%) | 0 (0.0%) |
| $1,000,000 or more | 0 (0.0%) | 0 (0.0%) |
| Total | 26 (100.0%) | 7 (100.0%) |
Household Income by Mortgage Status in Fallon
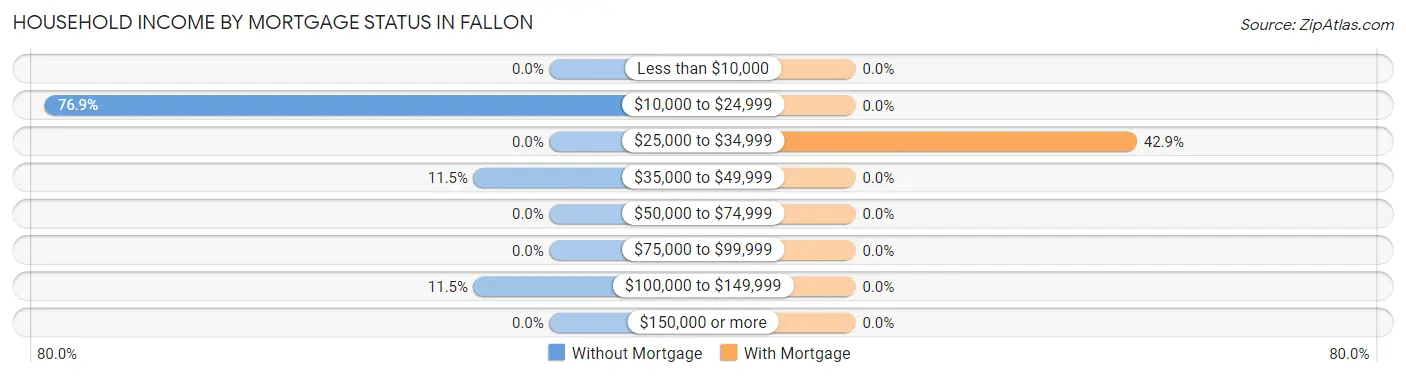
| Household Income | Without Mortgage | With Mortgage |
| Less than $10,000 | 0 (0.0%) | 0 (0.0%) |
| $10,000 to $24,999 | 20 (76.9%) | 0 (0.0%) |
| $25,000 to $34,999 | 0 (0.0%) | 3 (42.9%) |
| $35,000 to $49,999 | 3 (11.5%) | 0 (0.0%) |
| $50,000 to $74,999 | 0 (0.0%) | 0 (0.0%) |
| $75,000 to $99,999 | 0 (0.0%) | 0 (0.0%) |
| $100,000 to $149,999 | 3 (11.5%) | 0 (0.0%) |
| $150,000 or more | 0 (0.0%) | 0 (0.0%) |
| Total | 26 (100.0%) | 7 (100.0%) |
Property Value to Household Income Ratio in Fallon
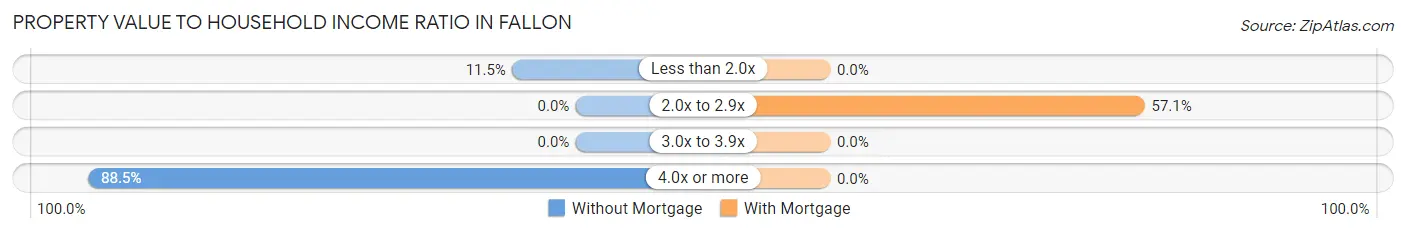
| Value-to-Income Ratio | Without Mortgage | With Mortgage |
| Less than 2.0x | 3 (11.5%) | 0 (0.0%) |
| 2.0x to 2.9x | 0 (0.0%) | 4 (57.1%) |
| 3.0x to 3.9x | 0 (0.0%) | 0 (0.0%) |
| 4.0x or more | 23 (88.5%) | 0 (0.0%) |
| Total | 26 (100.0%) | 7 (100.0%) |
Real Estate Taxes by Mortgage Status in Fallon
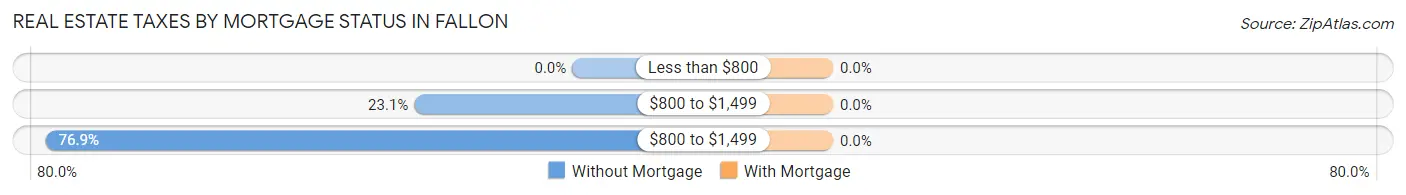
| Property Taxes | Without Mortgage | With Mortgage |
| Less than $800 | 0 (0.0%) | 0 (0.0%) |
| $800 to $1,499 | 6 (23.1%) | 0 (0.0%) |
| $800 to $1,499 | 20 (76.9%) | 0 (0.0%) |
| Total | 26 (100.0%) | 7 (100.0%) |
Health & Disability in Fallon
Health Insurance Coverage by Age in Fallon
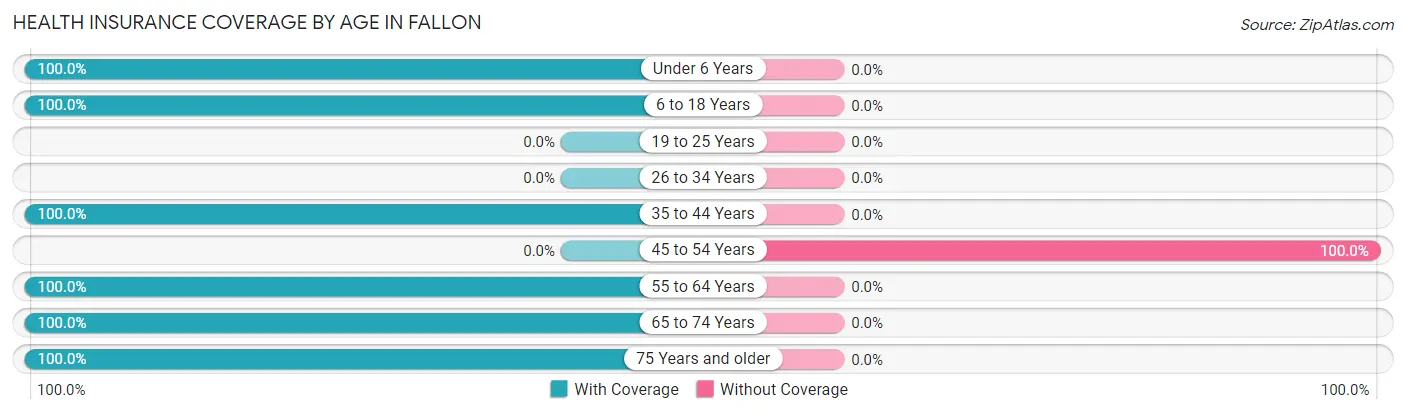
| Age Bracket | With Coverage | Without Coverage |
| Under 6 Years | 44 (100.0%) | 0 (0.0%) |
| 6 to 18 Years | 131 (100.0%) | 0 (0.0%) |
| 19 to 25 Years | 0 (0.0%) | 0 (0.0%) |
| 26 to 34 Years | 0 (0.0%) | 0 (0.0%) |
| 35 to 44 Years | 114 (100.0%) | 0 (0.0%) |
| 45 to 54 Years | 0 (0.0%) | 14 (100.0%) |
| 55 to 64 Years | 10 (100.0%) | 0 (0.0%) |
| 65 to 74 Years | 28 (100.0%) | 0 (0.0%) |
| 75 Years and older | 19 (100.0%) | 0 (0.0%) |
| Total | 346 (96.1%) | 14 (3.9%) |
Health Insurance Coverage by Citizenship Status in Fallon
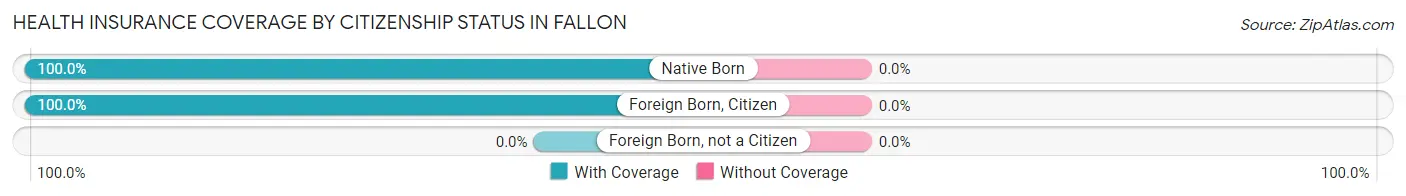
| Citizenship Status | With Coverage | Without Coverage |
| Native Born | 44 (100.0%) | 0 (0.0%) |
| Foreign Born, Citizen | 131 (100.0%) | 0 (0.0%) |
| Foreign Born, not a Citizen | 0 (0.0%) | 0 (0.0%) |
Health Insurance Coverage by Household Income in Fallon
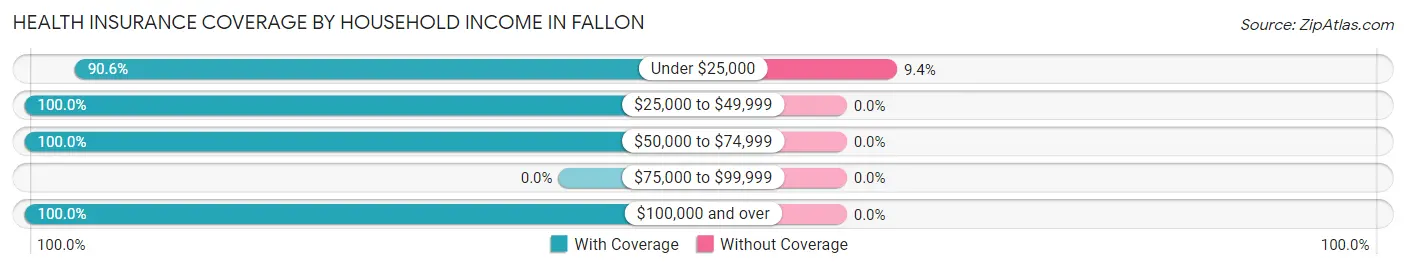
| Household Income | With Coverage | Without Coverage |
| Under $25,000 | 135 (90.6%) | 14 (9.4%) |
| $25,000 to $49,999 | 10 (100.0%) | 0 (0.0%) |
| $50,000 to $74,999 | 184 (100.0%) | 0 (0.0%) |
| $75,000 to $99,999 | 0 (0.0%) | 0 (0.0%) |
| $100,000 and over | 17 (100.0%) | 0 (0.0%) |
Public vs Private Health Insurance Coverage by Age in Fallon
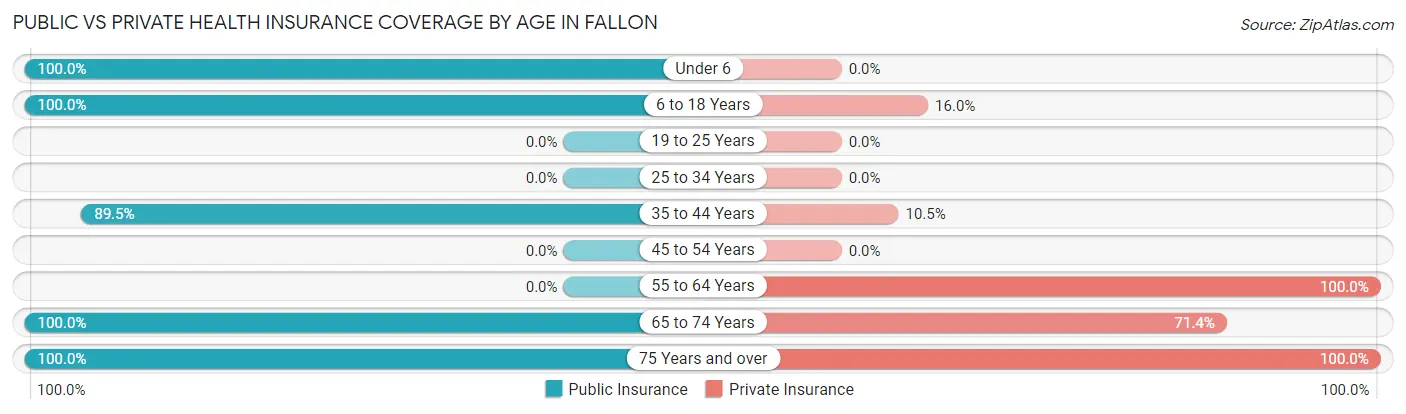
| Age Bracket | Public Insurance | Private Insurance |
| Under 6 | 44 (100.0%) | 0 (0.0%) |
| 6 to 18 Years | 131 (100.0%) | 21 (16.0%) |
| 19 to 25 Years | 0 (0.0%) | 0 (0.0%) |
| 25 to 34 Years | 0 (0.0%) | 0 (0.0%) |
| 35 to 44 Years | 102 (89.5%) | 12 (10.5%) |
| 45 to 54 Years | 0 (0.0%) | 0 (0.0%) |
| 55 to 64 Years | 0 (0.0%) | 10 (100.0%) |
| 65 to 74 Years | 28 (100.0%) | 20 (71.4%) |
| 75 Years and over | 19 (100.0%) | 19 (100.0%) |
| Total | 324 (90.0%) | 82 (22.8%) |
Disability Status by Sex by Age in Fallon
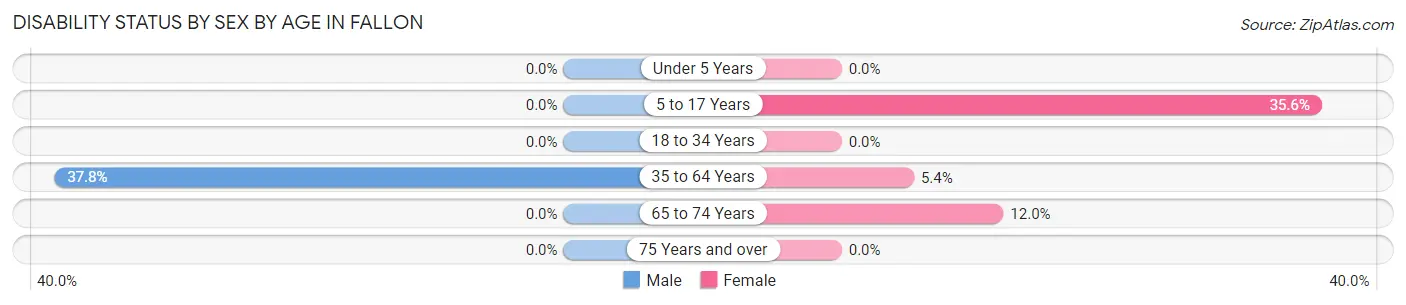
| Age Bracket | Male | Female |
| Under 5 Years | 0 (0.0%) | 0 (0.0%) |
| 5 to 17 Years | 0 (0.0%) | 31 (35.6%) |
| 18 to 34 Years | 0 (0.0%) | 0 (0.0%) |
| 35 to 64 Years | 31 (37.8%) | 3 (5.4%) |
| 65 to 74 Years | 0 (0.0%) | 3 (12.0%) |
| 75 Years and over | 0 (0.0%) | 0 (0.0%) |
Disability Class by Sex by Age in Fallon
Disability Class: Hearing Difficulty
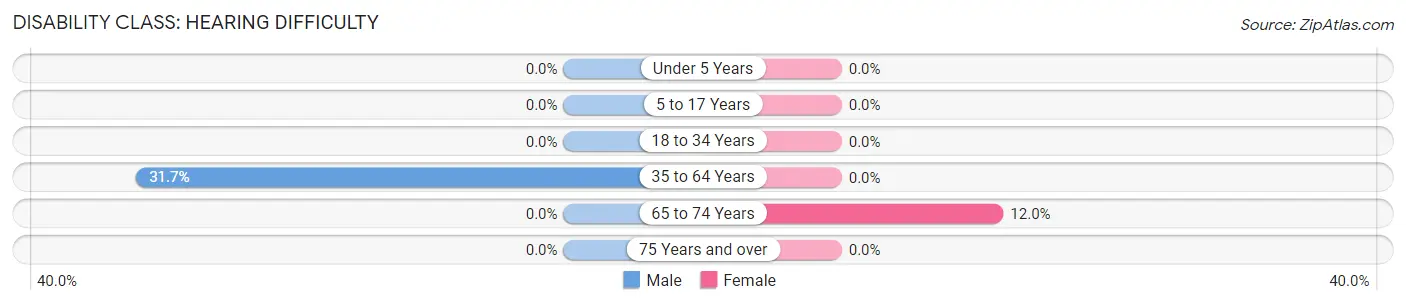
| Age Bracket | Male | Female |
| Under 5 Years | 0 (0.0%) | 0 (0.0%) |
| 5 to 17 Years | 0 (0.0%) | 0 (0.0%) |
| 18 to 34 Years | 0 (0.0%) | 0 (0.0%) |
| 35 to 64 Years | 26 (31.7%) | 0 (0.0%) |
| 65 to 74 Years | 0 (0.0%) | 3 (12.0%) |
| 75 Years and over | 0 (0.0%) | 0 (0.0%) |
Disability Class: Vision Difficulty
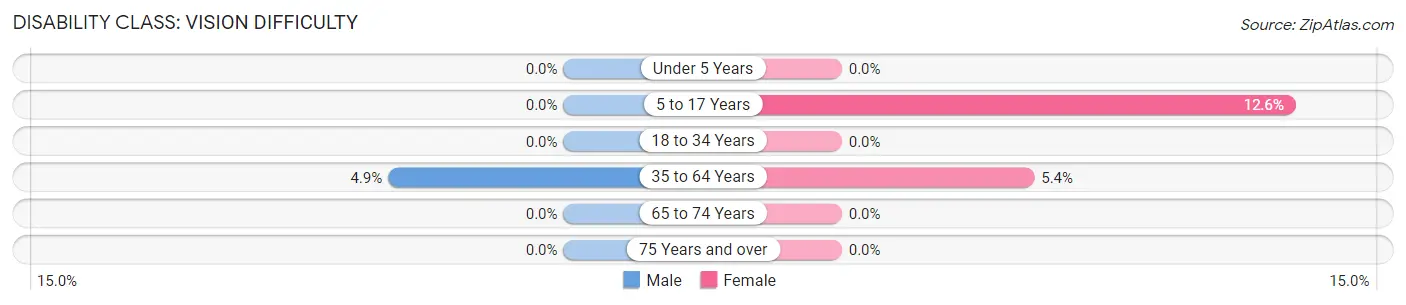
| Age Bracket | Male | Female |
| Under 5 Years | 0 (0.0%) | 0 (0.0%) |
| 5 to 17 Years | 0 (0.0%) | 11 (12.6%) |
| 18 to 34 Years | 0 (0.0%) | 0 (0.0%) |
| 35 to 64 Years | 4 (4.9%) | 3 (5.4%) |
| 65 to 74 Years | 0 (0.0%) | 0 (0.0%) |
| 75 Years and over | 0 (0.0%) | 0 (0.0%) |
Disability Class: Cognitive Difficulty
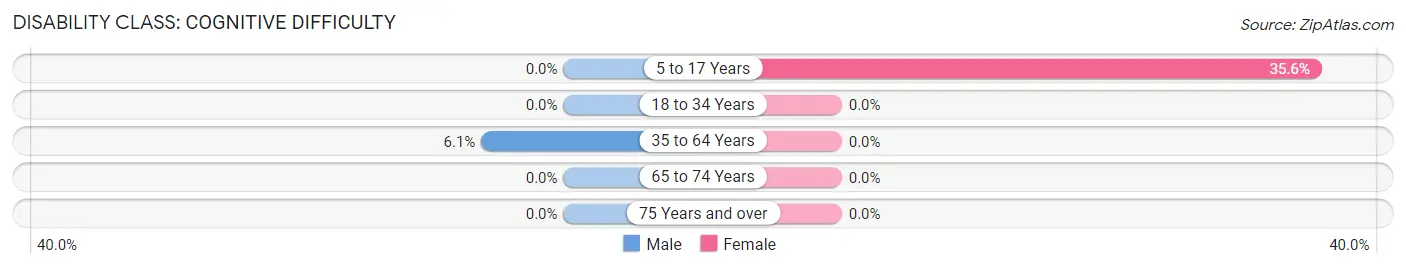
| Age Bracket | Male | Female |
| 5 to 17 Years | 0 (0.0%) | 31 (35.6%) |
| 18 to 34 Years | 0 (0.0%) | 0 (0.0%) |
| 35 to 64 Years | 5 (6.1%) | 0 (0.0%) |
| 65 to 74 Years | 0 (0.0%) | 0 (0.0%) |
| 75 Years and over | 0 (0.0%) | 0 (0.0%) |
Disability Class: Ambulatory Difficulty
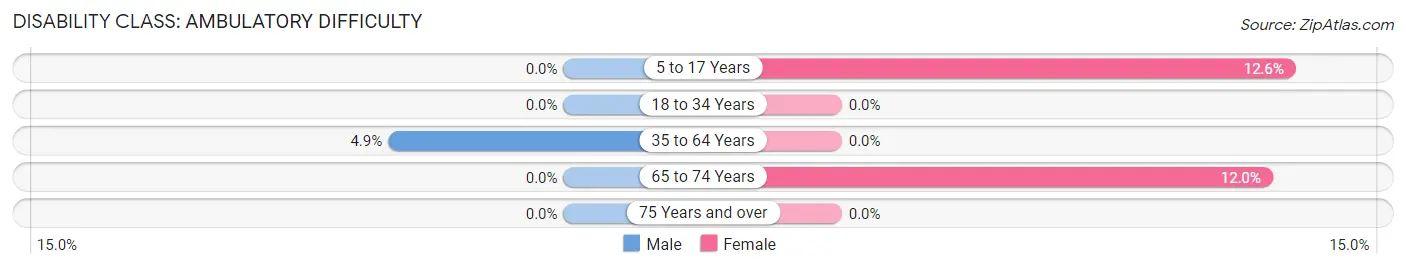
| Age Bracket | Male | Female |
| 5 to 17 Years | 0 (0.0%) | 11 (12.6%) |
| 18 to 34 Years | 0 (0.0%) | 0 (0.0%) |
| 35 to 64 Years | 4 (4.9%) | 0 (0.0%) |
| 65 to 74 Years | 0 (0.0%) | 3 (12.0%) |
| 75 Years and over | 0 (0.0%) | 0 (0.0%) |
Disability Class: Self-Care Difficulty
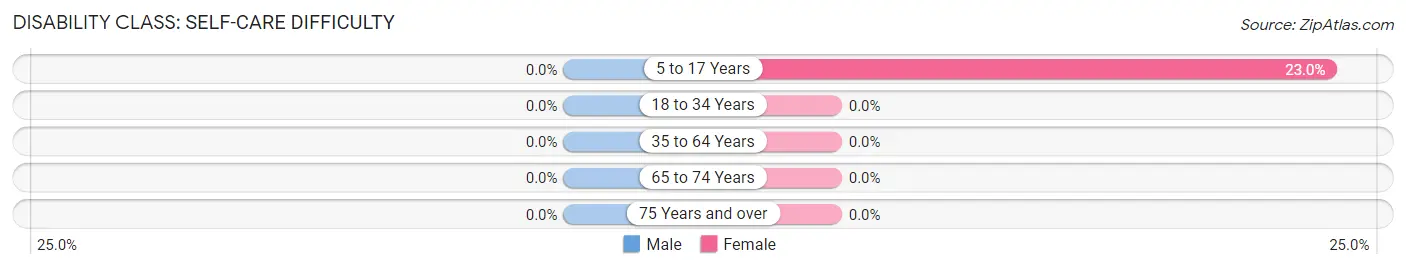
| Age Bracket | Male | Female |
| 5 to 17 Years | 0 (0.0%) | 20 (23.0%) |
| 18 to 34 Years | 0 (0.0%) | 0 (0.0%) |
| 35 to 64 Years | 0 (0.0%) | 0 (0.0%) |
| 65 to 74 Years | 0 (0.0%) | 0 (0.0%) |
| 75 Years and over | 0 (0.0%) | 0 (0.0%) |
Technology Access in Fallon
Computing Device Access in Fallon
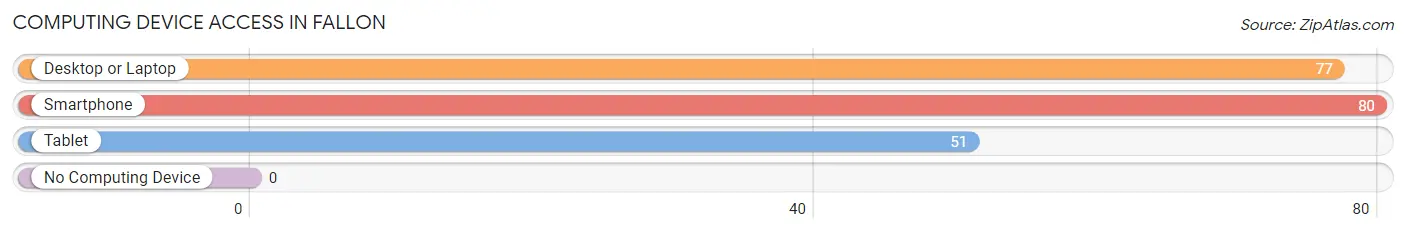
| Device Type | # Households | % Households |
| Desktop or Laptop | 77 | 96.3% |
| Smartphone | 80 | 100.0% |
| Tablet | 51 | 63.7% |
| No Computing Device | 0 | 0.0% |
| Total | 80 | 100.0% |
Internet Access in Fallon
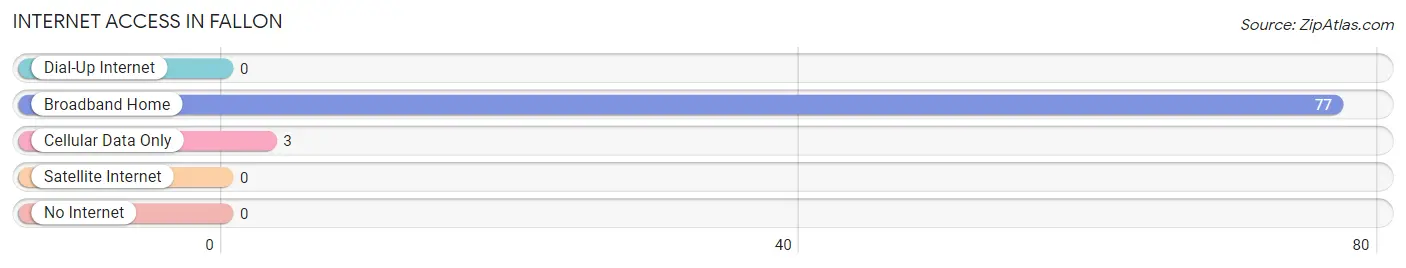
| Internet Type | # Households | % Households |
| Dial-Up Internet | 0 | 0.0% |
| Broadband Home | 77 | 96.3% |
| Cellular Data Only | 3 | 3.7% |
| Satellite Internet | 0 | 0.0% |
| No Internet | 0 | 0.0% |
| Total | 80 | 100.0% |
Fallon Summary
Fallon, Montana is a small town located in the north-central part of the state, in the heart of the Missouri River Valley. It is situated in the foothills of the Rocky Mountains, and is surrounded by rolling hills and prairies. The town is located in the county of Fallon, and is the county seat. The population of Fallon was estimated to be 1,072 in 2020.
Geography
Fallon is located in the Missouri River Valley, in the foothills of the Rocky Mountains. The town is situated at an elevation of 3,400 feet, and is surrounded by rolling hills and prairies. The town is located in the county of Fallon, and is the county seat. The town is located in the Central Time Zone, and is about an hour and a half drive from the state capital of Helena.
The climate in Fallon is semi-arid, with hot summers and cold winters. The average annual temperature is around 50 degrees Fahrenheit, with an average high of around 80 degrees in the summer and an average low of around 20 degrees in the winter. The average annual precipitation is around 12 inches, with most of the precipitation occurring in the spring and summer months.
Economy
The economy of Fallon is largely based on agriculture and ranching. The town is home to several large farms and ranches, which produce a variety of crops and livestock. The town is also home to several small businesses, including restaurants, retail stores, and service providers.
The town is also home to several manufacturing companies, including a furniture factory, a woodworking shop, and a metal fabrication shop. The town is also home to a small airport, which serves as a hub for air travel in the region.
Demographics
As of 2020, the population of Fallon was estimated to be 1,072. The population is predominantly white, with a small percentage of African Americans, Native Americans, and other ethnicities. The median age of the population is around 40 years old, and the median household income is around $45,000.
The town is home to several churches, including the First Presbyterian Church, the First Baptist Church, and the Church of Jesus Christ of Latter-day Saints. The town is also home to several schools, including the Fallon Elementary School, the Fallon Middle School, and the Fallon High School.
Conclusion
Fallon, Montana is a small town located in the north-central part of the state, in the heart of the Missouri River Valley. It is situated in the foothills of the Rocky Mountains, and is surrounded by rolling hills and prairies. The town is located in the county of Fallon, and is the county seat. The population of Fallon was estimated to be 1,072 in 2020. The economy of Fallon is largely based on agriculture and ranching, and the town is home to several small businesses, manufacturing companies, and a small airport. The population is predominantly white, with a small percentage of African Americans, Native Americans, and other ethnicities. The town is home to several churches and schools, and is a great place to live and work.
Common Questions
What is Per Capita Income in Fallon?
Per Capita income in Fallon is $14,093.
What is Income or Wage Gap in Fallon?
Income or Wage Gap in Fallon is 75.5%.
Women in Fallon earn 24.5 cents for every dollar earned by a man.
What is Inequality or Gini Index in Fallon?
Inequality or Gini Index in Fallon is 0.60.
What is the Total Population of Fallon?
Total Population of Fallon is 360.
What is the Total Male Population of Fallon?
Total Male Population of Fallon is 171.
What is the Total Female Population of Fallon?
Total Female Population of Fallon is 189.
What is the Ratio of Males per 100 Females in Fallon?
There are 90.48 Males per 100 Females in Fallon.
What is the Ratio of Females per 100 Males in Fallon?
There are 110.53 Females per 100 Males in Fallon.
What is the Median Population Age in Fallon?
Median Population Age in Fallon is 37.1 Years.
What is the Average Family Size in Fallon
Average Family Size in Fallon is 4.0 People.
What is the Average Household Size in Fallon
Average Household Size in Fallon is 4.5 People.
How Large is the Labor Force in Fallon?
There are 67 People in the Labor Forcein in Fallon.
What is the Percentage of People in the Labor Force in Fallon?
32.5% of People are in the Labor Force in Fallon.