Ennis, MT Map & Demographics
Ennis Map
Ennis Overview
$34,847
PER CAPITA INCOME
$74,479
AVG FAMILY INCOME
$59,500
AVG HOUSEHOLD INCOME
56.7%
WAGE / INCOME GAP [ % ]
43.3¢/ $1
WAGE / INCOME GAP [ $ ]
0.33
INEQUALITY / GINI INDEX
736
TOTAL POPULATION
390
MALE POPULATION
346
FEMALE POPULATION
112.72
MALES / 100 FEMALES
88.72
FEMALES / 100 MALES
52.0
MEDIAN AGE
2.9
AVG FAMILY SIZE
2.0
AVG HOUSEHOLD SIZE
403
LABOR FORCE [ PEOPLE ]
63.9%
PERCENT IN LABOR FORCE
1.0%
UNEMPLOYMENT RATE
Ennis Zip Codes
Ennis Area Codes
Income in Ennis
Income Overview in Ennis
Per Capita Income in Ennis is $34,847, while median incomes of families and households are $74,479 and $59,500 respectively.
| Characteristic | Number | Measure |
| Per Capita Income | 736 | $34,847 |
| Median Family Income | 161 | $74,479 |
| Mean Family Income | 161 | $75,314 |
| Median Household Income | 348 | $59,500 |
| Mean Household Income | 348 | $68,363 |
| Income Deficit | 161 | $0 |
| Wage / Income Gap (%) | 736 | 56.72% |
| Wage / Income Gap ($) | 736 | 43.28¢ per $1 |
| Gini / Inequality Index | 736 | 0.33 |
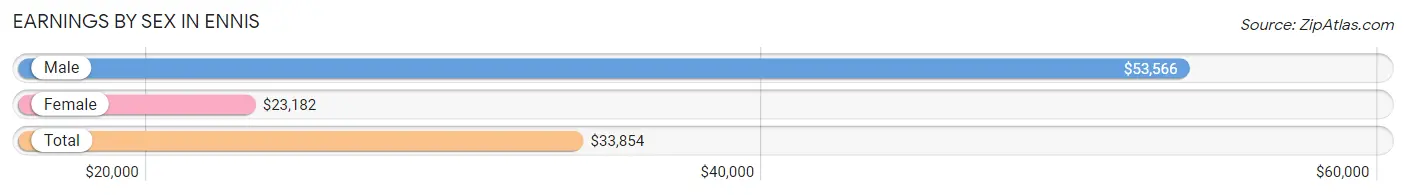
Earnings by Sex in Ennis
Average Earnings in Ennis are $33,854, $53,566 for men and $23,182 for women, a difference of 56.7%.
| Sex | Number | Average Earnings |
| Male | 207 (51.9%) | $53,566 |
| Female | 192 (48.1%) | $23,182 |
| Total | 399 (100.0%) | $33,854 |
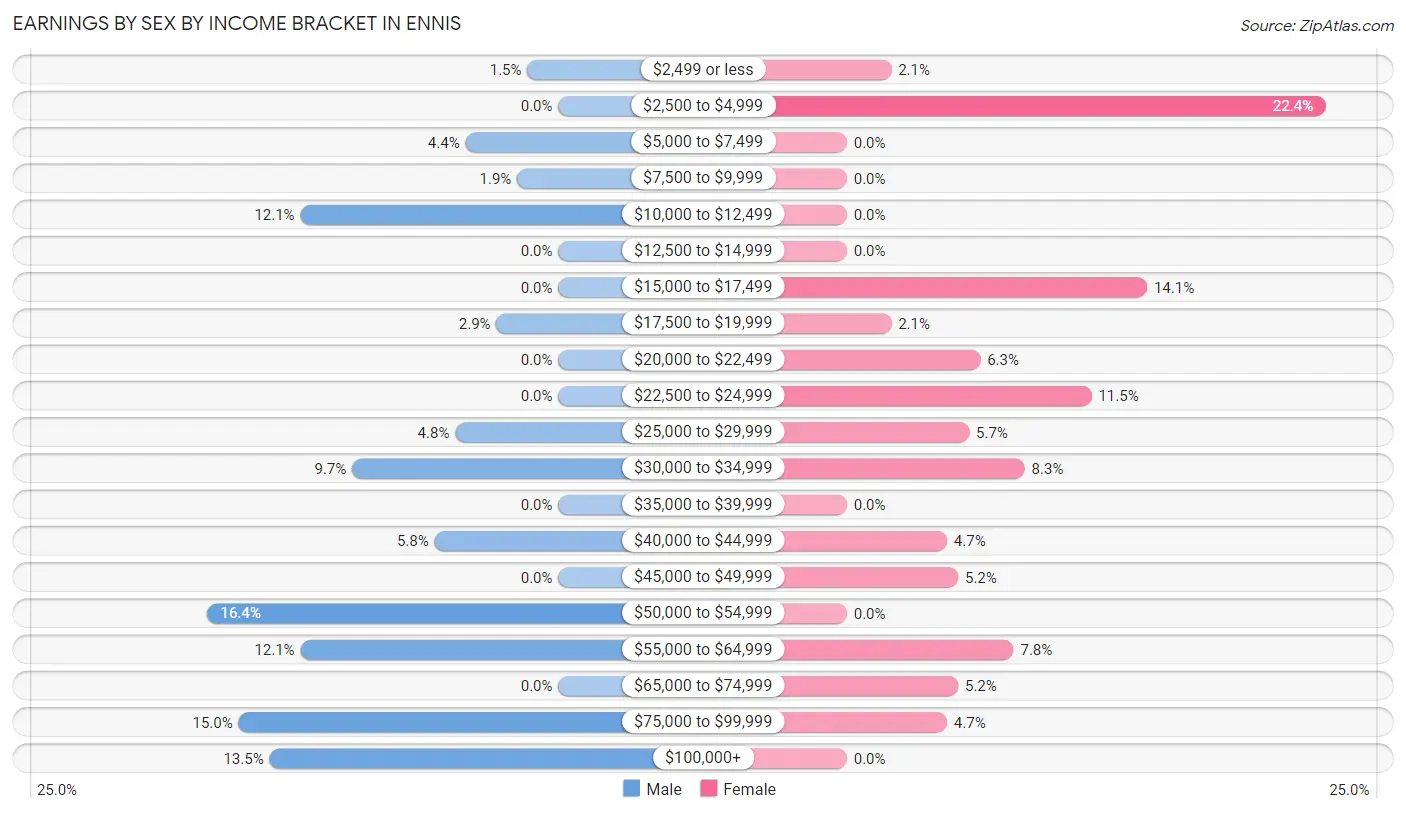
Earnings by Sex by Income Bracket in Ennis
The most common earnings brackets in Ennis are $50,000 to $54,999 for men (34 | 16.4%) and $2,500 to $4,999 for women (43 | 22.4%).
| Income | Male | Female |
| $2,499 or less | 3 (1.5%) | 4 (2.1%) |
| $2,500 to $4,999 | 0 (0.0%) | 43 (22.4%) |
| $5,000 to $7,499 | 9 (4.3%) | 0 (0.0%) |
| $7,500 to $9,999 | 4 (1.9%) | 0 (0.0%) |
| $10,000 to $12,499 | 25 (12.1%) | 0 (0.0%) |
| $12,500 to $14,999 | 0 (0.0%) | 0 (0.0%) |
| $15,000 to $17,499 | 0 (0.0%) | 27 (14.1%) |
| $17,500 to $19,999 | 6 (2.9%) | 4 (2.1%) |
| $20,000 to $22,499 | 0 (0.0%) | 12 (6.2%) |
| $22,500 to $24,999 | 0 (0.0%) | 22 (11.5%) |
| $25,000 to $29,999 | 10 (4.8%) | 11 (5.7%) |
| $30,000 to $34,999 | 20 (9.7%) | 16 (8.3%) |
| $35,000 to $39,999 | 0 (0.0%) | 0 (0.0%) |
| $40,000 to $44,999 | 12 (5.8%) | 9 (4.7%) |
| $45,000 to $49,999 | 0 (0.0%) | 10 (5.2%) |
| $50,000 to $54,999 | 34 (16.4%) | 0 (0.0%) |
| $55,000 to $64,999 | 25 (12.1%) | 15 (7.8%) |
| $65,000 to $74,999 | 0 (0.0%) | 10 (5.2%) |
| $75,000 to $99,999 | 31 (15.0%) | 9 (4.7%) |
| $100,000+ | 28 (13.5%) | 0 (0.0%) |
| Total | 207 (100.0%) | 192 (100.0%) |
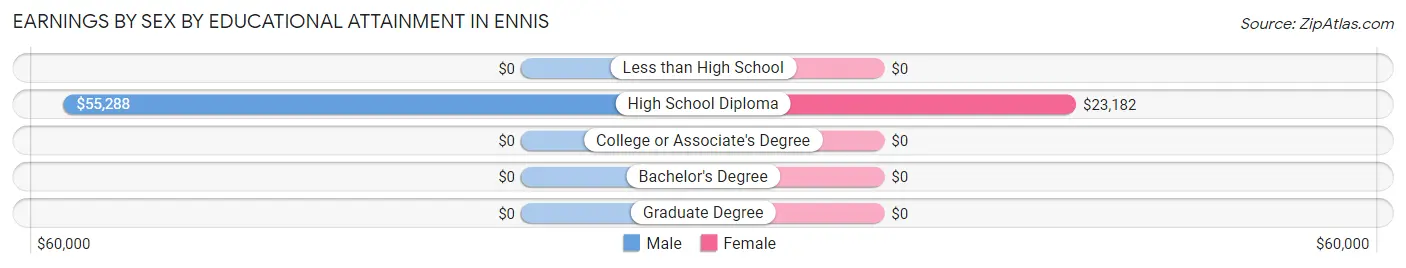
Earnings by Sex by Educational Attainment in Ennis
Average earnings in Ennis are $53,566 for men and $23,182 for women, a difference of 56.7%. Men with an educational attainment of high school diploma enjoy the highest average annual earnings of $55,288, while those with high school diploma education earn the least with $55,288. Women with an educational attainment of high school diploma earn the most with the average annual earnings of $23,182, while those with high school diploma education have the smallest earnings of $23,182.
| Educational Attainment | Male Income | Female Income |
| Less than High School | - | - |
| High School Diploma | $55,288 | $23,182 |
| College or Associate's Degree | - | - |
| Bachelor's Degree | - | - |
| Graduate Degree | - | - |
| Total | $53,566 | $23,182 |
Family Income in Ennis
Family Income Brackets in Ennis
According to the Ennis family income data, there are 63 families falling into the $100,000 to $149,999 income range, which is the most common income bracket and makes up 39.1% of all families.
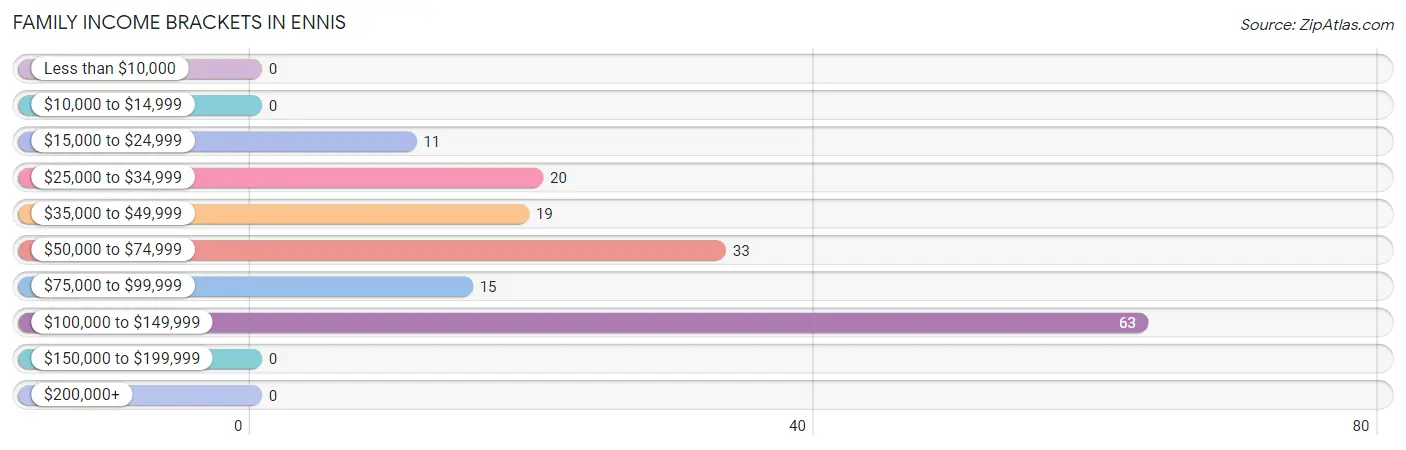
| Income Bracket | # Families | % Families |
| Less than $10,000 | 0 | 0.0% |
| $10,000 to $14,999 | 0 | 0.0% |
| $15,000 to $24,999 | 11 | 6.8% |
| $25,000 to $34,999 | 20 | 12.4% |
| $35,000 to $49,999 | 19 | 11.8% |
| $50,000 to $74,999 | 33 | 20.5% |
| $75,000 to $99,999 | 15 | 9.3% |
| $100,000 to $149,999 | 63 | 39.1% |
| $150,000 to $199,999 | 0 | 0.0% |
| $200,000+ | 0 | 0.0% |
Family Income by Famaliy Size in Ennis
4-person families (36 | 22.4%) account for the highest median family income in Ennis with $107,632 per family, while 2-person families (93 | 57.8%) have the highest median income of $30,938 per family member.
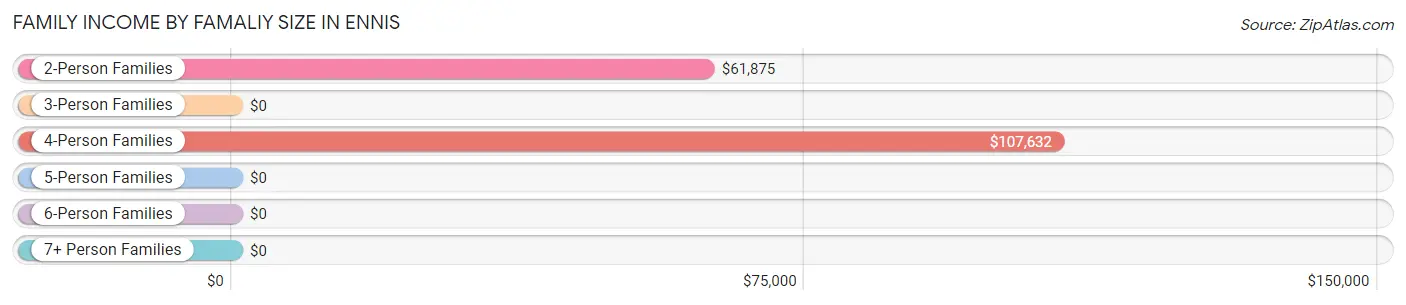
| Income Bracket | # Families | Median Income |
| 2-Person Families | 93 (57.8%) | $61,875 |
| 3-Person Families | 23 (14.3%) | $0 |
| 4-Person Families | 36 (22.4%) | $107,632 |
| 5-Person Families | 9 (5.6%) | $0 |
| 6-Person Families | 0 (0.0%) | $0 |
| 7+ Person Families | 0 (0.0%) | $0 |
| Total | 161 (100.0%) | $74,479 |
Family Income by Number of Earners in Ennis
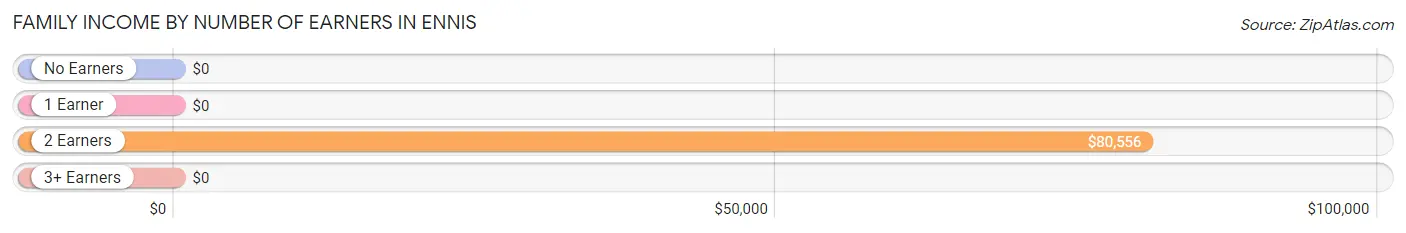
| Number of Earners | # Families | Median Income |
| No Earners | 23 (14.3%) | $0 |
| 1 Earner | 18 (11.2%) | $0 |
| 2 Earners | 120 (74.5%) | $80,556 |
| 3+ Earners | 0 (0.0%) | $0 |
| Total | 161 (100.0%) | $74,479 |
Household Income in Ennis
Household Income Brackets in Ennis
With 101 households falling in the category, the $100,000 to $149,999 income range is the most frequent in Ennis, accounting for 29.0% of all households.
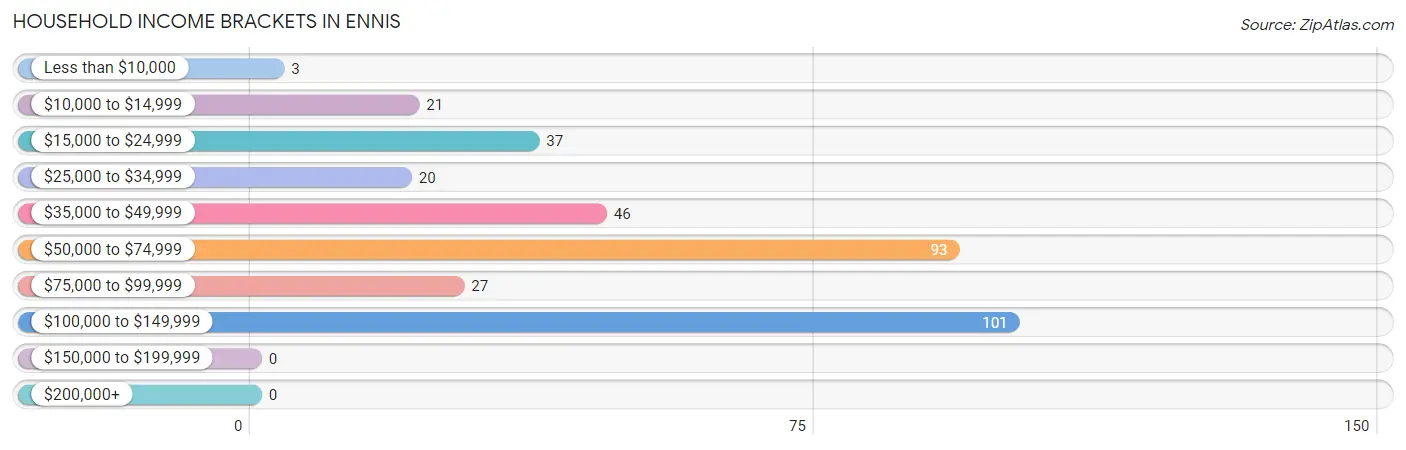
| Income Bracket | # Households | % Households |
| Less than $10,000 | 3 | 0.9% |
| $10,000 to $14,999 | 21 | 6.0% |
| $15,000 to $24,999 | 37 | 10.6% |
| $25,000 to $34,999 | 20 | 5.7% |
| $35,000 to $49,999 | 46 | 13.2% |
| $50,000 to $74,999 | 93 | 26.7% |
| $75,000 to $99,999 | 27 | 7.8% |
| $100,000 to $149,999 | 101 | 29.0% |
| $150,000 to $199,999 | 0 | 0.0% |
| $200,000+ | 0 | 0.0% |
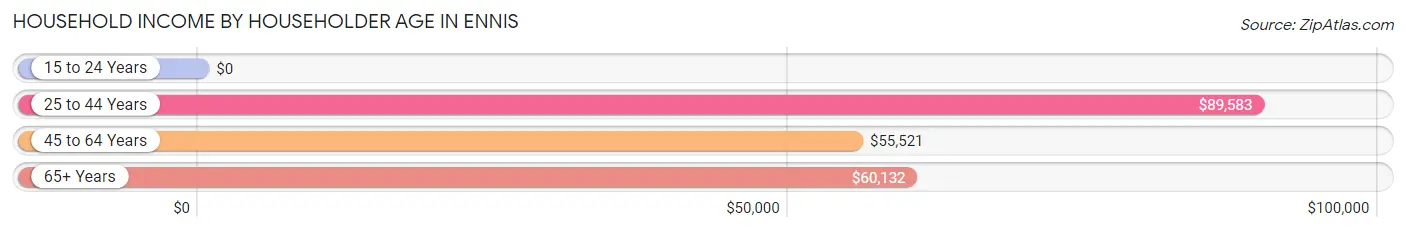
Household Income by Householder Age in Ennis
The median household income in Ennis is $59,500, with the highest median household income of $89,583 found in the 25 to 44 years age bracket for the primary householder. A total of 95 households (27.3%) fall into this category.
| Income Bracket | # Households | Median Income |
| 15 to 24 Years | 0 (0.0%) | $0 |
| 25 to 44 Years | 95 (27.3%) | $89,583 |
| 45 to 64 Years | 123 (35.3%) | $55,521 |
| 65+ Years | 130 (37.4%) | $60,132 |
| Total | 348 (100.0%) | $59,500 |
Poverty in Ennis
Income Below Poverty by Sex and Age in Ennis
With 11.7% poverty level for males and 9.8% for females among the residents of Ennis, 25 to 34 year old males and 12 to 14 year old females are the most vulnerable to poverty, with 20 males (52.6%) and 15 females (65.2%) in their respective age groups living below the poverty level.
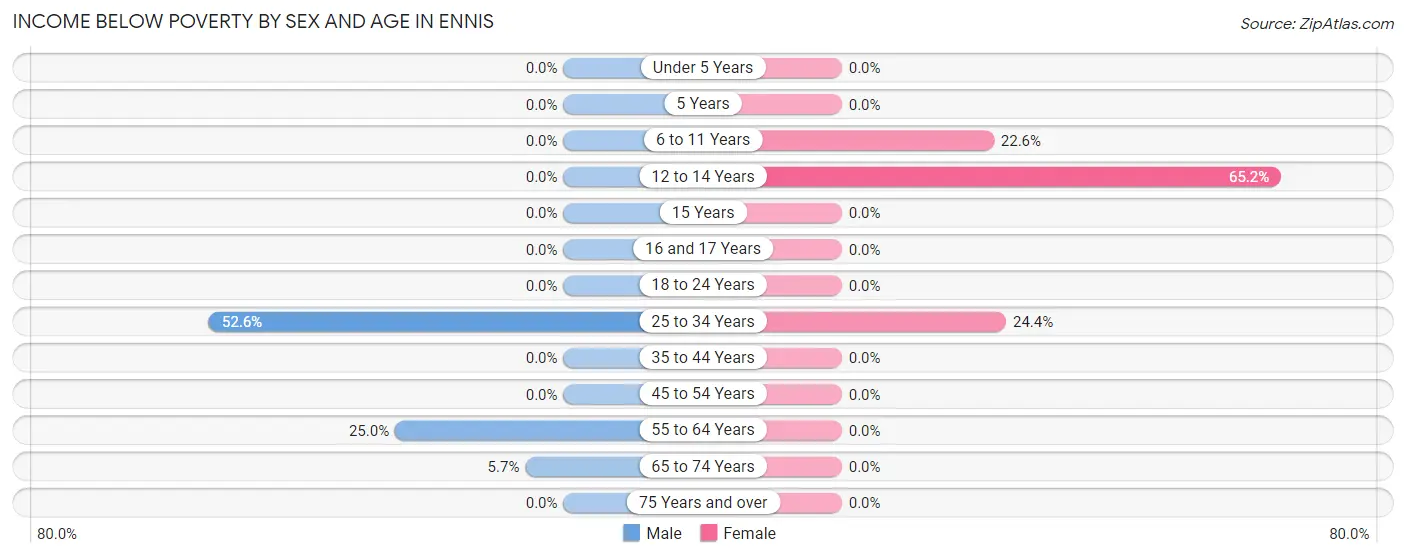
| Age Bracket | Male | Female |
| Under 5 Years | 0 (0.0%) | 0 (0.0%) |
| 5 Years | 0 (0.0%) | 0 (0.0%) |
| 6 to 11 Years | 0 (0.0%) | 7 (22.6%) |
| 12 to 14 Years | 0 (0.0%) | 15 (65.2%) |
| 15 Years | 0 (0.0%) | 0 (0.0%) |
| 16 and 17 Years | 0 (0.0%) | 0 (0.0%) |
| 18 to 24 Years | 0 (0.0%) | 0 (0.0%) |
| 25 to 34 Years | 20 (52.6%) | 10 (24.4%) |
| 35 to 44 Years | 0 (0.0%) | 0 (0.0%) |
| 45 to 54 Years | 0 (0.0%) | 0 (0.0%) |
| 55 to 64 Years | 21 (25.0%) | 0 (0.0%) |
| 65 to 74 Years | 3 (5.7%) | 0 (0.0%) |
| 75 Years and over | 0 (0.0%) | 0 (0.0%) |
| Total | 44 (11.7%) | 32 (9.8%) |
Income Above Poverty by Sex and Age in Ennis
According to the poverty statistics in Ennis, males aged 6 to 11 years and females aged 35 to 44 years are the age groups that are most secure financially, with 100.0% of males and 100.0% of females in these age groups living above the poverty line.
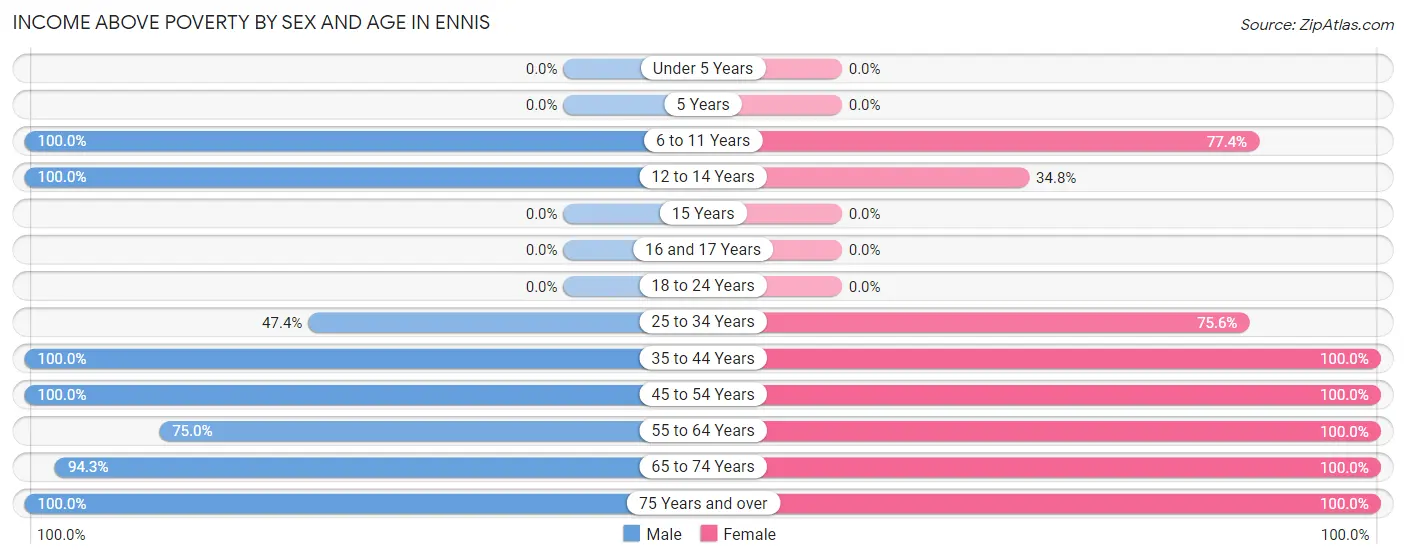
| Age Bracket | Male | Female |
| Under 5 Years | 0 (0.0%) | 0 (0.0%) |
| 5 Years | 0 (0.0%) | 0 (0.0%) |
| 6 to 11 Years | 19 (100.0%) | 24 (77.4%) |
| 12 to 14 Years | 25 (100.0%) | 8 (34.8%) |
| 15 Years | 0 (0.0%) | 0 (0.0%) |
| 16 and 17 Years | 0 (0.0%) | 0 (0.0%) |
| 18 to 24 Years | 0 (0.0%) | 0 (0.0%) |
| 25 to 34 Years | 18 (47.4%) | 31 (75.6%) |
| 35 to 44 Years | 62 (100.0%) | 63 (100.0%) |
| 45 to 54 Years | 72 (100.0%) | 24 (100.0%) |
| 55 to 64 Years | 63 (75.0%) | 58 (100.0%) |
| 65 to 74 Years | 50 (94.3%) | 61 (100.0%) |
| 75 Years and over | 22 (100.0%) | 27 (100.0%) |
| Total | 331 (88.3%) | 296 (90.2%) |
Income Below Poverty Among Married-Couple Families in Ennis
The poverty statistics for married-couple families in Ennis show that 5.6% or 9 of the total 161 families live below the poverty line. Families with 3 or 4 children have the highest poverty rate of 100.0%, comprising of 9 families. On the other hand, families with no children have the lowest poverty rate of 0.0%, which includes 0 families.
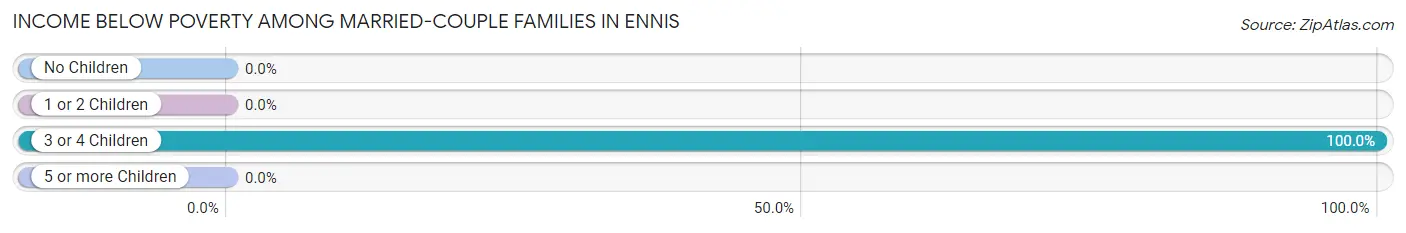
| Children | Above Poverty | Below Poverty |
| No Children | 101 (100.0%) | 0 (0.0%) |
| 1 or 2 Children | 51 (100.0%) | 0 (0.0%) |
| 3 or 4 Children | 0 (0.0%) | 9 (100.0%) |
| 5 or more Children | 0 (0.0%) | 0 (0.0%) |
| Total | 152 (94.4%) | 9 (5.6%) |
Income Below Poverty Among Single-Parent Households in Ennis
| Children | Single Father | Single Mother |
| No Children | 0 (0.0%) | 0 (0.0%) |
| 1 or 2 Children | 0 (0.0%) | 0 (0.0%) |
| 3 or 4 Children | 0 (0.0%) | 0 (0.0%) |
| 5 or more Children | 0 (0.0%) | 0 (0.0%) |
| Total | 0 (0.0%) | 0 (0.0%) |
Income Below Poverty Among Married-Couple vs Single-Parent Households in Ennis
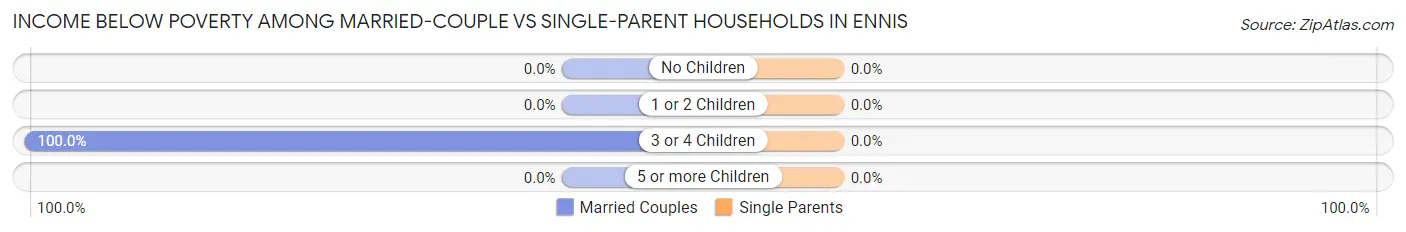
| Children | Married-Couple Families | Single-Parent Households |
| No Children | 0 (0.0%) | 0 (0.0%) |
| 1 or 2 Children | 0 (0.0%) | 0 (0.0%) |
| 3 or 4 Children | 9 (100.0%) | 0 (0.0%) |
| 5 or more Children | 0 (0.0%) | 0 (0.0%) |
| Total | 9 (5.6%) | 0 (0.0%) |
Race in Ennis
The most populous races in Ennis are White / Caucasian (725 | 98.5%), and Some other Race (11 | 1.5%).
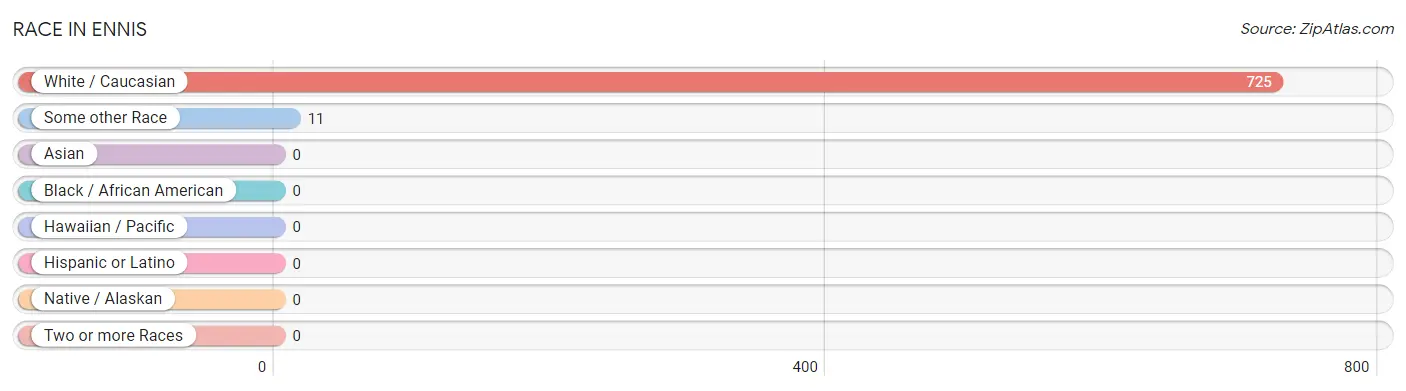
| Race | # Population | % Population |
| Asian | 0 | 0.0% |
| Black / African American | 0 | 0.0% |
| Hawaiian / Pacific | 0 | 0.0% |
| Hispanic or Latino | 0 | 0.0% |
| Native / Alaskan | 0 | 0.0% |
| White / Caucasian | 725 | 98.5% |
| Two or more Races | 0 | 0.0% |
| Some other Race | 11 | 1.5% |
| Total | 736 | 100.0% |
Ancestry in Ennis
The most populous ancestries reported in Ennis are German (170 | 23.1%), Irish (154 | 20.9%), English (109 | 14.8%), American (45 | 6.1%), and Portuguese (31 | 4.2%), together accounting for 69.2% of all Ennis residents.
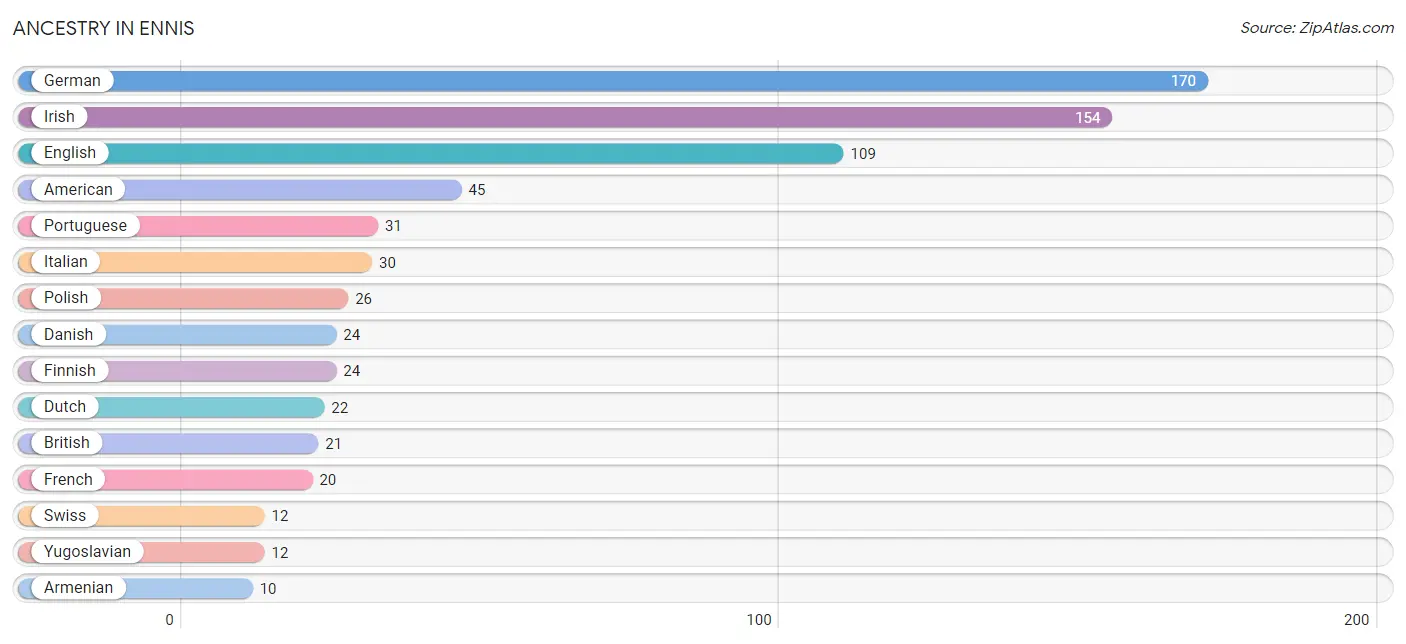
| Ancestry | # Population | % Population |
| American | 45 | 6.1% |
| Armenian | 10 | 1.4% |
| British | 21 | 2.9% |
| Danish | 24 | 3.3% |
| Dutch | 22 | 3.0% |
| English | 109 | 14.8% |
| European | 8 | 1.1% |
| Finnish | 24 | 3.3% |
| French | 20 | 2.7% |
| French Canadian | 9 | 1.2% |
| German | 170 | 23.1% |
| Irish | 154 | 20.9% |
| Italian | 30 | 4.1% |
| Norwegian | 1 | 0.1% |
| Polish | 26 | 3.5% |
| Portuguese | 31 | 4.2% |
| Scandinavian | 4 | 0.5% |
| Scotch-Irish | 1 | 0.1% |
| Scottish | 9 | 1.2% |
| Swedish | 4 | 0.5% |
| Swiss | 12 | 1.6% |
| Yugoslavian | 12 | 1.6% | View All 22 Rows |
Immigrants in Ennis
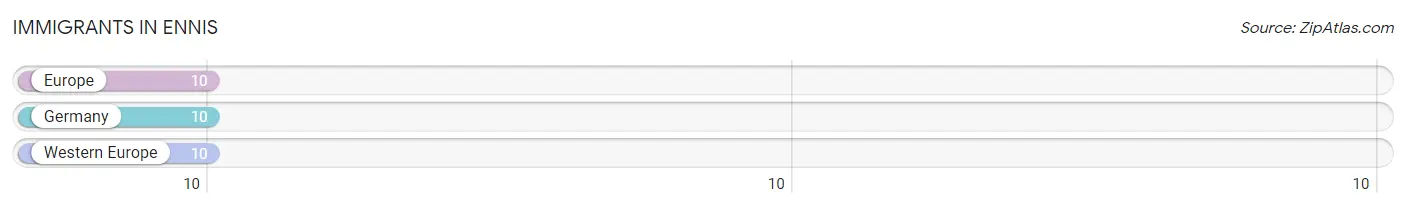
The most numerous immigrant groups reported in Ennis came from Europe (10 | 1.4%), Germany (10 | 1.4%), and Western Europe (10 | 1.4%), together accounting for 4.1% of all Ennis residents.
| Immigration Origin | # Population | % Population |
| Europe | 10 | 1.4% |
| Germany | 10 | 1.4% |
| Western Europe | 10 | 1.4% | View All 3 Rows |
Sex and Age in Ennis
Sex and Age in Ennis
The most populous age groups in Ennis are 60 to 64 Years (59 | 15.1%) for men and 65 to 69 Years (48 | 13.9%) for women.
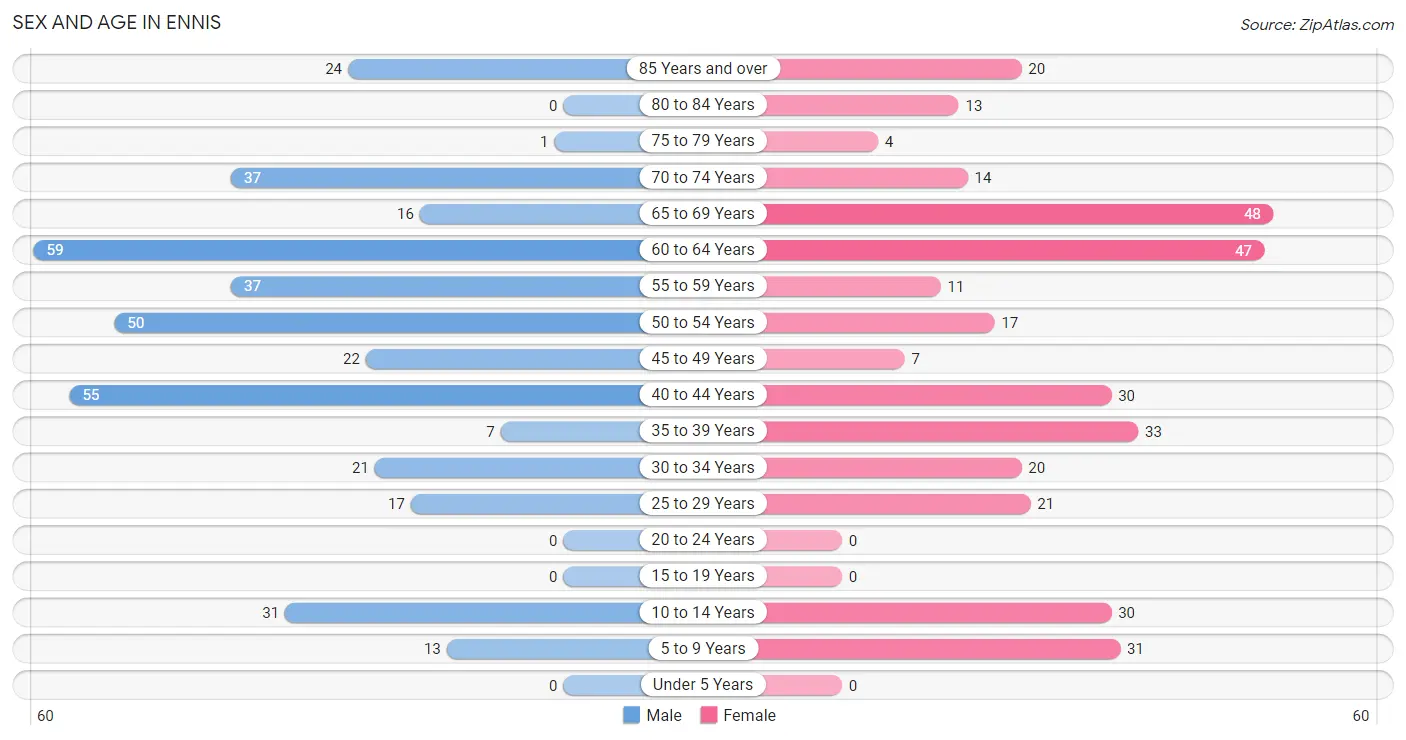
| Age Bracket | Male | Female |
| Under 5 Years | 0 (0.0%) | 0 (0.0%) |
| 5 to 9 Years | 13 (3.3%) | 31 (9.0%) |
| 10 to 14 Years | 31 (8.0%) | 30 (8.7%) |
| 15 to 19 Years | 0 (0.0%) | 0 (0.0%) |
| 20 to 24 Years | 0 (0.0%) | 0 (0.0%) |
| 25 to 29 Years | 17 (4.4%) | 21 (6.1%) |
| 30 to 34 Years | 21 (5.4%) | 20 (5.8%) |
| 35 to 39 Years | 7 (1.8%) | 33 (9.5%) |
| 40 to 44 Years | 55 (14.1%) | 30 (8.7%) |
| 45 to 49 Years | 22 (5.6%) | 7 (2.0%) |
| 50 to 54 Years | 50 (12.8%) | 17 (4.9%) |
| 55 to 59 Years | 37 (9.5%) | 11 (3.2%) |
| 60 to 64 Years | 59 (15.1%) | 47 (13.6%) |
| 65 to 69 Years | 16 (4.1%) | 48 (13.9%) |
| 70 to 74 Years | 37 (9.5%) | 14 (4.1%) |
| 75 to 79 Years | 1 (0.3%) | 4 (1.2%) |
| 80 to 84 Years | 0 (0.0%) | 13 (3.8%) |
| 85 Years and over | 24 (6.1%) | 20 (5.8%) |
| Total | 390 (100.0%) | 346 (100.0%) |
Families and Households in Ennis
Median Family Size in Ennis
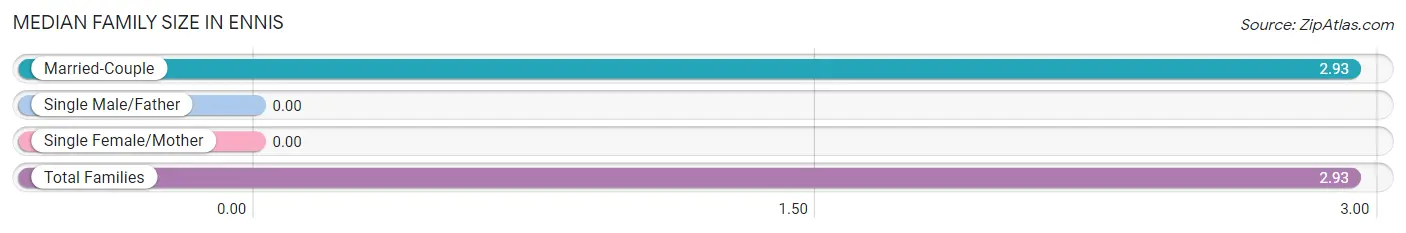
| Family Type | # Families | Family Size |
| Married-Couple | 161 (100.0%) | 2.93 |
| Single Male/Father | 0 (0.0%) | - |
| Single Female/Mother | 0 (0.0%) | - |
| Total Families | 161 (100.0%) | 2.93 |
Median Household Size in Ennis
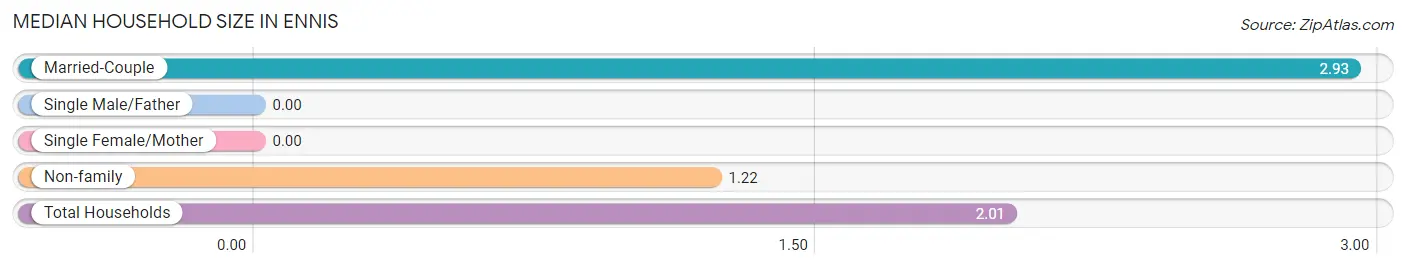
| Household Type | # Households | Household Size |
| Married-Couple | 161 (46.3%) | 2.93 |
| Single Male/Father | 0 (0.0%) | - |
| Single Female/Mother | 0 (0.0%) | - |
| Non-family | 187 (53.7%) | 1.22 |
| Total Households | 348 (100.0%) | 2.01 |
Household Size by Marriage Status in Ennis
Out of a total of 348 households in Ennis, 161 (46.3%) are family households, while 187 (53.7%) are nonfamily households. The most numerous type of family households are 2-person households, comprising 93, and the most common type of nonfamily households are 1-person households, comprising 157.
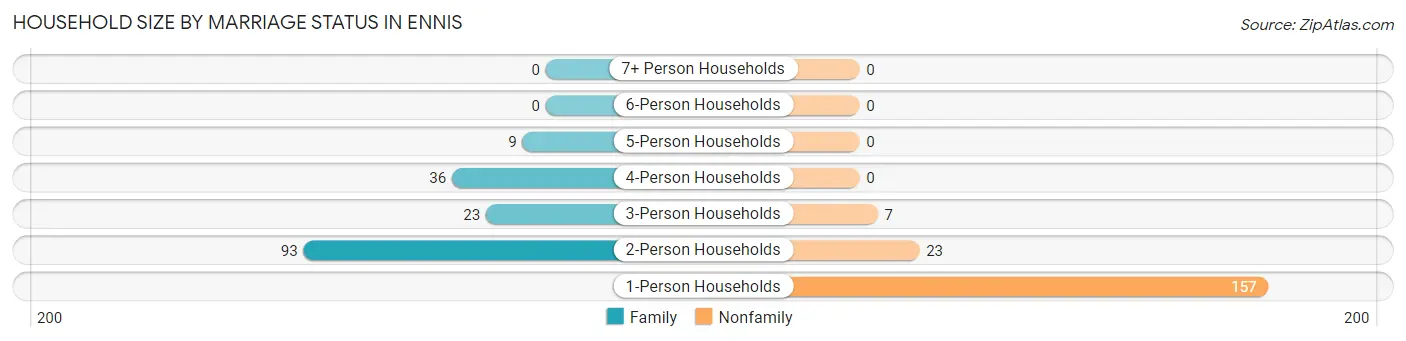
| Household Size | Family Households | Nonfamily Households |
| 1-Person Households | - | 157 (45.1%) |
| 2-Person Households | 93 (26.7%) | 23 (6.6%) |
| 3-Person Households | 23 (6.6%) | 7 (2.0%) |
| 4-Person Households | 36 (10.3%) | 0 (0.0%) |
| 5-Person Households | 9 (2.6%) | 0 (0.0%) |
| 6-Person Households | 0 (0.0%) | 0 (0.0%) |
| 7+ Person Households | 0 (0.0%) | 0 (0.0%) |
| Total | 161 (46.3%) | 187 (53.7%) |
Female Fertility in Ennis
Fertility by Age in Ennis
| Age Bracket | Women with Births | Births / 1,000 Women |
| 15 to 19 years | 0 (0.0%) | 0.0 |
| 20 to 34 years | 0 (0.0%) | 0.0 |
| 35 to 50 years | 0 (0.0%) | 0.0 |
| Total | 0 (0.0%) | 0.0 |
Fertility by Age by Marriage Status in Ennis
| Age Bracket | Married | Unmarried |
| 15 to 19 years | 0 (0.0%) | 0 (0.0%) |
| 20 to 34 years | 0 (0.0%) | 0 (0.0%) |
| 35 to 50 years | 0 (0.0%) | 0 (0.0%) |
| Total | 0 (0.0%) | 0 (0.0%) |
Fertility by Education in Ennis
| Educational Attainment | Women with Births | Births / 1,000 Women |
| Less than High School | 0 (0.0%) | 0.0 |
| High School Diploma | 0 (0.0%) | 0.0 |
| College or Associate's Degree | 0 (0.0%) | 0.0 |
| Bachelor's Degree | 0 (0.0%) | 0.0 |
| Graduate Degree | 0 (0.0%) | 0.0 |
| Total | 0 (0.0%) | 0.0 |
Fertility by Education by Marriage Status in Ennis
| Educational Attainment | Married | Unmarried |
| Less than High School | 0 (0.0%) | 0 (0.0%) |
| High School Diploma | 0 (0.0%) | 0 (0.0%) |
| College or Associate's Degree | 0 (0.0%) | 0 (0.0%) |
| Bachelor's Degree | 0 (0.0%) | 0 (0.0%) |
| Graduate Degree | 0 (0.0%) | 0 (0.0%) |
| Total | 0 (0.0%) | 0 (0.0%) |
Employment Characteristics in Ennis
Employment by Class of Employer in Ennis
Among the 399 employed individuals in Ennis, private company employees (258 | 64.7%), self-employed (not incorporated) (69 | 17.3%), and self-employed (incorporated) (19 | 4.8%) make up the most common classes of employment.
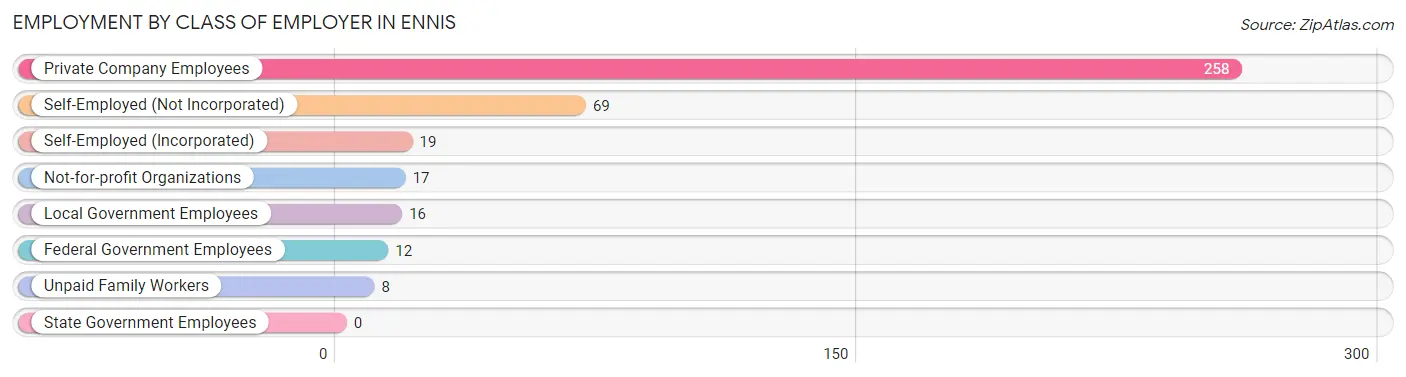
| Employer Class | # Employees | % Employees |
| Private Company Employees | 258 | 64.7% |
| Self-Employed (Incorporated) | 19 | 4.8% |
| Self-Employed (Not Incorporated) | 69 | 17.3% |
| Not-for-profit Organizations | 17 | 4.3% |
| Local Government Employees | 16 | 4.0% |
| State Government Employees | 0 | 0.0% |
| Federal Government Employees | 12 | 3.0% |
| Unpaid Family Workers | 8 | 2.0% |
| Total | 399 | 100.0% |
Employment Status by Age in Ennis
According to the labor force statistics for Ennis, out of the total population over 16 years of age (631), 63.9% or 403 individuals are in the labor force, with 1.0% or 4 of them unemployed. The age group with the highest labor force participation rate is 30 to 34 years, with 100.0% or 41 individuals in the labor force. Within the labor force, the 35 to 44 years age range has the highest percentage of unemployed individuals, with 4.3% or 4 of them being unemployed.
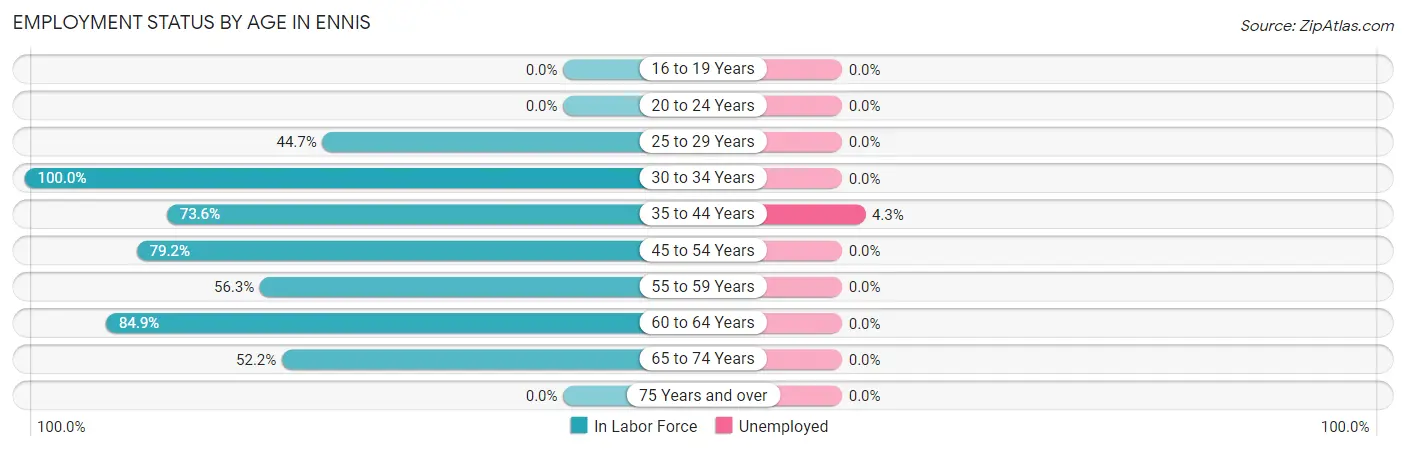
| Age Bracket | In Labor Force | Unemployed |
| 16 to 19 Years | 0 (0.0%) | 0 (0.0%) |
| 20 to 24 Years | 0 (0.0%) | 0 (0.0%) |
| 25 to 29 Years | 17 (44.7%) | 0 (0.0%) |
| 30 to 34 Years | 41 (100.0%) | 0 (0.0%) |
| 35 to 44 Years | 92 (73.6%) | 4 (4.3%) |
| 45 to 54 Years | 76 (79.2%) | 0 (0.0%) |
| 55 to 59 Years | 27 (56.3%) | 0 (0.0%) |
| 60 to 64 Years | 90 (84.9%) | 0 (0.0%) |
| 65 to 74 Years | 60 (52.2%) | 0 (0.0%) |
| 75 Years and over | 0 (0.0%) | 0 (0.0%) |
| Total | 403 (63.9%) | 4 (1.0%) |
Employment Status by Educational Attainment in Ennis
According to labor force statistics for Ennis, 75.6% of individuals (343) out of the total population between 25 and 64 years of age (454) are in the labor force, with 1.2% or 4 of them being unemployed. The group with the highest labor force participation rate are those with the educational attainment of high school diploma, with 85.2% or 201 individuals in the labor force. Within the labor force, individuals with college / associate degree education have the highest percentage of unemployment, with 4.3% or 4 of them being unemployed.
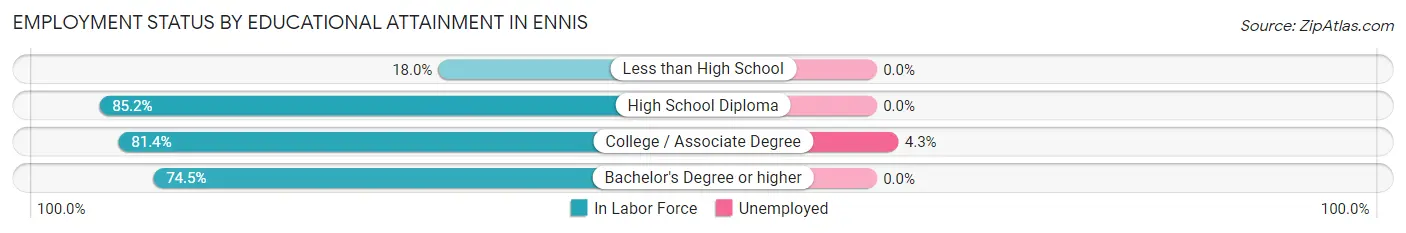
| Educational Attainment | In Labor Force | Unemployed |
| Less than High School | 9 (18.0%) | 0 (0.0%) |
| High School Diploma | 201 (85.2%) | 0 (0.0%) |
| College / Associate Degree | 92 (81.4%) | 5 (4.3%) |
| Bachelor's Degree or higher | 41 (74.5%) | 0 (0.0%) |
| Total | 343 (75.6%) | 5 (1.2%) |
Employment Occupations by Sex in Ennis
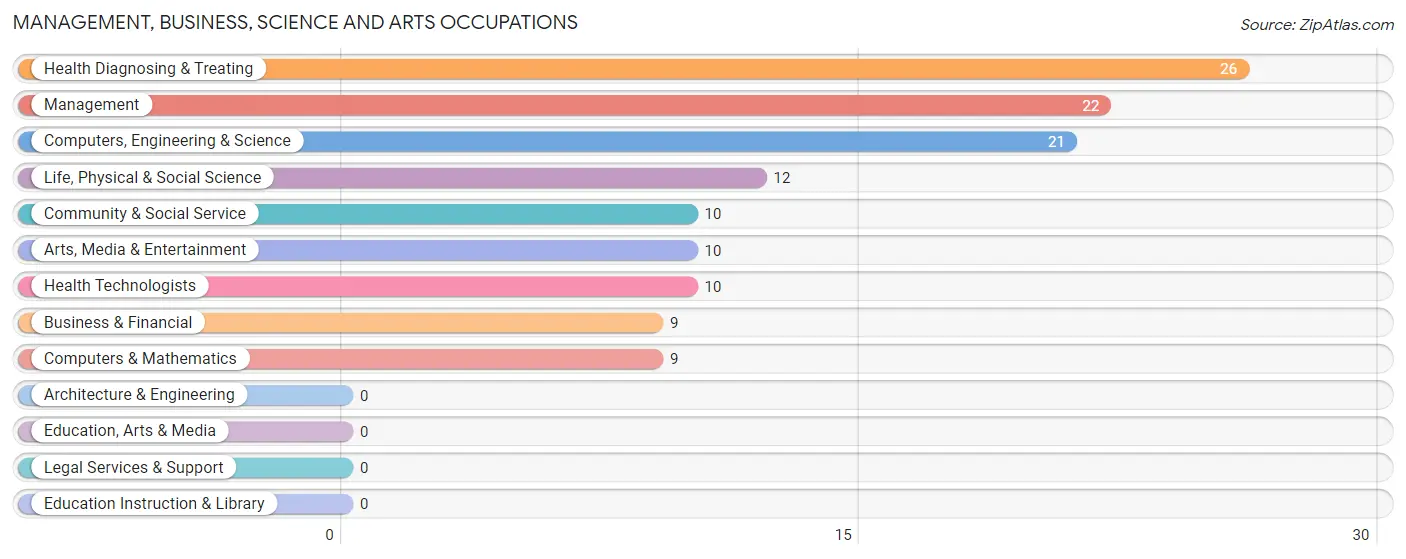
Management, Business, Science and Arts Occupations
The most common Management, Business, Science and Arts occupations in Ennis are Health Diagnosing & Treating (26 | 6.5%), Management (22 | 5.5%), Computers, Engineering & Science (21 | 5.3%), Life, Physical & Social Science (12 | 3.0%), and Community & Social Service (10 | 2.5%).
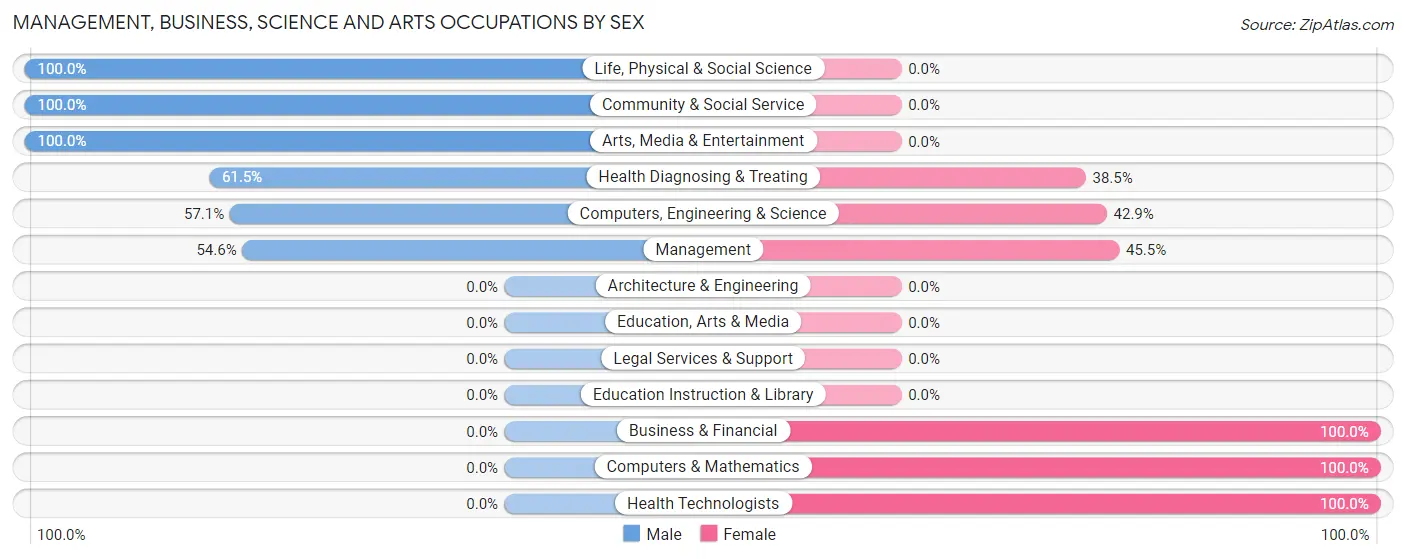
Management, Business, Science and Arts Occupations by Sex
Within the Management, Business, Science and Arts occupations in Ennis, the most male-oriented occupations are Life, Physical & Social Science (100.0%), Community & Social Service (100.0%), and Arts, Media & Entertainment (100.0%), while the most female-oriented occupations are Business & Financial (100.0%), Computers & Mathematics (100.0%), and Health Technologists (100.0%).
| Occupation | Male | Female |
| Management | 12 (54.5%) | 10 (45.5%) |
| Business & Financial | 0 (0.0%) | 9 (100.0%) |
| Computers, Engineering & Science | 12 (57.1%) | 9 (42.9%) |
| Computers & Mathematics | 0 (0.0%) | 9 (100.0%) |
| Architecture & Engineering | 0 (0.0%) | 0 (0.0%) |
| Life, Physical & Social Science | 12 (100.0%) | 0 (0.0%) |
| Community & Social Service | 10 (100.0%) | 0 (0.0%) |
| Education, Arts & Media | 0 (0.0%) | 0 (0.0%) |
| Legal Services & Support | 0 (0.0%) | 0 (0.0%) |
| Education Instruction & Library | 0 (0.0%) | 0 (0.0%) |
| Arts, Media & Entertainment | 10 (100.0%) | 0 (0.0%) |
| Health Diagnosing & Treating | 16 (61.5%) | 10 (38.5%) |
| Health Technologists | 0 (0.0%) | 10 (100.0%) |
| Total (Category) | 50 (56.8%) | 38 (43.2%) |
| Total (Overall) | 215 (53.9%) | 184 (46.1%) |
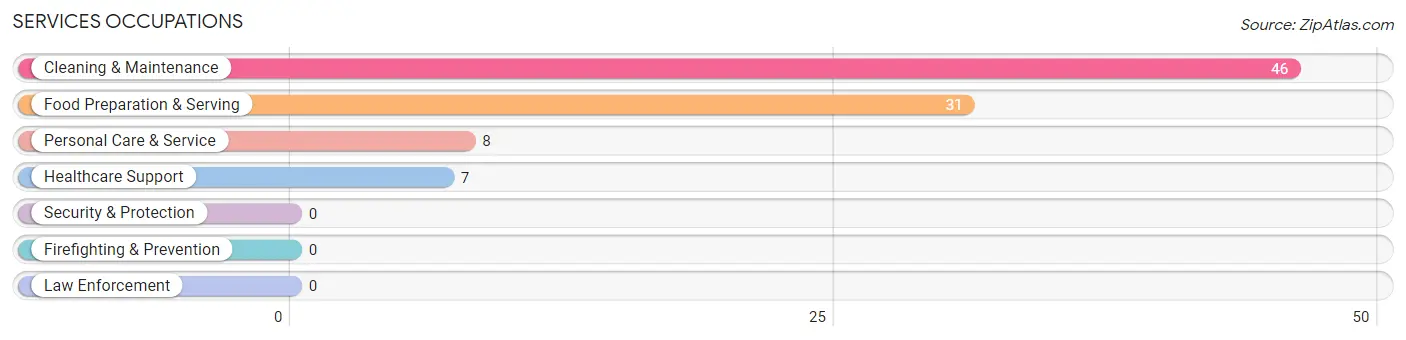
Services Occupations
The most common Services occupations in Ennis are Cleaning & Maintenance (46 | 11.5%), Food Preparation & Serving (31 | 7.8%), Personal Care & Service (8 | 2.0%), and Healthcare Support (7 | 1.8%).
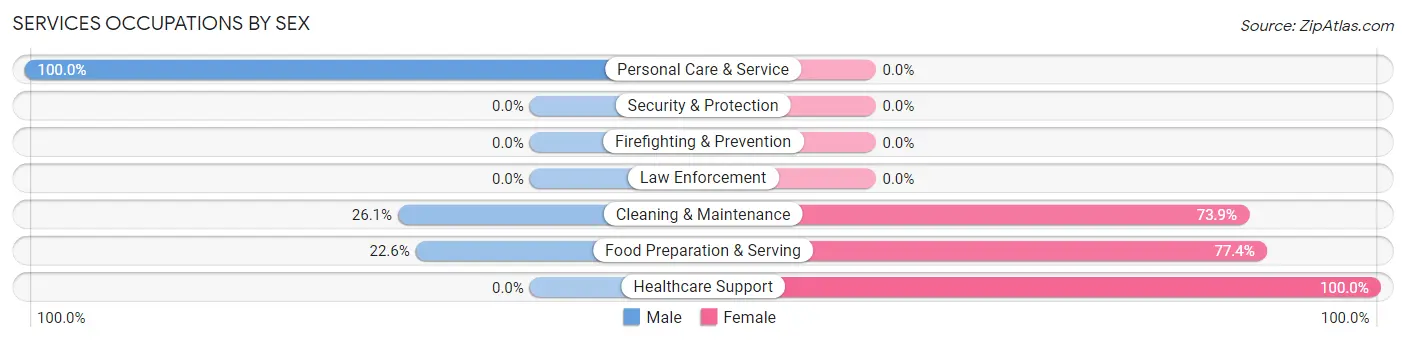
Services Occupations by Sex
Within the Services occupations in Ennis, the most male-oriented occupations are Personal Care & Service (100.0%), Cleaning & Maintenance (26.1%), and Food Preparation & Serving (22.6%), while the most female-oriented occupations are Healthcare Support (100.0%), Food Preparation & Serving (77.4%), and Cleaning & Maintenance (73.9%).
| Occupation | Male | Female |
| Healthcare Support | 0 (0.0%) | 7 (100.0%) |
| Security & Protection | 0 (0.0%) | 0 (0.0%) |
| Firefighting & Prevention | 0 (0.0%) | 0 (0.0%) |
| Law Enforcement | 0 (0.0%) | 0 (0.0%) |
| Food Preparation & Serving | 7 (22.6%) | 24 (77.4%) |
| Cleaning & Maintenance | 12 (26.1%) | 34 (73.9%) |
| Personal Care & Service | 8 (100.0%) | 0 (0.0%) |
| Total (Category) | 27 (29.3%) | 65 (70.7%) |
| Total (Overall) | 215 (53.9%) | 184 (46.1%) |
Sales and Office Occupations
The most common Sales and Office occupations in Ennis are Sales & Related (60 | 15.0%), and Office & Administration (26 | 6.5%).
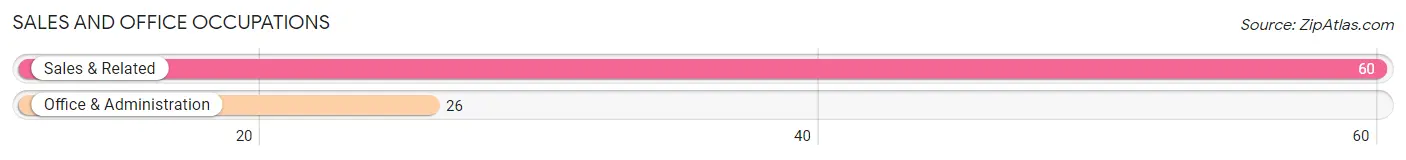
Sales and Office Occupations by Sex
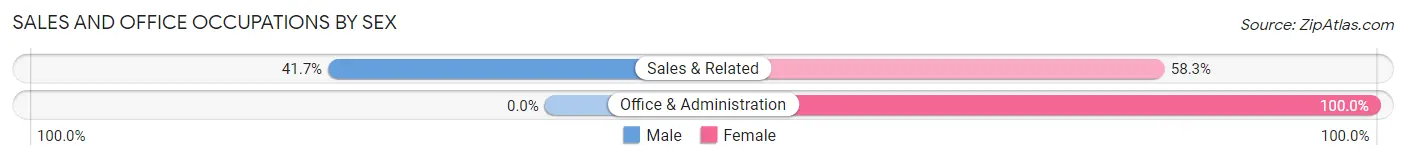
| Occupation | Male | Female |
| Sales & Related | 25 (41.7%) | 35 (58.3%) |
| Office & Administration | 0 (0.0%) | 26 (100.0%) |
| Total (Category) | 25 (29.1%) | 61 (70.9%) |
| Total (Overall) | 215 (53.9%) | 184 (46.1%) |
Natural Resources, Construction and Maintenance Occupations
The most common Natural Resources, Construction and Maintenance occupations in Ennis are Construction & Extraction (48 | 12.0%), and Installation, Maintenance & Repair (9 | 2.3%).
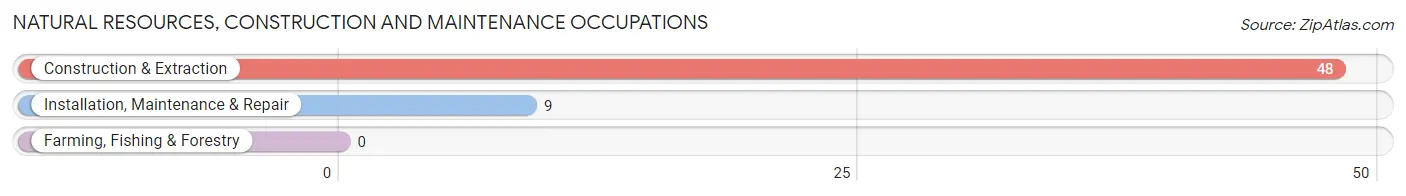
Natural Resources, Construction and Maintenance Occupations by Sex
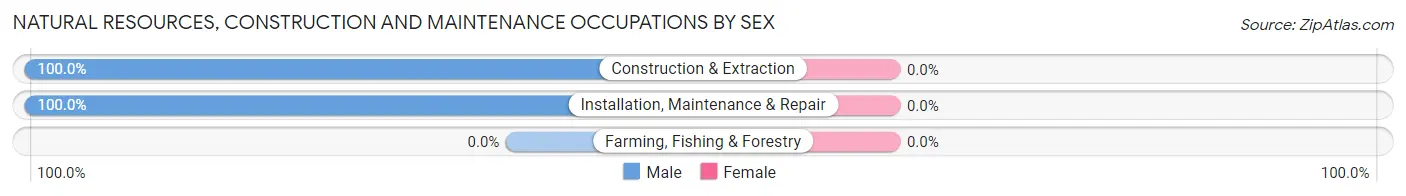
| Occupation | Male | Female |
| Farming, Fishing & Forestry | 0 (0.0%) | 0 (0.0%) |
| Construction & Extraction | 48 (100.0%) | 0 (0.0%) |
| Installation, Maintenance & Repair | 9 (100.0%) | 0 (0.0%) |
| Total (Category) | 57 (100.0%) | 0 (0.0%) |
| Total (Overall) | 215 (53.9%) | 184 (46.1%) |
Production, Transportation and Moving Occupations
The most common Production, Transportation and Moving occupations in Ennis are Transportation (61 | 15.3%), and Material Moving (15 | 3.8%).
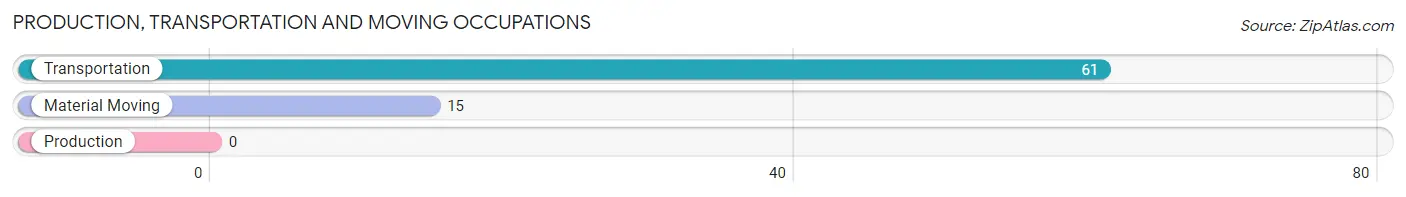
Production, Transportation and Moving Occupations by Sex
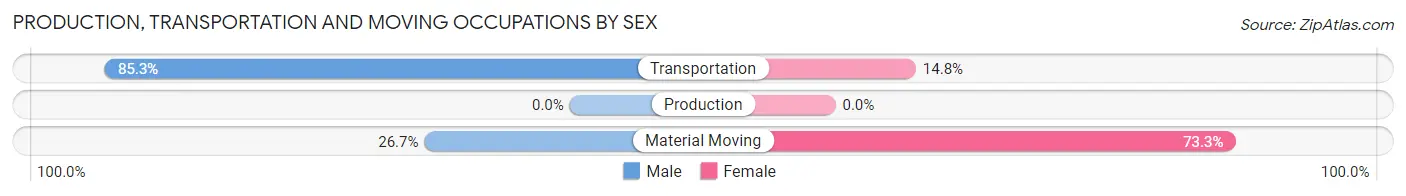
| Occupation | Male | Female |
| Production | 0 (0.0%) | 0 (0.0%) |
| Transportation | 52 (85.3%) | 9 (14.7%) |
| Material Moving | 4 (26.7%) | 11 (73.3%) |
| Total (Category) | 56 (73.7%) | 20 (26.3%) |
| Total (Overall) | 215 (53.9%) | 184 (46.1%) |
Employment Industries by Sex in Ennis
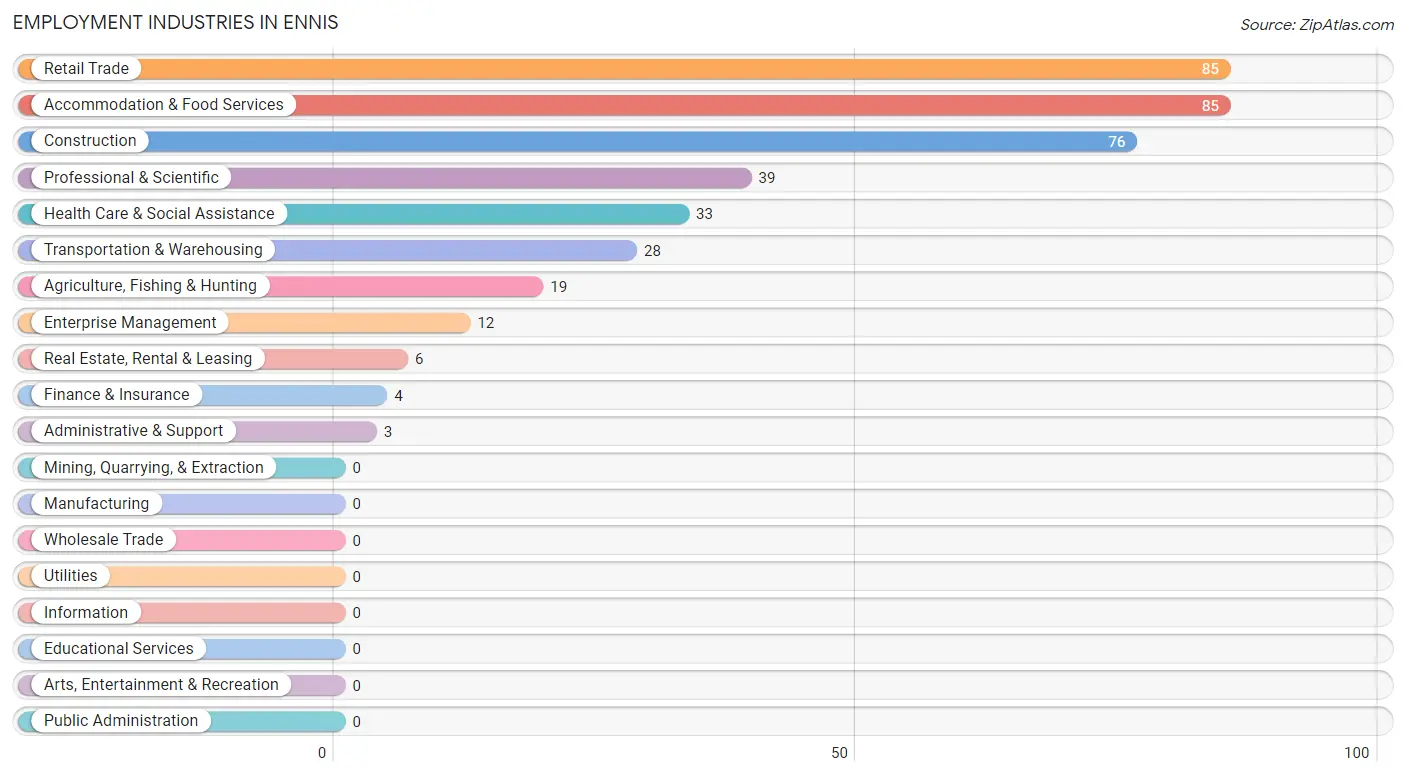
Employment Industries in Ennis
The major employment industries in Ennis include Retail Trade (85 | 21.3%), Accommodation & Food Services (85 | 21.3%), Construction (76 | 19.1%), Professional & Scientific (39 | 9.8%), and Health Care & Social Assistance (33 | 8.3%).
Employment Industries by Sex in Ennis
The Ennis industries that see more men than women are Agriculture, Fishing & Hunting (100.0%), Construction (100.0%), and Real Estate, Rental & Leasing (100.0%), whereas the industries that tend to have a higher number of women are Finance & Insurance (100.0%), Accommodation & Food Services (80.0%), and Professional & Scientific (74.4%).
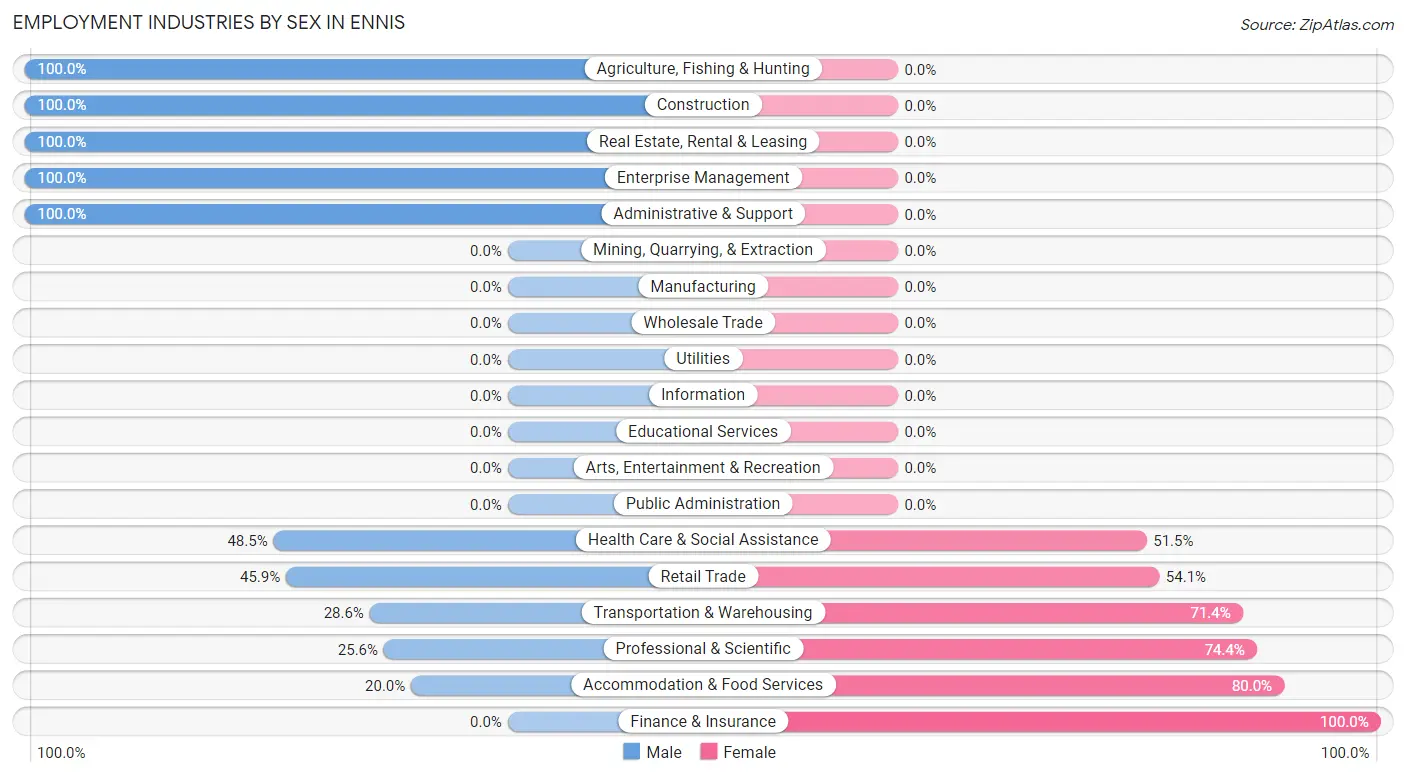
| Industry | Male | Female |
| Agriculture, Fishing & Hunting | 19 (100.0%) | 0 (0.0%) |
| Mining, Quarrying, & Extraction | 0 (0.0%) | 0 (0.0%) |
| Construction | 76 (100.0%) | 0 (0.0%) |
| Manufacturing | 0 (0.0%) | 0 (0.0%) |
| Wholesale Trade | 0 (0.0%) | 0 (0.0%) |
| Retail Trade | 39 (45.9%) | 46 (54.1%) |
| Transportation & Warehousing | 8 (28.6%) | 20 (71.4%) |
| Utilities | 0 (0.0%) | 0 (0.0%) |
| Information | 0 (0.0%) | 0 (0.0%) |
| Finance & Insurance | 0 (0.0%) | 4 (100.0%) |
| Real Estate, Rental & Leasing | 6 (100.0%) | 0 (0.0%) |
| Professional & Scientific | 10 (25.6%) | 29 (74.4%) |
| Enterprise Management | 12 (100.0%) | 0 (0.0%) |
| Administrative & Support | 3 (100.0%) | 0 (0.0%) |
| Educational Services | 0 (0.0%) | 0 (0.0%) |
| Health Care & Social Assistance | 16 (48.5%) | 17 (51.5%) |
| Arts, Entertainment & Recreation | 0 (0.0%) | 0 (0.0%) |
| Accommodation & Food Services | 17 (20.0%) | 68 (80.0%) |
| Public Administration | 0 (0.0%) | 0 (0.0%) |
| Total | 215 (53.9%) | 184 (46.1%) |
Education in Ennis
School Enrollment in Ennis
The most common levels of schooling among the 113 students in Ennis are middle school (48 | 42.5%), elementary school (43 | 38.1%), and college / undergraduate (22 | 19.5%).
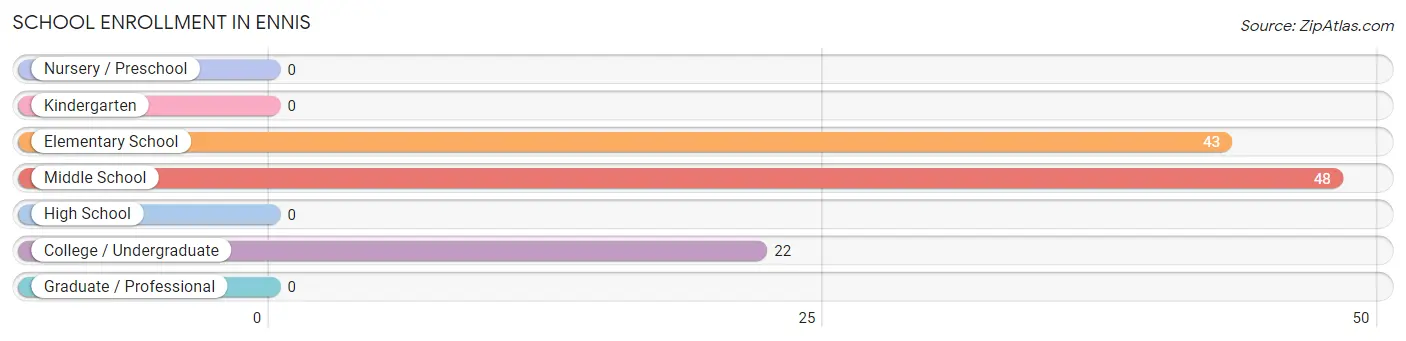
| School Level | # Students | % Students |
| Nursery / Preschool | 0 | 0.0% |
| Kindergarten | 0 | 0.0% |
| Elementary School | 43 | 38.1% |
| Middle School | 48 | 42.5% |
| High School | 0 | 0.0% |
| College / Undergraduate | 22 | 19.5% |
| Graduate / Professional | 0 | 0.0% |
| Total | 113 | 100.0% |
School Enrollment by Age by Funding Source in Ennis
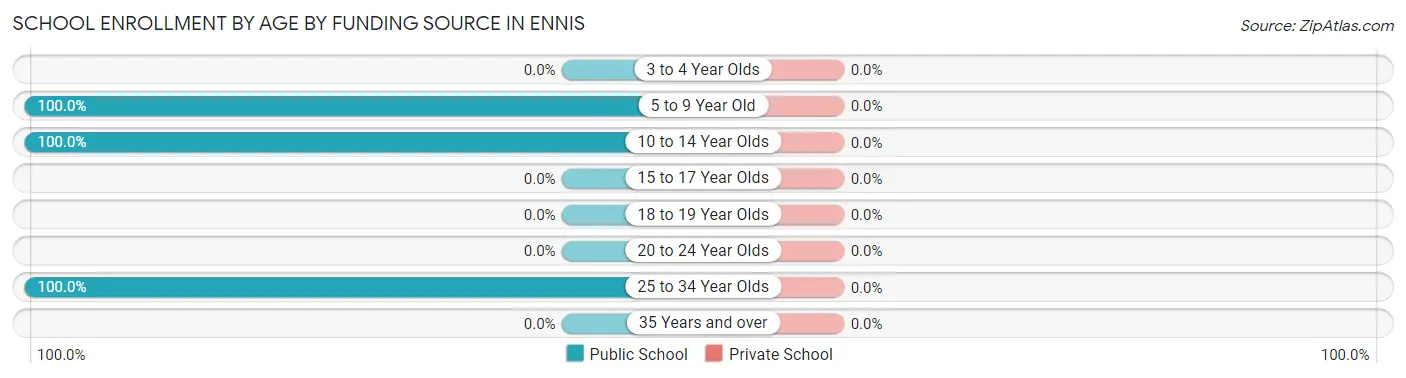
| Age Bracket | Public School | Private School |
| 3 to 4 Year Olds | 0 (0.0%) | 0 (0.0%) |
| 5 to 9 Year Old | 37 (100.0%) | 0 (0.0%) |
| 10 to 14 Year Olds | 54 (100.0%) | 0 (0.0%) |
| 15 to 17 Year Olds | 0 (0.0%) | 0 (0.0%) |
| 18 to 19 Year Olds | 0 (0.0%) | 0 (0.0%) |
| 20 to 24 Year Olds | 0 (0.0%) | 0 (0.0%) |
| 25 to 34 Year Olds | 22 (100.0%) | 0 (0.0%) |
| 35 Years and over | 0 (0.0%) | 0 (0.0%) |
| Total | 113 (100.0%) | 0 (0.0%) |
Educational Attainment by Field of Study in Ennis
Arts & humanities (31 | 25.4%), education (27 | 22.1%), multidisciplinary studies (12 | 9.8%), visual & performing arts (12 | 9.8%), and social sciences (11 | 9.0%) are the most common fields of study among 122 individuals in Ennis who have obtained a bachelor's degree or higher.
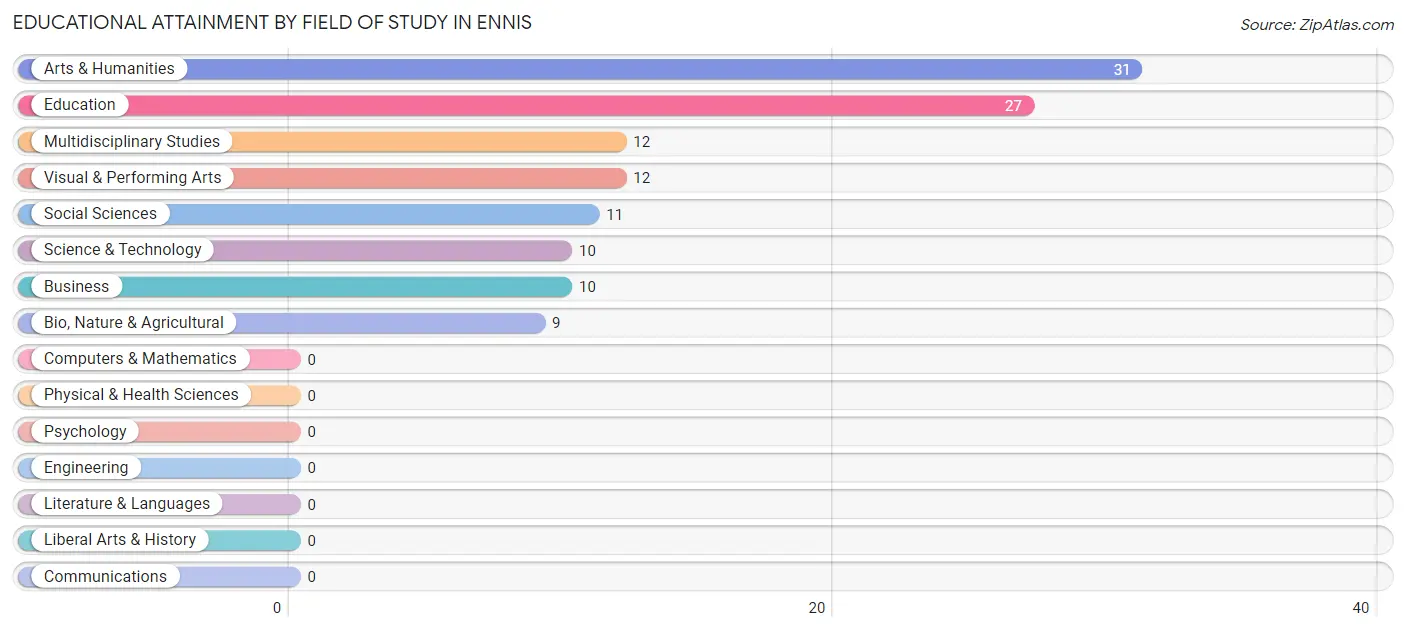
| Field of Study | # Graduates | % Graduates |
| Computers & Mathematics | 0 | 0.0% |
| Bio, Nature & Agricultural | 9 | 7.4% |
| Physical & Health Sciences | 0 | 0.0% |
| Psychology | 0 | 0.0% |
| Social Sciences | 11 | 9.0% |
| Engineering | 0 | 0.0% |
| Multidisciplinary Studies | 12 | 9.8% |
| Science & Technology | 10 | 8.2% |
| Business | 10 | 8.2% |
| Education | 27 | 22.1% |
| Literature & Languages | 0 | 0.0% |
| Liberal Arts & History | 0 | 0.0% |
| Visual & Performing Arts | 12 | 9.8% |
| Communications | 0 | 0.0% |
| Arts & Humanities | 31 | 25.4% |
| Total | 122 | 100.0% |
Transportation & Commute in Ennis
Vehicle Availability by Sex in Ennis
The most prevalent vehicle ownership categories in Ennis are males with 2 vehicles (73, accounting for 34.0%) and females with 2 vehicles (51, making up 39.7%).
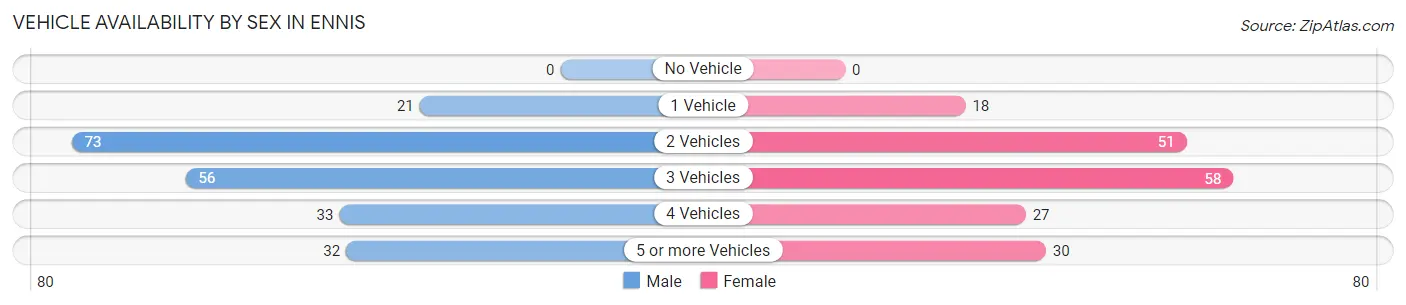
| Vehicles Available | Male | Female |
| No Vehicle | 0 (0.0%) | 0 (0.0%) |
| 1 Vehicle | 21 (9.8%) | 18 (9.8%) |
| 2 Vehicles | 73 (34.0%) | 51 (27.7%) |
| 3 Vehicles | 56 (26.1%) | 58 (31.5%) |
| 4 Vehicles | 33 (15.3%) | 27 (14.7%) |
| 5 or more Vehicles | 32 (14.9%) | 30 (16.3%) |
| Total | 215 (100.0%) | 184 (100.0%) |
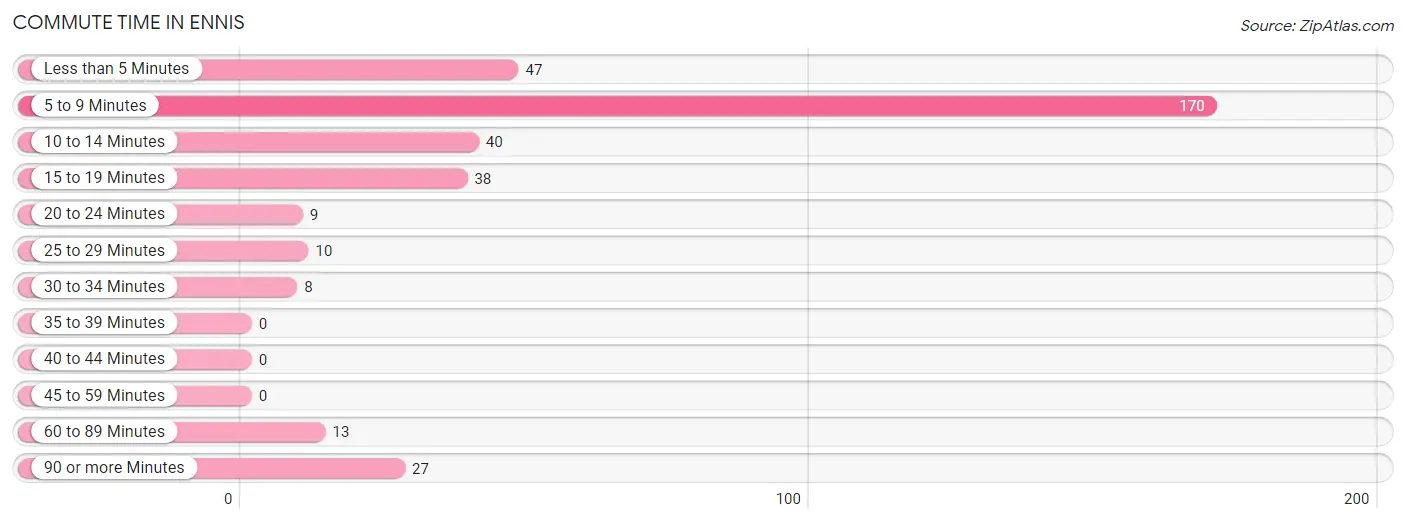
Commute Time in Ennis
The most frequently occuring commute durations in Ennis are 5 to 9 minutes (170 commuters, 47.0%), less than 5 minutes (47 commuters, 13.0%), and 10 to 14 minutes (40 commuters, 11.1%).
| Commute Time | # Commuters | % Commuters |
| Less than 5 Minutes | 47 | 13.0% |
| 5 to 9 Minutes | 170 | 47.0% |
| 10 to 14 Minutes | 40 | 11.1% |
| 15 to 19 Minutes | 38 | 10.5% |
| 20 to 24 Minutes | 9 | 2.5% |
| 25 to 29 Minutes | 10 | 2.8% |
| 30 to 34 Minutes | 8 | 2.2% |
| 35 to 39 Minutes | 0 | 0.0% |
| 40 to 44 Minutes | 0 | 0.0% |
| 45 to 59 Minutes | 0 | 0.0% |
| 60 to 89 Minutes | 13 | 3.6% |
| 90 or more Minutes | 27 | 7.5% |
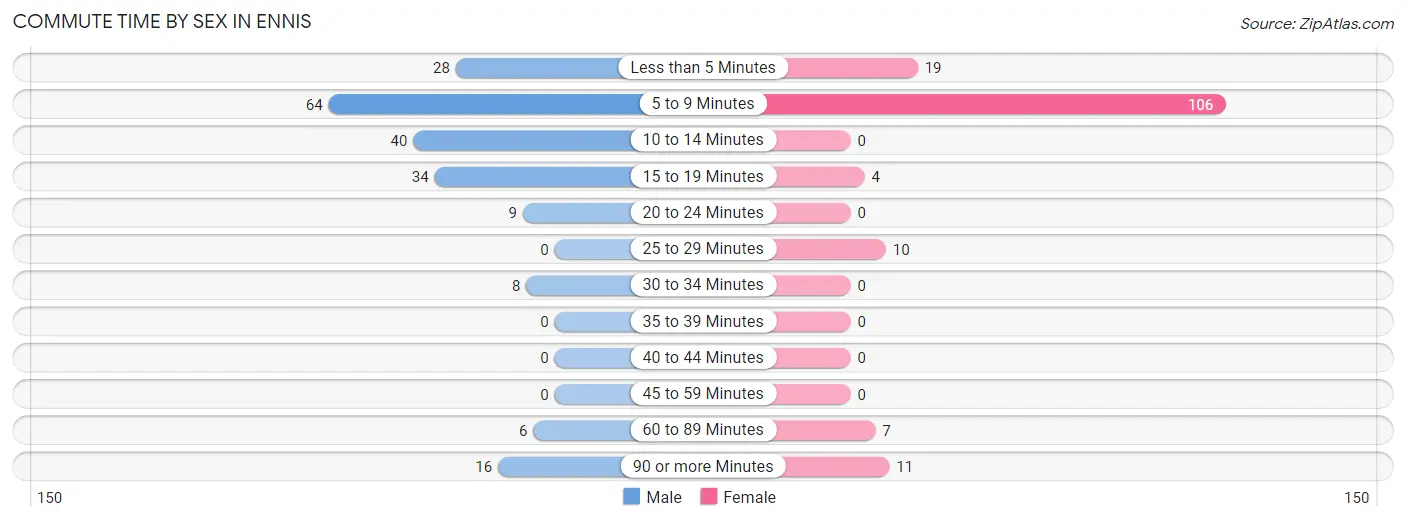
Commute Time by Sex in Ennis
The most common commute times in Ennis are 5 to 9 minutes (64 commuters, 31.2%) for males and 5 to 9 minutes (106 commuters, 67.5%) for females.
| Commute Time | Male | Female |
| Less than 5 Minutes | 28 (13.7%) | 19 (12.1%) |
| 5 to 9 Minutes | 64 (31.2%) | 106 (67.5%) |
| 10 to 14 Minutes | 40 (19.5%) | 0 (0.0%) |
| 15 to 19 Minutes | 34 (16.6%) | 4 (2.5%) |
| 20 to 24 Minutes | 9 (4.4%) | 0 (0.0%) |
| 25 to 29 Minutes | 0 (0.0%) | 10 (6.4%) |
| 30 to 34 Minutes | 8 (3.9%) | 0 (0.0%) |
| 35 to 39 Minutes | 0 (0.0%) | 0 (0.0%) |
| 40 to 44 Minutes | 0 (0.0%) | 0 (0.0%) |
| 45 to 59 Minutes | 0 (0.0%) | 0 (0.0%) |
| 60 to 89 Minutes | 6 (2.9%) | 7 (4.5%) |
| 90 or more Minutes | 16 (7.8%) | 11 (7.0%) |
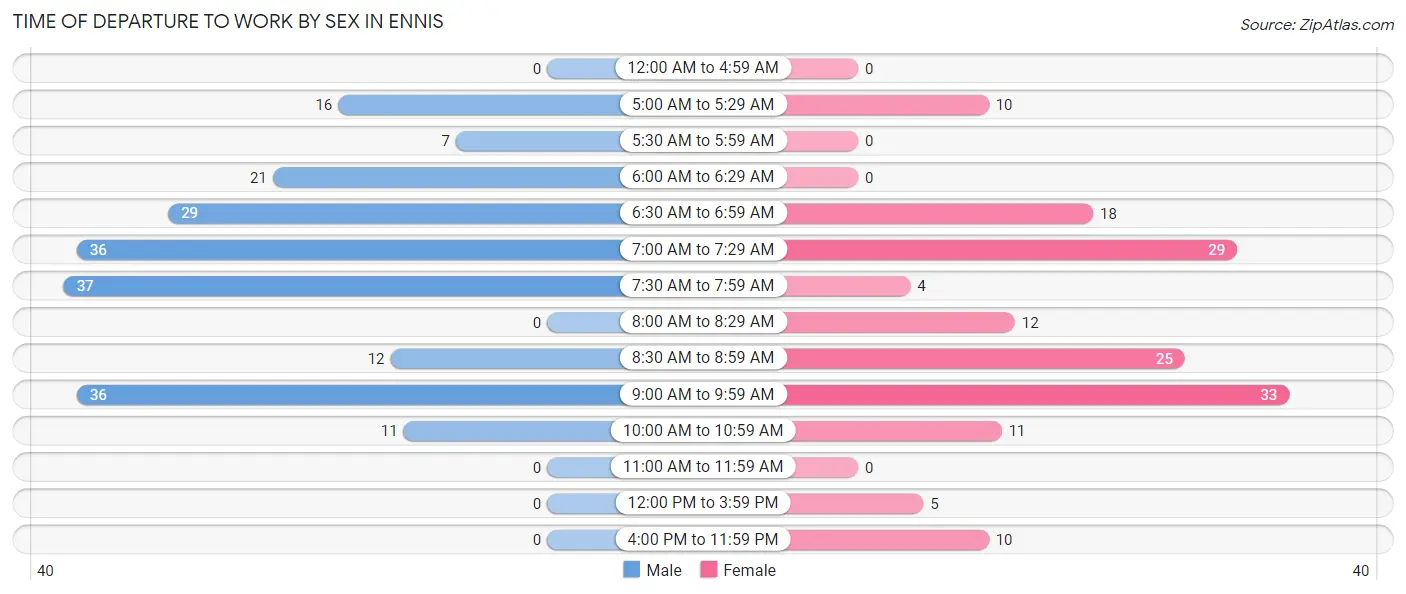
Time of Departure to Work by Sex in Ennis
The most frequent times of departure to work in Ennis are 7:30 AM to 7:59 AM (37, 18.0%) for males and 9:00 AM to 9:59 AM (33, 21.0%) for females.
| Time of Departure | Male | Female |
| 12:00 AM to 4:59 AM | 0 (0.0%) | 0 (0.0%) |
| 5:00 AM to 5:29 AM | 16 (7.8%) | 10 (6.4%) |
| 5:30 AM to 5:59 AM | 7 (3.4%) | 0 (0.0%) |
| 6:00 AM to 6:29 AM | 21 (10.2%) | 0 (0.0%) |
| 6:30 AM to 6:59 AM | 29 (14.1%) | 18 (11.5%) |
| 7:00 AM to 7:29 AM | 36 (17.6%) | 29 (18.5%) |
| 7:30 AM to 7:59 AM | 37 (18.0%) | 4 (2.5%) |
| 8:00 AM to 8:29 AM | 0 (0.0%) | 12 (7.6%) |
| 8:30 AM to 8:59 AM | 12 (5.9%) | 25 (15.9%) |
| 9:00 AM to 9:59 AM | 36 (17.6%) | 33 (21.0%) |
| 10:00 AM to 10:59 AM | 11 (5.4%) | 11 (7.0%) |
| 11:00 AM to 11:59 AM | 0 (0.0%) | 0 (0.0%) |
| 12:00 PM to 3:59 PM | 0 (0.0%) | 5 (3.2%) |
| 4:00 PM to 11:59 PM | 0 (0.0%) | 10 (6.4%) |
| Total | 205 (100.0%) | 157 (100.0%) |
Housing Occupancy in Ennis
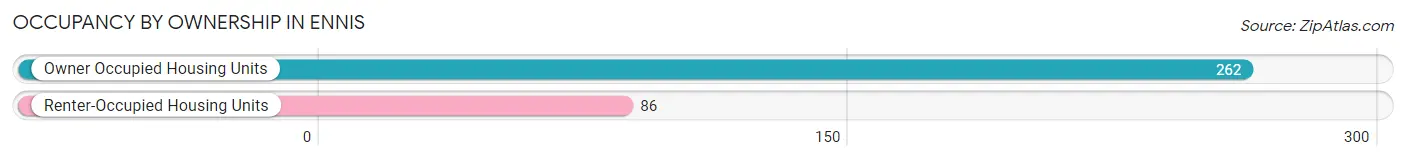
Occupancy by Ownership in Ennis
Of the total 348 dwellings in Ennis, owner-occupied units account for 262 (75.3%), while renter-occupied units make up 86 (24.7%).
| Occupancy | # Housing Units | % Housing Units |
| Owner Occupied Housing Units | 262 | 75.3% |
| Renter-Occupied Housing Units | 86 | 24.7% |
| Total Occupied Housing Units | 348 | 100.0% |
Occupancy by Household Size in Ennis
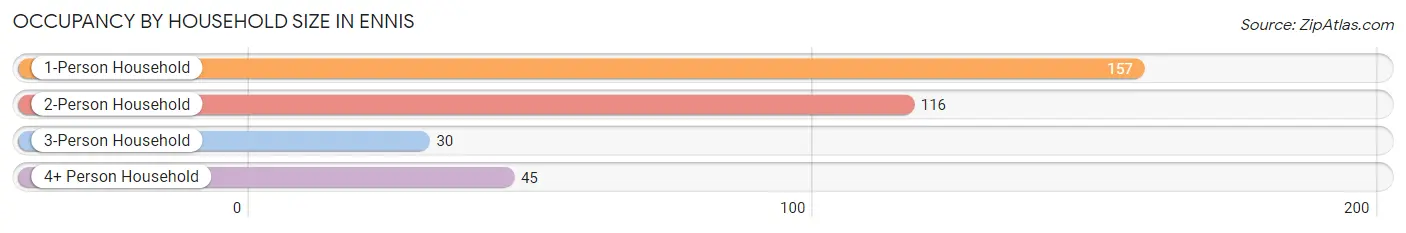
| Household Size | # Housing Units | % Housing Units |
| 1-Person Household | 157 | 45.1% |
| 2-Person Household | 116 | 33.3% |
| 3-Person Household | 30 | 8.6% |
| 4+ Person Household | 45 | 12.9% |
| Total Housing Units | 348 | 100.0% |
Occupancy by Ownership by Household Size in Ennis
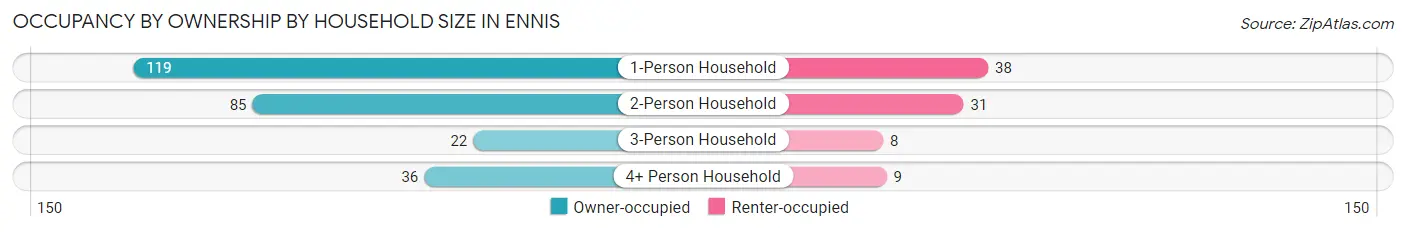
| Household Size | Owner-occupied | Renter-occupied |
| 1-Person Household | 119 (75.8%) | 38 (24.2%) |
| 2-Person Household | 85 (73.3%) | 31 (26.7%) |
| 3-Person Household | 22 (73.3%) | 8 (26.7%) |
| 4+ Person Household | 36 (80.0%) | 9 (20.0%) |
| Total Housing Units | 262 (75.3%) | 86 (24.7%) |
Occupancy by Educational Attainment in Ennis
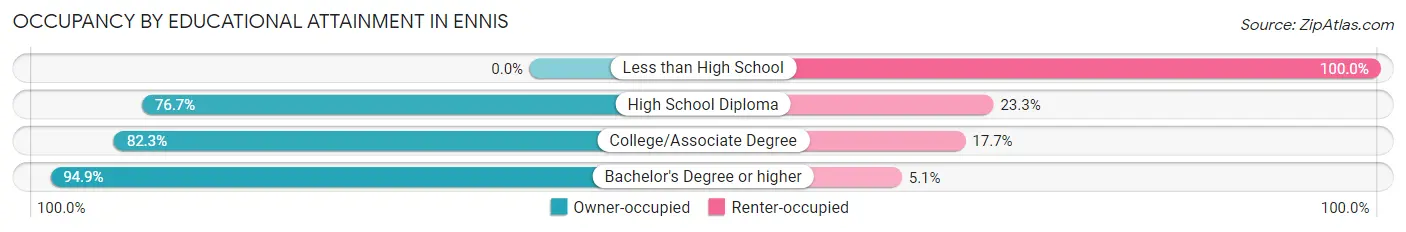
| Household Size | Owner-occupied | Renter-occupied |
| Less than High School | 0 (0.0%) | 30 (100.0%) |
| High School Diploma | 99 (76.7%) | 30 (23.3%) |
| College/Associate Degree | 107 (82.3%) | 23 (17.7%) |
| Bachelor's Degree or higher | 56 (94.9%) | 3 (5.1%) |
Occupancy by Age of Householder in Ennis
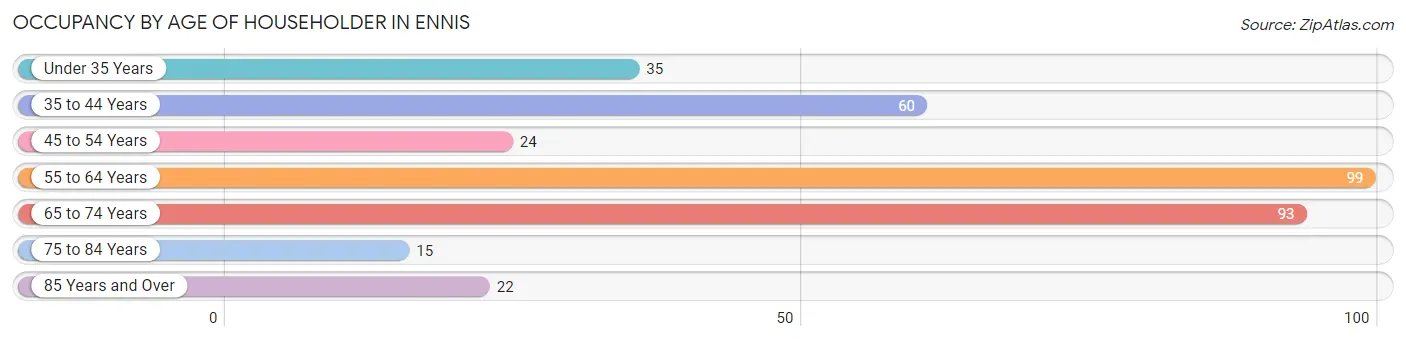
| Age Bracket | # Households | % Households |
| Under 35 Years | 35 | 10.1% |
| 35 to 44 Years | 60 | 17.2% |
| 45 to 54 Years | 24 | 6.9% |
| 55 to 64 Years | 99 | 28.4% |
| 65 to 74 Years | 93 | 26.7% |
| 75 to 84 Years | 15 | 4.3% |
| 85 Years and Over | 22 | 6.3% |
| Total | 348 | 100.0% |
Housing Finances in Ennis
Median Income by Occupancy in Ennis
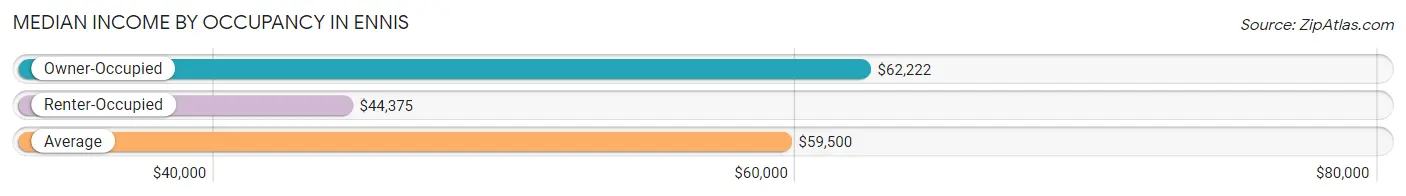
| Occupancy Type | # Households | Median Income |
| Owner-Occupied | 262 (75.3%) | $62,222 |
| Renter-Occupied | 86 (24.7%) | $44,375 |
| Average | 348 (100.0%) | $59,500 |
Occupancy by Householder Income Bracket in Ennis
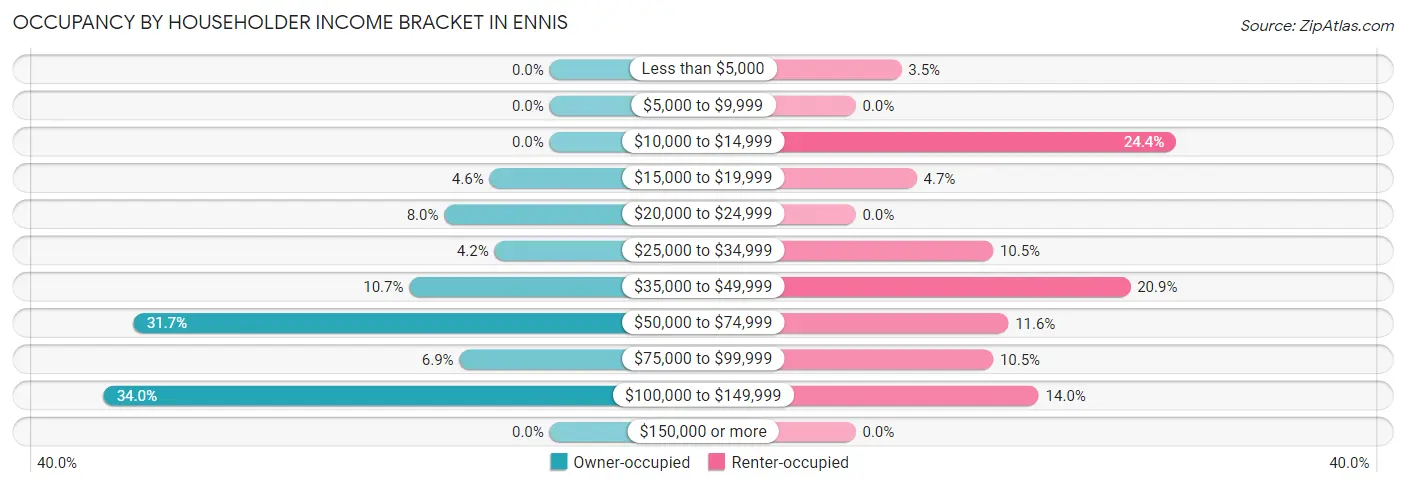
| Income Bracket | Owner-occupied | Renter-occupied |
| Less than $5,000 | 0 (0.0%) | 3 (3.5%) |
| $5,000 to $9,999 | 0 (0.0%) | 0 (0.0%) |
| $10,000 to $14,999 | 0 (0.0%) | 21 (24.4%) |
| $15,000 to $19,999 | 12 (4.6%) | 4 (4.6%) |
| $20,000 to $24,999 | 21 (8.0%) | 0 (0.0%) |
| $25,000 to $34,999 | 11 (4.2%) | 9 (10.5%) |
| $35,000 to $49,999 | 28 (10.7%) | 18 (20.9%) |
| $50,000 to $74,999 | 83 (31.7%) | 10 (11.6%) |
| $75,000 to $99,999 | 18 (6.9%) | 9 (10.5%) |
| $100,000 to $149,999 | 89 (34.0%) | 12 (14.0%) |
| $150,000 or more | 0 (0.0%) | 0 (0.0%) |
| Total | 262 (100.0%) | 86 (100.0%) |
Monthly Housing Cost Tiers in Ennis
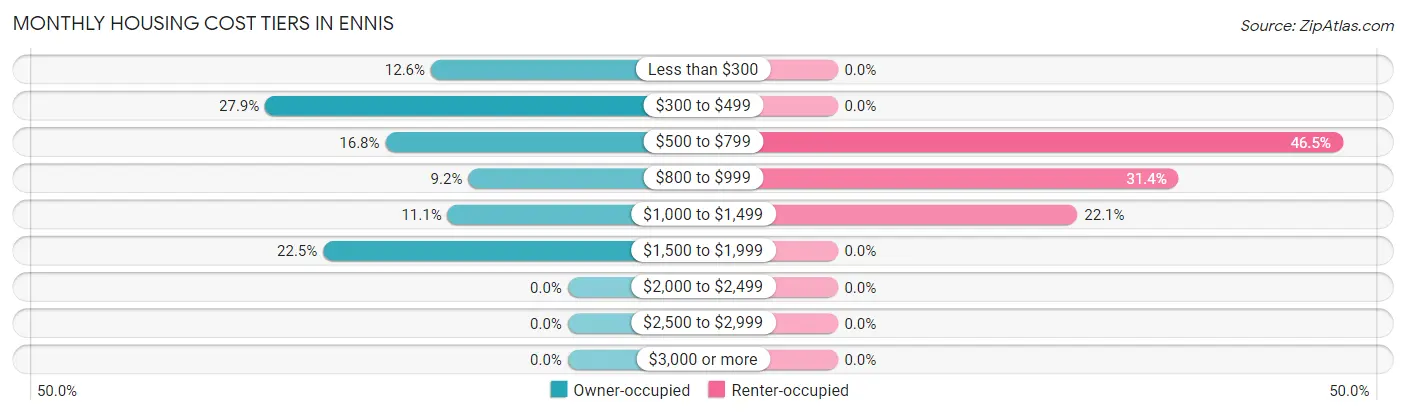
| Monthly Cost | Owner-occupied | Renter-occupied |
| Less than $300 | 33 (12.6%) | 0 (0.0%) |
| $300 to $499 | 73 (27.9%) | 0 (0.0%) |
| $500 to $799 | 44 (16.8%) | 40 (46.5%) |
| $800 to $999 | 24 (9.2%) | 27 (31.4%) |
| $1,000 to $1,499 | 29 (11.1%) | 19 (22.1%) |
| $1,500 to $1,999 | 59 (22.5%) | 0 (0.0%) |
| $2,000 to $2,499 | 0 (0.0%) | 0 (0.0%) |
| $2,500 to $2,999 | 0 (0.0%) | 0 (0.0%) |
| $3,000 or more | 0 (0.0%) | 0 (0.0%) |
| Total | 262 (100.0%) | 86 (100.0%) |
Physical Housing Characteristics in Ennis
Housing Structures in Ennis
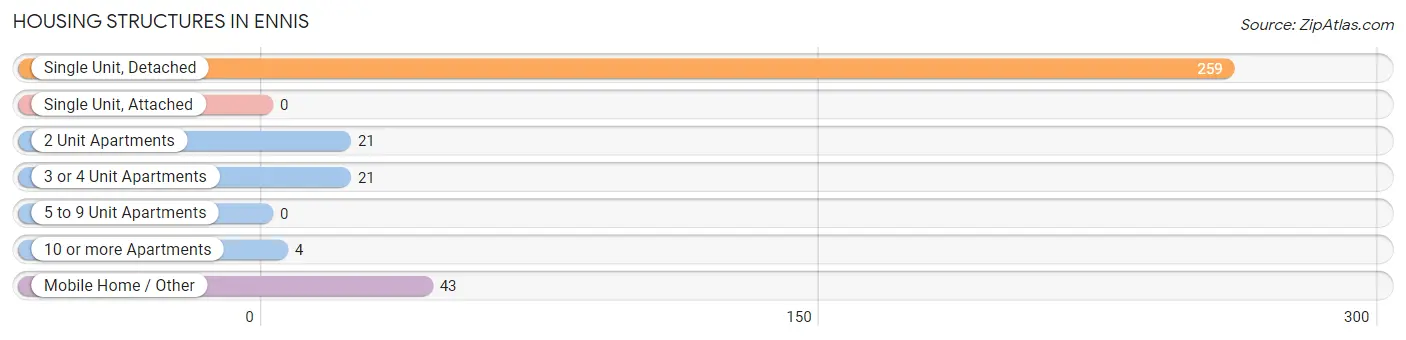
| Structure Type | # Housing Units | % Housing Units |
| Single Unit, Detached | 259 | 74.4% |
| Single Unit, Attached | 0 | 0.0% |
| 2 Unit Apartments | 21 | 6.0% |
| 3 or 4 Unit Apartments | 21 | 6.0% |
| 5 to 9 Unit Apartments | 0 | 0.0% |
| 10 or more Apartments | 4 | 1.1% |
| Mobile Home / Other | 43 | 12.4% |
| Total | 348 | 100.0% |
Housing Structures by Occupancy in Ennis
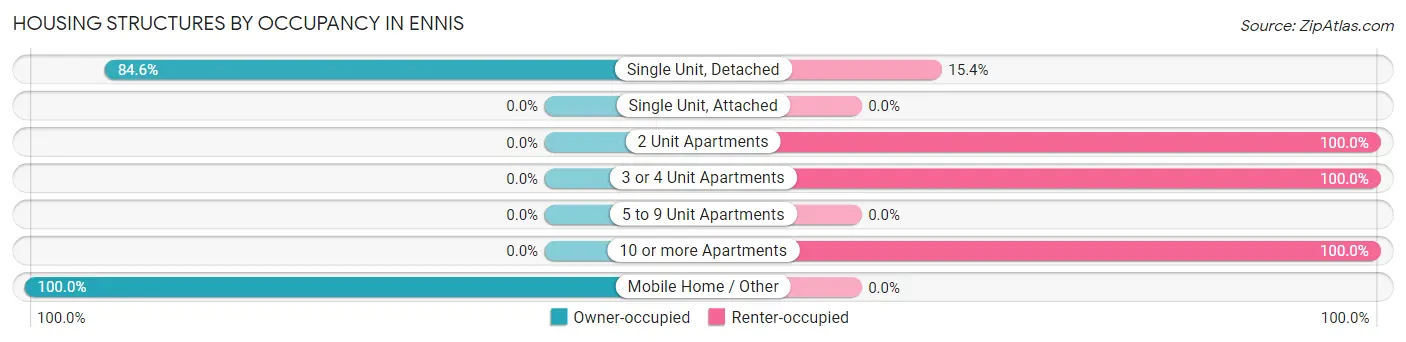
| Structure Type | Owner-occupied | Renter-occupied |
| Single Unit, Detached | 219 (84.6%) | 40 (15.4%) |
| Single Unit, Attached | 0 (0.0%) | 0 (0.0%) |
| 2 Unit Apartments | 0 (0.0%) | 21 (100.0%) |
| 3 or 4 Unit Apartments | 0 (0.0%) | 21 (100.0%) |
| 5 to 9 Unit Apartments | 0 (0.0%) | 0 (0.0%) |
| 10 or more Apartments | 0 (0.0%) | 4 (100.0%) |
| Mobile Home / Other | 43 (100.0%) | 0 (0.0%) |
| Total | 262 (75.3%) | 86 (24.7%) |
Housing Structures by Number of Rooms in Ennis
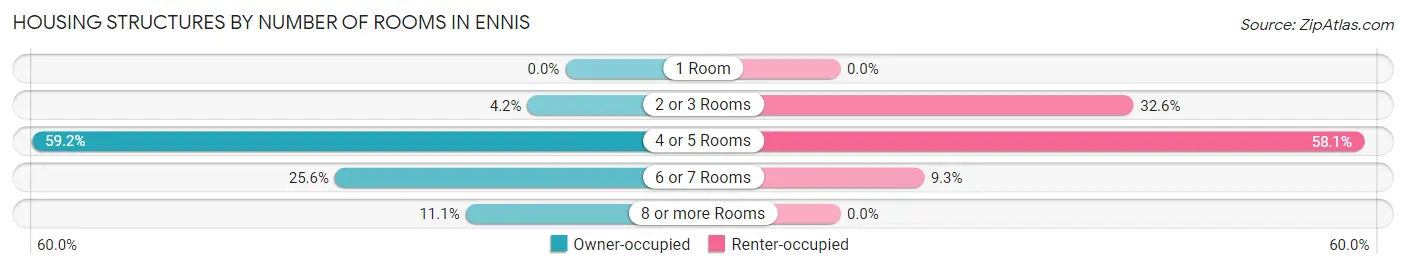
| Number of Rooms | Owner-occupied | Renter-occupied |
| 1 Room | 0 (0.0%) | 0 (0.0%) |
| 2 or 3 Rooms | 11 (4.2%) | 28 (32.6%) |
| 4 or 5 Rooms | 155 (59.2%) | 50 (58.1%) |
| 6 or 7 Rooms | 67 (25.6%) | 8 (9.3%) |
| 8 or more Rooms | 29 (11.1%) | 0 (0.0%) |
| Total | 262 (100.0%) | 86 (100.0%) |
Housing Structure by Heating Type in Ennis
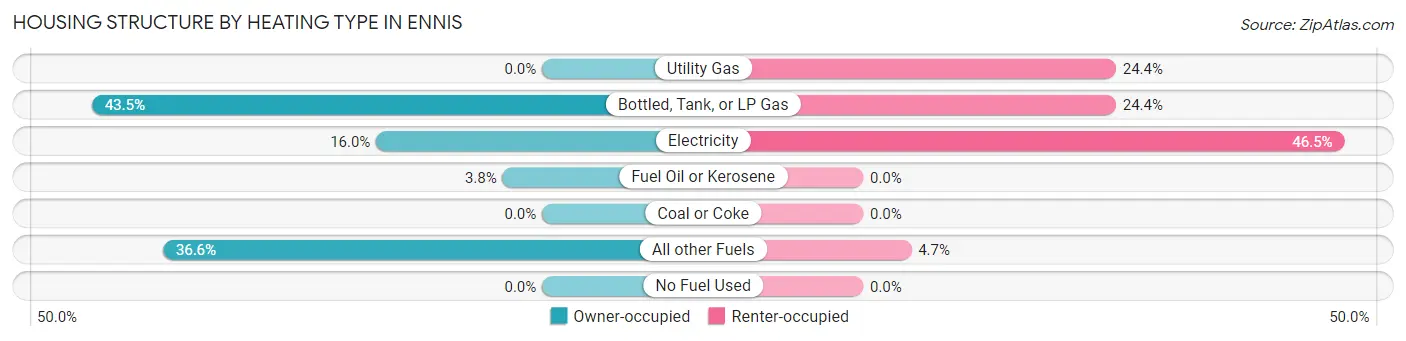
| Heating Type | Owner-occupied | Renter-occupied |
| Utility Gas | 0 (0.0%) | 21 (24.4%) |
| Bottled, Tank, or LP Gas | 114 (43.5%) | 21 (24.4%) |
| Electricity | 42 (16.0%) | 40 (46.5%) |
| Fuel Oil or Kerosene | 10 (3.8%) | 0 (0.0%) |
| Coal or Coke | 0 (0.0%) | 0 (0.0%) |
| All other Fuels | 96 (36.6%) | 4 (4.6%) |
| No Fuel Used | 0 (0.0%) | 0 (0.0%) |
| Total | 262 (100.0%) | 86 (100.0%) |
Household Vehicle Usage in Ennis
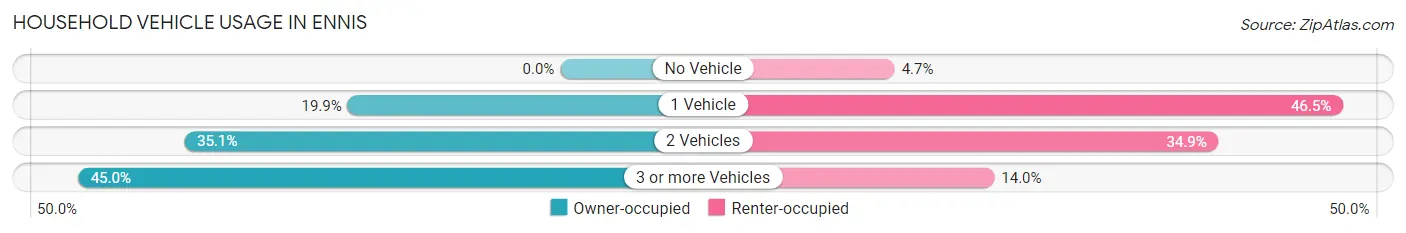
| Vehicles per Household | Owner-occupied | Renter-occupied |
| No Vehicle | 0 (0.0%) | 4 (4.6%) |
| 1 Vehicle | 52 (19.9%) | 40 (46.5%) |
| 2 Vehicles | 92 (35.1%) | 30 (34.9%) |
| 3 or more Vehicles | 118 (45.0%) | 12 (14.0%) |
| Total | 262 (100.0%) | 86 (100.0%) |
Real Estate & Mortgages in Ennis
Real Estate and Mortgage Overview in Ennis
| Characteristic | Without Mortgage | With Mortgage |
| Housing Units | 163 | 99 |
| Median Property Value | $324,200 | $260,400 |
| Median Household Income | $57,563 | $0 |
| Monthly Housing Costs | $460 | $0 |
| Real Estate Taxes | $1,287 | $0 |
Property Value by Mortgage Status in Ennis
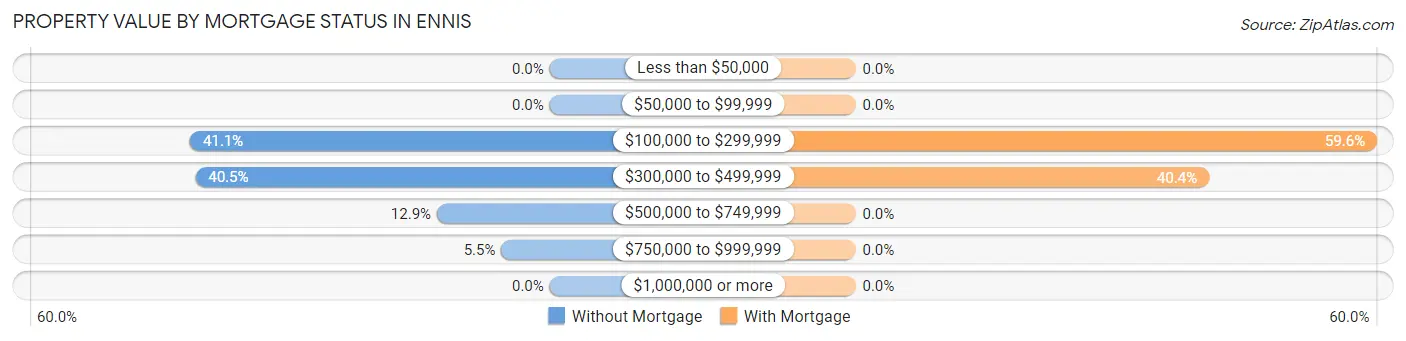
| Property Value | Without Mortgage | With Mortgage |
| Less than $50,000 | 0 (0.0%) | 0 (0.0%) |
| $50,000 to $99,999 | 0 (0.0%) | 0 (0.0%) |
| $100,000 to $299,999 | 67 (41.1%) | 59 (59.6%) |
| $300,000 to $499,999 | 66 (40.5%) | 40 (40.4%) |
| $500,000 to $749,999 | 21 (12.9%) | 0 (0.0%) |
| $750,000 to $999,999 | 9 (5.5%) | 0 (0.0%) |
| $1,000,000 or more | 0 (0.0%) | 0 (0.0%) |
| Total | 163 (100.0%) | 99 (100.0%) |
Household Income by Mortgage Status in Ennis
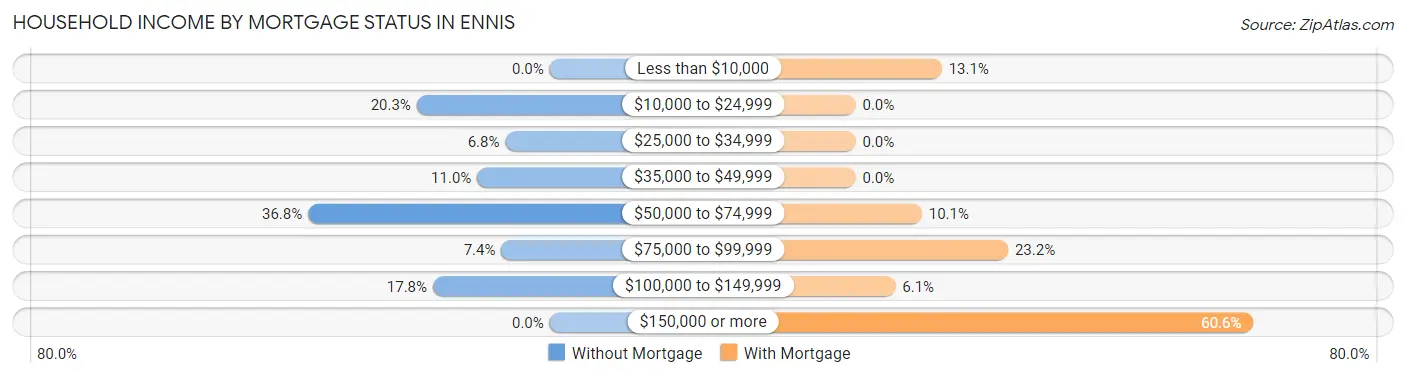
| Household Income | Without Mortgage | With Mortgage |
| Less than $10,000 | 0 (0.0%) | 13 (13.1%) |
| $10,000 to $24,999 | 33 (20.3%) | 0 (0.0%) |
| $25,000 to $34,999 | 11 (6.8%) | 0 (0.0%) |
| $35,000 to $49,999 | 18 (11.0%) | 0 (0.0%) |
| $50,000 to $74,999 | 60 (36.8%) | 10 (10.1%) |
| $75,000 to $99,999 | 12 (7.4%) | 23 (23.2%) |
| $100,000 to $149,999 | 29 (17.8%) | 6 (6.1%) |
| $150,000 or more | 0 (0.0%) | 60 (60.6%) |
| Total | 163 (100.0%) | 99 (100.0%) |
Property Value to Household Income Ratio in Ennis
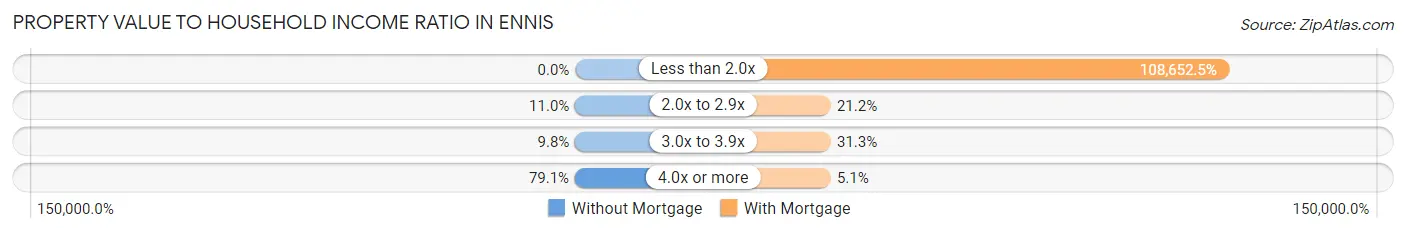
| Value-to-Income Ratio | Without Mortgage | With Mortgage |
| Less than 2.0x | 0 (0.0%) | 107,566 (108,652.5%) |
| 2.0x to 2.9x | 18 (11.0%) | 21 (21.2%) |
| 3.0x to 3.9x | 16 (9.8%) | 31 (31.3%) |
| 4.0x or more | 129 (79.1%) | 5 (5.1%) |
| Total | 163 (100.0%) | 99 (100.0%) |
Real Estate Taxes by Mortgage Status in Ennis
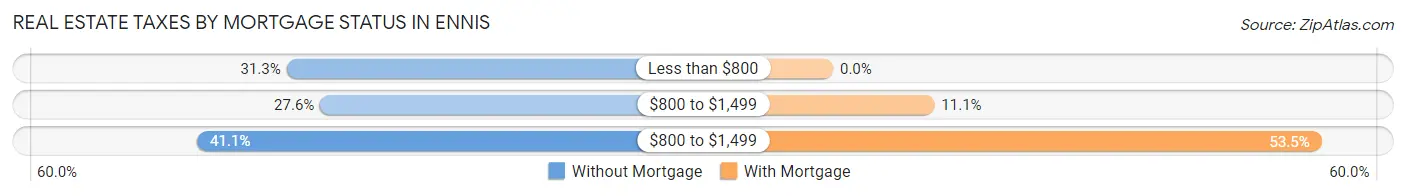
| Property Taxes | Without Mortgage | With Mortgage |
| Less than $800 | 51 (31.3%) | 0 (0.0%) |
| $800 to $1,499 | 45 (27.6%) | 11 (11.1%) |
| $800 to $1,499 | 67 (41.1%) | 53 (53.5%) |
| Total | 163 (100.0%) | 99 (100.0%) |
Health & Disability in Ennis
Health Insurance Coverage by Age in Ennis
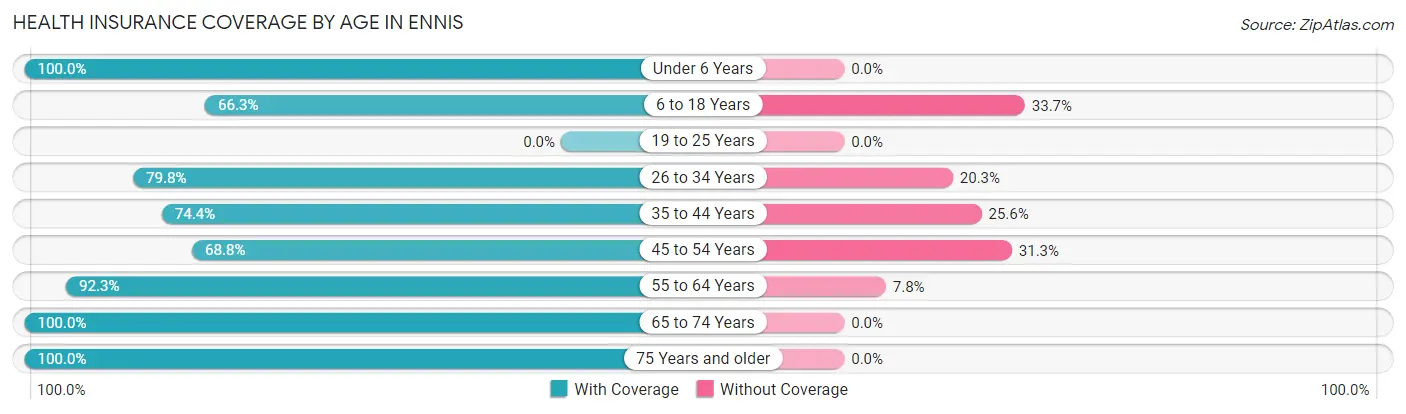
| Age Bracket | With Coverage | Without Coverage |
| Under 6 Years | 7 (100.0%) | 0 (0.0%) |
| 6 to 18 Years | 65 (66.3%) | 33 (33.7%) |
| 19 to 25 Years | 0 (0.0%) | 0 (0.0%) |
| 26 to 34 Years | 63 (79.7%) | 16 (20.3%) |
| 35 to 44 Years | 93 (74.4%) | 32 (25.6%) |
| 45 to 54 Years | 66 (68.8%) | 30 (31.2%) |
| 55 to 64 Years | 131 (92.2%) | 11 (7.7%) |
| 65 to 74 Years | 114 (100.0%) | 0 (0.0%) |
| 75 Years and older | 49 (100.0%) | 0 (0.0%) |
| Total | 588 (82.8%) | 122 (17.2%) |
Health Insurance Coverage by Citizenship Status in Ennis
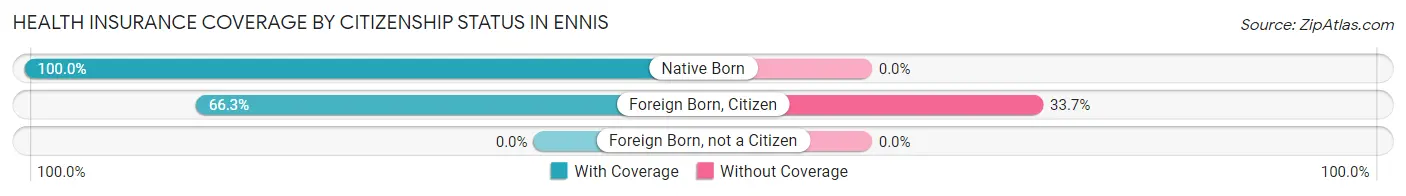
| Citizenship Status | With Coverage | Without Coverage |
| Native Born | 7 (100.0%) | 0 (0.0%) |
| Foreign Born, Citizen | 65 (66.3%) | 33 (33.7%) |
| Foreign Born, not a Citizen | 0 (0.0%) | 0 (0.0%) |
Health Insurance Coverage by Household Income in Ennis
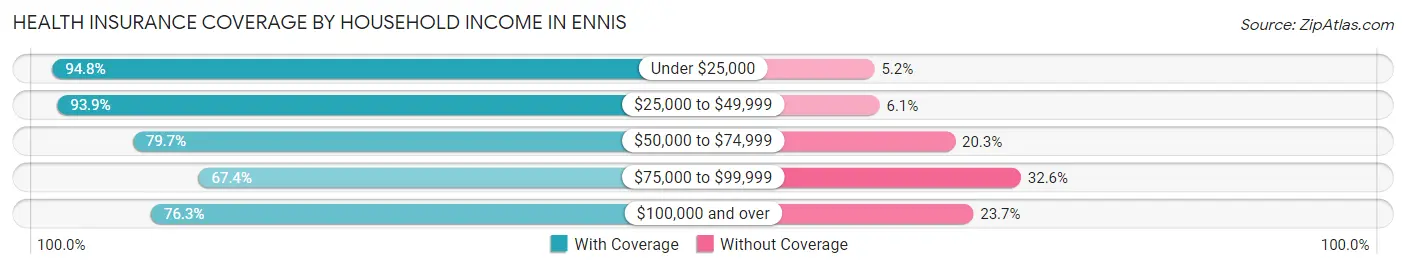
| Household Income | With Coverage | Without Coverage |
| Under $25,000 | 73 (94.8%) | 4 (5.2%) |
| $25,000 to $49,999 | 153 (93.9%) | 10 (6.1%) |
| $50,000 to $74,999 | 114 (79.7%) | 29 (20.3%) |
| $75,000 to $99,999 | 31 (67.4%) | 15 (32.6%) |
| $100,000 and over | 206 (76.3%) | 64 (23.7%) |
Public vs Private Health Insurance Coverage by Age in Ennis
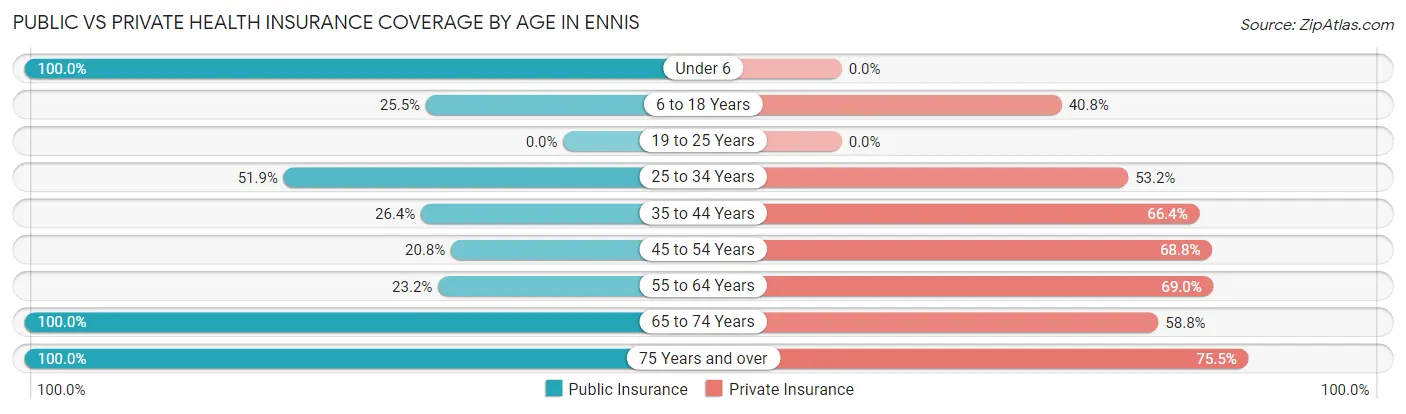
| Age Bracket | Public Insurance | Private Insurance |
| Under 6 | 7 (100.0%) | 0 (0.0%) |
| 6 to 18 Years | 25 (25.5%) | 40 (40.8%) |
| 19 to 25 Years | 0 (0.0%) | 0 (0.0%) |
| 25 to 34 Years | 41 (51.9%) | 42 (53.2%) |
| 35 to 44 Years | 33 (26.4%) | 83 (66.4%) |
| 45 to 54 Years | 20 (20.8%) | 66 (68.8%) |
| 55 to 64 Years | 33 (23.2%) | 98 (69.0%) |
| 65 to 74 Years | 114 (100.0%) | 67 (58.8%) |
| 75 Years and over | 49 (100.0%) | 37 (75.5%) |
| Total | 322 (45.4%) | 433 (61.0%) |
Disability Status by Sex by Age in Ennis
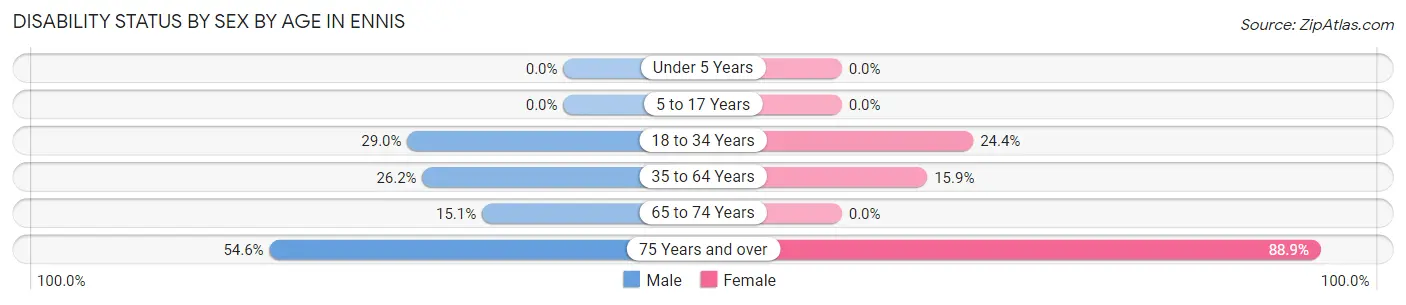
| Age Bracket | Male | Female |
| Under 5 Years | 0 (0.0%) | 0 (0.0%) |
| 5 to 17 Years | 0 (0.0%) | 0 (0.0%) |
| 18 to 34 Years | 11 (28.9%) | 10 (24.4%) |
| 35 to 64 Years | 57 (26.2%) | 23 (15.9%) |
| 65 to 74 Years | 8 (15.1%) | 0 (0.0%) |
| 75 Years and over | 12 (54.5%) | 24 (88.9%) |
Disability Class by Sex by Age in Ennis
Disability Class: Hearing Difficulty
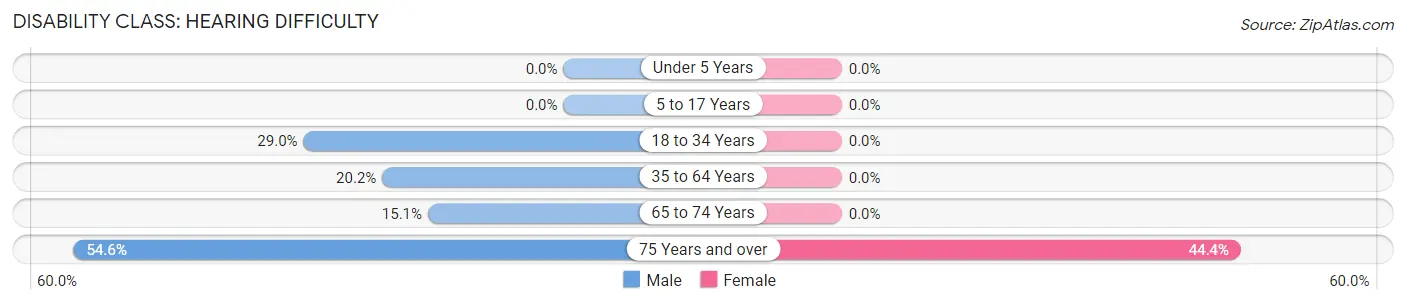
| Age Bracket | Male | Female |
| Under 5 Years | 0 (0.0%) | 0 (0.0%) |
| 5 to 17 Years | 0 (0.0%) | 0 (0.0%) |
| 18 to 34 Years | 11 (28.9%) | 0 (0.0%) |
| 35 to 64 Years | 44 (20.2%) | 0 (0.0%) |
| 65 to 74 Years | 8 (15.1%) | 0 (0.0%) |
| 75 Years and over | 12 (54.5%) | 12 (44.4%) |
Disability Class: Vision Difficulty
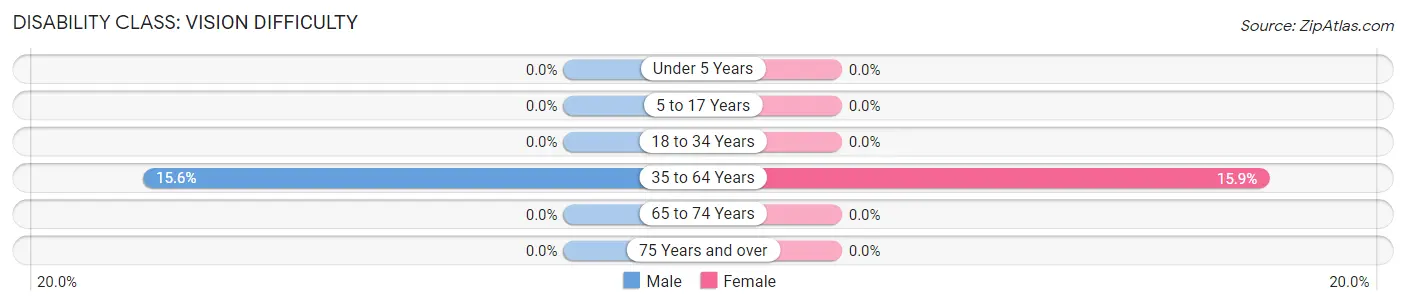
| Age Bracket | Male | Female |
| Under 5 Years | 0 (0.0%) | 0 (0.0%) |
| 5 to 17 Years | 0 (0.0%) | 0 (0.0%) |
| 18 to 34 Years | 0 (0.0%) | 0 (0.0%) |
| 35 to 64 Years | 34 (15.6%) | 23 (15.9%) |
| 65 to 74 Years | 0 (0.0%) | 0 (0.0%) |
| 75 Years and over | 0 (0.0%) | 0 (0.0%) |
Disability Class: Cognitive Difficulty
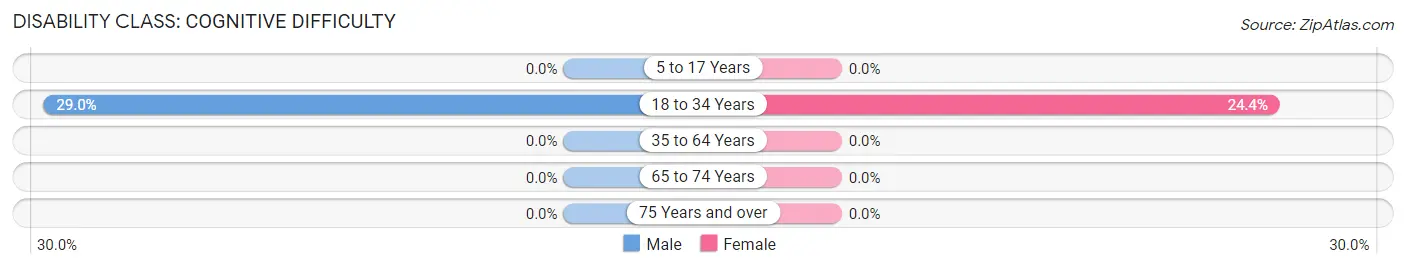
| Age Bracket | Male | Female |
| 5 to 17 Years | 0 (0.0%) | 0 (0.0%) |
| 18 to 34 Years | 11 (28.9%) | 10 (24.4%) |
| 35 to 64 Years | 0 (0.0%) | 0 (0.0%) |
| 65 to 74 Years | 0 (0.0%) | 0 (0.0%) |
| 75 Years and over | 0 (0.0%) | 0 (0.0%) |
Disability Class: Ambulatory Difficulty
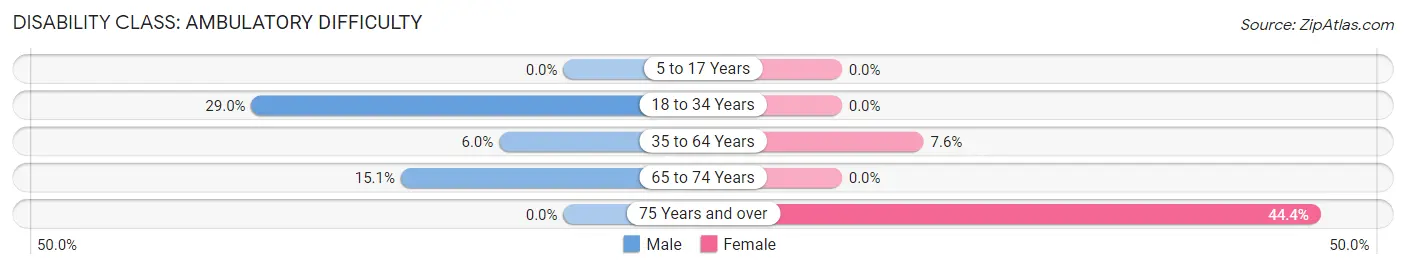
| Age Bracket | Male | Female |
| 5 to 17 Years | 0 (0.0%) | 0 (0.0%) |
| 18 to 34 Years | 11 (28.9%) | 0 (0.0%) |
| 35 to 64 Years | 13 (6.0%) | 11 (7.6%) |
| 65 to 74 Years | 8 (15.1%) | 0 (0.0%) |
| 75 Years and over | 0 (0.0%) | 12 (44.4%) |
Disability Class: Self-Care Difficulty
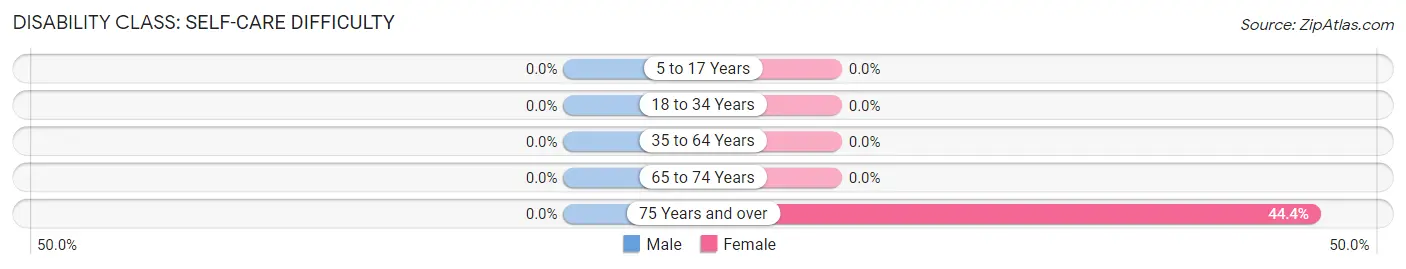
| Age Bracket | Male | Female |
| 5 to 17 Years | 0 (0.0%) | 0 (0.0%) |
| 18 to 34 Years | 0 (0.0%) | 0 (0.0%) |
| 35 to 64 Years | 0 (0.0%) | 0 (0.0%) |
| 65 to 74 Years | 0 (0.0%) | 0 (0.0%) |
| 75 Years and over | 0 (0.0%) | 12 (44.4%) |
Technology Access in Ennis
Computing Device Access in Ennis
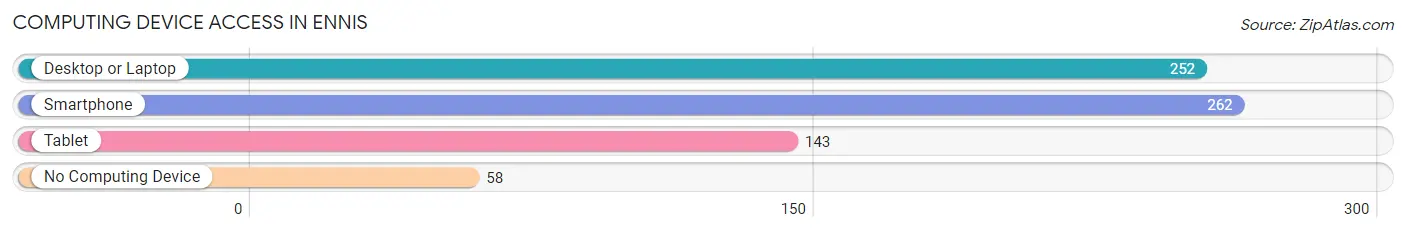
| Device Type | # Households | % Households |
| Desktop or Laptop | 252 | 72.4% |
| Smartphone | 262 | 75.3% |
| Tablet | 143 | 41.1% |
| No Computing Device | 58 | 16.7% |
| Total | 348 | 100.0% |
Internet Access in Ennis
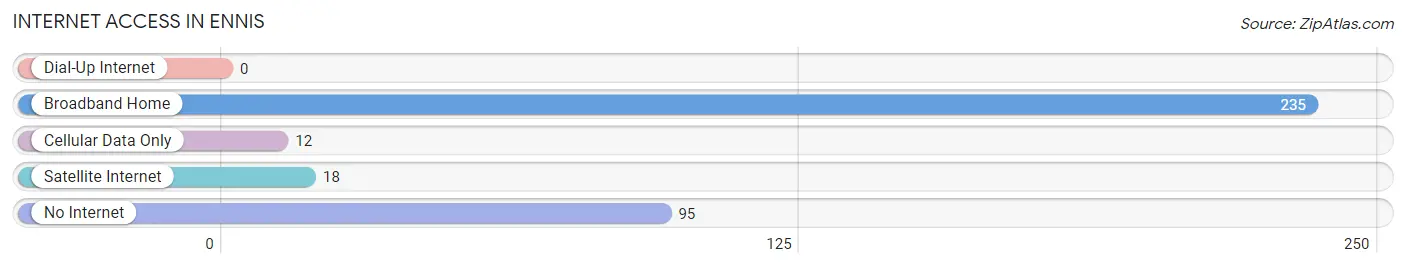
| Internet Type | # Households | % Households |
| Dial-Up Internet | 0 | 0.0% |
| Broadband Home | 235 | 67.5% |
| Cellular Data Only | 12 | 3.5% |
| Satellite Internet | 18 | 5.2% |
| No Internet | 95 | 27.3% |
| Total | 348 | 100.0% |
Ennis Summary
Ennis, Montana is a small town located in the Madison Valley of southwestern Montana. It is situated at the confluence of the Madison and Ruby Rivers, and is surrounded by the Tobacco Root Mountains and the Gravelly Range. The town has a population of 890 people, according to the 2010 census, and is the county seat of Madison County.
History
Ennis was founded in 1882 by the Northern Pacific Railroad. The town was named after Ennis, Ireland, and was originally a railroad stop. The town quickly grew, and by the early 1900s, it had become a bustling center of commerce and industry. The town was home to a number of businesses, including a sawmill, a flour mill, a creamery, a brewery, and a hotel.
In the early 1900s, Ennis was also a popular destination for tourists. The town was known for its fishing, hunting, and outdoor recreation opportunities. The Madison River, which runs through the town, was a popular destination for fly fishing.
Geography
Ennis is located in the Madison Valley of southwestern Montana. The town is situated at the confluence of the Madison and Ruby Rivers, and is surrounded by the Tobacco Root Mountains and the Gravelly Range. The town is located at an elevation of 4,890 feet, and has a total area of 1.2 square miles.
The climate in Ennis is semi-arid, with hot summers and cold winters. The average high temperature in the summer is 85 degrees Fahrenheit, and the average low temperature in the winter is 10 degrees Fahrenheit. The town receives an average of 16 inches of precipitation per year.
Economy
Ennis’s economy is largely based on tourism and agriculture. The town is a popular destination for fly fishing, hunting, and outdoor recreation. The Madison River, which runs through the town, is a popular destination for fly fishing.
Agriculture is also an important part of the local economy. The town is home to a number of farms, which produce hay, wheat, barley, and other crops. The town is also home to a number of cattle ranches.
Demographics
According to the 2010 census, Ennis has a population of 890 people. The town has a median age of 44.7 years, and a median household income of $41,250. The town is predominantly white, with 91.2% of the population identifying as white. The town also has a small Hispanic population, with 4.2% of the population identifying as Hispanic or Latino.
Conclusion
Ennis, Montana is a small town located in the Madison Valley of southwestern Montana. It is situated at the confluence of the Madison and Ruby Rivers, and is surrounded by the Tobacco Root Mountains and the Gravelly Range. The town has a population of 890 people, according to the 2010 census, and is the county seat of Madison County. The town’s economy is largely based on tourism and agriculture, and the town is a popular destination for fly fishing, hunting, and outdoor recreation. The town is predominantly white, with 91.2% of the population identifying as white.
Common Questions
What is Per Capita Income in Ennis?
Per Capita income in Ennis is $34,847.
What is the Median Family Income in Ennis?
Median Family Income in Ennis is $74,479.
What is the Median Household income in Ennis?
Median Household Income in Ennis is $59,500.
What is Income or Wage Gap in Ennis?
Income or Wage Gap in Ennis is 56.7%.
Women in Ennis earn 43.3 cents for every dollar earned by a man.
What is Inequality or Gini Index in Ennis?
Inequality or Gini Index in Ennis is 0.33.
What is the Total Population of Ennis?
Total Population of Ennis is 736.
What is the Total Male Population of Ennis?
Total Male Population of Ennis is 390.
What is the Total Female Population of Ennis?
Total Female Population of Ennis is 346.
What is the Ratio of Males per 100 Females in Ennis?
There are 112.72 Males per 100 Females in Ennis.
What is the Ratio of Females per 100 Males in Ennis?
There are 88.72 Females per 100 Males in Ennis.
What is the Median Population Age in Ennis?
Median Population Age in Ennis is 52.0 Years.
What is the Average Family Size in Ennis
Average Family Size in Ennis is 2.9 People.
What is the Average Household Size in Ennis
Average Household Size in Ennis is 2.0 People.
How Large is the Labor Force in Ennis?
There are 403 People in the Labor Forcein in Ennis.
What is the Percentage of People in the Labor Force in Ennis?
63.9% of People are in the Labor Force in Ennis.
What is the Unemployment Rate in Ennis?
Unemployment Rate in Ennis is 1.0%.