Ekalaka, MT Map & Demographics
Ekalaka Map
Ekalaka Overview
$28,104
PER CAPITA INCOME
$60,438
AVG FAMILY INCOME
$28,750
AVG HOUSEHOLD INCOME
15.1%
WAGE / INCOME GAP [ % ]
84.9¢/ $1
WAGE / INCOME GAP [ $ ]
0.41
INEQUALITY / GINI INDEX
372
TOTAL POPULATION
196
MALE POPULATION
176
FEMALE POPULATION
111.36
MALES / 100 FEMALES
89.80
FEMALES / 100 MALES
60.3
MEDIAN AGE
2.5
AVG FAMILY SIZE
1.6
AVG HOUSEHOLD SIZE
149
LABOR FORCE [ PEOPLE ]
45.7%
PERCENT IN LABOR FORCE
0.7%
UNEMPLOYMENT RATE
Ekalaka Zip Codes
Ekalaka Area Codes
Income in Ekalaka
Income Overview in Ekalaka
Per Capita Income in Ekalaka is $28,104, while median incomes of families and households are $60,438 and $28,750 respectively.
| Characteristic | Number | Measure |
| Per Capita Income | 372 | $28,104 |
| Median Family Income | 79 | $60,438 |
| Mean Family Income | 79 | $58,524 |
| Median Household Income | 216 | $28,750 |
| Mean Household Income | 216 | $45,911 |
| Income Deficit | 79 | $0 |
| Wage / Income Gap (%) | 372 | 15.10% |
| Wage / Income Gap ($) | 372 | 84.90¢ per $1 |
| Gini / Inequality Index | 372 | 0.41 |
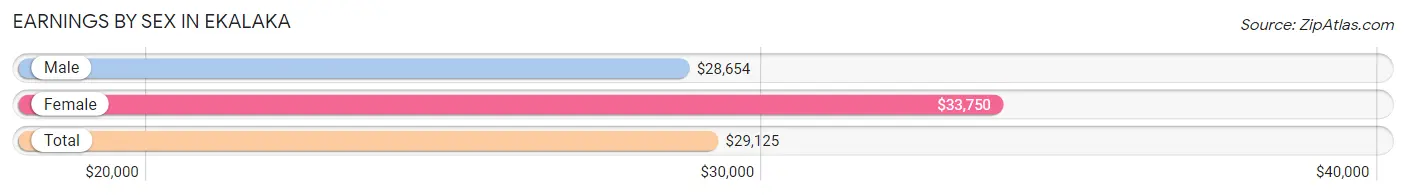
Earnings by Sex in Ekalaka
Average Earnings in Ekalaka are $29,125, $28,654 for men and $33,750 for women, a difference of 15.1%.
| Sex | Number | Average Earnings |
| Male | 88 (56.4%) | $28,654 |
| Female | 68 (43.6%) | $33,750 |
| Total | 156 (100.0%) | $29,125 |
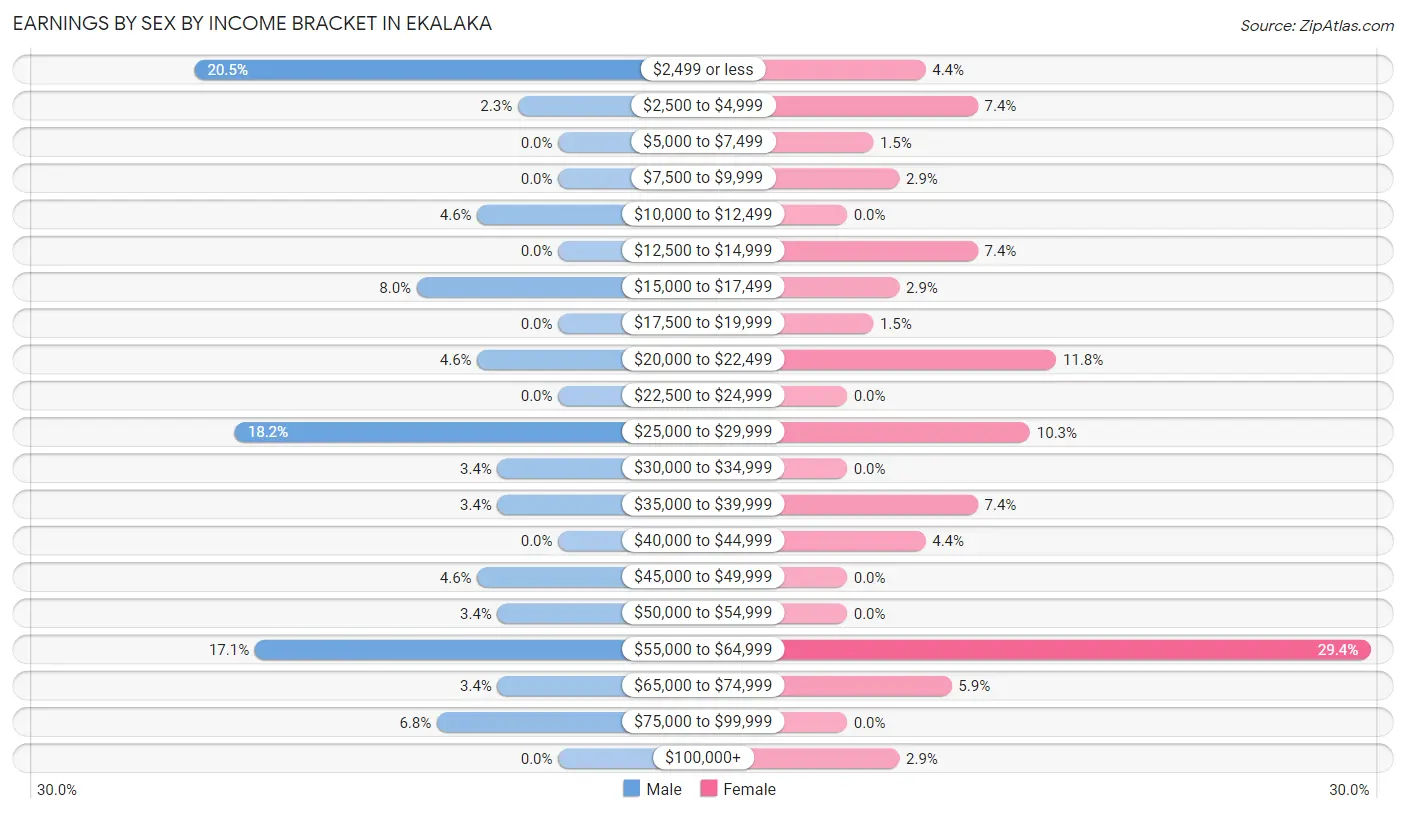
Earnings by Sex by Income Bracket in Ekalaka
The most common earnings brackets in Ekalaka are $2,499 or less for men (18 | 20.4%) and $55,000 to $64,999 for women (20 | 29.4%).
| Income | Male | Female |
| $2,499 or less | 18 (20.4%) | 3 (4.4%) |
| $2,500 to $4,999 | 2 (2.3%) | 5 (7.3%) |
| $5,000 to $7,499 | 0 (0.0%) | 1 (1.5%) |
| $7,500 to $9,999 | 0 (0.0%) | 2 (2.9%) |
| $10,000 to $12,499 | 4 (4.5%) | 0 (0.0%) |
| $12,500 to $14,999 | 0 (0.0%) | 5 (7.3%) |
| $15,000 to $17,499 | 7 (8.0%) | 2 (2.9%) |
| $17,500 to $19,999 | 0 (0.0%) | 1 (1.5%) |
| $20,000 to $22,499 | 4 (4.5%) | 8 (11.8%) |
| $22,500 to $24,999 | 0 (0.0%) | 0 (0.0%) |
| $25,000 to $29,999 | 16 (18.2%) | 7 (10.3%) |
| $30,000 to $34,999 | 3 (3.4%) | 0 (0.0%) |
| $35,000 to $39,999 | 3 (3.4%) | 5 (7.3%) |
| $40,000 to $44,999 | 0 (0.0%) | 3 (4.4%) |
| $45,000 to $49,999 | 4 (4.5%) | 0 (0.0%) |
| $50,000 to $54,999 | 3 (3.4%) | 0 (0.0%) |
| $55,000 to $64,999 | 15 (17.1%) | 20 (29.4%) |
| $65,000 to $74,999 | 3 (3.4%) | 4 (5.9%) |
| $75,000 to $99,999 | 6 (6.8%) | 0 (0.0%) |
| $100,000+ | 0 (0.0%) | 2 (2.9%) |
| Total | 88 (100.0%) | 68 (100.0%) |
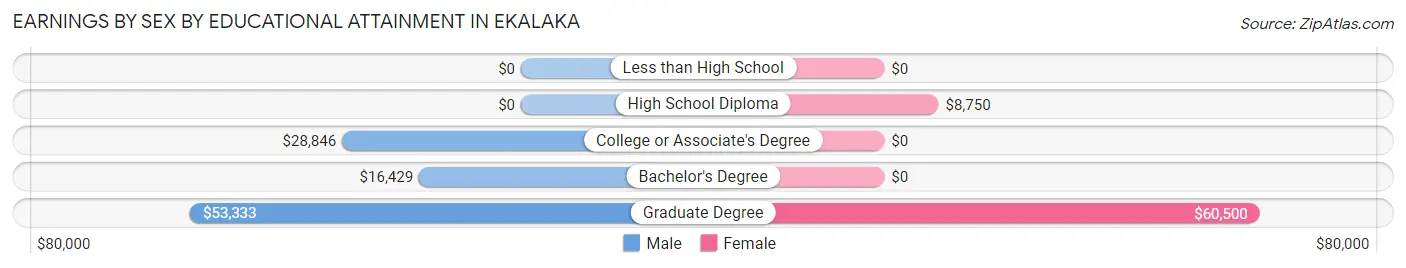
Earnings by Sex by Educational Attainment in Ekalaka
Average earnings in Ekalaka are $28,462 for men and $38,000 for women, a difference of 25.1%. Men with an educational attainment of graduate degree enjoy the highest average annual earnings of $53,333, while those with bachelor's degree education earn the least with $16,429. Women with an educational attainment of graduate degree earn the most with the average annual earnings of $60,500, while those with high school diploma education have the smallest earnings of $8,750.
| Educational Attainment | Male Income | Female Income |
| Less than High School | - | - |
| High School Diploma | - | - |
| College or Associate's Degree | $28,846 | $0 |
| Bachelor's Degree | $16,429 | $0 |
| Graduate Degree | $53,333 | $60,500 |
| Total | $28,462 | $38,000 |
Family Income in Ekalaka
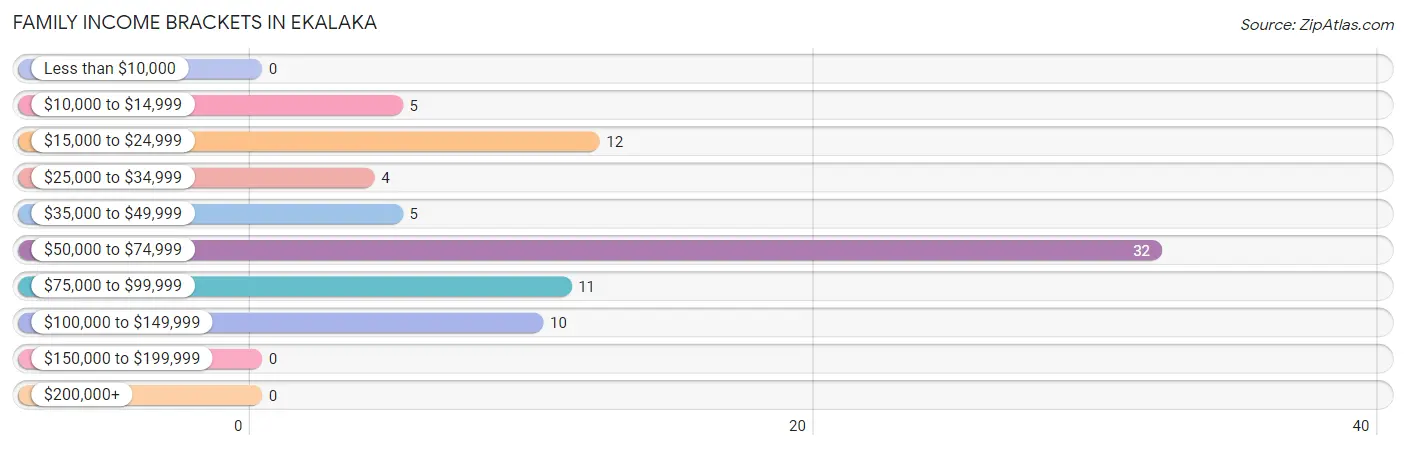
Family Income Brackets in Ekalaka
According to the Ekalaka family income data, there are 32 families falling into the $50,000 to $74,999 income range, which is the most common income bracket and makes up 40.5% of all families.
| Income Bracket | # Families | % Families |
| Less than $10,000 | 0 | 0.0% |
| $10,000 to $14,999 | 5 | 6.3% |
| $15,000 to $24,999 | 12 | 15.2% |
| $25,000 to $34,999 | 4 | 5.1% |
| $35,000 to $49,999 | 5 | 6.3% |
| $50,000 to $74,999 | 32 | 40.5% |
| $75,000 to $99,999 | 11 | 13.9% |
| $100,000 to $149,999 | 10 | 12.7% |
| $150,000 to $199,999 | 0 | 0.0% |
| $200,000+ | 0 | 0.0% |
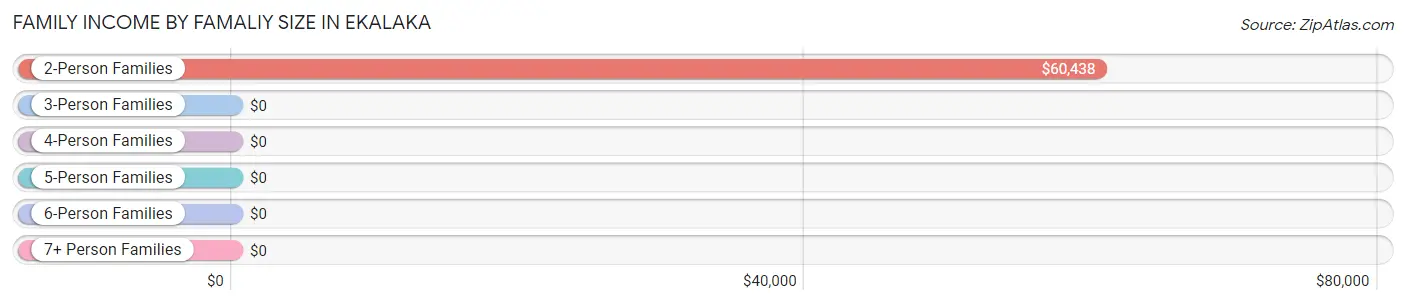
Family Income by Famaliy Size in Ekalaka
2-person families (73 | 92.4%) account for the highest median family income in Ekalaka with $60,438 per family, while 2-person families (73 | 92.4%) have the highest median income of $30,219 per family member.
| Income Bracket | # Families | Median Income |
| 2-Person Families | 73 (92.4%) | $60,438 |
| 3-Person Families | 2 (2.5%) | $0 |
| 4-Person Families | 0 (0.0%) | $0 |
| 5-Person Families | 4 (5.1%) | $0 |
| 6-Person Families | 0 (0.0%) | $0 |
| 7+ Person Families | 0 (0.0%) | $0 |
| Total | 79 (100.0%) | $60,438 |
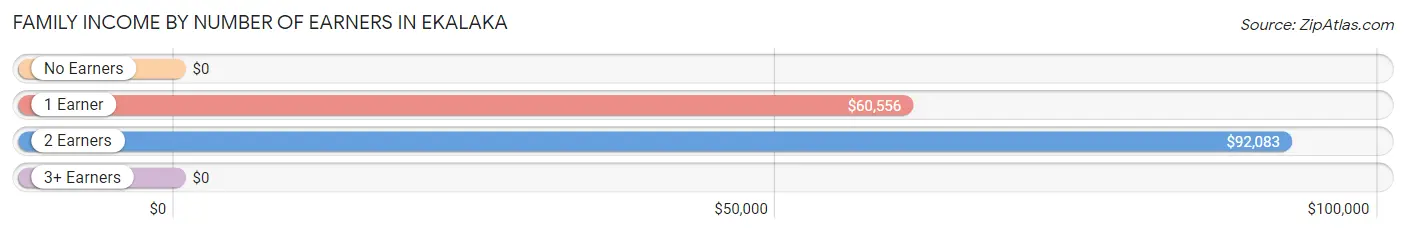
Family Income by Number of Earners in Ekalaka
| Number of Earners | # Families | Median Income |
| No Earners | 24 (30.4%) | $0 |
| 1 Earner | 38 (48.1%) | $60,556 |
| 2 Earners | 17 (21.5%) | $92,083 |
| 3+ Earners | 0 (0.0%) | $0 |
| Total | 79 (100.0%) | $60,438 |
Household Income in Ekalaka
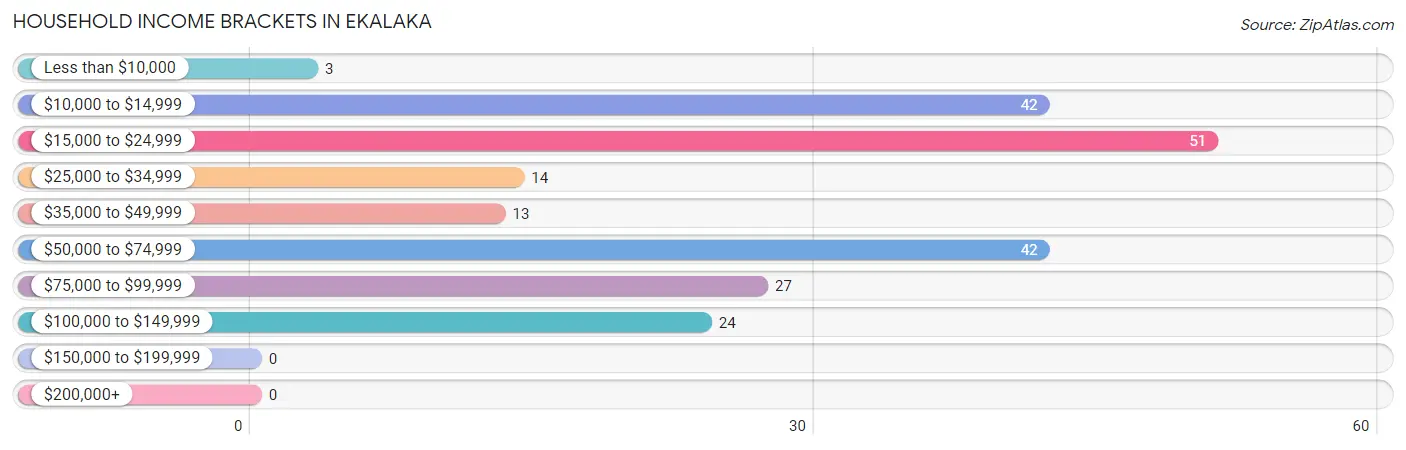
Household Income Brackets in Ekalaka
With 51 households falling in the category, the $15,000 to $24,999 income range is the most frequent in Ekalaka, accounting for 23.6% of all households.
| Income Bracket | # Households | % Households |
| Less than $10,000 | 3 | 1.4% |
| $10,000 to $14,999 | 42 | 19.4% |
| $15,000 to $24,999 | 51 | 23.6% |
| $25,000 to $34,999 | 14 | 6.5% |
| $35,000 to $49,999 | 13 | 6.0% |
| $50,000 to $74,999 | 42 | 19.4% |
| $75,000 to $99,999 | 27 | 12.5% |
| $100,000 to $149,999 | 24 | 11.1% |
| $150,000 to $199,999 | 0 | 0.0% |
| $200,000+ | 0 | 0.0% |
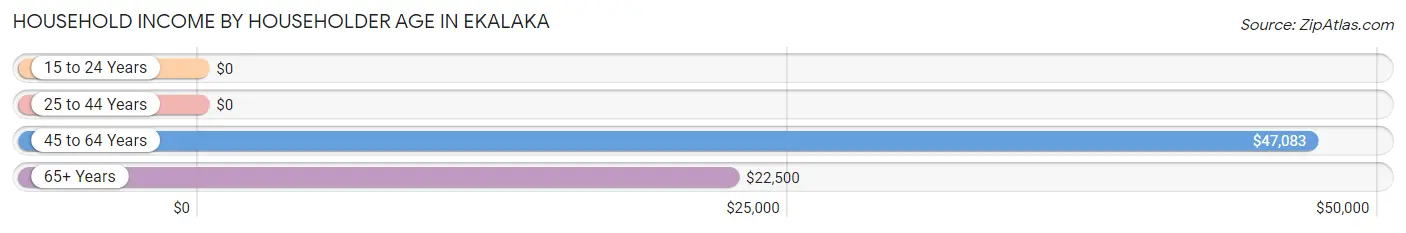
Household Income by Householder Age in Ekalaka
The median household income in Ekalaka is $28,750, with the highest median household income of $47,083 found in the 45 to 64 years age bracket for the primary householder. A total of 55 households (25.5%) fall into this category. Meanwhile, the 15 to 24 years age bracket for the primary householder has the lowest median household income of $0, with 12 households (5.6%) in this group.
| Income Bracket | # Households | Median Income |
| 15 to 24 Years | 12 (5.6%) | $0 |
| 25 to 44 Years | 53 (24.5%) | $0 |
| 45 to 64 Years | 55 (25.5%) | $47,083 |
| 65+ Years | 96 (44.4%) | $22,500 |
| Total | 216 (100.0%) | $28,750 |
Poverty in Ekalaka
Income Below Poverty by Sex and Age in Ekalaka
With 21.5% poverty level for males and 24.8% for females among the residents of Ekalaka, 65 to 74 year old males and 18 to 24 year old females are the most vulnerable to poverty, with 14 males (53.8%) and 2 females (100.0%) in their respective age groups living below the poverty level.
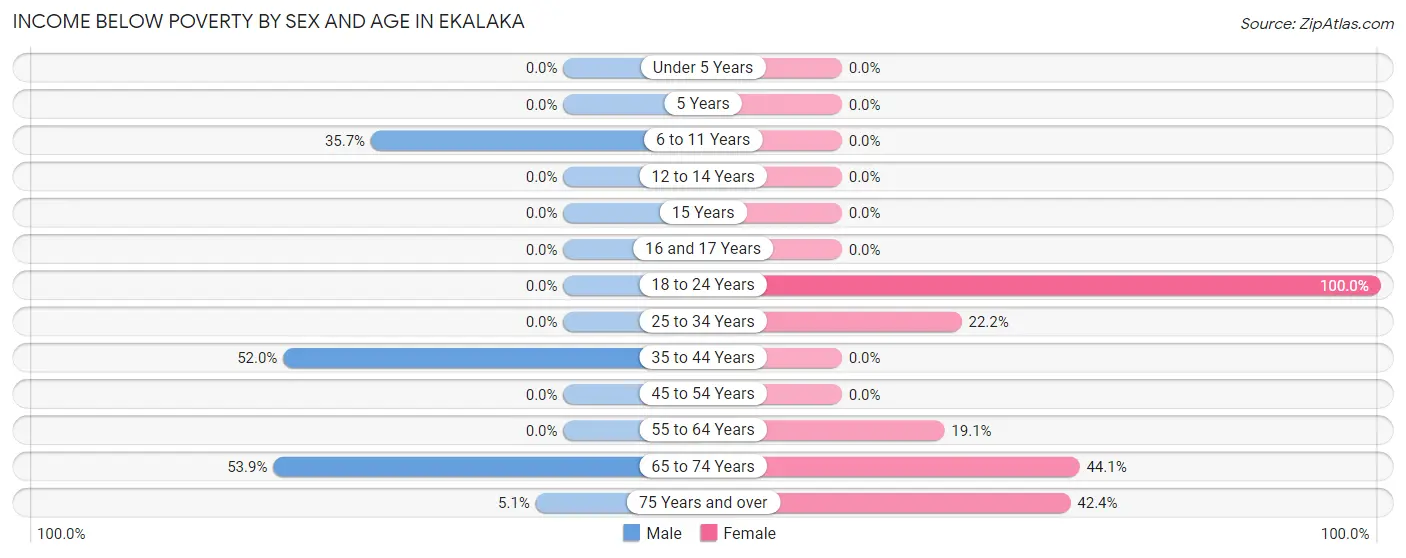
| Age Bracket | Male | Female |
| Under 5 Years | 0 (0.0%) | 0 (0.0%) |
| 5 Years | 0 (0.0%) | 0 (0.0%) |
| 6 to 11 Years | 10 (35.7%) | 0 (0.0%) |
| 12 to 14 Years | 0 (0.0%) | 0 (0.0%) |
| 15 Years | 0 (0.0%) | 0 (0.0%) |
| 16 and 17 Years | 0 (0.0%) | 0 (0.0%) |
| 18 to 24 Years | 0 (0.0%) | 2 (100.0%) |
| 25 to 34 Years | 0 (0.0%) | 2 (22.2%) |
| 35 to 44 Years | 13 (52.0%) | 0 (0.0%) |
| 45 to 54 Years | 0 (0.0%) | 0 (0.0%) |
| 55 to 64 Years | 0 (0.0%) | 8 (19.1%) |
| 65 to 74 Years | 14 (53.8%) | 15 (44.1%) |
| 75 Years and over | 2 (5.1%) | 14 (42.4%) |
| Total | 39 (21.5%) | 41 (24.8%) |
Income Above Poverty by Sex and Age in Ekalaka
According to the poverty statistics in Ekalaka, males aged under 5 years and females aged under 5 years are the age groups that are most secure financially, with 100.0% of males and 100.0% of females in these age groups living above the poverty line.
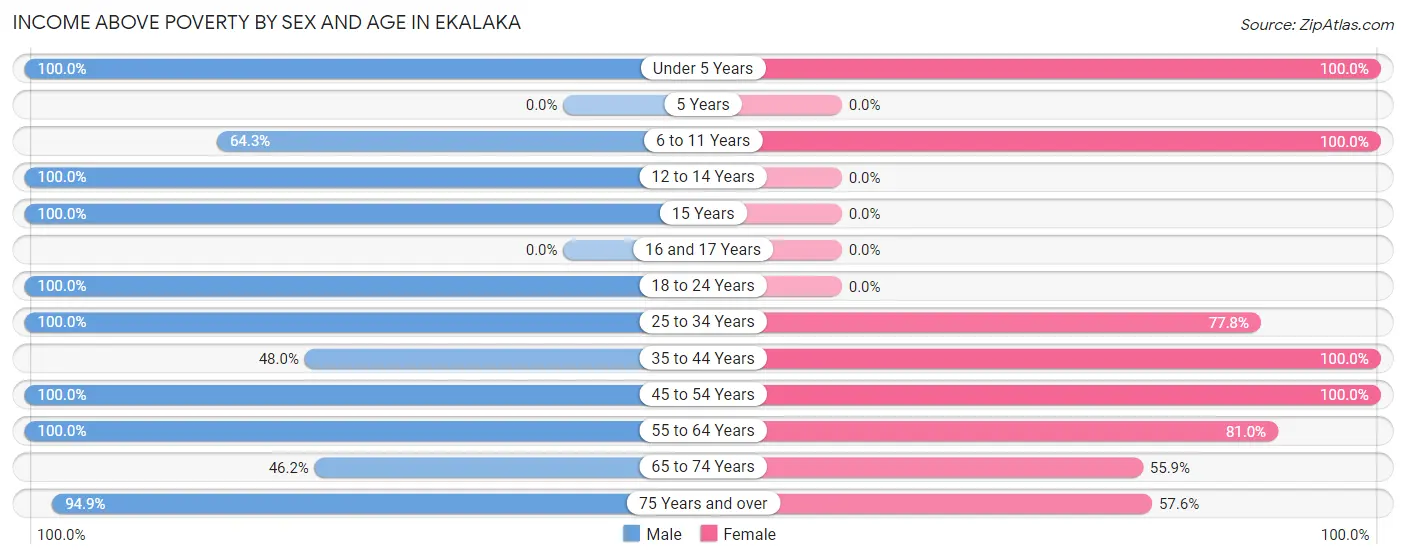
| Age Bracket | Male | Female |
| Under 5 Years | 1 (100.0%) | 5 (100.0%) |
| 5 Years | 0 (0.0%) | 0 (0.0%) |
| 6 to 11 Years | 18 (64.3%) | 5 (100.0%) |
| 12 to 14 Years | 5 (100.0%) | 0 (0.0%) |
| 15 Years | 2 (100.0%) | 0 (0.0%) |
| 16 and 17 Years | 0 (0.0%) | 0 (0.0%) |
| 18 to 24 Years | 10 (100.0%) | 0 (0.0%) |
| 25 to 34 Years | 7 (100.0%) | 7 (77.8%) |
| 35 to 44 Years | 12 (48.0%) | 21 (100.0%) |
| 45 to 54 Years | 4 (100.0%) | 14 (100.0%) |
| 55 to 64 Years | 34 (100.0%) | 34 (80.9%) |
| 65 to 74 Years | 12 (46.2%) | 19 (55.9%) |
| 75 Years and over | 37 (94.9%) | 19 (57.6%) |
| Total | 142 (78.4%) | 124 (75.1%) |
Income Below Poverty Among Married-Couple Families in Ekalaka
The poverty statistics for married-couple families in Ekalaka show that 24.5% or 13 of the total 53 families live below the poverty line. Families with no children have the highest poverty rate of 26.5%, comprising of 13 families. On the other hand, families with 3 or 4 children have the lowest poverty rate of 0.0%, which includes 0 families.
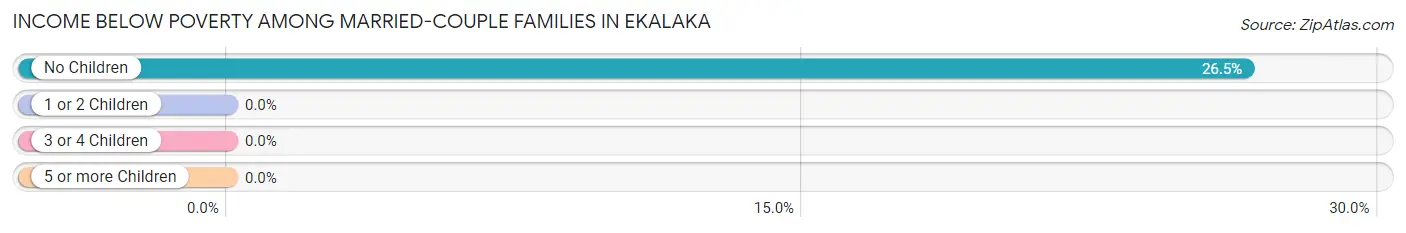
| Children | Above Poverty | Below Poverty |
| No Children | 36 (73.5%) | 13 (26.5%) |
| 1 or 2 Children | 0 (0.0%) | 0 (0.0%) |
| 3 or 4 Children | 4 (100.0%) | 0 (0.0%) |
| 5 or more Children | 0 (0.0%) | 0 (0.0%) |
| Total | 40 (75.5%) | 13 (24.5%) |
Income Below Poverty Among Single-Parent Households in Ekalaka
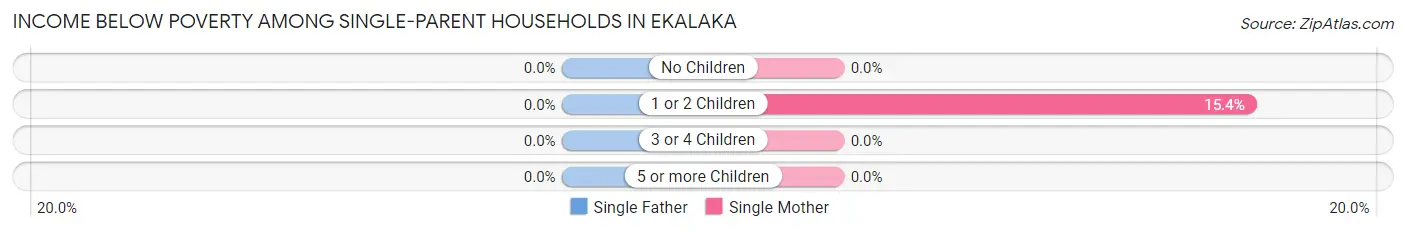
| Children | Single Father | Single Mother |
| No Children | 0 (0.0%) | 0 (0.0%) |
| 1 or 2 Children | 0 (0.0%) | 2 (15.4%) |
| 3 or 4 Children | 0 (0.0%) | 0 (0.0%) |
| 5 or more Children | 0 (0.0%) | 0 (0.0%) |
| Total | 0 (0.0%) | 2 (15.4%) |
Income Below Poverty Among Married-Couple vs Single-Parent Households in Ekalaka
The poverty data for Ekalaka shows that 13 of the married-couple family households (24.5%) and 2 of the single-parent households (7.7%) are living below the poverty level. Within the married-couple family households, those with no children have the highest poverty rate, with 13 households (26.5%) falling below the poverty line. Among the single-parent households, those with 1 or 2 children have the highest poverty rate, with 2 household (15.4%) living below poverty.
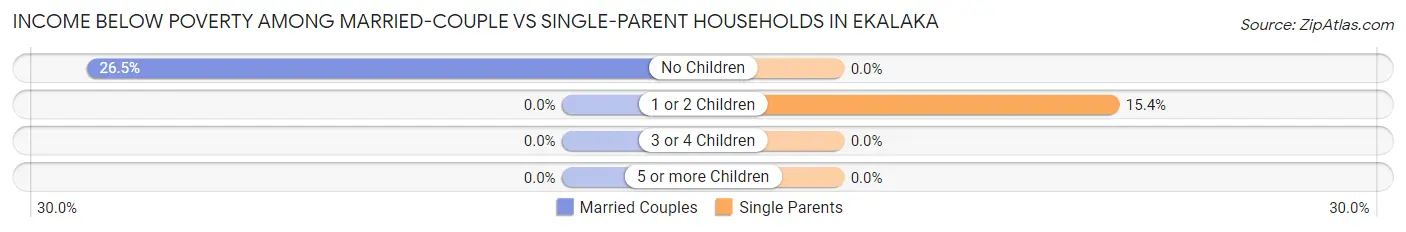
| Children | Married-Couple Families | Single-Parent Households |
| No Children | 13 (26.5%) | 0 (0.0%) |
| 1 or 2 Children | 0 (0.0%) | 2 (15.4%) |
| 3 or 4 Children | 0 (0.0%) | 0 (0.0%) |
| 5 or more Children | 0 (0.0%) | 0 (0.0%) |
| Total | 13 (24.5%) | 2 (7.7%) |
Race in Ekalaka
The most populous races in Ekalaka are White / Caucasian (335 | 90.0%), Two or more Races (24 | 6.5%), and Native / Alaskan (13 | 3.5%).
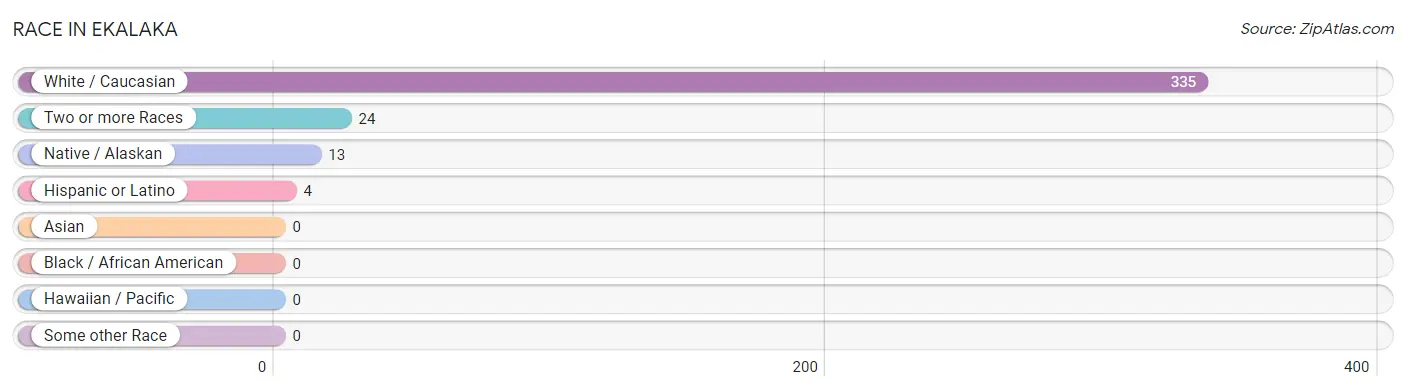
| Race | # Population | % Population |
| Asian | 0 | 0.0% |
| Black / African American | 0 | 0.0% |
| Hawaiian / Pacific | 0 | 0.0% |
| Hispanic or Latino | 4 | 1.1% |
| Native / Alaskan | 13 | 3.5% |
| White / Caucasian | 335 | 90.0% |
| Two or more Races | 24 | 6.5% |
| Some other Race | 0 | 0.0% |
| Total | 372 | 100.0% |
Ancestry in Ekalaka
The most populous ancestries reported in Ekalaka are German (133 | 35.7%), Irish (62 | 16.7%), Norwegian (56 | 15.0%), Sioux (37 | 10.0%), and English (35 | 9.4%), together accounting for 86.8% of all Ekalaka residents.
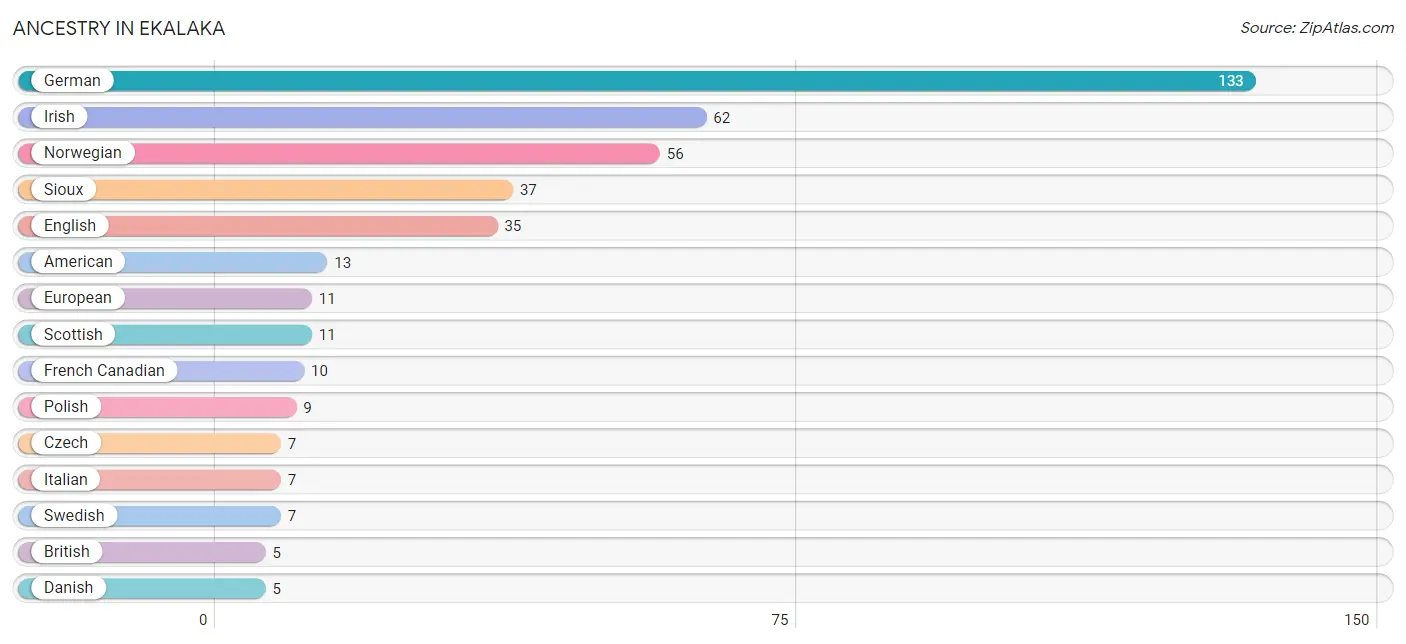
| Ancestry | # Population | % Population |
| American | 13 | 3.5% |
| Austrian | 2 | 0.5% |
| British | 5 | 1.3% |
| Czech | 7 | 1.9% |
| Danish | 5 | 1.3% |
| Dutch | 3 | 0.8% |
| English | 35 | 9.4% |
| European | 11 | 3.0% |
| French | 2 | 0.5% |
| French Canadian | 10 | 2.7% |
| German | 133 | 35.7% |
| Irish | 62 | 16.7% |
| Italian | 7 | 1.9% |
| Mexican | 4 | 1.1% |
| Norwegian | 56 | 15.0% |
| Polish | 9 | 2.4% |
| Scandinavian | 3 | 0.8% |
| Scotch-Irish | 2 | 0.5% |
| Scottish | 11 | 3.0% |
| Sioux | 37 | 10.0% |
| Swedish | 7 | 1.9% | View All 21 Rows |
Immigrants in Ekalaka
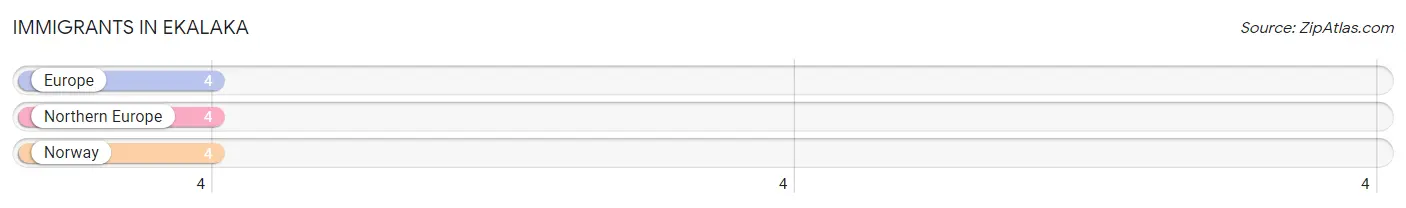
The most numerous immigrant groups reported in Ekalaka came from Europe (4 | 1.1%), Northern Europe (4 | 1.1%), and Norway (4 | 1.1%), together accounting for 3.2% of all Ekalaka residents.
| Immigration Origin | # Population | % Population |
| Europe | 4 | 1.1% |
| Northern Europe | 4 | 1.1% |
| Norway | 4 | 1.1% | View All 3 Rows |
Sex and Age in Ekalaka
Sex and Age in Ekalaka
The most populous age groups in Ekalaka are 75 to 79 Years (31 | 15.8%) for men and 55 to 59 Years (30 | 17.1%) for women.
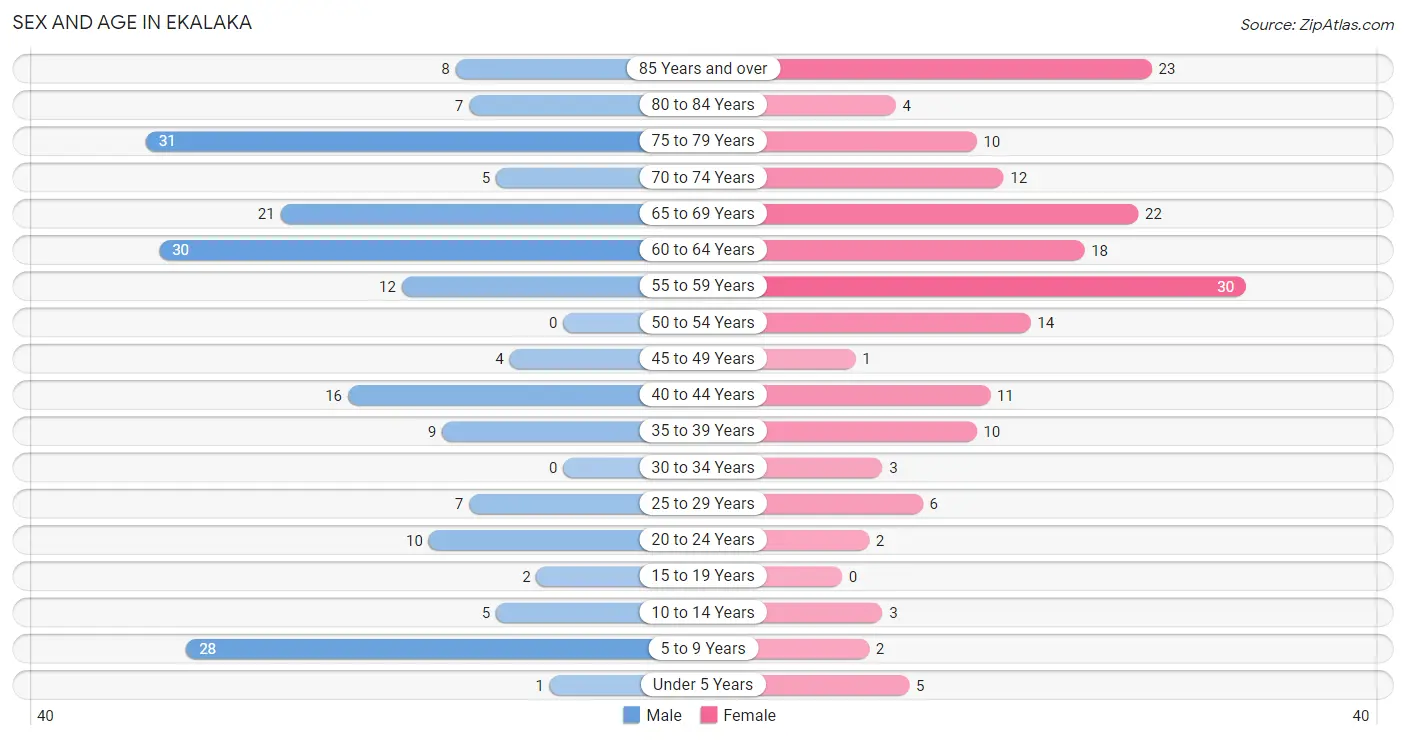
| Age Bracket | Male | Female |
| Under 5 Years | 1 (0.5%) | 5 (2.8%) |
| 5 to 9 Years | 28 (14.3%) | 2 (1.1%) |
| 10 to 14 Years | 5 (2.5%) | 3 (1.7%) |
| 15 to 19 Years | 2 (1.0%) | 0 (0.0%) |
| 20 to 24 Years | 10 (5.1%) | 2 (1.1%) |
| 25 to 29 Years | 7 (3.6%) | 6 (3.4%) |
| 30 to 34 Years | 0 (0.0%) | 3 (1.7%) |
| 35 to 39 Years | 9 (4.6%) | 10 (5.7%) |
| 40 to 44 Years | 16 (8.2%) | 11 (6.2%) |
| 45 to 49 Years | 4 (2.0%) | 1 (0.6%) |
| 50 to 54 Years | 0 (0.0%) | 14 (8.0%) |
| 55 to 59 Years | 12 (6.1%) | 30 (17.1%) |
| 60 to 64 Years | 30 (15.3%) | 18 (10.2%) |
| 65 to 69 Years | 21 (10.7%) | 22 (12.5%) |
| 70 to 74 Years | 5 (2.5%) | 12 (6.8%) |
| 75 to 79 Years | 31 (15.8%) | 10 (5.7%) |
| 80 to 84 Years | 7 (3.6%) | 4 (2.3%) |
| 85 Years and over | 8 (4.1%) | 23 (13.1%) |
| Total | 196 (100.0%) | 176 (100.0%) |
Families and Households in Ekalaka
Median Family Size in Ekalaka
The median family size in Ekalaka is 2.54 persons per family, with single female/mother families (13 | 16.5%) accounting for the largest median family size of 3.23 persons per family. On the other hand, single male/father families (13 | 16.5%) represent the smallest median family size with 2.31 persons per family.
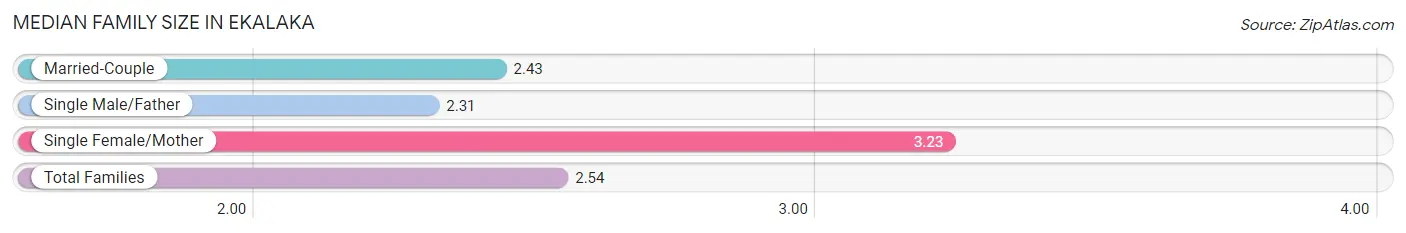
| Family Type | # Families | Family Size |
| Married-Couple | 53 (67.1%) | 2.43 |
| Single Male/Father | 13 (16.5%) | 2.31 |
| Single Female/Mother | 13 (16.5%) | 3.23 |
| Total Families | 79 (100.0%) | 2.54 |
Median Household Size in Ekalaka
The median household size in Ekalaka is 1.60 persons per household, with single female/mother households (13 | 6.0%) accounting for the largest median household size of 3.46 persons per household. non-family households (137 | 63.4%) represent the smallest median household size with 1.04 persons per household.
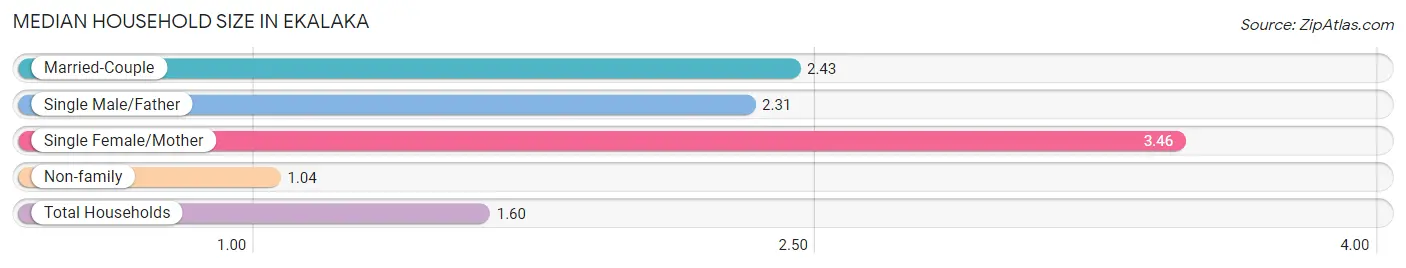
| Household Type | # Households | Household Size |
| Married-Couple | 53 (24.5%) | 2.43 |
| Single Male/Father | 13 (6.0%) | 2.31 |
| Single Female/Mother | 13 (6.0%) | 3.46 |
| Non-family | 137 (63.4%) | 1.04 |
| Total Households | 216 (100.0%) | 1.60 |
Household Size by Marriage Status in Ekalaka
Out of a total of 216 households in Ekalaka, 79 (36.6%) are family households, while 137 (63.4%) are nonfamily households. The most numerous type of family households are 2-person households, comprising 72, and the most common type of nonfamily households are 1-person households, comprising 126.
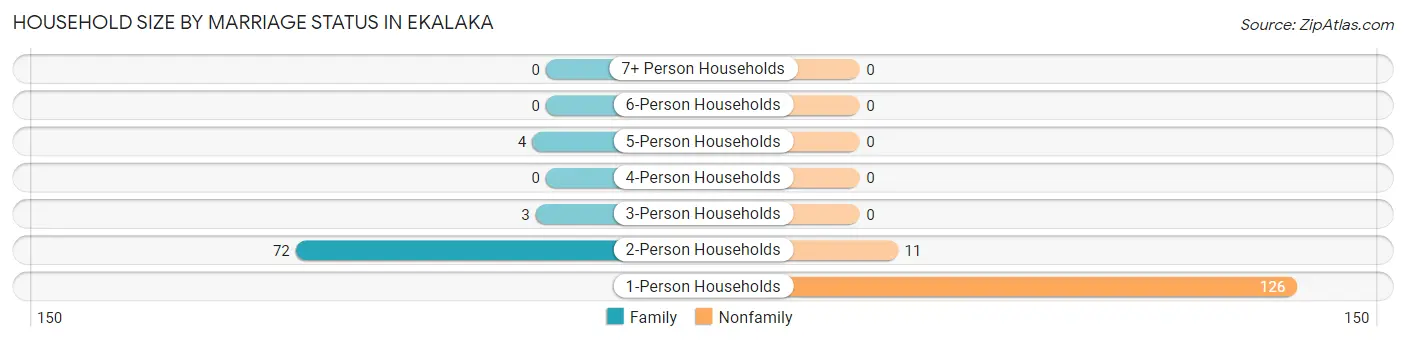
| Household Size | Family Households | Nonfamily Households |
| 1-Person Households | - | 126 (58.3%) |
| 2-Person Households | 72 (33.3%) | 11 (5.1%) |
| 3-Person Households | 3 (1.4%) | 0 (0.0%) |
| 4-Person Households | 0 (0.0%) | 0 (0.0%) |
| 5-Person Households | 4 (1.8%) | 0 (0.0%) |
| 6-Person Households | 0 (0.0%) | 0 (0.0%) |
| 7+ Person Households | 0 (0.0%) | 0 (0.0%) |
| Total | 79 (36.6%) | 137 (63.4%) |
Female Fertility in Ekalaka
Fertility by Age in Ekalaka
| Age Bracket | Women with Births | Births / 1,000 Women |
| 15 to 19 years | 0 (0.0%) | 0.0 |
| 20 to 34 years | 0 (0.0%) | 0.0 |
| 35 to 50 years | 0 (0.0%) | 0.0 |
| Total | 0 (0.0%) | 0.0 |
Fertility by Age by Marriage Status in Ekalaka
| Age Bracket | Married | Unmarried |
| 15 to 19 years | 0 (0.0%) | 0 (0.0%) |
| 20 to 34 years | 0 (0.0%) | 0 (0.0%) |
| 35 to 50 years | 0 (0.0%) | 0 (0.0%) |
| Total | 0 (0.0%) | 0 (0.0%) |
Fertility by Education in Ekalaka
| Educational Attainment | Women with Births | Births / 1,000 Women |
| Less than High School | 0 (0.0%) | 0.0 |
| High School Diploma | 0 (0.0%) | 0.0 |
| College or Associate's Degree | 0 (0.0%) | 0.0 |
| Bachelor's Degree | 0 (0.0%) | 0.0 |
| Graduate Degree | 0 (0.0%) | 0.0 |
| Total | 0 (0.0%) | 0.0 |
Fertility by Education by Marriage Status in Ekalaka
| Educational Attainment | Married | Unmarried |
| Less than High School | 0 (0.0%) | 0 (0.0%) |
| High School Diploma | 0 (0.0%) | 0 (0.0%) |
| College or Associate's Degree | 0 (0.0%) | 0 (0.0%) |
| Bachelor's Degree | 0 (0.0%) | 0 (0.0%) |
| Graduate Degree | 0 (0.0%) | 0 (0.0%) |
| Total | 0 (0.0%) | 0 (0.0%) |
Employment Characteristics in Ekalaka
Employment by Class of Employer in Ekalaka
Among the 146 employed individuals in Ekalaka, private company employees (65 | 44.5%), not-for-profit organizations (24 | 16.4%), and state government employees (21 | 14.4%) make up the most common classes of employment.
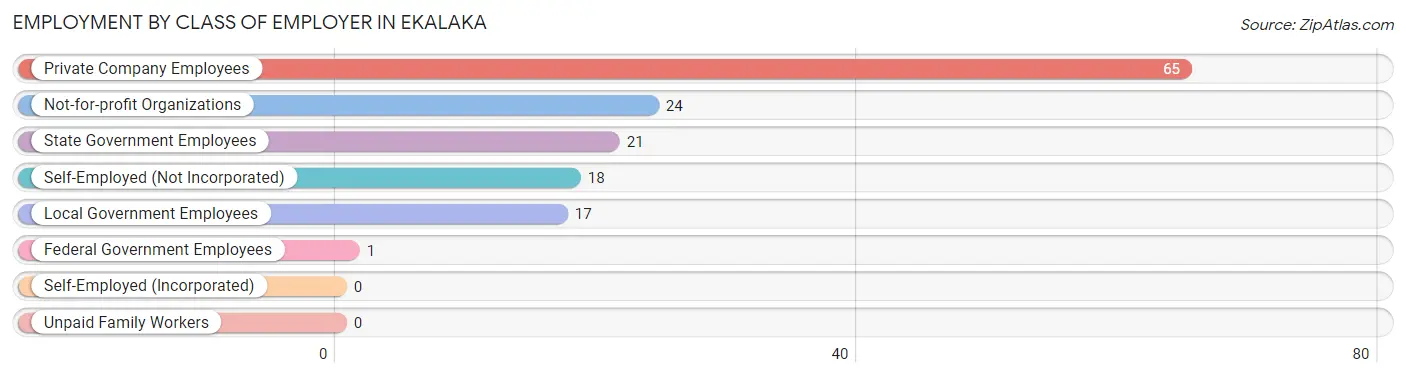
| Employer Class | # Employees | % Employees |
| Private Company Employees | 65 | 44.5% |
| Self-Employed (Incorporated) | 0 | 0.0% |
| Self-Employed (Not Incorporated) | 18 | 12.3% |
| Not-for-profit Organizations | 24 | 16.4% |
| Local Government Employees | 17 | 11.6% |
| State Government Employees | 21 | 14.4% |
| Federal Government Employees | 1 | 0.7% |
| Unpaid Family Workers | 0 | 0.0% |
| Total | 146 | 100.0% |
Employment Status by Age in Ekalaka
According to the labor force statistics for Ekalaka, out of the total population over 16 years of age (326), 45.7% or 149 individuals are in the labor force, with 0.7% or 1 of them unemployed. The age group with the highest labor force participation rate is 20 to 24 years, with 100.0% or 12 individuals in the labor force. Within the labor force, the 30 to 34 years age range has the highest percentage of unemployed individuals, with 33.3% or 1 of them being unemployed.
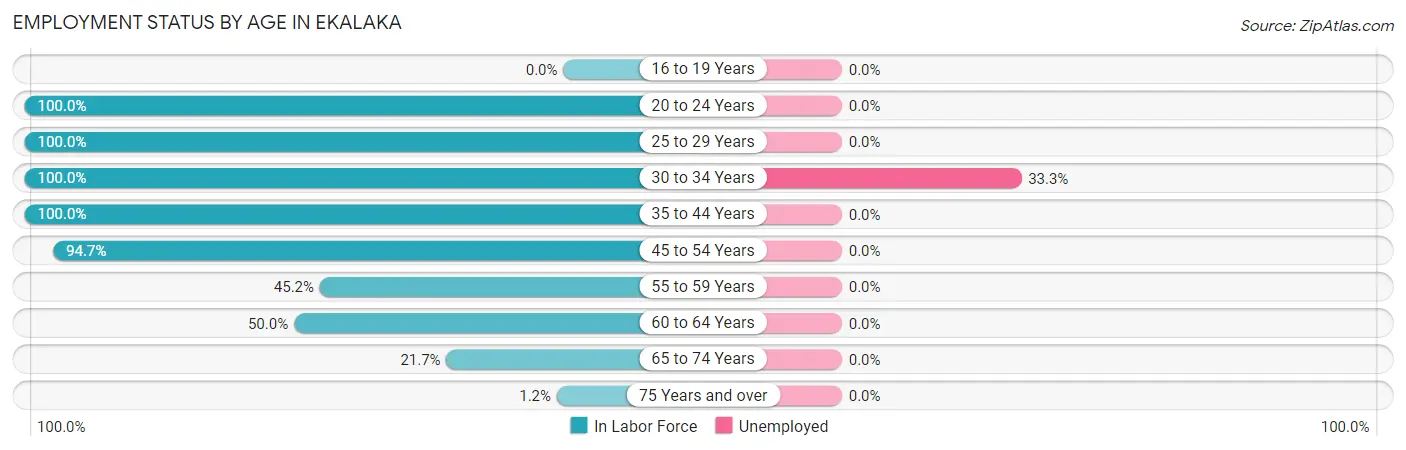
| Age Bracket | In Labor Force | Unemployed |
| 16 to 19 Years | 0 (0.0%) | 0 (0.0%) |
| 20 to 24 Years | 12 (100.0%) | 0 (0.0%) |
| 25 to 29 Years | 13 (100.0%) | 0 (0.0%) |
| 30 to 34 Years | 3 (100.0%) | 1 (33.3%) |
| 35 to 44 Years | 46 (100.0%) | 0 (0.0%) |
| 45 to 54 Years | 18 (94.7%) | 0 (0.0%) |
| 55 to 59 Years | 19 (45.2%) | 0 (0.0%) |
| 60 to 64 Years | 24 (50.0%) | 0 (0.0%) |
| 65 to 74 Years | 13 (21.7%) | 0 (0.0%) |
| 75 Years and over | 1 (1.2%) | 0 (0.0%) |
| Total | 149 (45.7%) | 1 (0.7%) |
Employment Status by Educational Attainment in Ekalaka
According to labor force statistics for Ekalaka, 71.9% of individuals (123) out of the total population between 25 and 64 years of age (171) are in the labor force, with 0.8% or 1 of them being unemployed. The group with the highest labor force participation rate are those with the educational attainment of bachelor's degree or higher, with 96.0% or 24 individuals in the labor force. Within the labor force, individuals with college / associate degree education have the highest percentage of unemployment, with 1.6% or 1 of them being unemployed.
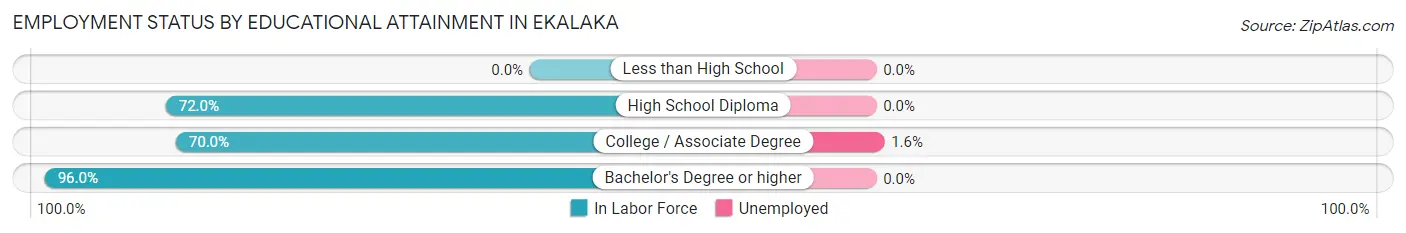
| Educational Attainment | In Labor Force | Unemployed |
| Less than High School | 0 (0.0%) | 0 (0.0%) |
| High School Diploma | 36 (72.0%) | 0 (0.0%) |
| College / Associate Degree | 63 (70.0%) | 1 (1.6%) |
| Bachelor's Degree or higher | 24 (96.0%) | 0 (0.0%) |
| Total | 123 (71.9%) | 1 (0.8%) |
Employment Occupations by Sex in Ekalaka
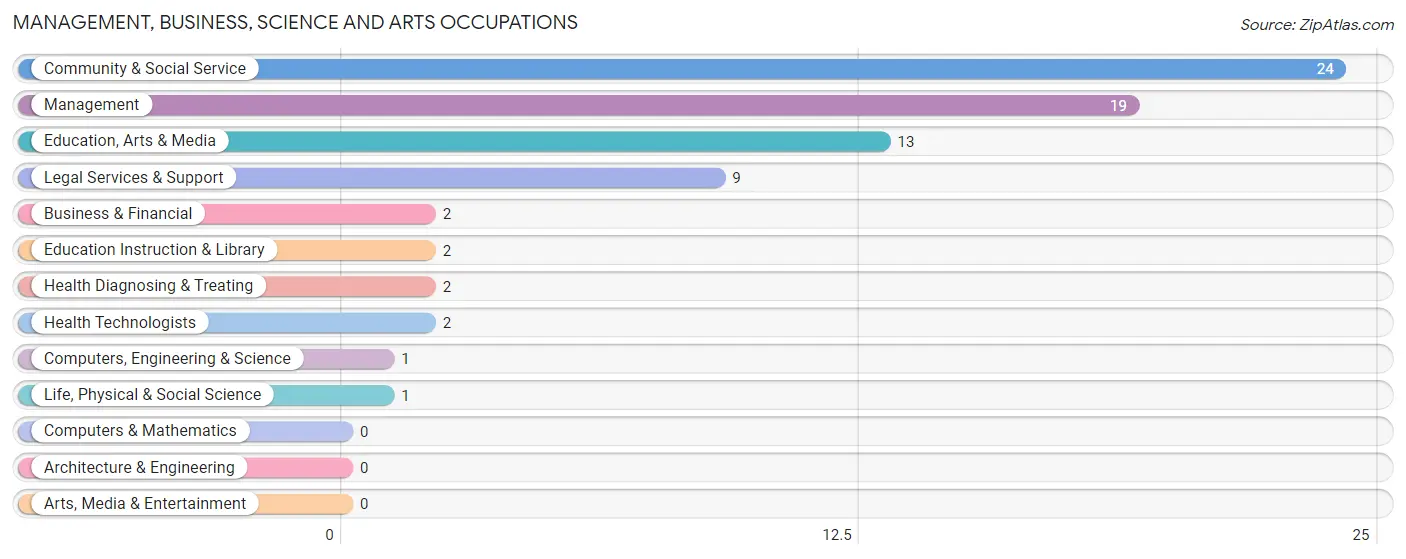
Management, Business, Science and Arts Occupations
The most common Management, Business, Science and Arts occupations in Ekalaka are Community & Social Service (24 | 16.2%), Management (19 | 12.8%), Education, Arts & Media (13 | 8.8%), Legal Services & Support (9 | 6.1%), and Business & Financial (2 | 1.3%).
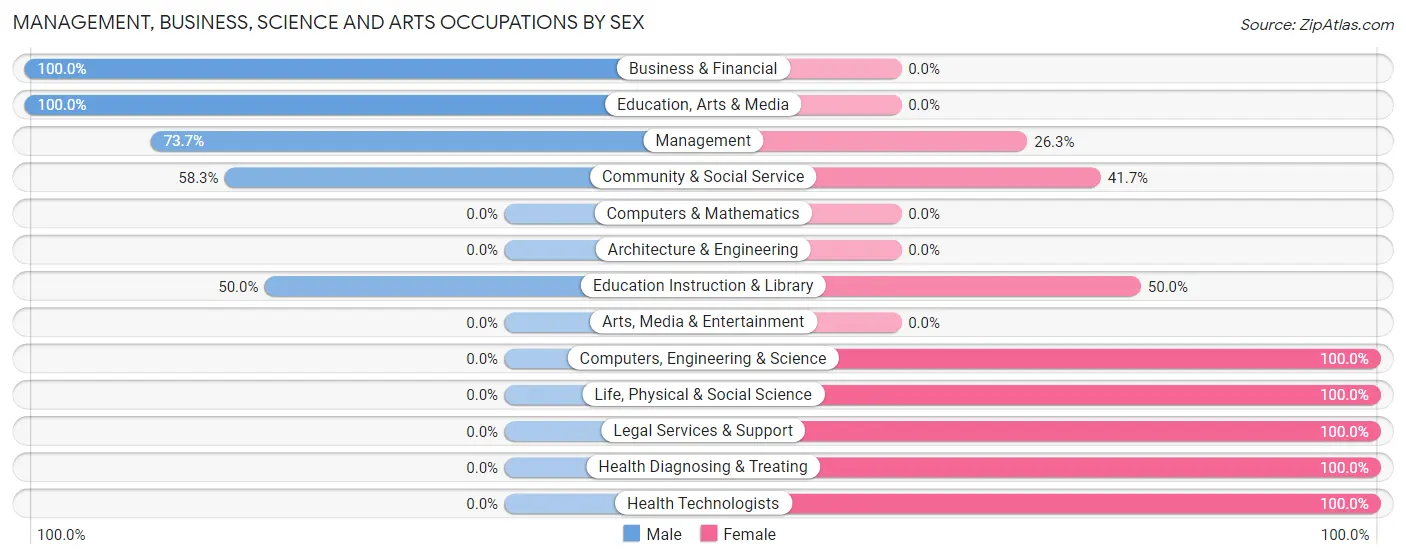
Management, Business, Science and Arts Occupations by Sex
Within the Management, Business, Science and Arts occupations in Ekalaka, the most male-oriented occupations are Business & Financial (100.0%), Education, Arts & Media (100.0%), and Management (73.7%), while the most female-oriented occupations are Computers, Engineering & Science (100.0%), Life, Physical & Social Science (100.0%), and Legal Services & Support (100.0%).
| Occupation | Male | Female |
| Management | 14 (73.7%) | 5 (26.3%) |
| Business & Financial | 2 (100.0%) | 0 (0.0%) |
| Computers, Engineering & Science | 0 (0.0%) | 1 (100.0%) |
| Computers & Mathematics | 0 (0.0%) | 0 (0.0%) |
| Architecture & Engineering | 0 (0.0%) | 0 (0.0%) |
| Life, Physical & Social Science | 0 (0.0%) | 1 (100.0%) |
| Community & Social Service | 14 (58.3%) | 10 (41.7%) |
| Education, Arts & Media | 13 (100.0%) | 0 (0.0%) |
| Legal Services & Support | 0 (0.0%) | 9 (100.0%) |
| Education Instruction & Library | 1 (50.0%) | 1 (50.0%) |
| Arts, Media & Entertainment | 0 (0.0%) | 0 (0.0%) |
| Health Diagnosing & Treating | 0 (0.0%) | 2 (100.0%) |
| Health Technologists | 0 (0.0%) | 2 (100.0%) |
| Total (Category) | 30 (62.5%) | 18 (37.5%) |
| Total (Overall) | 84 (56.8%) | 64 (43.2%) |
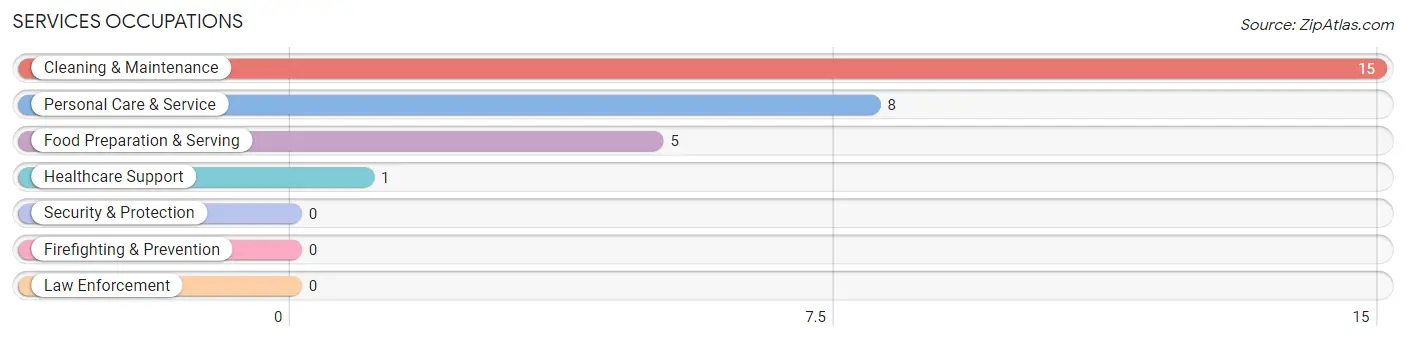
Services Occupations
The most common Services occupations in Ekalaka are Cleaning & Maintenance (15 | 10.1%), Personal Care & Service (8 | 5.4%), Food Preparation & Serving (5 | 3.4%), and Healthcare Support (1 | 0.7%).
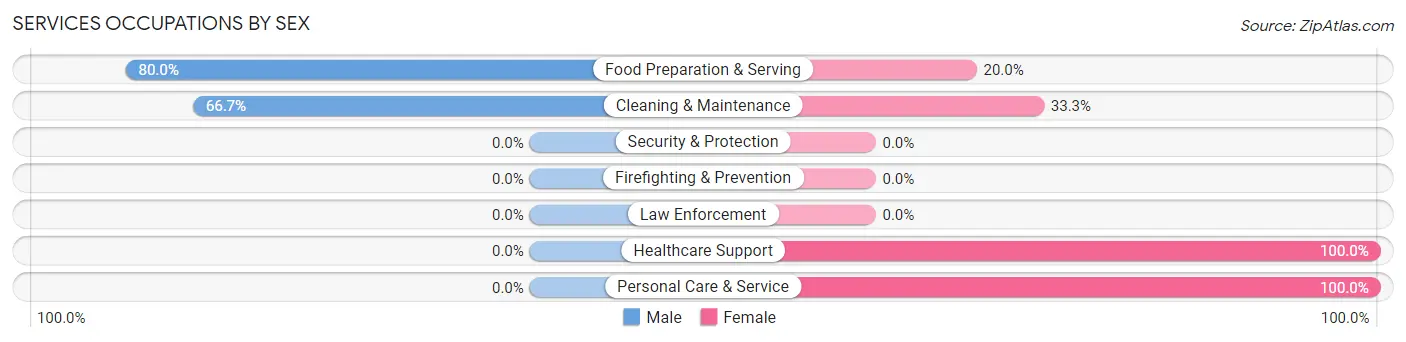
Services Occupations by Sex
Within the Services occupations in Ekalaka, the most male-oriented occupations are Food Preparation & Serving (80.0%), and Cleaning & Maintenance (66.7%), while the most female-oriented occupations are Healthcare Support (100.0%), Personal Care & Service (100.0%), and Cleaning & Maintenance (33.3%).
| Occupation | Male | Female |
| Healthcare Support | 0 (0.0%) | 1 (100.0%) |
| Security & Protection | 0 (0.0%) | 0 (0.0%) |
| Firefighting & Prevention | 0 (0.0%) | 0 (0.0%) |
| Law Enforcement | 0 (0.0%) | 0 (0.0%) |
| Food Preparation & Serving | 4 (80.0%) | 1 (20.0%) |
| Cleaning & Maintenance | 10 (66.7%) | 5 (33.3%) |
| Personal Care & Service | 0 (0.0%) | 8 (100.0%) |
| Total (Category) | 14 (48.3%) | 15 (51.7%) |
| Total (Overall) | 84 (56.8%) | 64 (43.2%) |
Sales and Office Occupations
The most common Sales and Office occupations in Ekalaka are Sales & Related (24 | 16.2%), and Office & Administration (22 | 14.9%).
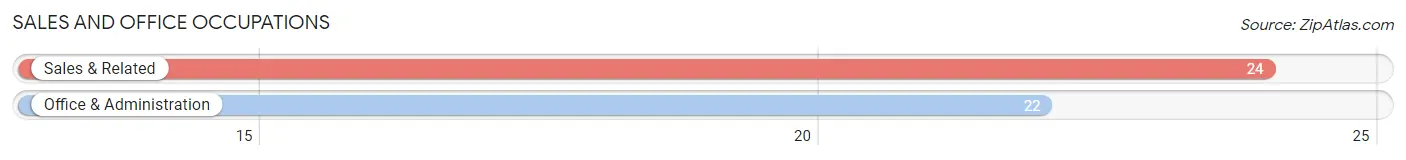
Sales and Office Occupations by Sex
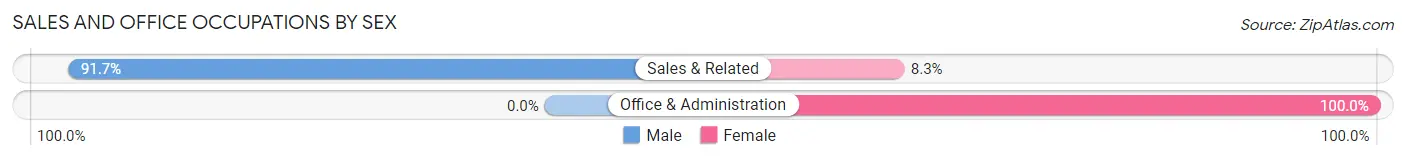
| Occupation | Male | Female |
| Sales & Related | 22 (91.7%) | 2 (8.3%) |
| Office & Administration | 0 (0.0%) | 22 (100.0%) |
| Total (Category) | 22 (47.8%) | 24 (52.2%) |
| Total (Overall) | 84 (56.8%) | 64 (43.2%) |
Natural Resources, Construction and Maintenance Occupations
The most common Natural Resources, Construction and Maintenance occupations in Ekalaka are Construction & Extraction (7 | 4.7%), Installation, Maintenance & Repair (6 | 4.1%), and Farming, Fishing & Forestry (5 | 3.4%).
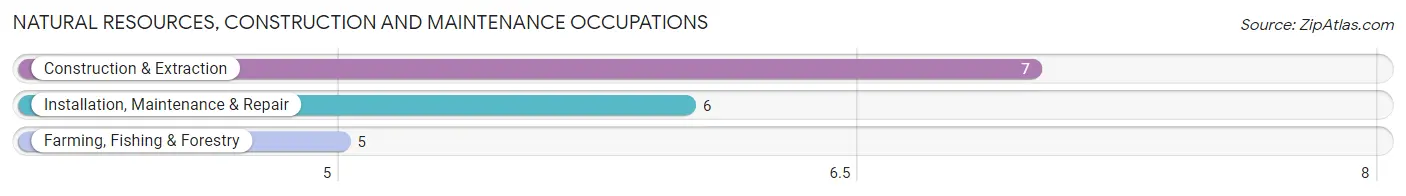
Natural Resources, Construction and Maintenance Occupations by Sex
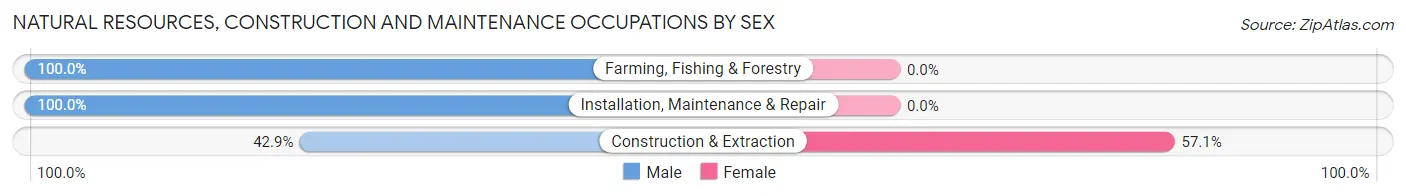
| Occupation | Male | Female |
| Farming, Fishing & Forestry | 5 (100.0%) | 0 (0.0%) |
| Construction & Extraction | 3 (42.9%) | 4 (57.1%) |
| Installation, Maintenance & Repair | 6 (100.0%) | 0 (0.0%) |
| Total (Category) | 14 (77.8%) | 4 (22.2%) |
| Total (Overall) | 84 (56.8%) | 64 (43.2%) |
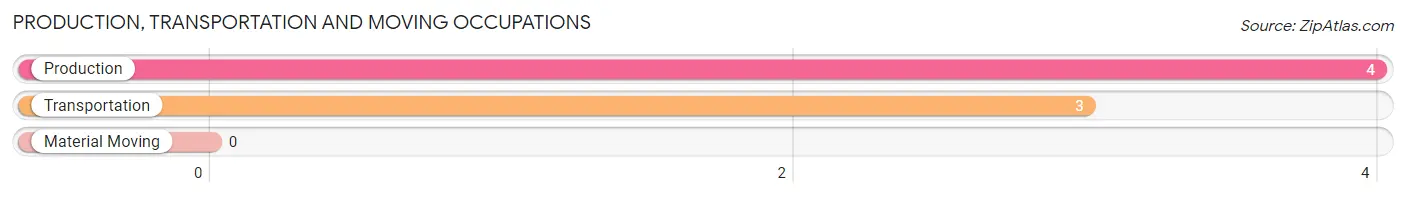
Production, Transportation and Moving Occupations
The most common Production, Transportation and Moving occupations in Ekalaka are Production (4 | 2.7%), and Transportation (3 | 2.0%).
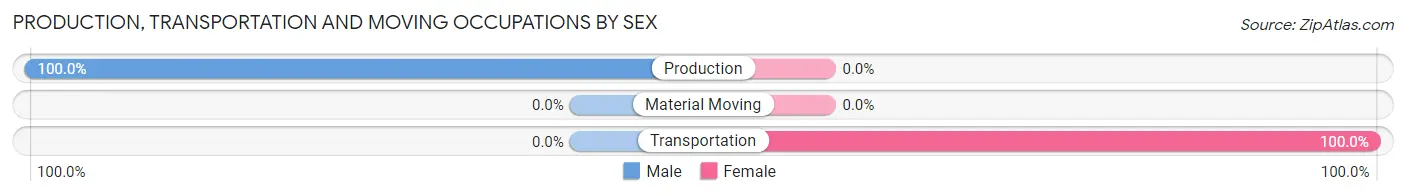
Production, Transportation and Moving Occupations by Sex
| Occupation | Male | Female |
| Production | 4 (100.0%) | 0 (0.0%) |
| Transportation | 0 (0.0%) | 3 (100.0%) |
| Material Moving | 0 (0.0%) | 0 (0.0%) |
| Total (Category) | 4 (57.1%) | 3 (42.9%) |
| Total (Overall) | 84 (56.8%) | 64 (43.2%) |
Employment Industries by Sex in Ekalaka
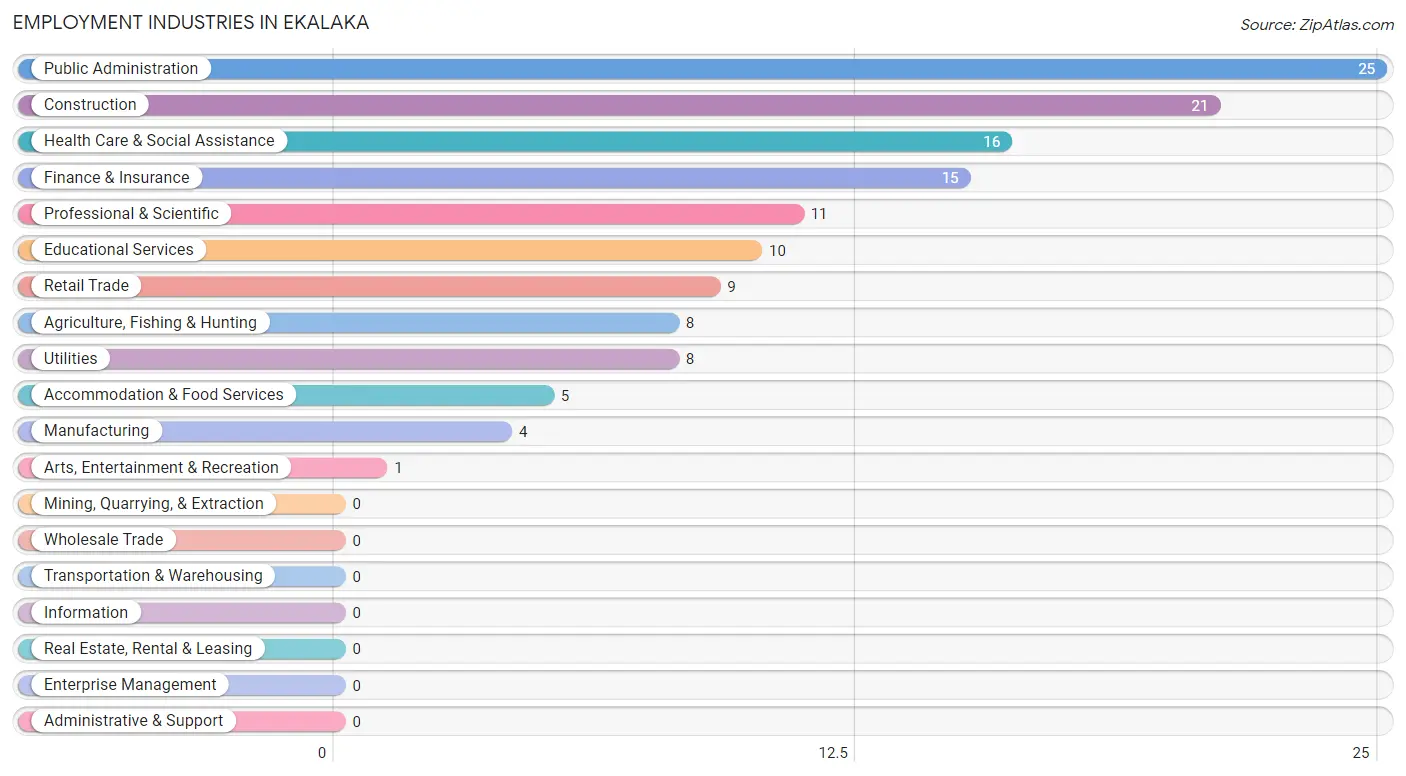
Employment Industries in Ekalaka
The major employment industries in Ekalaka include Public Administration (25 | 16.9%), Construction (21 | 14.2%), Health Care & Social Assistance (16 | 10.8%), Finance & Insurance (15 | 10.1%), and Professional & Scientific (11 | 7.4%).
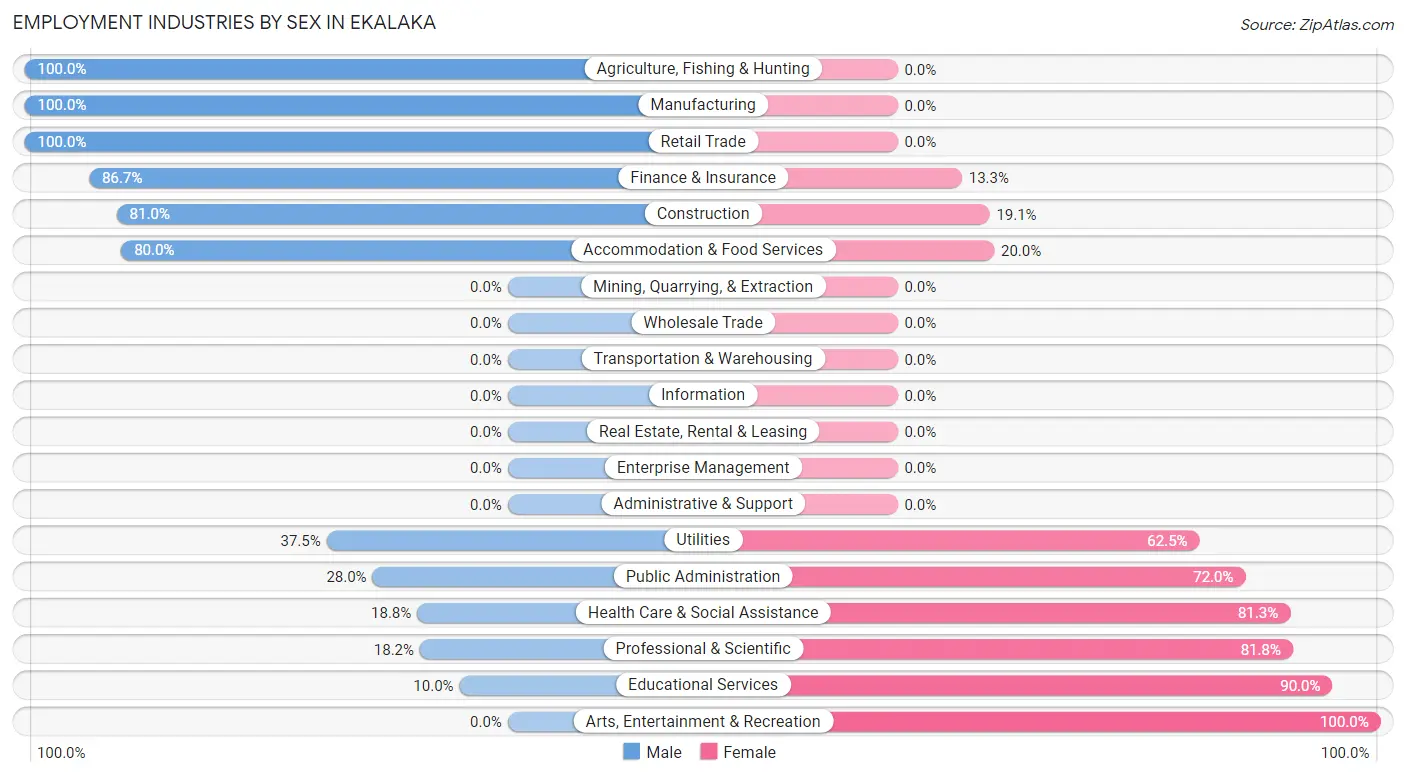
Employment Industries by Sex in Ekalaka
The Ekalaka industries that see more men than women are Agriculture, Fishing & Hunting (100.0%), Manufacturing (100.0%), and Retail Trade (100.0%), whereas the industries that tend to have a higher number of women are Arts, Entertainment & Recreation (100.0%), Educational Services (90.0%), and Professional & Scientific (81.8%).
| Industry | Male | Female |
| Agriculture, Fishing & Hunting | 8 (100.0%) | 0 (0.0%) |
| Mining, Quarrying, & Extraction | 0 (0.0%) | 0 (0.0%) |
| Construction | 17 (80.9%) | 4 (19.1%) |
| Manufacturing | 4 (100.0%) | 0 (0.0%) |
| Wholesale Trade | 0 (0.0%) | 0 (0.0%) |
| Retail Trade | 9 (100.0%) | 0 (0.0%) |
| Transportation & Warehousing | 0 (0.0%) | 0 (0.0%) |
| Utilities | 3 (37.5%) | 5 (62.5%) |
| Information | 0 (0.0%) | 0 (0.0%) |
| Finance & Insurance | 13 (86.7%) | 2 (13.3%) |
| Real Estate, Rental & Leasing | 0 (0.0%) | 0 (0.0%) |
| Professional & Scientific | 2 (18.2%) | 9 (81.8%) |
| Enterprise Management | 0 (0.0%) | 0 (0.0%) |
| Administrative & Support | 0 (0.0%) | 0 (0.0%) |
| Educational Services | 1 (10.0%) | 9 (90.0%) |
| Health Care & Social Assistance | 3 (18.8%) | 13 (81.2%) |
| Arts, Entertainment & Recreation | 0 (0.0%) | 1 (100.0%) |
| Accommodation & Food Services | 4 (80.0%) | 1 (20.0%) |
| Public Administration | 7 (28.0%) | 18 (72.0%) |
| Total | 84 (56.8%) | 64 (43.2%) |
Education in Ekalaka
School Enrollment in Ekalaka
The most common levels of schooling among the 53 students in Ekalaka are elementary school (33 | 62.3%), college / undergraduate (13 | 24.5%), and middle school (5 | 9.4%).
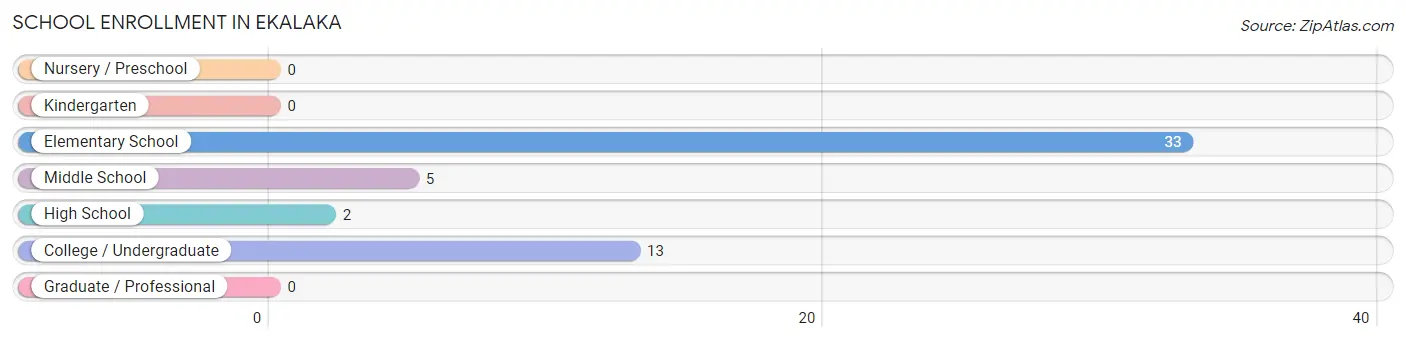
| School Level | # Students | % Students |
| Nursery / Preschool | 0 | 0.0% |
| Kindergarten | 0 | 0.0% |
| Elementary School | 33 | 62.3% |
| Middle School | 5 | 9.4% |
| High School | 2 | 3.8% |
| College / Undergraduate | 13 | 24.5% |
| Graduate / Professional | 0 | 0.0% |
| Total | 53 | 100.0% |
School Enrollment by Age by Funding Source in Ekalaka
Out of a total of 53 students who are enrolled in schools in Ekalaka, 13 (24.5%) attend a private institution, while the remaining 40 (75.5%) are enrolled in public schools. The age group of 25 to 34 year olds has the highest likelihood of being enrolled in private schools, with 4 (100.0% in the age bracket) enrolled. Conversely, the age group of 5 to 9 year old has the lowest likelihood of being enrolled in a private school, with 30 (100.0% in the age bracket) attending a public institution.
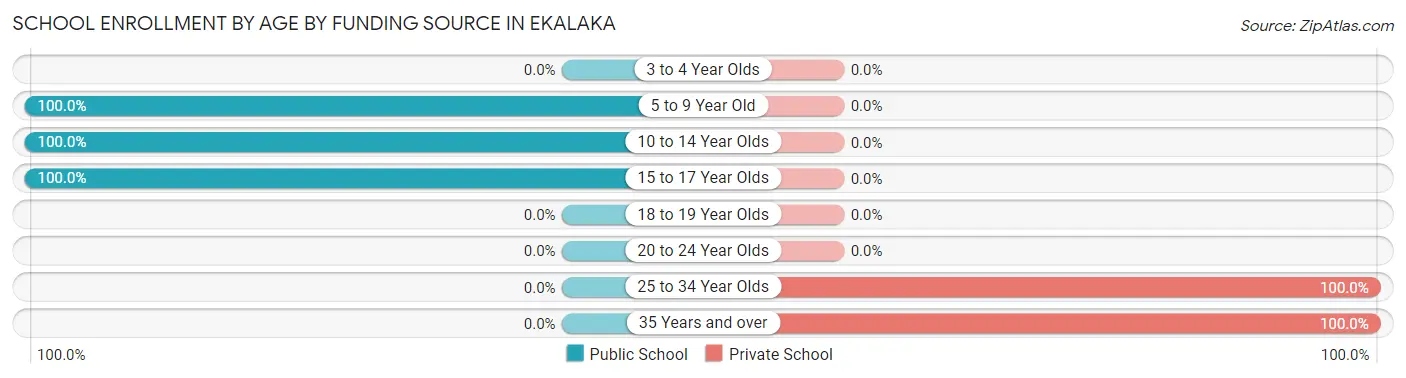
| Age Bracket | Public School | Private School |
| 3 to 4 Year Olds | 0 (0.0%) | 0 (0.0%) |
| 5 to 9 Year Old | 30 (100.0%) | 0 (0.0%) |
| 10 to 14 Year Olds | 8 (100.0%) | 0 (0.0%) |
| 15 to 17 Year Olds | 2 (100.0%) | 0 (0.0%) |
| 18 to 19 Year Olds | 0 (0.0%) | 0 (0.0%) |
| 20 to 24 Year Olds | 0 (0.0%) | 0 (0.0%) |
| 25 to 34 Year Olds | 0 (0.0%) | 4 (100.0%) |
| 35 Years and over | 0 (0.0%) | 9 (100.0%) |
| Total | 40 (75.5%) | 13 (24.5%) |
Educational Attainment by Field of Study in Ekalaka
Physical & health sciences (11 | 18.6%), social sciences (10 | 17.0%), bio, nature & agricultural (8 | 13.6%), education (7 | 11.9%), and arts & humanities (6 | 10.2%) are the most common fields of study among 59 individuals in Ekalaka who have obtained a bachelor's degree or higher.
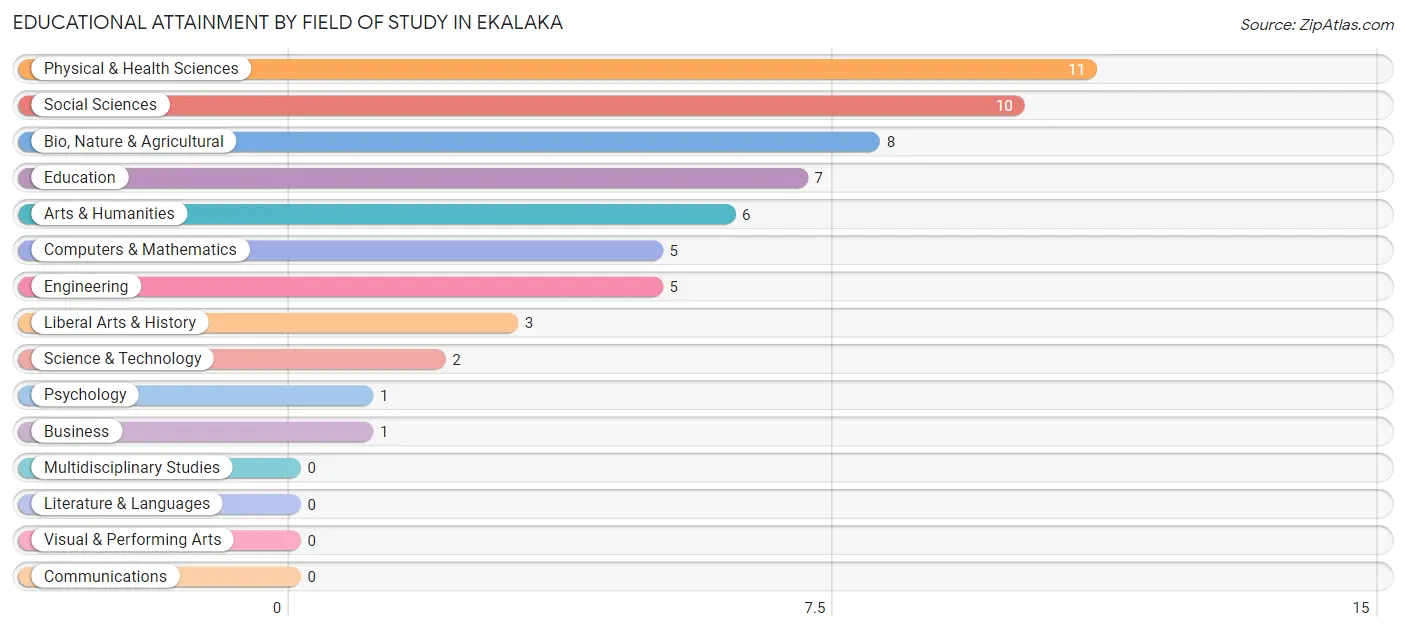
| Field of Study | # Graduates | % Graduates |
| Computers & Mathematics | 5 | 8.5% |
| Bio, Nature & Agricultural | 8 | 13.6% |
| Physical & Health Sciences | 11 | 18.6% |
| Psychology | 1 | 1.7% |
| Social Sciences | 10 | 17.0% |
| Engineering | 5 | 8.5% |
| Multidisciplinary Studies | 0 | 0.0% |
| Science & Technology | 2 | 3.4% |
| Business | 1 | 1.7% |
| Education | 7 | 11.9% |
| Literature & Languages | 0 | 0.0% |
| Liberal Arts & History | 3 | 5.1% |
| Visual & Performing Arts | 0 | 0.0% |
| Communications | 0 | 0.0% |
| Arts & Humanities | 6 | 10.2% |
| Total | 59 | 100.0% |
Transportation & Commute in Ekalaka
Vehicle Availability by Sex in Ekalaka
The most prevalent vehicle ownership categories in Ekalaka are males with 2 vehicles (26, accounting for 30.9%) and females with 2 vehicles (20, making up 41.9%).
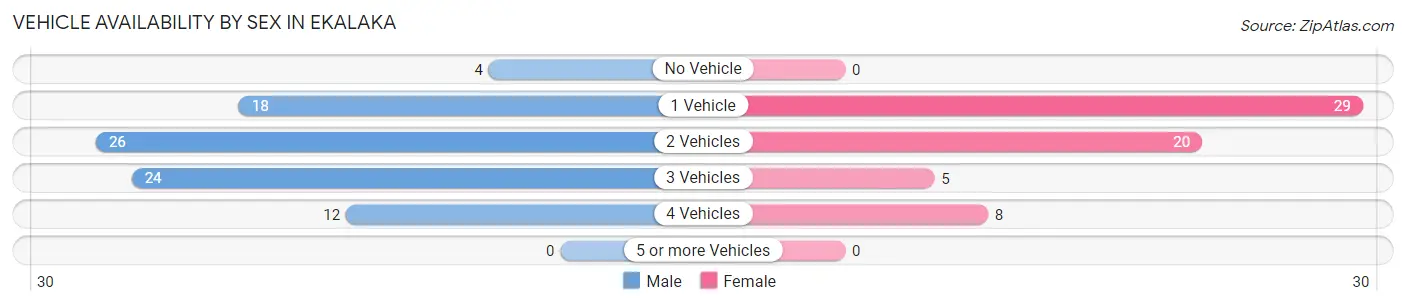
| Vehicles Available | Male | Female |
| No Vehicle | 4 (4.8%) | 0 (0.0%) |
| 1 Vehicle | 18 (21.4%) | 29 (46.8%) |
| 2 Vehicles | 26 (30.9%) | 20 (32.3%) |
| 3 Vehicles | 24 (28.6%) | 5 (8.1%) |
| 4 Vehicles | 12 (14.3%) | 8 (12.9%) |
| 5 or more Vehicles | 0 (0.0%) | 0 (0.0%) |
| Total | 84 (100.0%) | 62 (100.0%) |
Commute Time in Ekalaka
The most frequently occuring commute durations in Ekalaka are 5 to 9 minutes (50 commuters, 45.1%), less than 5 minutes (39 commuters, 35.1%), and 10 to 14 minutes (9 commuters, 8.1%).
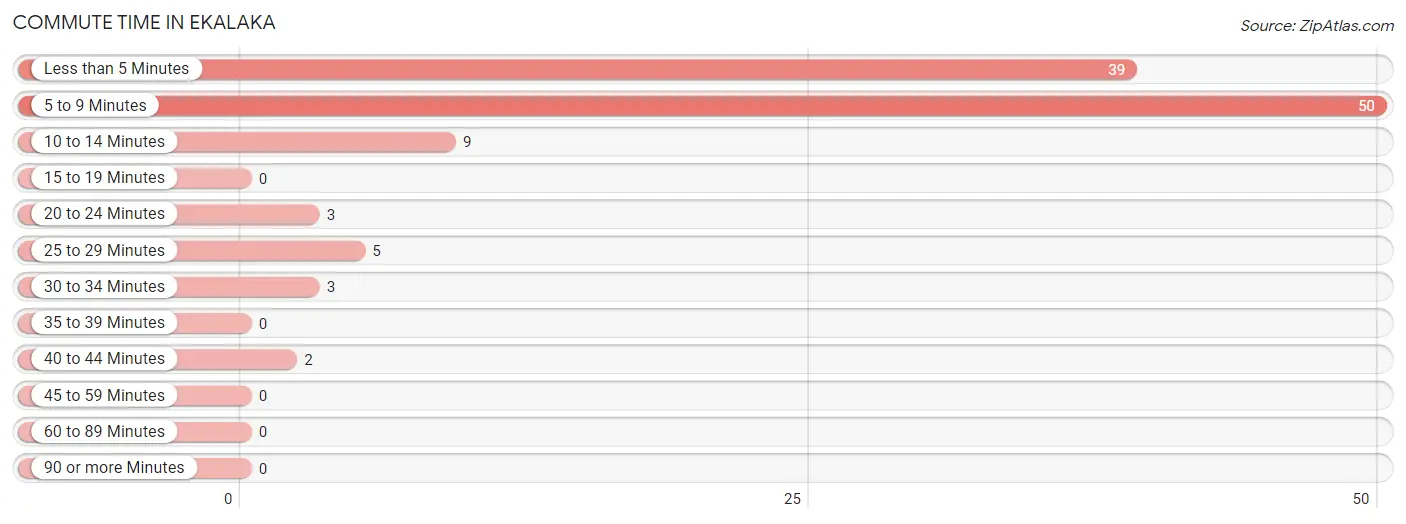
| Commute Time | # Commuters | % Commuters |
| Less than 5 Minutes | 39 | 35.1% |
| 5 to 9 Minutes | 50 | 45.1% |
| 10 to 14 Minutes | 9 | 8.1% |
| 15 to 19 Minutes | 0 | 0.0% |
| 20 to 24 Minutes | 3 | 2.7% |
| 25 to 29 Minutes | 5 | 4.5% |
| 30 to 34 Minutes | 3 | 2.7% |
| 35 to 39 Minutes | 0 | 0.0% |
| 40 to 44 Minutes | 2 | 1.8% |
| 45 to 59 Minutes | 0 | 0.0% |
| 60 to 89 Minutes | 0 | 0.0% |
| 90 or more Minutes | 0 | 0.0% |
Commute Time by Sex in Ekalaka
The most common commute times in Ekalaka are 5 to 9 minutes (30 commuters, 46.9%) for males and 5 to 9 minutes (20 commuters, 42.5%) for females.
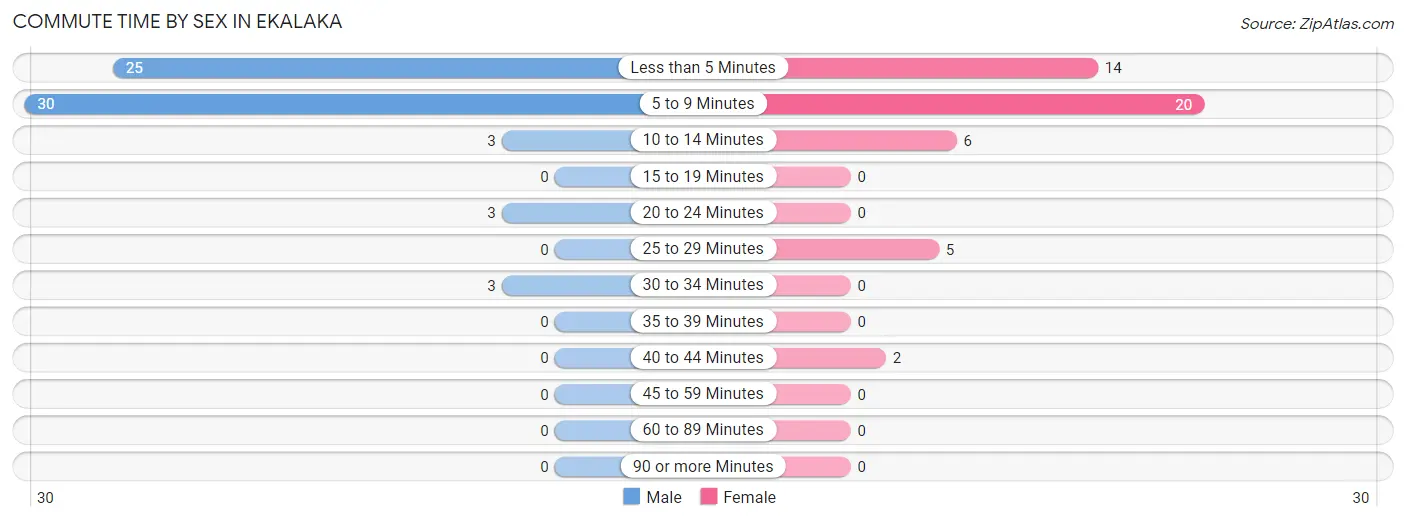
| Commute Time | Male | Female |
| Less than 5 Minutes | 25 (39.1%) | 14 (29.8%) |
| 5 to 9 Minutes | 30 (46.9%) | 20 (42.5%) |
| 10 to 14 Minutes | 3 (4.7%) | 6 (12.8%) |
| 15 to 19 Minutes | 0 (0.0%) | 0 (0.0%) |
| 20 to 24 Minutes | 3 (4.7%) | 0 (0.0%) |
| 25 to 29 Minutes | 0 (0.0%) | 5 (10.6%) |
| 30 to 34 Minutes | 3 (4.7%) | 0 (0.0%) |
| 35 to 39 Minutes | 0 (0.0%) | 0 (0.0%) |
| 40 to 44 Minutes | 0 (0.0%) | 2 (4.3%) |
| 45 to 59 Minutes | 0 (0.0%) | 0 (0.0%) |
| 60 to 89 Minutes | 0 (0.0%) | 0 (0.0%) |
| 90 or more Minutes | 0 (0.0%) | 0 (0.0%) |
Time of Departure to Work by Sex in Ekalaka
The most frequent times of departure to work in Ekalaka are 7:30 AM to 7:59 AM (22, 34.4%) for males and 7:30 AM to 7:59 AM (24, 51.1%) for females.
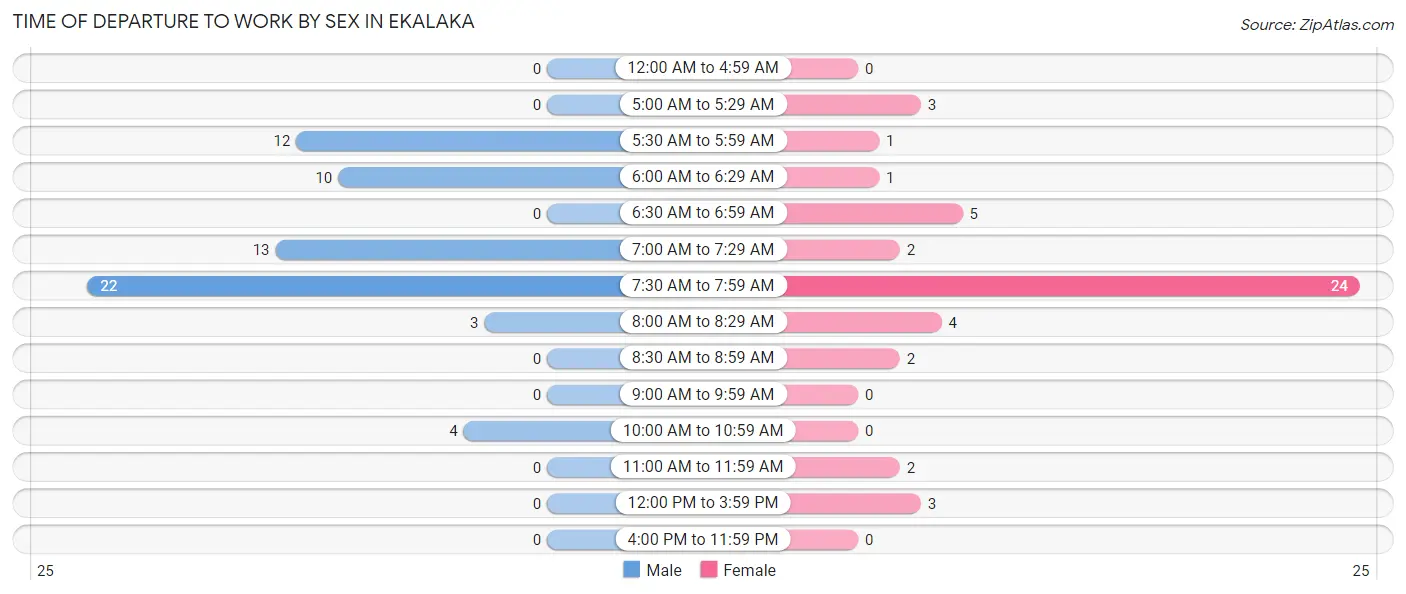
| Time of Departure | Male | Female |
| 12:00 AM to 4:59 AM | 0 (0.0%) | 0 (0.0%) |
| 5:00 AM to 5:29 AM | 0 (0.0%) | 3 (6.4%) |
| 5:30 AM to 5:59 AM | 12 (18.8%) | 1 (2.1%) |
| 6:00 AM to 6:29 AM | 10 (15.6%) | 1 (2.1%) |
| 6:30 AM to 6:59 AM | 0 (0.0%) | 5 (10.6%) |
| 7:00 AM to 7:29 AM | 13 (20.3%) | 2 (4.3%) |
| 7:30 AM to 7:59 AM | 22 (34.4%) | 24 (51.1%) |
| 8:00 AM to 8:29 AM | 3 (4.7%) | 4 (8.5%) |
| 8:30 AM to 8:59 AM | 0 (0.0%) | 2 (4.3%) |
| 9:00 AM to 9:59 AM | 0 (0.0%) | 0 (0.0%) |
| 10:00 AM to 10:59 AM | 4 (6.2%) | 0 (0.0%) |
| 11:00 AM to 11:59 AM | 0 (0.0%) | 2 (4.3%) |
| 12:00 PM to 3:59 PM | 0 (0.0%) | 3 (6.4%) |
| 4:00 PM to 11:59 PM | 0 (0.0%) | 0 (0.0%) |
| Total | 64 (100.0%) | 47 (100.0%) |
Housing Occupancy in Ekalaka
Occupancy by Ownership in Ekalaka
Of the total 216 dwellings in Ekalaka, owner-occupied units account for 130 (60.2%), while renter-occupied units make up 86 (39.8%).
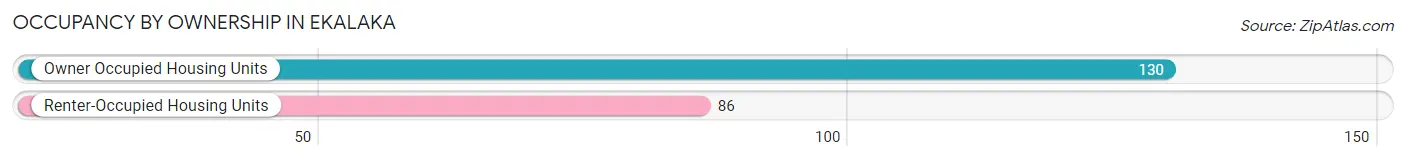
| Occupancy | # Housing Units | % Housing Units |
| Owner Occupied Housing Units | 130 | 60.2% |
| Renter-Occupied Housing Units | 86 | 39.8% |
| Total Occupied Housing Units | 216 | 100.0% |
Occupancy by Household Size in Ekalaka
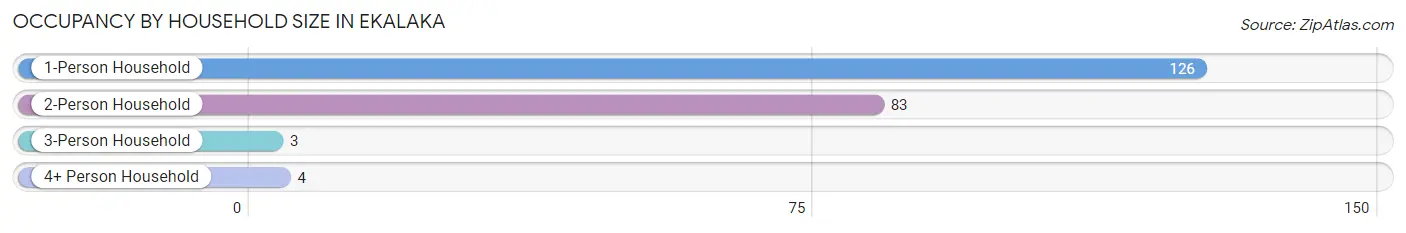
| Household Size | # Housing Units | % Housing Units |
| 1-Person Household | 126 | 58.3% |
| 2-Person Household | 83 | 38.4% |
| 3-Person Household | 3 | 1.4% |
| 4+ Person Household | 4 | 1.8% |
| Total Housing Units | 216 | 100.0% |
Occupancy by Ownership by Household Size in Ekalaka
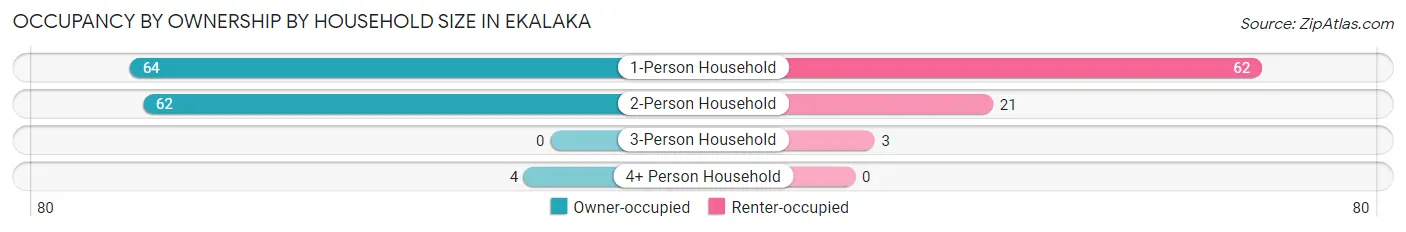
| Household Size | Owner-occupied | Renter-occupied |
| 1-Person Household | 64 (50.8%) | 62 (49.2%) |
| 2-Person Household | 62 (74.7%) | 21 (25.3%) |
| 3-Person Household | 0 (0.0%) | 3 (100.0%) |
| 4+ Person Household | 4 (100.0%) | 0 (0.0%) |
| Total Housing Units | 130 (60.2%) | 86 (39.8%) |
Occupancy by Educational Attainment in Ekalaka
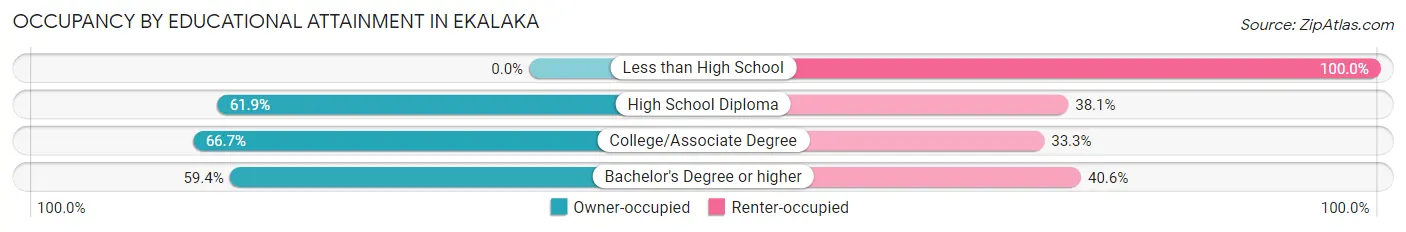
| Household Size | Owner-occupied | Renter-occupied |
| Less than High School | 0 (0.0%) | 13 (100.0%) |
| High School Diploma | 39 (61.9%) | 24 (38.1%) |
| College/Associate Degree | 72 (66.7%) | 36 (33.3%) |
| Bachelor's Degree or higher | 19 (59.4%) | 13 (40.6%) |
Occupancy by Age of Householder in Ekalaka
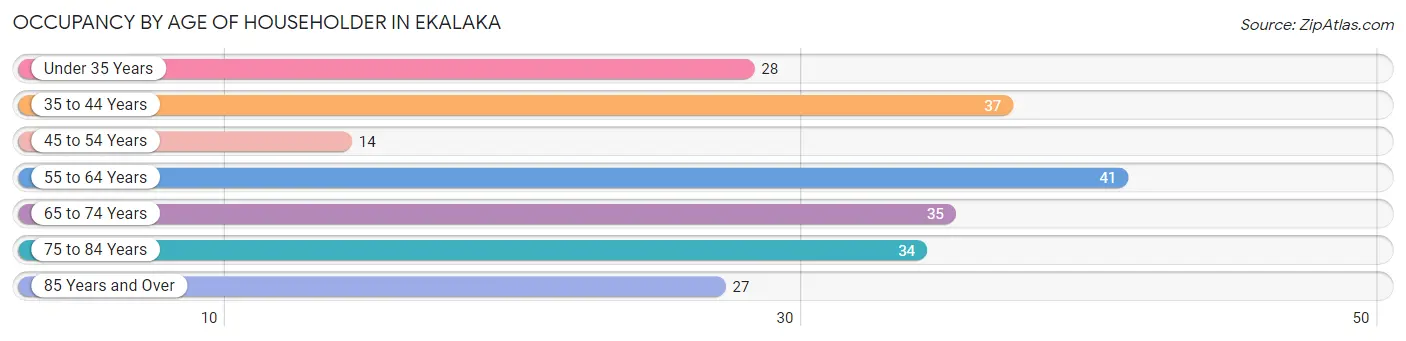
| Age Bracket | # Households | % Households |
| Under 35 Years | 28 | 13.0% |
| 35 to 44 Years | 37 | 17.1% |
| 45 to 54 Years | 14 | 6.5% |
| 55 to 64 Years | 41 | 19.0% |
| 65 to 74 Years | 35 | 16.2% |
| 75 to 84 Years | 34 | 15.7% |
| 85 Years and Over | 27 | 12.5% |
| Total | 216 | 100.0% |
Housing Finances in Ekalaka
Median Income by Occupancy in Ekalaka
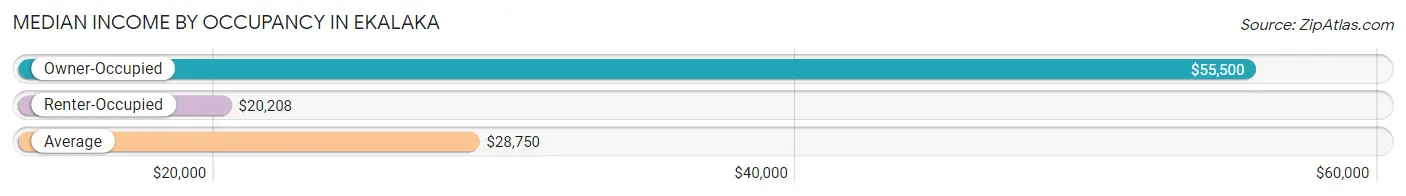
| Occupancy Type | # Households | Median Income |
| Owner-Occupied | 130 (60.2%) | $55,500 |
| Renter-Occupied | 86 (39.8%) | $20,208 |
| Average | 216 (100.0%) | $28,750 |
Occupancy by Householder Income Bracket in Ekalaka
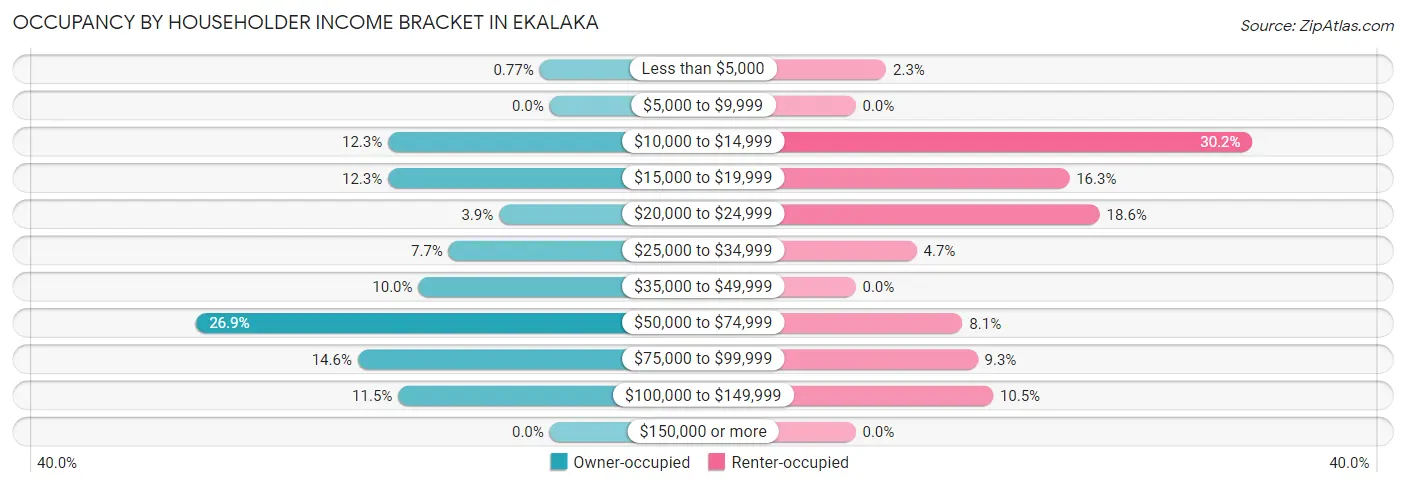
| Income Bracket | Owner-occupied | Renter-occupied |
| Less than $5,000 | 1 (0.8%) | 2 (2.3%) |
| $5,000 to $9,999 | 0 (0.0%) | 0 (0.0%) |
| $10,000 to $14,999 | 16 (12.3%) | 26 (30.2%) |
| $15,000 to $19,999 | 16 (12.3%) | 14 (16.3%) |
| $20,000 to $24,999 | 5 (3.8%) | 16 (18.6%) |
| $25,000 to $34,999 | 10 (7.7%) | 4 (4.6%) |
| $35,000 to $49,999 | 13 (10.0%) | 0 (0.0%) |
| $50,000 to $74,999 | 35 (26.9%) | 7 (8.1%) |
| $75,000 to $99,999 | 19 (14.6%) | 8 (9.3%) |
| $100,000 to $149,999 | 15 (11.5%) | 9 (10.5%) |
| $150,000 or more | 0 (0.0%) | 0 (0.0%) |
| Total | 130 (100.0%) | 86 (100.0%) |
Monthly Housing Cost Tiers in Ekalaka
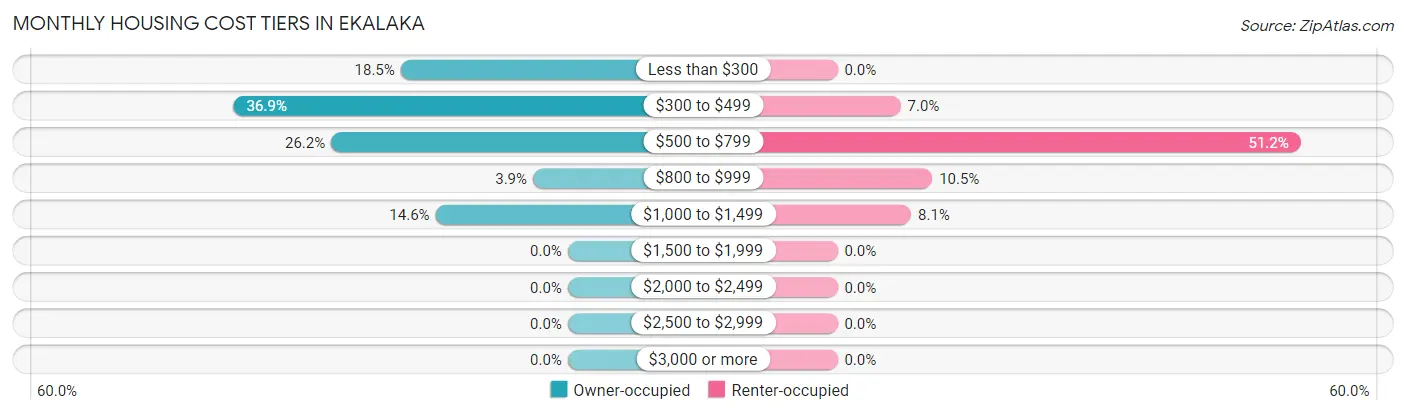
| Monthly Cost | Owner-occupied | Renter-occupied |
| Less than $300 | 24 (18.5%) | 0 (0.0%) |
| $300 to $499 | 48 (36.9%) | 6 (7.0%) |
| $500 to $799 | 34 (26.2%) | 44 (51.2%) |
| $800 to $999 | 5 (3.8%) | 9 (10.5%) |
| $1,000 to $1,499 | 19 (14.6%) | 7 (8.1%) |
| $1,500 to $1,999 | 0 (0.0%) | 0 (0.0%) |
| $2,000 to $2,499 | 0 (0.0%) | 0 (0.0%) |
| $2,500 to $2,999 | 0 (0.0%) | 0 (0.0%) |
| $3,000 or more | 0 (0.0%) | 0 (0.0%) |
| Total | 130 (100.0%) | 86 (100.0%) |
Physical Housing Characteristics in Ekalaka
Housing Structures in Ekalaka
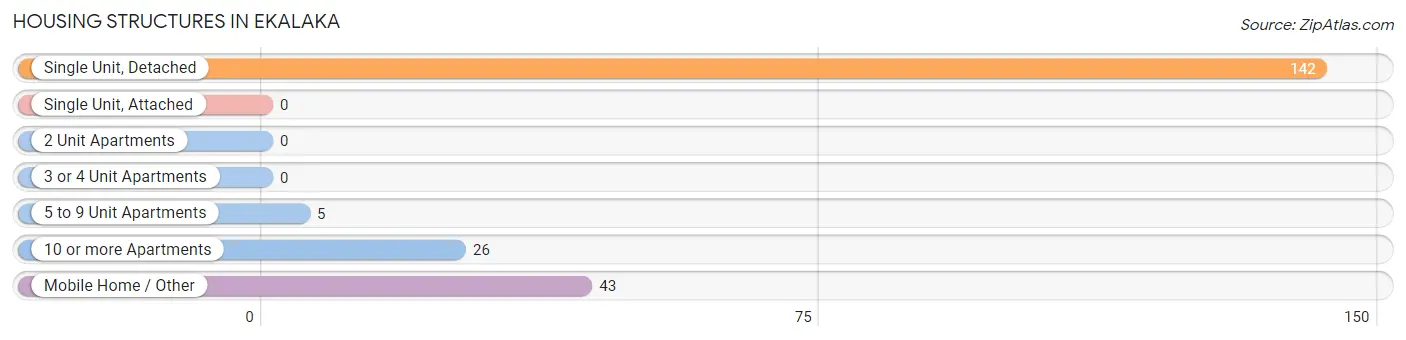
| Structure Type | # Housing Units | % Housing Units |
| Single Unit, Detached | 142 | 65.7% |
| Single Unit, Attached | 0 | 0.0% |
| 2 Unit Apartments | 0 | 0.0% |
| 3 or 4 Unit Apartments | 0 | 0.0% |
| 5 to 9 Unit Apartments | 5 | 2.3% |
| 10 or more Apartments | 26 | 12.0% |
| Mobile Home / Other | 43 | 19.9% |
| Total | 216 | 100.0% |
Housing Structures by Occupancy in Ekalaka
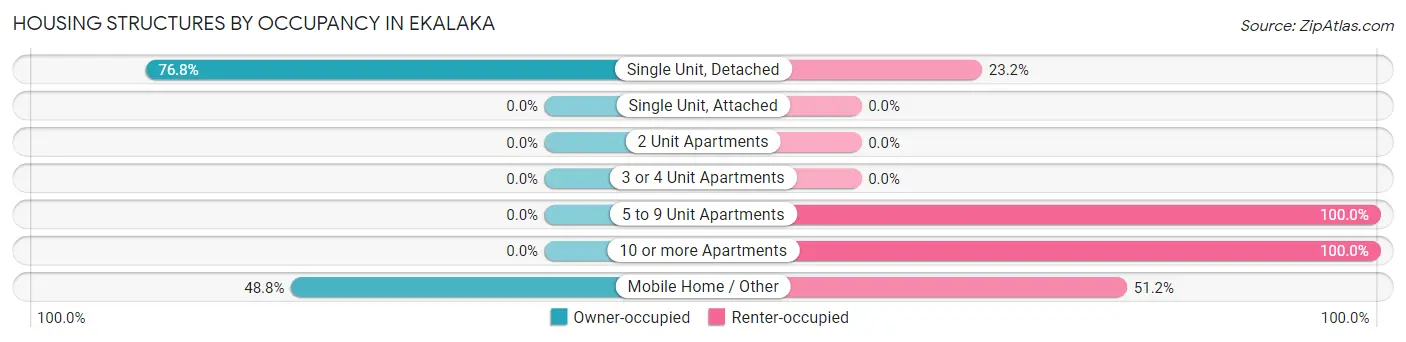
| Structure Type | Owner-occupied | Renter-occupied |
| Single Unit, Detached | 109 (76.8%) | 33 (23.2%) |
| Single Unit, Attached | 0 (0.0%) | 0 (0.0%) |
| 2 Unit Apartments | 0 (0.0%) | 0 (0.0%) |
| 3 or 4 Unit Apartments | 0 (0.0%) | 0 (0.0%) |
| 5 to 9 Unit Apartments | 0 (0.0%) | 5 (100.0%) |
| 10 or more Apartments | 0 (0.0%) | 26 (100.0%) |
| Mobile Home / Other | 21 (48.8%) | 22 (51.2%) |
| Total | 130 (60.2%) | 86 (39.8%) |
Housing Structures by Number of Rooms in Ekalaka
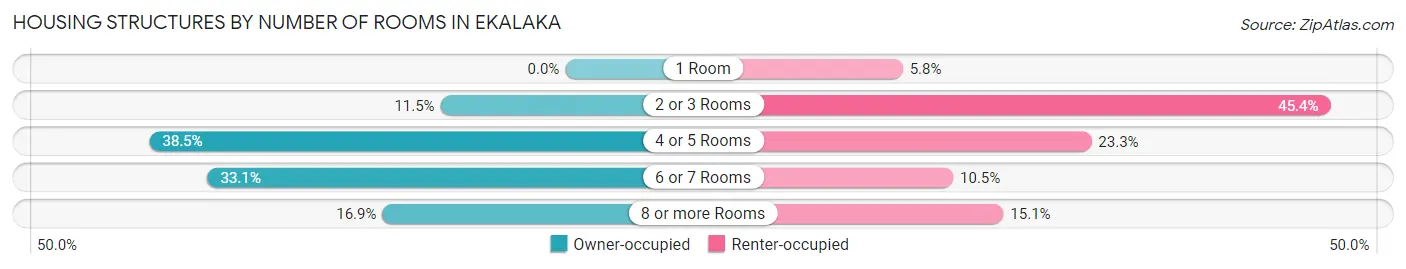
| Number of Rooms | Owner-occupied | Renter-occupied |
| 1 Room | 0 (0.0%) | 5 (5.8%) |
| 2 or 3 Rooms | 15 (11.5%) | 39 (45.4%) |
| 4 or 5 Rooms | 50 (38.5%) | 20 (23.3%) |
| 6 or 7 Rooms | 43 (33.1%) | 9 (10.5%) |
| 8 or more Rooms | 22 (16.9%) | 13 (15.1%) |
| Total | 130 (100.0%) | 86 (100.0%) |
Housing Structure by Heating Type in Ekalaka
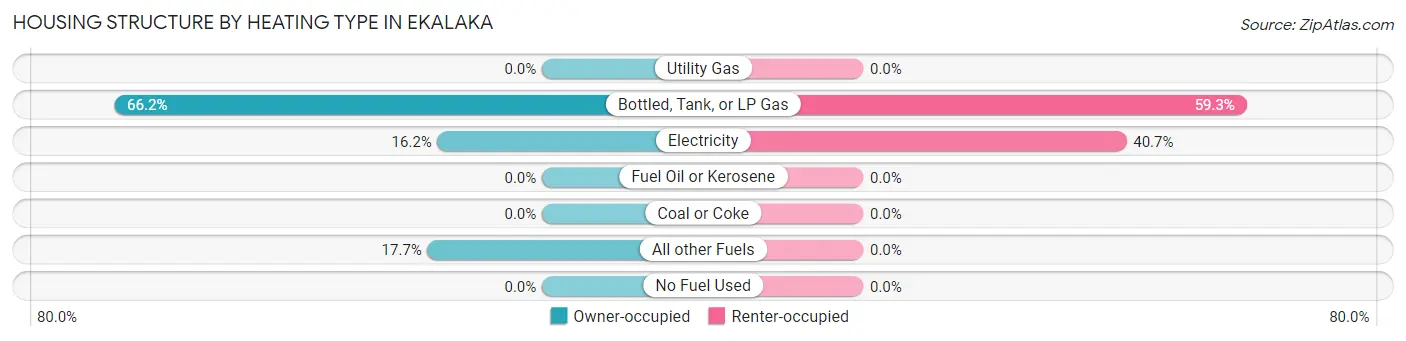
| Heating Type | Owner-occupied | Renter-occupied |
| Utility Gas | 0 (0.0%) | 0 (0.0%) |
| Bottled, Tank, or LP Gas | 86 (66.1%) | 51 (59.3%) |
| Electricity | 21 (16.2%) | 35 (40.7%) |
| Fuel Oil or Kerosene | 0 (0.0%) | 0 (0.0%) |
| Coal or Coke | 0 (0.0%) | 0 (0.0%) |
| All other Fuels | 23 (17.7%) | 0 (0.0%) |
| No Fuel Used | 0 (0.0%) | 0 (0.0%) |
| Total | 130 (100.0%) | 86 (100.0%) |
Household Vehicle Usage in Ekalaka
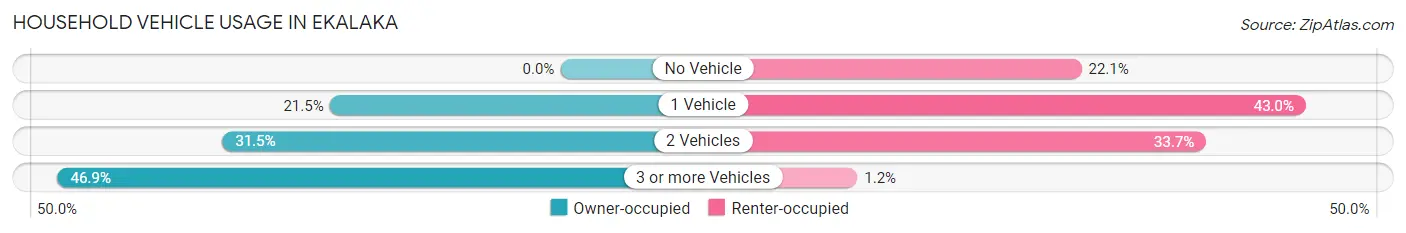
| Vehicles per Household | Owner-occupied | Renter-occupied |
| No Vehicle | 0 (0.0%) | 19 (22.1%) |
| 1 Vehicle | 28 (21.5%) | 37 (43.0%) |
| 2 Vehicles | 41 (31.5%) | 29 (33.7%) |
| 3 or more Vehicles | 61 (46.9%) | 1 (1.2%) |
| Total | 130 (100.0%) | 86 (100.0%) |
Real Estate & Mortgages in Ekalaka
Real Estate and Mortgage Overview in Ekalaka
| Characteristic | Without Mortgage | With Mortgage |
| Housing Units | 107 | 23 |
| Median Property Value | $101,000 | $98,800 |
| Median Household Income | $45,417 | $0 |
| Monthly Housing Costs | $434 | $0 |
| Real Estate Taxes | $523 | $0 |
Property Value by Mortgage Status in Ekalaka
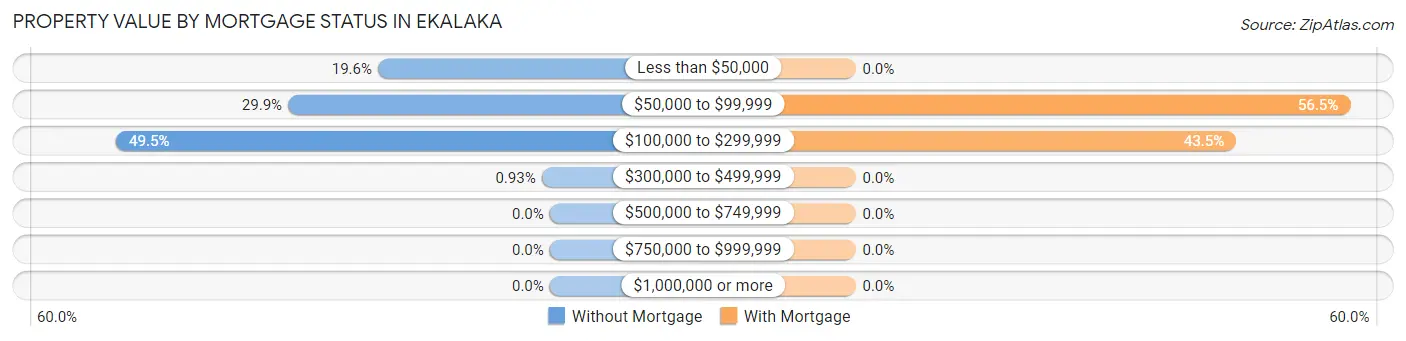
| Property Value | Without Mortgage | With Mortgage |
| Less than $50,000 | 21 (19.6%) | 0 (0.0%) |
| $50,000 to $99,999 | 32 (29.9%) | 13 (56.5%) |
| $100,000 to $299,999 | 53 (49.5%) | 10 (43.5%) |
| $300,000 to $499,999 | 1 (0.9%) | 0 (0.0%) |
| $500,000 to $749,999 | 0 (0.0%) | 0 (0.0%) |
| $750,000 to $999,999 | 0 (0.0%) | 0 (0.0%) |
| $1,000,000 or more | 0 (0.0%) | 0 (0.0%) |
| Total | 107 (100.0%) | 23 (100.0%) |
Household Income by Mortgage Status in Ekalaka
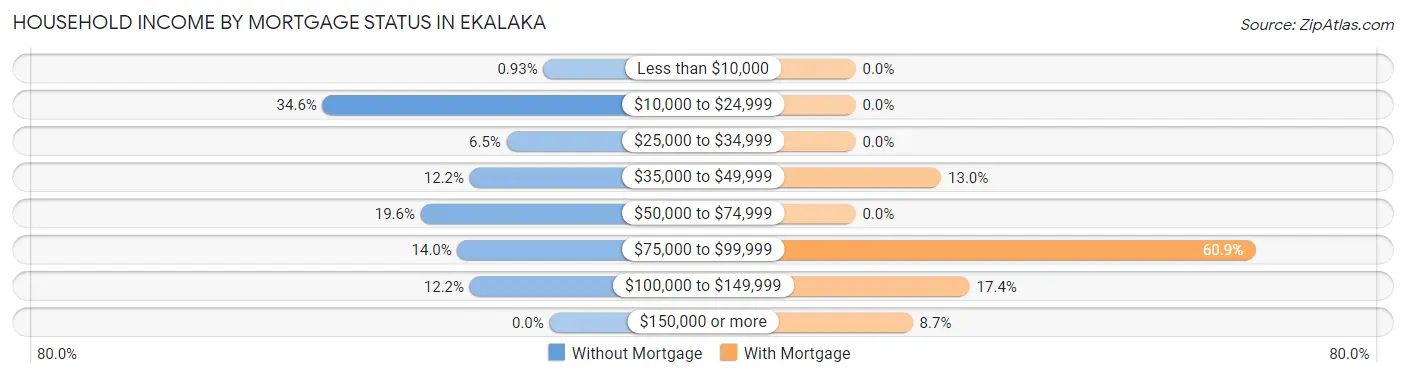
| Household Income | Without Mortgage | With Mortgage |
| Less than $10,000 | 1 (0.9%) | 0 (0.0%) |
| $10,000 to $24,999 | 37 (34.6%) | 0 (0.0%) |
| $25,000 to $34,999 | 7 (6.5%) | 0 (0.0%) |
| $35,000 to $49,999 | 13 (12.1%) | 3 (13.0%) |
| $50,000 to $74,999 | 21 (19.6%) | 0 (0.0%) |
| $75,000 to $99,999 | 15 (14.0%) | 14 (60.9%) |
| $100,000 to $149,999 | 13 (12.1%) | 4 (17.4%) |
| $150,000 or more | 0 (0.0%) | 2 (8.7%) |
| Total | 107 (100.0%) | 23 (100.0%) |
Property Value to Household Income Ratio in Ekalaka
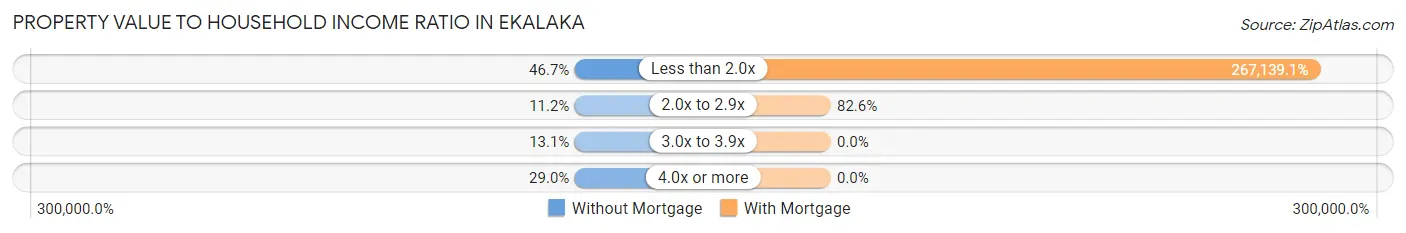
| Value-to-Income Ratio | Without Mortgage | With Mortgage |
| Less than 2.0x | 50 (46.7%) | 61,442 (267,139.1%) |
| 2.0x to 2.9x | 12 (11.2%) | 19 (82.6%) |
| 3.0x to 3.9x | 14 (13.1%) | 0 (0.0%) |
| 4.0x or more | 31 (29.0%) | 0 (0.0%) |
| Total | 107 (100.0%) | 23 (100.0%) |
Real Estate Taxes by Mortgage Status in Ekalaka
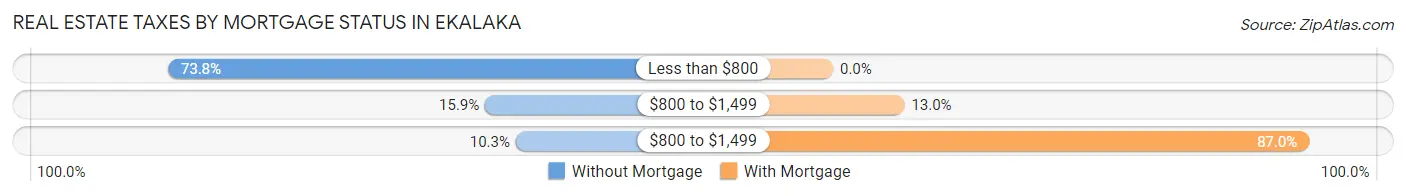
| Property Taxes | Without Mortgage | With Mortgage |
| Less than $800 | 79 (73.8%) | 0 (0.0%) |
| $800 to $1,499 | 17 (15.9%) | 3 (13.0%) |
| $800 to $1,499 | 11 (10.3%) | 20 (87.0%) |
| Total | 107 (100.0%) | 23 (100.0%) |
Health & Disability in Ekalaka
Health Insurance Coverage by Age in Ekalaka
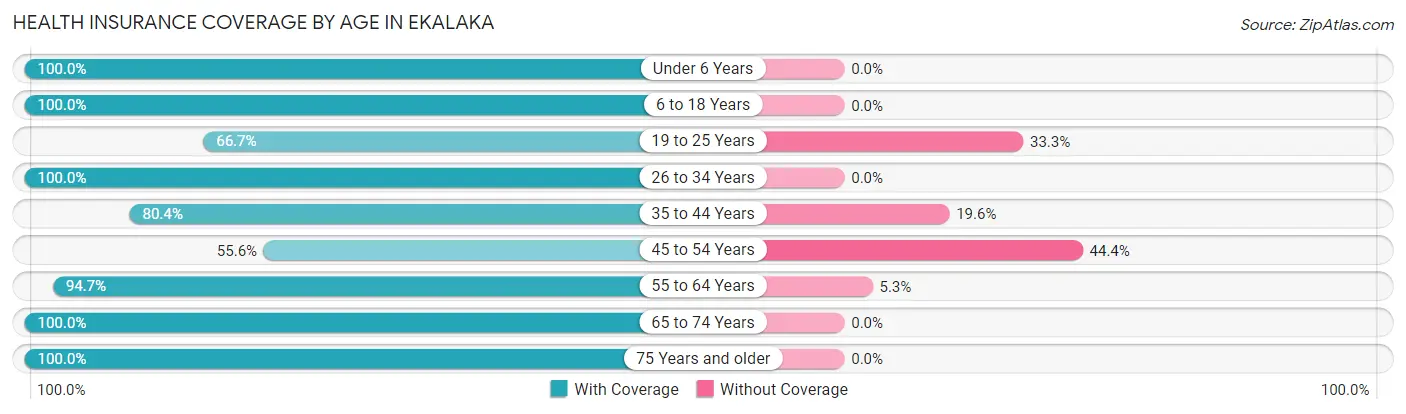
| Age Bracket | With Coverage | Without Coverage |
| Under 6 Years | 6 (100.0%) | 0 (0.0%) |
| 6 to 18 Years | 40 (100.0%) | 0 (0.0%) |
| 19 to 25 Years | 8 (66.7%) | 4 (33.3%) |
| 26 to 34 Years | 16 (100.0%) | 0 (0.0%) |
| 35 to 44 Years | 37 (80.4%) | 9 (19.6%) |
| 45 to 54 Years | 10 (55.6%) | 8 (44.4%) |
| 55 to 64 Years | 72 (94.7%) | 4 (5.3%) |
| 65 to 74 Years | 60 (100.0%) | 0 (0.0%) |
| 75 Years and older | 72 (100.0%) | 0 (0.0%) |
| Total | 321 (92.8%) | 25 (7.2%) |
Health Insurance Coverage by Citizenship Status in Ekalaka
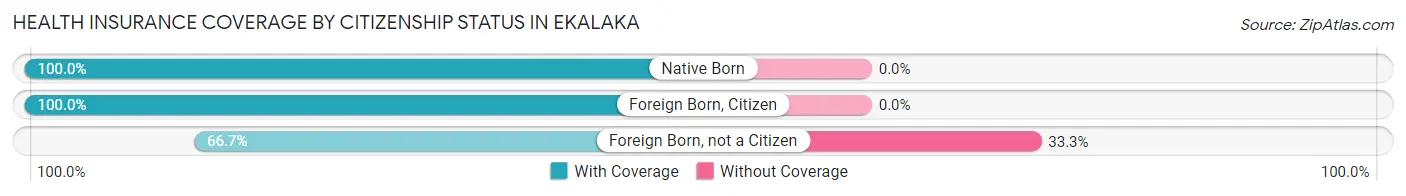
| Citizenship Status | With Coverage | Without Coverage |
| Native Born | 6 (100.0%) | 0 (0.0%) |
| Foreign Born, Citizen | 40 (100.0%) | 0 (0.0%) |
| Foreign Born, not a Citizen | 8 (66.7%) | 4 (33.3%) |
Health Insurance Coverage by Household Income in Ekalaka
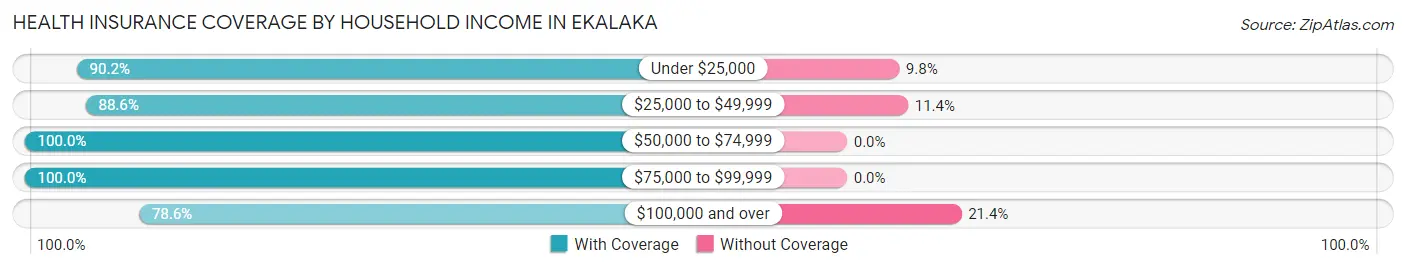
| Household Income | With Coverage | Without Coverage |
| Under $25,000 | 111 (90.2%) | 12 (9.8%) |
| $25,000 to $49,999 | 31 (88.6%) | 4 (11.4%) |
| $50,000 to $74,999 | 90 (100.0%) | 0 (0.0%) |
| $75,000 to $99,999 | 56 (100.0%) | 0 (0.0%) |
| $100,000 and over | 33 (78.6%) | 9 (21.4%) |
Public vs Private Health Insurance Coverage by Age in Ekalaka
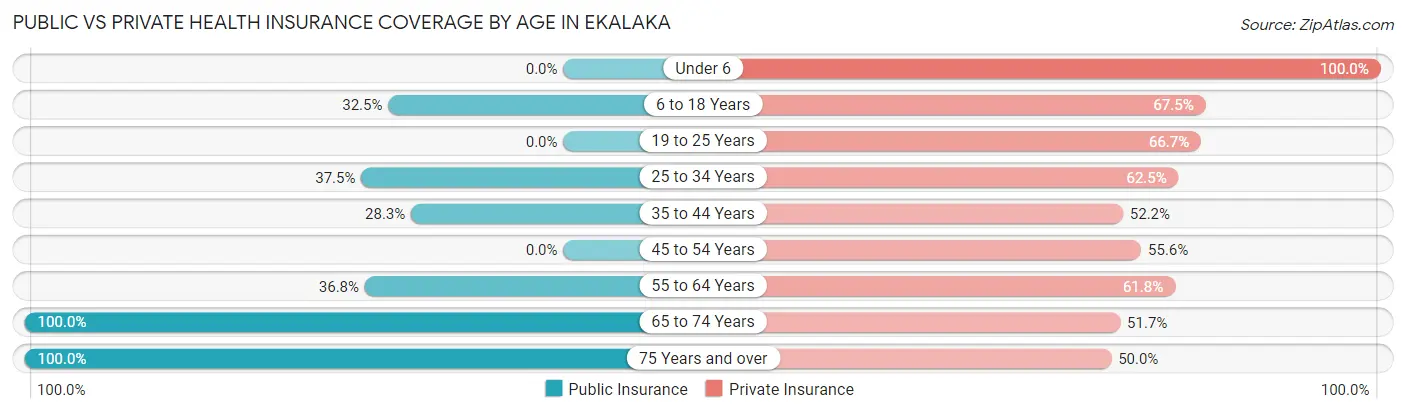
| Age Bracket | Public Insurance | Private Insurance |
| Under 6 | 0 (0.0%) | 6 (100.0%) |
| 6 to 18 Years | 13 (32.5%) | 27 (67.5%) |
| 19 to 25 Years | 0 (0.0%) | 8 (66.7%) |
| 25 to 34 Years | 6 (37.5%) | 10 (62.5%) |
| 35 to 44 Years | 13 (28.3%) | 24 (52.2%) |
| 45 to 54 Years | 0 (0.0%) | 10 (55.6%) |
| 55 to 64 Years | 28 (36.8%) | 47 (61.8%) |
| 65 to 74 Years | 60 (100.0%) | 31 (51.7%) |
| 75 Years and over | 72 (100.0%) | 36 (50.0%) |
| Total | 192 (55.5%) | 199 (57.5%) |
Disability Status by Sex by Age in Ekalaka
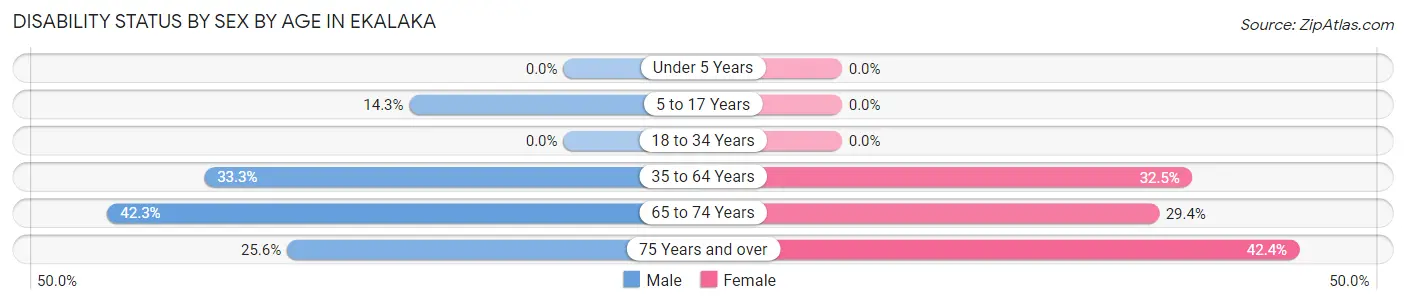
| Age Bracket | Male | Female |
| Under 5 Years | 0 (0.0%) | 0 (0.0%) |
| 5 to 17 Years | 5 (14.3%) | 0 (0.0%) |
| 18 to 34 Years | 0 (0.0%) | 0 (0.0%) |
| 35 to 64 Years | 21 (33.3%) | 25 (32.5%) |
| 65 to 74 Years | 11 (42.3%) | 10 (29.4%) |
| 75 Years and over | 10 (25.6%) | 14 (42.4%) |
Disability Class by Sex by Age in Ekalaka
Disability Class: Hearing Difficulty
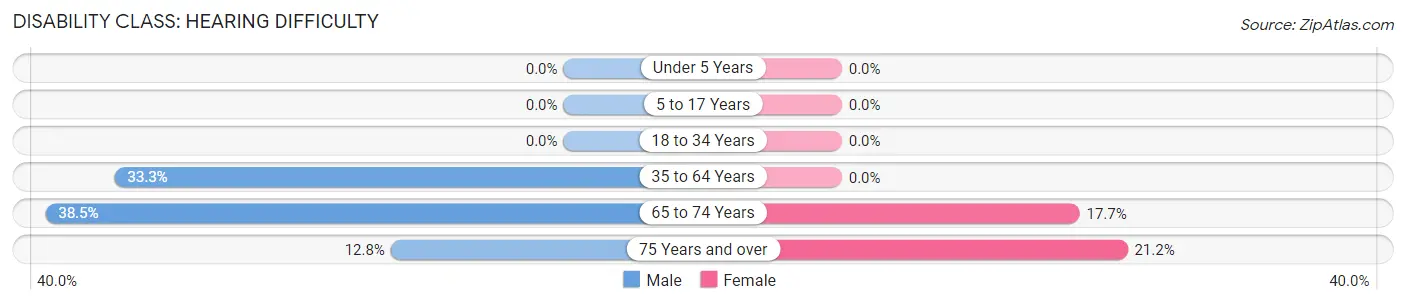
| Age Bracket | Male | Female |
| Under 5 Years | 0 (0.0%) | 0 (0.0%) |
| 5 to 17 Years | 0 (0.0%) | 0 (0.0%) |
| 18 to 34 Years | 0 (0.0%) | 0 (0.0%) |
| 35 to 64 Years | 21 (33.3%) | 0 (0.0%) |
| 65 to 74 Years | 10 (38.5%) | 6 (17.6%) |
| 75 Years and over | 5 (12.8%) | 7 (21.2%) |
Disability Class: Vision Difficulty
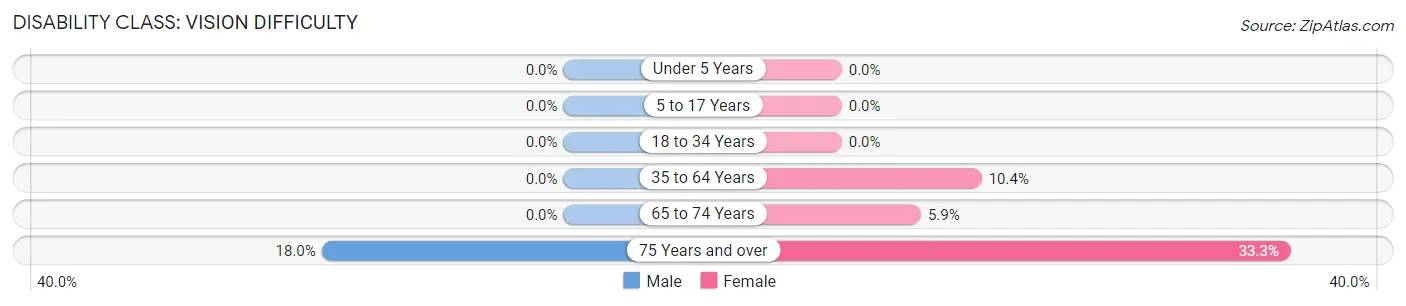
| Age Bracket | Male | Female |
| Under 5 Years | 0 (0.0%) | 0 (0.0%) |
| 5 to 17 Years | 0 (0.0%) | 0 (0.0%) |
| 18 to 34 Years | 0 (0.0%) | 0 (0.0%) |
| 35 to 64 Years | 0 (0.0%) | 8 (10.4%) |
| 65 to 74 Years | 0 (0.0%) | 2 (5.9%) |
| 75 Years and over | 7 (17.9%) | 11 (33.3%) |
Disability Class: Cognitive Difficulty
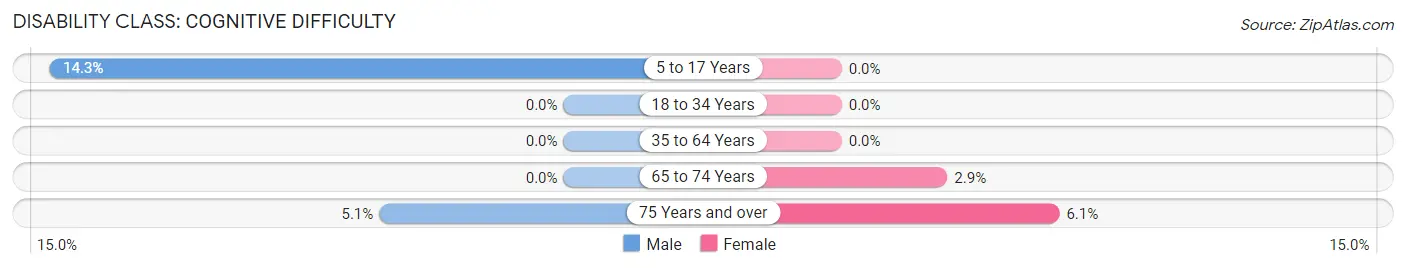
| Age Bracket | Male | Female |
| 5 to 17 Years | 5 (14.3%) | 0 (0.0%) |
| 18 to 34 Years | 0 (0.0%) | 0 (0.0%) |
| 35 to 64 Years | 0 (0.0%) | 0 (0.0%) |
| 65 to 74 Years | 0 (0.0%) | 1 (2.9%) |
| 75 Years and over | 2 (5.1%) | 2 (6.1%) |
Disability Class: Ambulatory Difficulty
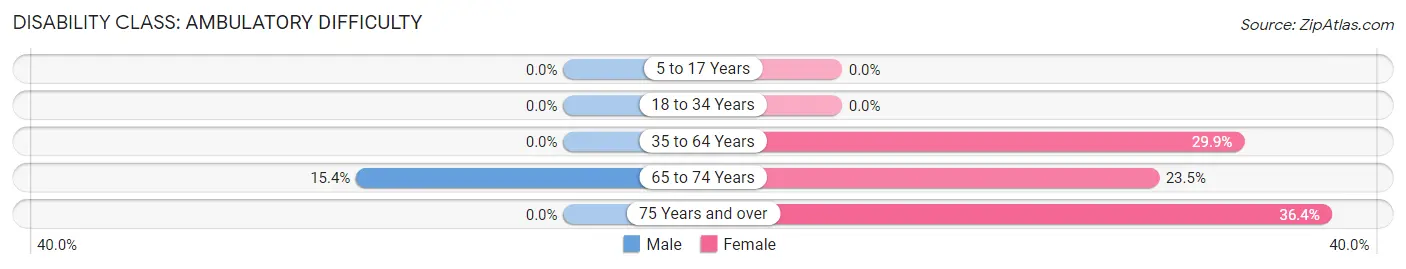
| Age Bracket | Male | Female |
| 5 to 17 Years | 0 (0.0%) | 0 (0.0%) |
| 18 to 34 Years | 0 (0.0%) | 0 (0.0%) |
| 35 to 64 Years | 0 (0.0%) | 23 (29.9%) |
| 65 to 74 Years | 4 (15.4%) | 8 (23.5%) |
| 75 Years and over | 0 (0.0%) | 12 (36.4%) |
Disability Class: Self-Care Difficulty
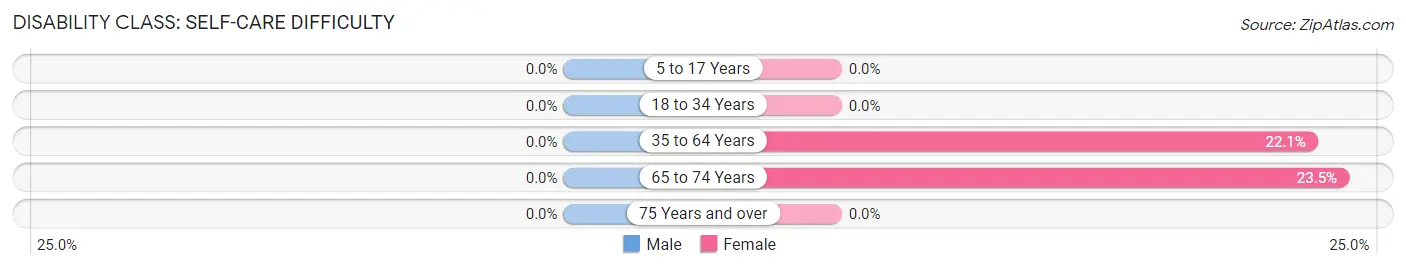
| Age Bracket | Male | Female |
| 5 to 17 Years | 0 (0.0%) | 0 (0.0%) |
| 18 to 34 Years | 0 (0.0%) | 0 (0.0%) |
| 35 to 64 Years | 0 (0.0%) | 17 (22.1%) |
| 65 to 74 Years | 0 (0.0%) | 8 (23.5%) |
| 75 Years and over | 0 (0.0%) | 0 (0.0%) |
Technology Access in Ekalaka
Computing Device Access in Ekalaka
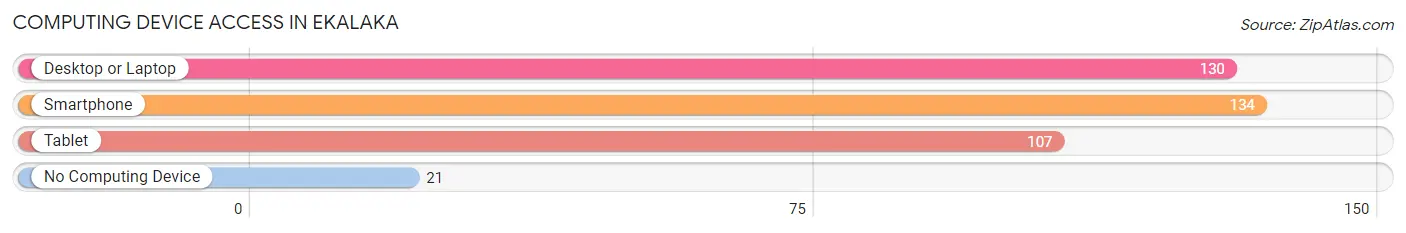
| Device Type | # Households | % Households |
| Desktop or Laptop | 130 | 60.2% |
| Smartphone | 134 | 62.0% |
| Tablet | 107 | 49.5% |
| No Computing Device | 21 | 9.7% |
| Total | 216 | 100.0% |
Internet Access in Ekalaka
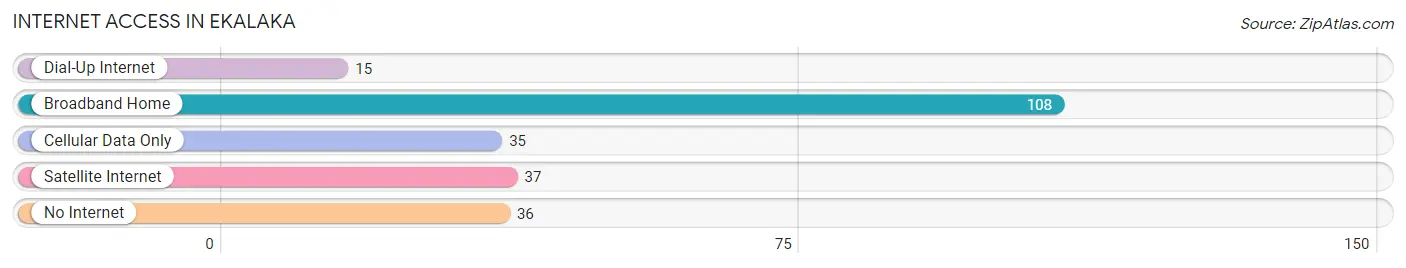
| Internet Type | # Households | % Households |
| Dial-Up Internet | 15 | 6.9% |
| Broadband Home | 108 | 50.0% |
| Cellular Data Only | 35 | 16.2% |
| Satellite Internet | 37 | 17.1% |
| No Internet | 36 | 16.7% |
| Total | 216 | 100.0% |
Ekalaka Summary
Ekalaka, Montana is a small town located in the southeastern corner of the state, near the Wyoming border. It is the county seat of Carter County and is home to a population of just over 500 people. The town was founded in 1884 and has a rich history of ranching, farming, and mining.
Geography
Ekalaka is located in the southeastern corner of Montana, near the Wyoming border. It is situated in the foothills of the Little Rocky Mountains, and is surrounded by rolling hills and prairies. The town is located at an elevation of 3,845 feet, and the surrounding area is mostly flat. The climate is semi-arid, with hot summers and cold winters.
Economy
Ekalaka’s economy is largely based on ranching and farming. The town is home to several ranches, and the surrounding area is used for grazing cattle and sheep. The town also has a small mining industry, with several mines in the area. The town is also home to several small businesses, including a grocery store, a hardware store, and a few restaurants.
Demographics
As of the 2010 census, Ekalaka had a population of 514 people. The racial makeup of the town was 97.3% White, 0.2% African American, 0.4% Native American, 0.2% Asian, 0.2% from other races, and 1.9% from two or more races. The median household income was $37,500, and the median family income was $41,250.
History
Ekalaka was founded in 1884 by a group of ranchers and miners. The town was named after a nearby creek, which was named after a Native American chief. The town quickly grew, and by the early 1900s it had become a bustling center of commerce. The town was home to several saloons, hotels, and stores.
In the early 1900s, Ekalaka was a major center for the mining industry. The town was home to several mines, and the surrounding area was used for grazing cattle and sheep. The town also had a thriving ranching industry, and the surrounding area was used for grazing cattle and sheep.
In the late 1900s, Ekalaka’s economy shifted away from mining and ranching, and the town began to focus more on tourism. The town is now home to several tourist attractions, including the Carter County Museum and the Ekalaka State Park.
Ekalaka is a small town with a rich history and a bright future. The town is home to a diverse population, and the surrounding area is used for ranching, farming, and mining. The town is also home to several tourist attractions, and is a great place to visit for those looking to explore the beauty of Montana.
Common Questions
What is Per Capita Income in Ekalaka?
Per Capita income in Ekalaka is $28,104.
What is the Median Family Income in Ekalaka?
Median Family Income in Ekalaka is $60,438.
What is the Median Household income in Ekalaka?
Median Household Income in Ekalaka is $28,750.
What is Income or Wage Gap in Ekalaka?
Income or Wage Gap in Ekalaka is 15.1%.
Women in Ekalaka earn 84.9 cents for every dollar earned by a man.
What is Inequality or Gini Index in Ekalaka?
Inequality or Gini Index in Ekalaka is 0.41.
What is the Total Population of Ekalaka?
Total Population of Ekalaka is 372.
What is the Total Male Population of Ekalaka?
Total Male Population of Ekalaka is 196.
What is the Total Female Population of Ekalaka?
Total Female Population of Ekalaka is 176.
What is the Ratio of Males per 100 Females in Ekalaka?
There are 111.36 Males per 100 Females in Ekalaka.
What is the Ratio of Females per 100 Males in Ekalaka?
There are 89.80 Females per 100 Males in Ekalaka.
What is the Median Population Age in Ekalaka?
Median Population Age in Ekalaka is 60.3 Years.
What is the Average Family Size in Ekalaka
Average Family Size in Ekalaka is 2.5 People.
What is the Average Household Size in Ekalaka
Average Household Size in Ekalaka is 1.6 People.
How Large is the Labor Force in Ekalaka?
There are 149 People in the Labor Forcein in Ekalaka.
What is the Percentage of People in the Labor Force in Ekalaka?
45.7% of People are in the Labor Force in Ekalaka.
What is the Unemployment Rate in Ekalaka?
Unemployment Rate in Ekalaka is 0.7%.