Dupuyer, MT Map & Demographics
Dupuyer Map
Dupuyer Overview
$30,597
PER CAPITA INCOME
$54,688
AVG FAMILY INCOME
$54,375
AVG HOUSEHOLD INCOME
0.32
INEQUALITY / GINI INDEX
116
TOTAL POPULATION
55
MALE POPULATION
61
FEMALE POPULATION
90.16
MALES / 100 FEMALES
110.91
FEMALES / 100 MALES
50.8
MEDIAN AGE
3.1
AVG FAMILY SIZE
2.6
AVG HOUSEHOLD SIZE
51
LABOR FORCE [ PEOPLE ]
53.1%
PERCENT IN LABOR FORCE
2.0%
UNEMPLOYMENT RATE
Dupuyer Zip Codes
Dupuyer Area Codes
Income in Dupuyer
Income Overview in Dupuyer
Per Capita Income in Dupuyer is $30,597, while median incomes of families and households are $54,688 and $54,375 respectively.
| Characteristic | Number | Measure |
| Per Capita Income | 116 | $30,597 |
| Median Family Income | 35 | $54,688 |
| Mean Family Income | 35 | $67,174 |
| Median Household Income | 44 | $54,375 |
| Mean Household Income | 44 | $69,970 |
| Income Deficit | 35 | $0 |
| Wage / Income Gap (%) | 116 | 0.00% |
| Wage / Income Gap ($) | 116 | 100.00¢ per $1 |
| Gini / Inequality Index | 116 | 0.32 |
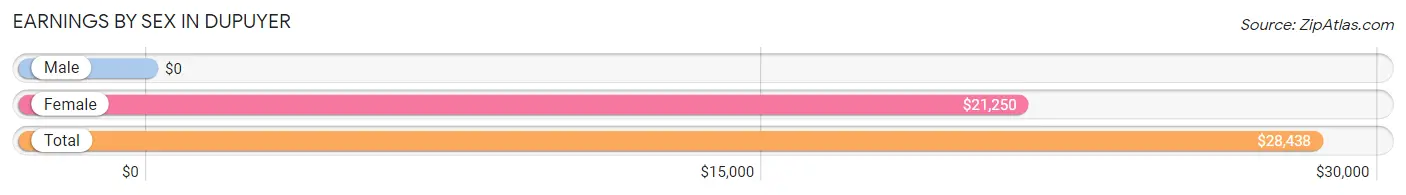
Earnings by Sex in Dupuyer
| Sex | Number | Average Earnings |
| Male | 35 (68.6%) | $0 |
| Female | 16 (31.4%) | $21,250 |
| Total | 51 (100.0%) | $28,438 |
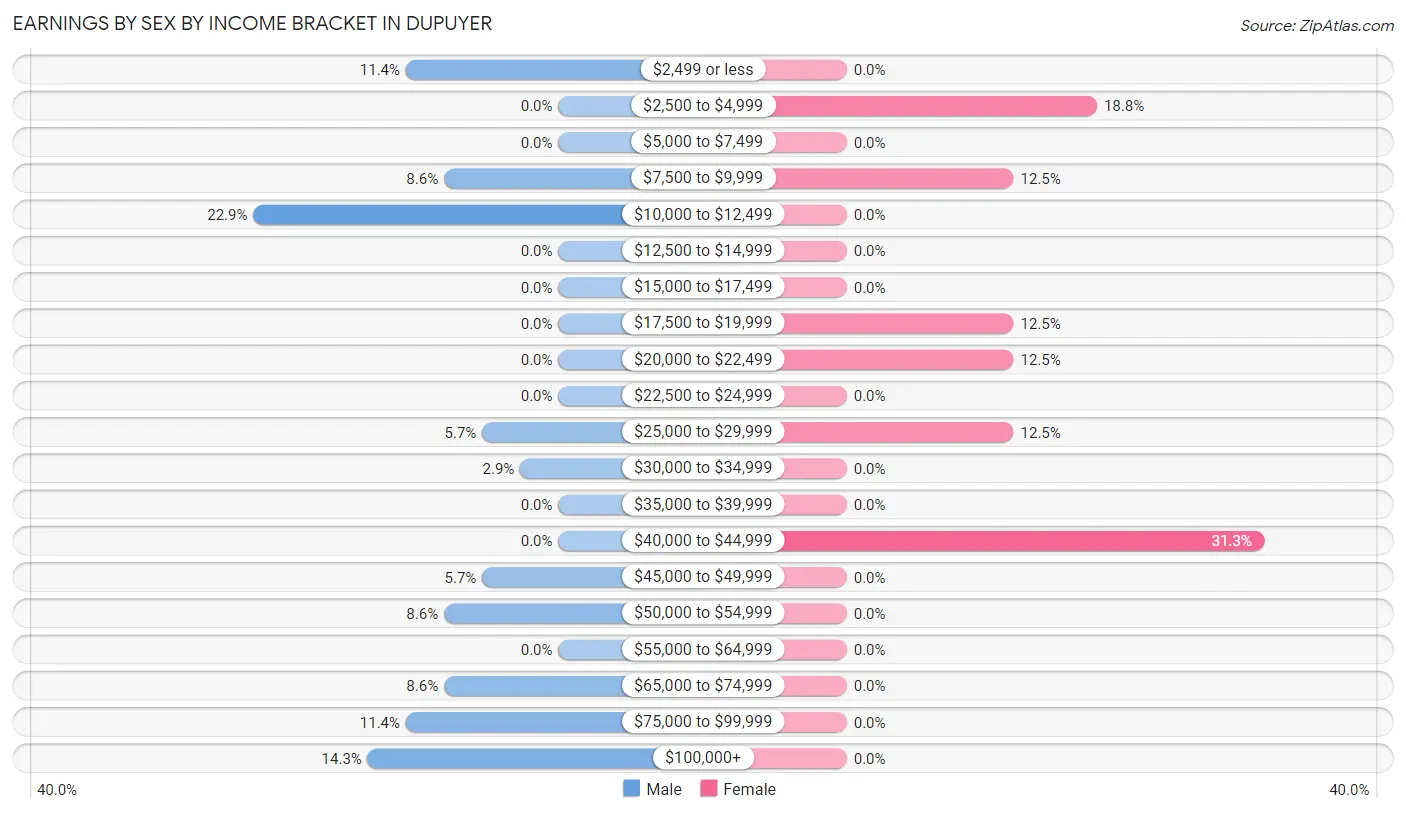
Earnings by Sex by Income Bracket in Dupuyer
The most common earnings brackets in Dupuyer are $10,000 to $12,499 for men (8 | 22.9%) and $40,000 to $44,999 for women (5 | 31.2%).
| Income | Male | Female |
| $2,499 or less | 4 (11.4%) | 0 (0.0%) |
| $2,500 to $4,999 | 0 (0.0%) | 3 (18.8%) |
| $5,000 to $7,499 | 0 (0.0%) | 0 (0.0%) |
| $7,500 to $9,999 | 3 (8.6%) | 2 (12.5%) |
| $10,000 to $12,499 | 8 (22.9%) | 0 (0.0%) |
| $12,500 to $14,999 | 0 (0.0%) | 0 (0.0%) |
| $15,000 to $17,499 | 0 (0.0%) | 0 (0.0%) |
| $17,500 to $19,999 | 0 (0.0%) | 2 (12.5%) |
| $20,000 to $22,499 | 0 (0.0%) | 2 (12.5%) |
| $22,500 to $24,999 | 0 (0.0%) | 0 (0.0%) |
| $25,000 to $29,999 | 2 (5.7%) | 2 (12.5%) |
| $30,000 to $34,999 | 1 (2.9%) | 0 (0.0%) |
| $35,000 to $39,999 | 0 (0.0%) | 0 (0.0%) |
| $40,000 to $44,999 | 0 (0.0%) | 5 (31.2%) |
| $45,000 to $49,999 | 2 (5.7%) | 0 (0.0%) |
| $50,000 to $54,999 | 3 (8.6%) | 0 (0.0%) |
| $55,000 to $64,999 | 0 (0.0%) | 0 (0.0%) |
| $65,000 to $74,999 | 3 (8.6%) | 0 (0.0%) |
| $75,000 to $99,999 | 4 (11.4%) | 0 (0.0%) |
| $100,000+ | 5 (14.3%) | 0 (0.0%) |
| Total | 35 (100.0%) | 16 (100.0%) |
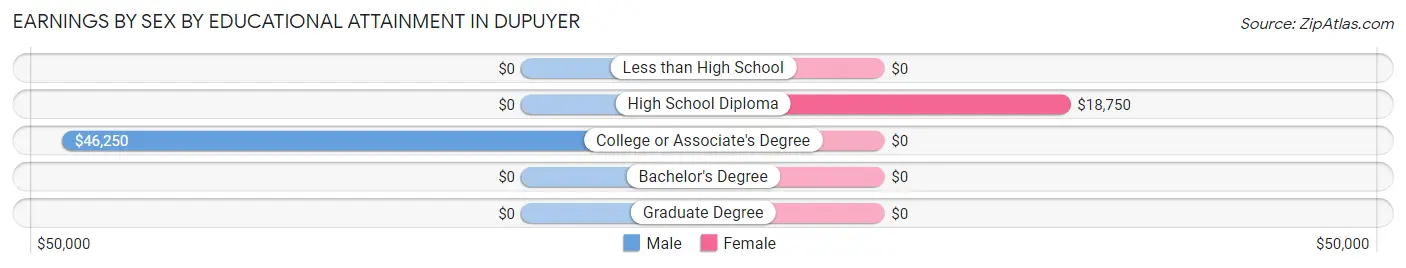
Earnings by Sex by Educational Attainment in Dupuyer
| Educational Attainment | Male Income | Female Income |
| Less than High School | - | - |
| High School Diploma | - | - |
| College or Associate's Degree | $46,250 | $0 |
| Bachelor's Degree | - | - |
| Graduate Degree | - | - |
| Total | - | - |
Family Income in Dupuyer
Family Income Brackets in Dupuyer
According to the Dupuyer family income data, there are 11 families falling into the $35,000 to $49,999 income range, which is the most common income bracket and makes up 31.4% of all families.
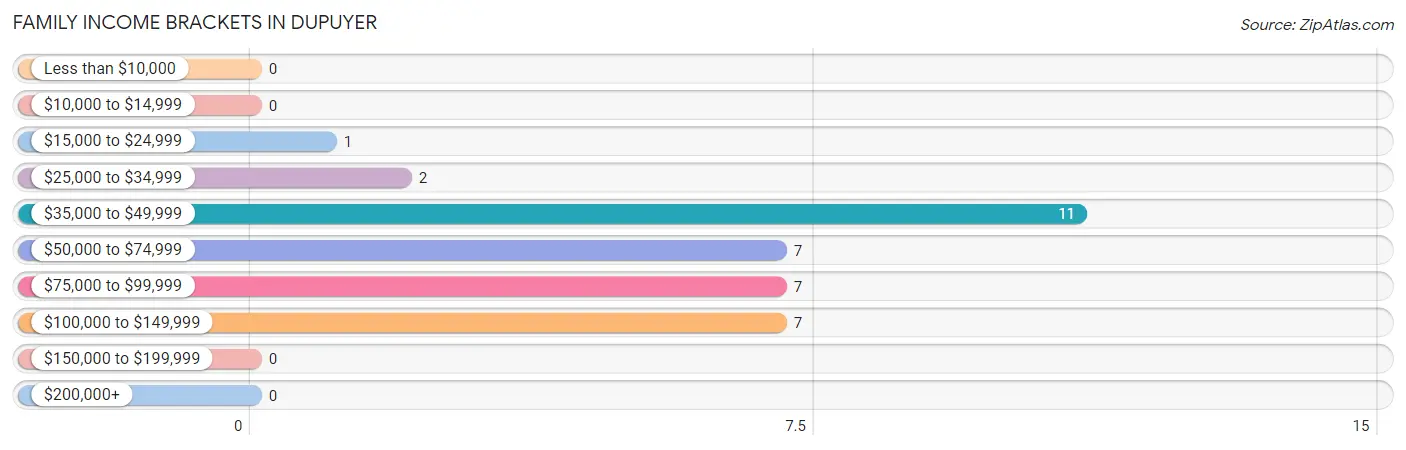
| Income Bracket | # Families | % Families |
| Less than $10,000 | 0 | 0.0% |
| $10,000 to $14,999 | 0 | 0.0% |
| $15,000 to $24,999 | 1 | 2.9% |
| $25,000 to $34,999 | 2 | 5.7% |
| $35,000 to $49,999 | 11 | 31.4% |
| $50,000 to $74,999 | 7 | 20.0% |
| $75,000 to $99,999 | 7 | 20.0% |
| $100,000 to $149,999 | 7 | 20.0% |
| $150,000 to $199,999 | 0 | 0.0% |
| $200,000+ | 0 | 0.0% |
Family Income by Famaliy Size in Dupuyer
2-person families (21 | 60.0%) account for the highest median family income in Dupuyer with $75,417 per family, while 2-person families (21 | 60.0%) have the highest median income of $37,708 per family member.
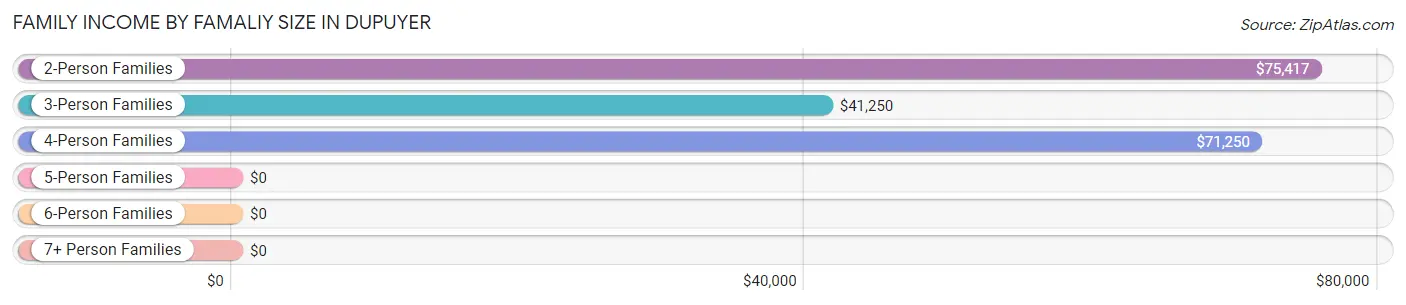
| Income Bracket | # Families | Median Income |
| 2-Person Families | 21 (60.0%) | $75,417 |
| 3-Person Families | 7 (20.0%) | $41,250 |
| 4-Person Families | 7 (20.0%) | $71,250 |
| 5-Person Families | 0 (0.0%) | $0 |
| 6-Person Families | 0 (0.0%) | $0 |
| 7+ Person Families | 0 (0.0%) | $0 |
| Total | 35 (100.0%) | $54,688 |
Family Income by Number of Earners in Dupuyer
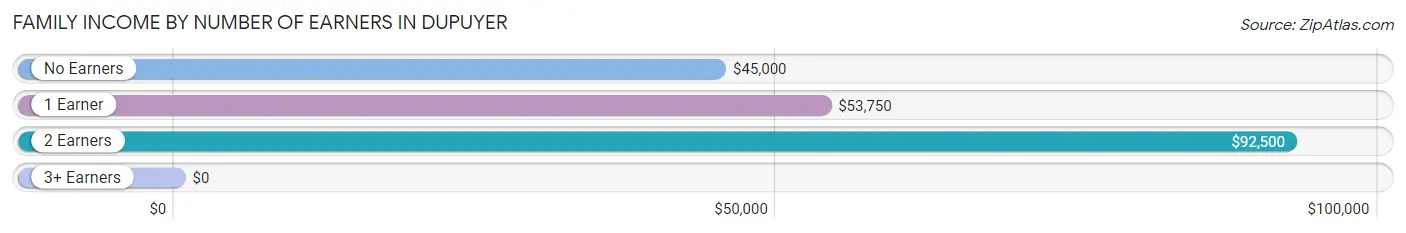
| Number of Earners | # Families | Median Income |
| No Earners | 10 (28.6%) | $45,000 |
| 1 Earner | 16 (45.7%) | $53,750 |
| 2 Earners | 8 (22.9%) | $92,500 |
| 3+ Earners | 1 (2.9%) | $0 |
| Total | 35 (100.0%) | $54,688 |
Household Income in Dupuyer
Household Income Brackets in Dupuyer
With 11 households falling in the category, the $35,000 to $49,999 income range is the most frequent in Dupuyer, accounting for 25.0% of all households.
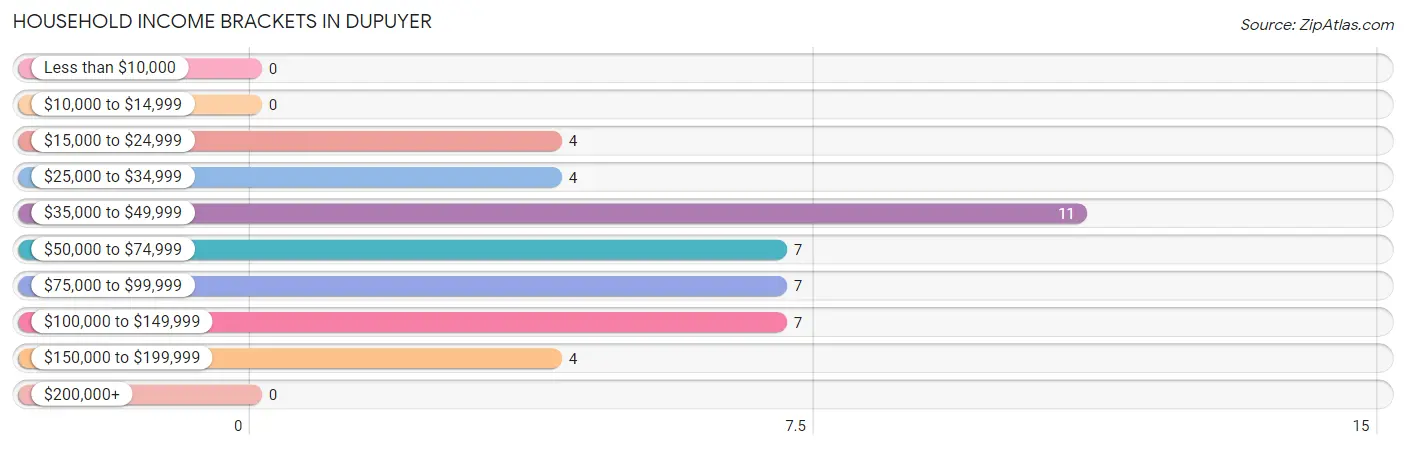
| Income Bracket | # Households | % Households |
| Less than $10,000 | 0 | 0.0% |
| $10,000 to $14,999 | 0 | 0.0% |
| $15,000 to $24,999 | 4 | 9.1% |
| $25,000 to $34,999 | 4 | 9.1% |
| $35,000 to $49,999 | 11 | 25.0% |
| $50,000 to $74,999 | 7 | 15.9% |
| $75,000 to $99,999 | 7 | 15.9% |
| $100,000 to $149,999 | 7 | 15.9% |
| $150,000 to $199,999 | 4 | 9.1% |
| $200,000+ | 0 | 0.0% |
Household Income by Householder Age in Dupuyer
The median household income in Dupuyer is $54,375, with the highest median household income of $71,250 found in the 25 to 44 years age bracket for the primary householder. A total of 7 households (15.9%) fall into this category.
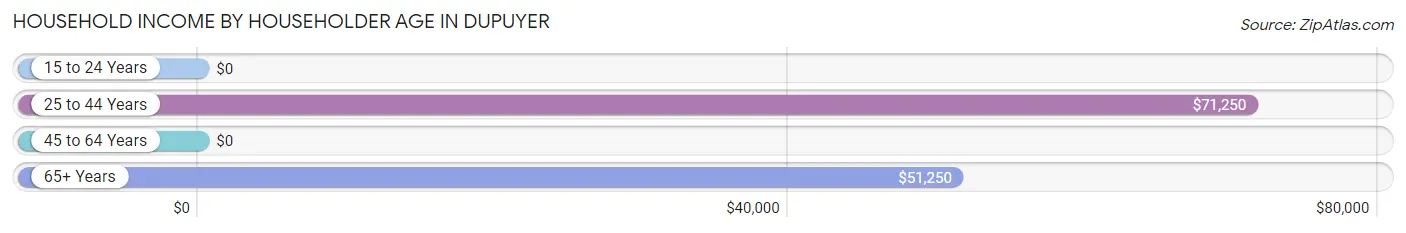
| Income Bracket | # Households | Median Income |
| 15 to 24 Years | 0 (0.0%) | $0 |
| 25 to 44 Years | 7 (15.9%) | $71,250 |
| 45 to 64 Years | 17 (38.6%) | $0 |
| 65+ Years | 20 (45.5%) | $51,250 |
| Total | 44 (100.0%) | $54,375 |
Poverty in Dupuyer
Income Below Poverty by Sex and Age in Dupuyer
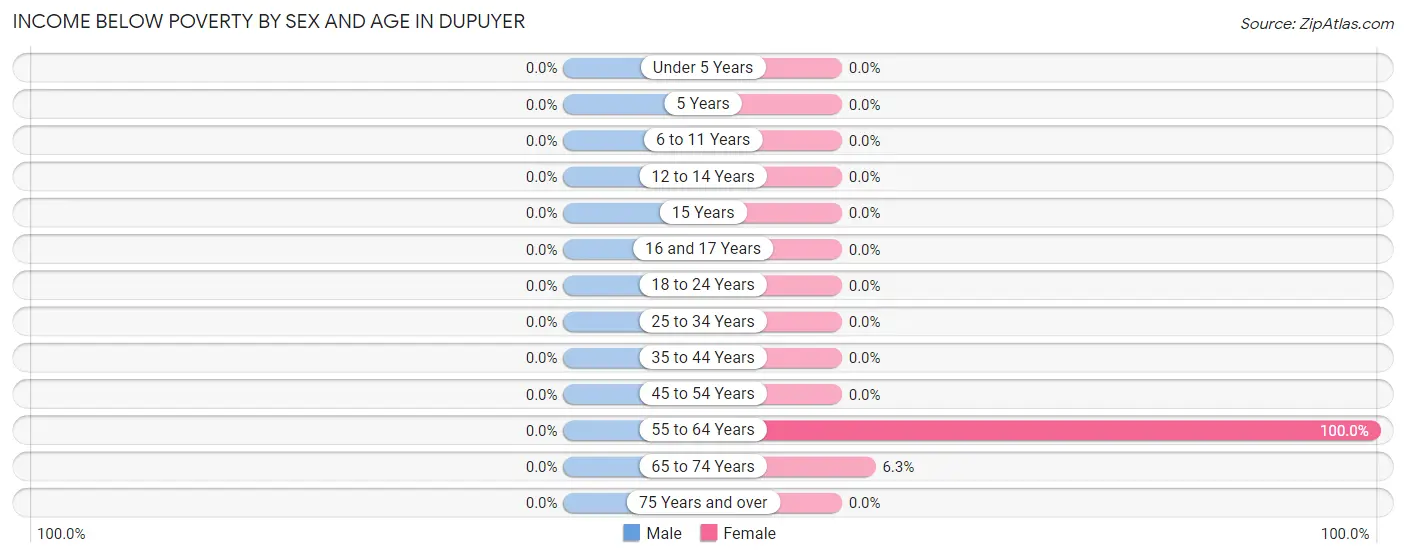
| Age Bracket | Male | Female |
| Under 5 Years | 0 (0.0%) | 0 (0.0%) |
| 5 Years | 0 (0.0%) | 0 (0.0%) |
| 6 to 11 Years | 0 (0.0%) | 0 (0.0%) |
| 12 to 14 Years | 0 (0.0%) | 0 (0.0%) |
| 15 Years | 0 (0.0%) | 0 (0.0%) |
| 16 and 17 Years | 0 (0.0%) | 0 (0.0%) |
| 18 to 24 Years | 0 (0.0%) | 0 (0.0%) |
| 25 to 34 Years | 0 (0.0%) | 0 (0.0%) |
| 35 to 44 Years | 0 (0.0%) | 0 (0.0%) |
| 45 to 54 Years | 0 (0.0%) | 0 (0.0%) |
| 55 to 64 Years | 0 (0.0%) | 3 (100.0%) |
| 65 to 74 Years | 0 (0.0%) | 1 (6.2%) |
| 75 Years and over | 0 (0.0%) | 0 (0.0%) |
| Total | 0 (0.0%) | 4 (6.6%) |
Income Above Poverty by Sex and Age in Dupuyer
According to the poverty statistics in Dupuyer, males aged under 5 years and females aged under 5 years are the age groups that are most secure financially, with 100.0% of males and 100.0% of females in these age groups living above the poverty line.
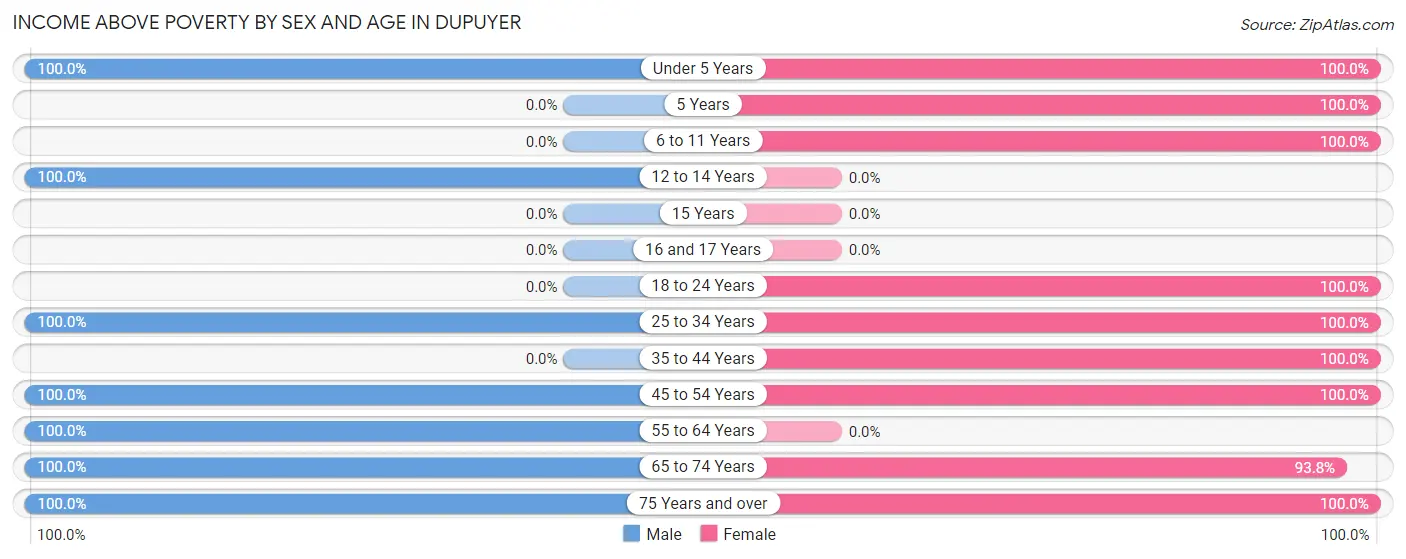
| Age Bracket | Male | Female |
| Under 5 Years | 5 (100.0%) | 3 (100.0%) |
| 5 Years | 0 (0.0%) | 4 (100.0%) |
| 6 to 11 Years | 0 (0.0%) | 4 (100.0%) |
| 12 to 14 Years | 4 (100.0%) | 0 (0.0%) |
| 15 Years | 0 (0.0%) | 0 (0.0%) |
| 16 and 17 Years | 0 (0.0%) | 0 (0.0%) |
| 18 to 24 Years | 0 (0.0%) | 10 (100.0%) |
| 25 to 34 Years | 6 (100.0%) | 4 (100.0%) |
| 35 to 44 Years | 0 (0.0%) | 3 (100.0%) |
| 45 to 54 Years | 9 (100.0%) | 7 (100.0%) |
| 55 to 64 Years | 7 (100.0%) | 0 (0.0%) |
| 65 to 74 Years | 12 (100.0%) | 15 (93.8%) |
| 75 Years and over | 12 (100.0%) | 7 (100.0%) |
| Total | 55 (100.0%) | 57 (93.4%) |
Income Below Poverty Among Married-Couple Families in Dupuyer
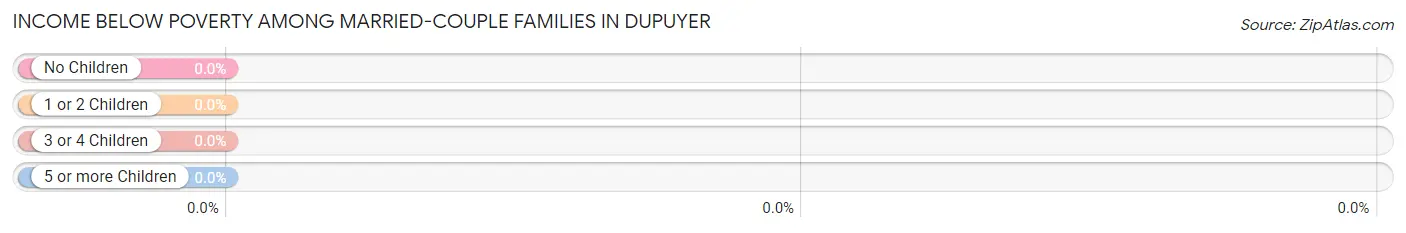
| Children | Above Poverty | Below Poverty |
| No Children | 16 (100.0%) | 0 (0.0%) |
| 1 or 2 Children | 8 (100.0%) | 0 (0.0%) |
| 3 or 4 Children | 0 (0.0%) | 0 (0.0%) |
| 5 or more Children | 0 (0.0%) | 0 (0.0%) |
| Total | 24 (100.0%) | 0 (0.0%) |
Income Below Poverty Among Single-Parent Households in Dupuyer
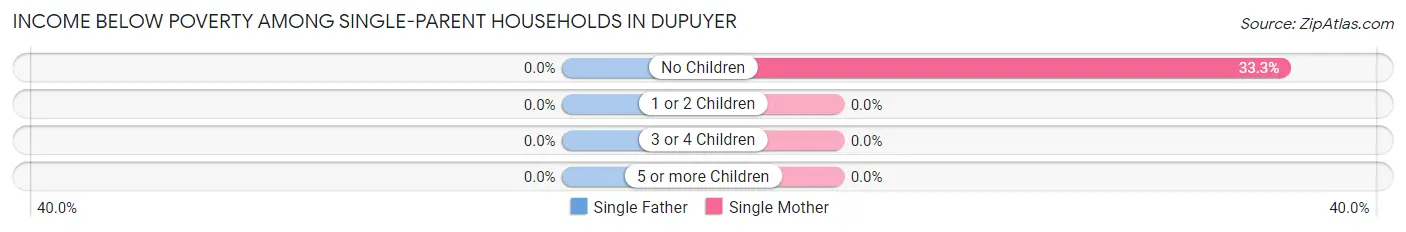
| Children | Single Father | Single Mother |
| No Children | 0 (0.0%) | 1 (33.3%) |
| 1 or 2 Children | 0 (0.0%) | 0 (0.0%) |
| 3 or 4 Children | 0 (0.0%) | 0 (0.0%) |
| 5 or more Children | 0 (0.0%) | 0 (0.0%) |
| Total | 0 (0.0%) | 1 (12.5%) |
Income Below Poverty Among Married-Couple vs Single-Parent Households in Dupuyer
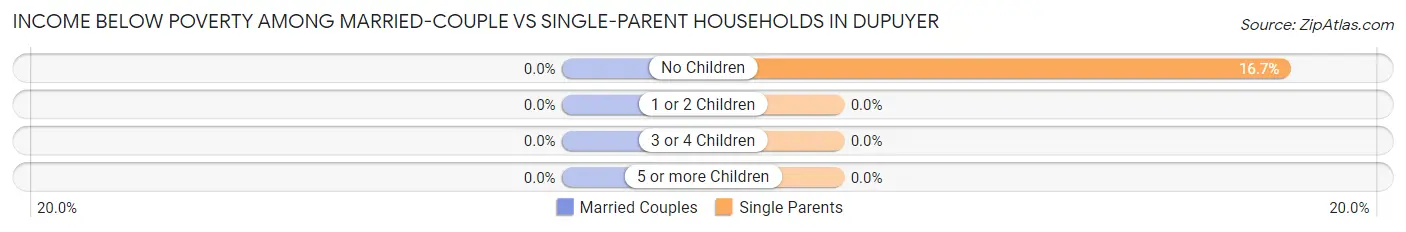
| Children | Married-Couple Families | Single-Parent Households |
| No Children | 0 (0.0%) | 1 (16.7%) |
| 1 or 2 Children | 0 (0.0%) | 0 (0.0%) |
| 3 or 4 Children | 0 (0.0%) | 0 (0.0%) |
| 5 or more Children | 0 (0.0%) | 0 (0.0%) |
| Total | 0 (0.0%) | 1 (9.1%) |
Race in Dupuyer
The most populous races in Dupuyer are White / Caucasian (85 | 73.3%), Native / Alaskan (31 | 26.7%), and Hispanic or Latino (15 | 12.9%).
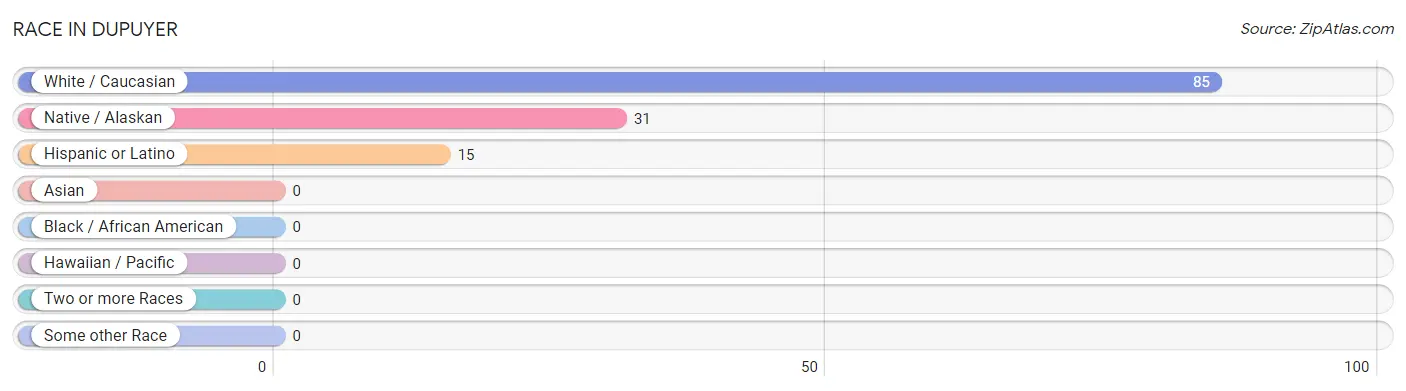
| Race | # Population | % Population |
| Asian | 0 | 0.0% |
| Black / African American | 0 | 0.0% |
| Hawaiian / Pacific | 0 | 0.0% |
| Hispanic or Latino | 15 | 12.9% |
| Native / Alaskan | 31 | 26.7% |
| White / Caucasian | 85 | 73.3% |
| Two or more Races | 0 | 0.0% |
| Some other Race | 0 | 0.0% |
| Total | 116 | 100.0% |
Ancestry in Dupuyer
The most populous ancestries reported in Dupuyer are Blackfeet (23 | 19.8%), Irish (19 | 16.4%), English (16 | 13.8%), German (16 | 13.8%), and Mexican (15 | 12.9%), together accounting for 76.7% of all Dupuyer residents.
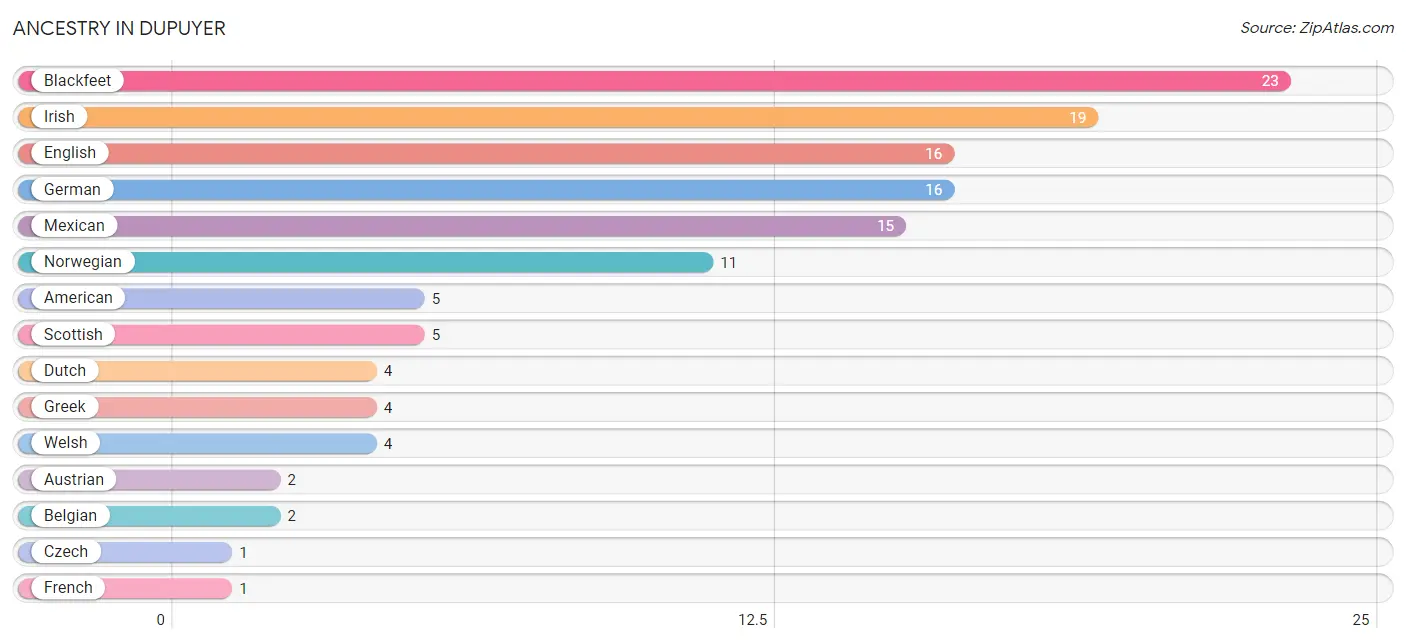
| Ancestry | # Population | % Population |
| American | 5 | 4.3% |
| Austrian | 2 | 1.7% |
| Belgian | 2 | 1.7% |
| Blackfeet | 23 | 19.8% |
| Czech | 1 | 0.9% |
| Dutch | 4 | 3.5% |
| English | 16 | 13.8% |
| French | 1 | 0.9% |
| German | 16 | 13.8% |
| Greek | 4 | 3.5% |
| Irish | 19 | 16.4% |
| Mexican | 15 | 12.9% |
| Norwegian | 11 | 9.5% |
| Scottish | 5 | 4.3% |
| Welsh | 4 | 3.5% | View All 15 Rows |
Immigrants in Dupuyer
The most numerous immigrant groups reported in Dupuyer came from Central America (5 | 4.3%), Latin America (5 | 4.3%), and Mexico (5 | 4.3%), together accounting for 12.9% of all Dupuyer residents.
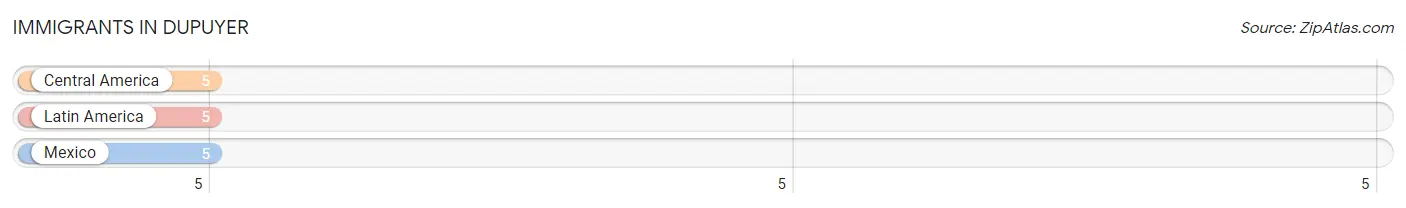
| Immigration Origin | # Population | % Population |
| Central America | 5 | 4.3% |
| Latin America | 5 | 4.3% |
| Mexico | 5 | 4.3% | View All 3 Rows |
Sex and Age in Dupuyer
Sex and Age in Dupuyer
The most populous age groups in Dupuyer are 65 to 69 Years (9 | 16.4%) for men and 70 to 74 Years (13 | 21.3%) for women.
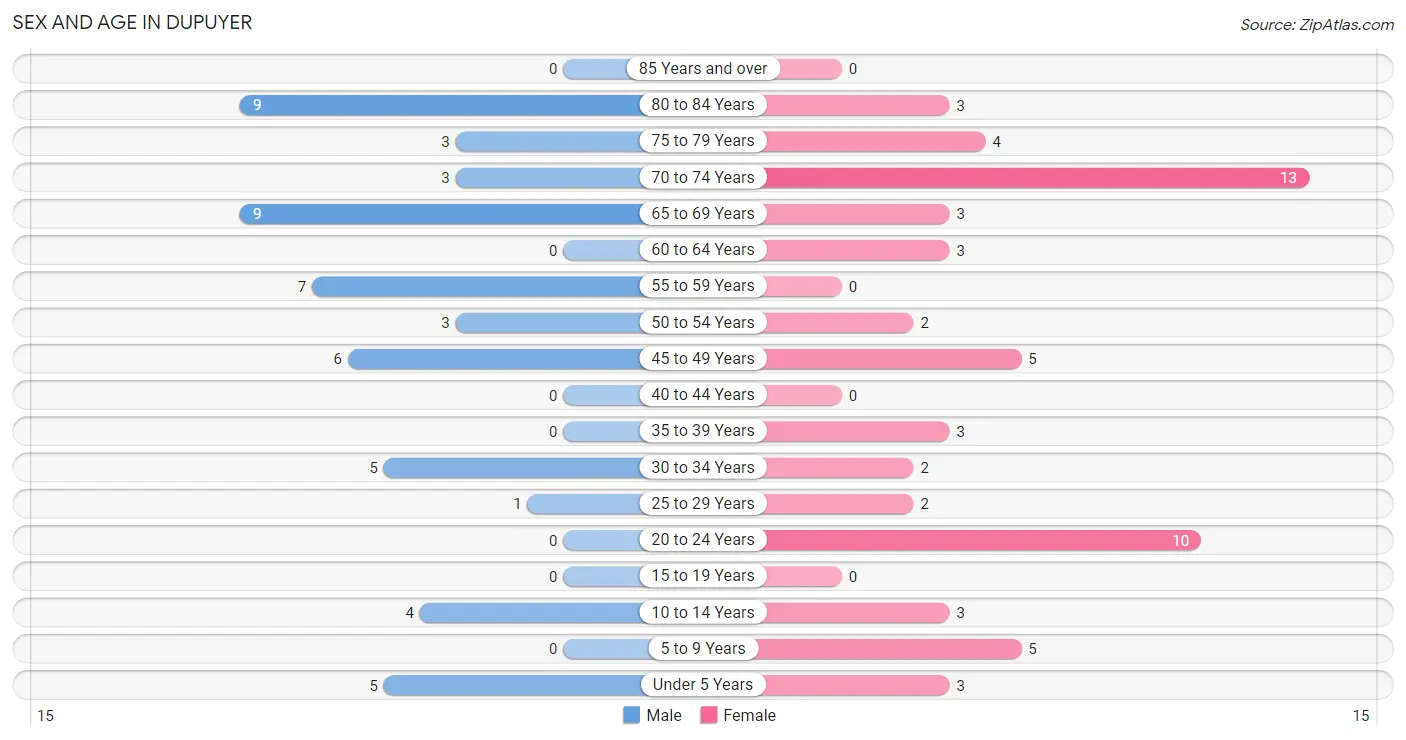
| Age Bracket | Male | Female |
| Under 5 Years | 5 (9.1%) | 3 (4.9%) |
| 5 to 9 Years | 0 (0.0%) | 5 (8.2%) |
| 10 to 14 Years | 4 (7.3%) | 3 (4.9%) |
| 15 to 19 Years | 0 (0.0%) | 0 (0.0%) |
| 20 to 24 Years | 0 (0.0%) | 10 (16.4%) |
| 25 to 29 Years | 1 (1.8%) | 2 (3.3%) |
| 30 to 34 Years | 5 (9.1%) | 2 (3.3%) |
| 35 to 39 Years | 0 (0.0%) | 3 (4.9%) |
| 40 to 44 Years | 0 (0.0%) | 0 (0.0%) |
| 45 to 49 Years | 6 (10.9%) | 5 (8.2%) |
| 50 to 54 Years | 3 (5.4%) | 2 (3.3%) |
| 55 to 59 Years | 7 (12.7%) | 0 (0.0%) |
| 60 to 64 Years | 0 (0.0%) | 3 (4.9%) |
| 65 to 69 Years | 9 (16.4%) | 3 (4.9%) |
| 70 to 74 Years | 3 (5.4%) | 13 (21.3%) |
| 75 to 79 Years | 3 (5.4%) | 4 (6.6%) |
| 80 to 84 Years | 9 (16.4%) | 3 (4.9%) |
| 85 Years and over | 0 (0.0%) | 0 (0.0%) |
| Total | 55 (100.0%) | 61 (100.0%) |
Families and Households in Dupuyer
Median Family Size in Dupuyer
The median family size in Dupuyer is 3.06 persons per family, with single female/mother families (8 | 22.9%) accounting for the largest median family size of 3.75 persons per family. On the other hand, single male/father families (3 | 8.6%) represent the smallest median family size with 2.67 persons per family.
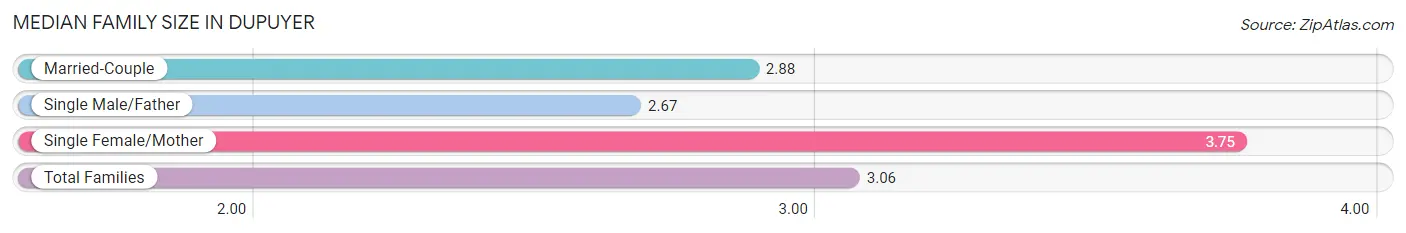
| Family Type | # Families | Family Size |
| Married-Couple | 24 (68.6%) | 2.88 |
| Single Male/Father | 3 (8.6%) | 2.67 |
| Single Female/Mother | 8 (22.9%) | 3.75 |
| Total Families | 35 (100.0%) | 3.06 |
Median Household Size in Dupuyer
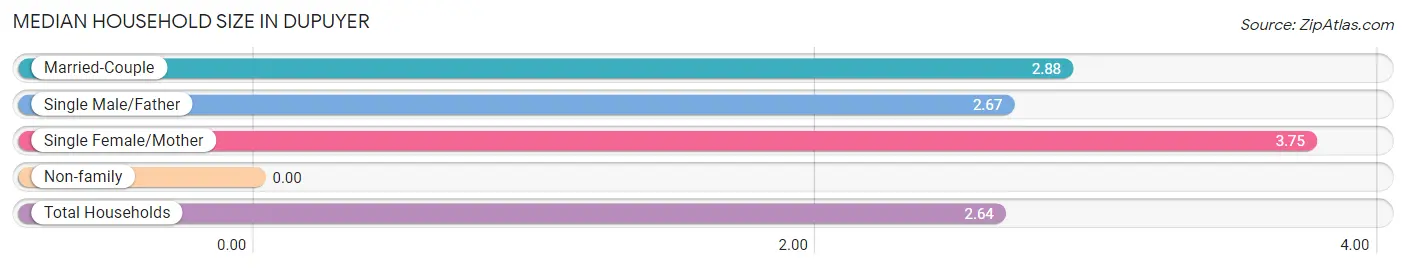
| Household Type | # Households | Household Size |
| Married-Couple | 24 (54.5%) | 2.88 |
| Single Male/Father | 3 (6.8%) | 2.67 |
| Single Female/Mother | 8 (18.2%) | 3.75 |
| Non-family | 9 (20.4%) | - |
| Total Households | 44 (100.0%) | 2.64 |
Household Size by Marriage Status in Dupuyer
Out of a total of 44 households in Dupuyer, 35 (79.5%) are family households, while 9 (20.4%) are nonfamily households. The most numerous type of family households are 2-person households, comprising 21, and the most common type of nonfamily households are 1-person households, comprising 9.
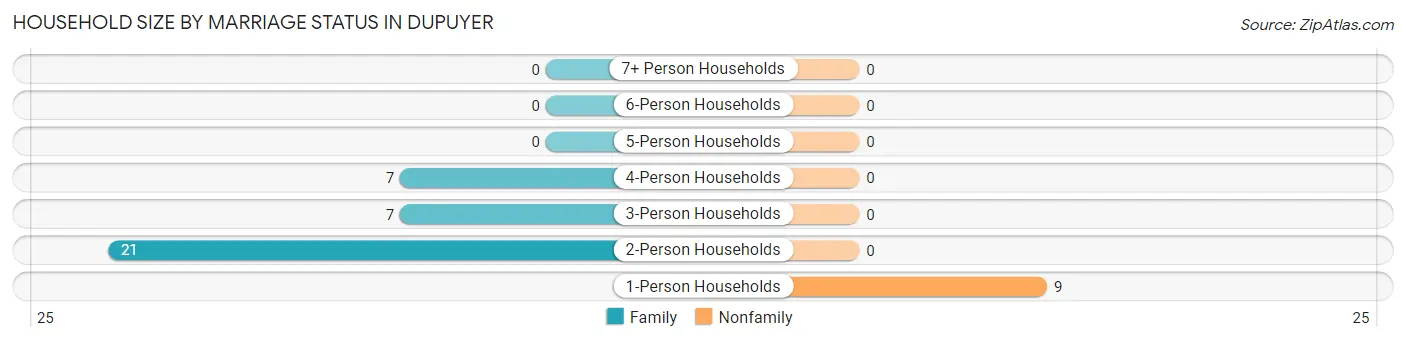
| Household Size | Family Households | Nonfamily Households |
| 1-Person Households | - | 9 (20.4%) |
| 2-Person Households | 21 (47.7%) | 0 (0.0%) |
| 3-Person Households | 7 (15.9%) | 0 (0.0%) |
| 4-Person Households | 7 (15.9%) | 0 (0.0%) |
| 5-Person Households | 0 (0.0%) | 0 (0.0%) |
| 6-Person Households | 0 (0.0%) | 0 (0.0%) |
| 7+ Person Households | 0 (0.0%) | 0 (0.0%) |
| Total | 35 (79.5%) | 9 (20.4%) |
Female Fertility in Dupuyer
Fertility by Age in Dupuyer
| Age Bracket | Women with Births | Births / 1,000 Women |
| 15 to 19 years | 0 (0.0%) | 0.0 |
| 20 to 34 years | 0 (0.0%) | 0.0 |
| 35 to 50 years | 0 (0.0%) | 0.0 |
| Total | 0 (0.0%) | 0.0 |
Fertility by Age by Marriage Status in Dupuyer
| Age Bracket | Married | Unmarried |
| 15 to 19 years | 0 (0.0%) | 0 (0.0%) |
| 20 to 34 years | 0 (0.0%) | 0 (0.0%) |
| 35 to 50 years | 0 (0.0%) | 0 (0.0%) |
| Total | 0 (0.0%) | 0 (0.0%) |
Fertility by Education in Dupuyer
| Educational Attainment | Women with Births | Births / 1,000 Women |
| Less than High School | 0 (0.0%) | 0.0 |
| High School Diploma | 0 (0.0%) | 0.0 |
| College or Associate's Degree | 0 (0.0%) | 0.0 |
| Bachelor's Degree | 0 (0.0%) | 0.0 |
| Graduate Degree | 0 (0.0%) | 0.0 |
| Total | 0 (0.0%) | 0.0 |
Fertility by Education by Marriage Status in Dupuyer
| Educational Attainment | Married | Unmarried |
| Less than High School | 0 (0.0%) | 0 (0.0%) |
| High School Diploma | 0 (0.0%) | 0 (0.0%) |
| College or Associate's Degree | 0 (0.0%) | 0 (0.0%) |
| Bachelor's Degree | 0 (0.0%) | 0 (0.0%) |
| Graduate Degree | 0 (0.0%) | 0 (0.0%) |
| Total | 0 (0.0%) | 0 (0.0%) |
Employment Characteristics in Dupuyer
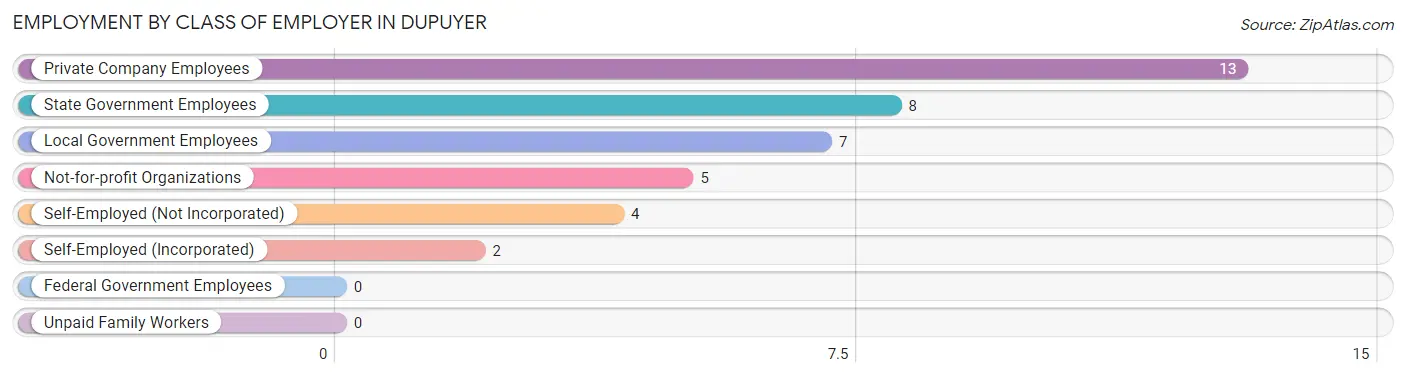
Employment by Class of Employer in Dupuyer
Among the 39 employed individuals in Dupuyer, private company employees (13 | 33.3%), state government employees (8 | 20.5%), and local government employees (7 | 17.9%) make up the most common classes of employment.
| Employer Class | # Employees | % Employees |
| Private Company Employees | 13 | 33.3% |
| Self-Employed (Incorporated) | 2 | 5.1% |
| Self-Employed (Not Incorporated) | 4 | 10.3% |
| Not-for-profit Organizations | 5 | 12.8% |
| Local Government Employees | 7 | 17.9% |
| State Government Employees | 8 | 20.5% |
| Federal Government Employees | 0 | 0.0% |
| Unpaid Family Workers | 0 | 0.0% |
| Total | 39 | 100.0% |
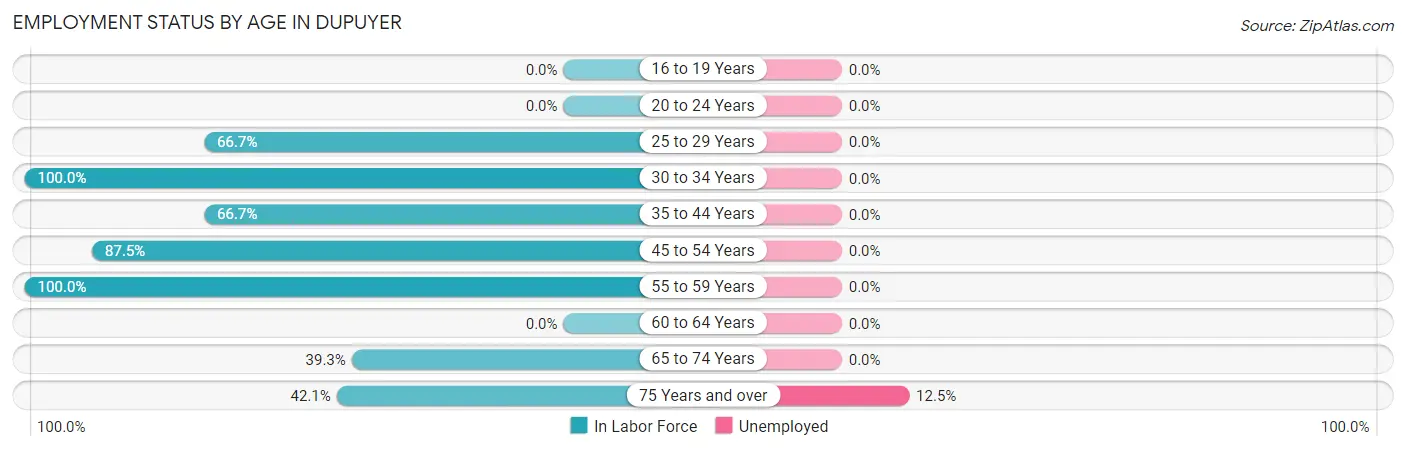
Employment Status by Age in Dupuyer
According to the labor force statistics for Dupuyer, out of the total population over 16 years of age (96), 53.1% or 51 individuals are in the labor force, with 2.0% or 1 of them unemployed. The age group with the highest labor force participation rate is 30 to 34 years, with 100.0% or 7 individuals in the labor force. Within the labor force, the 75 years and over age range has the highest percentage of unemployed individuals, with 12.5% or 1 of them being unemployed.
| Age Bracket | In Labor Force | Unemployed |
| 16 to 19 Years | 0 (0.0%) | 0 (0.0%) |
| 20 to 24 Years | 0 (0.0%) | 0 (0.0%) |
| 25 to 29 Years | 2 (66.7%) | 0 (0.0%) |
| 30 to 34 Years | 7 (100.0%) | 0 (0.0%) |
| 35 to 44 Years | 2 (66.7%) | 0 (0.0%) |
| 45 to 54 Years | 14 (87.5%) | 0 (0.0%) |
| 55 to 59 Years | 7 (100.0%) | 0 (0.0%) |
| 60 to 64 Years | 0 (0.0%) | 0 (0.0%) |
| 65 to 74 Years | 11 (39.3%) | 0 (0.0%) |
| 75 Years and over | 8 (42.1%) | 1 (12.5%) |
| Total | 51 (53.1%) | 1 (2.0%) |
Employment Status by Educational Attainment in Dupuyer
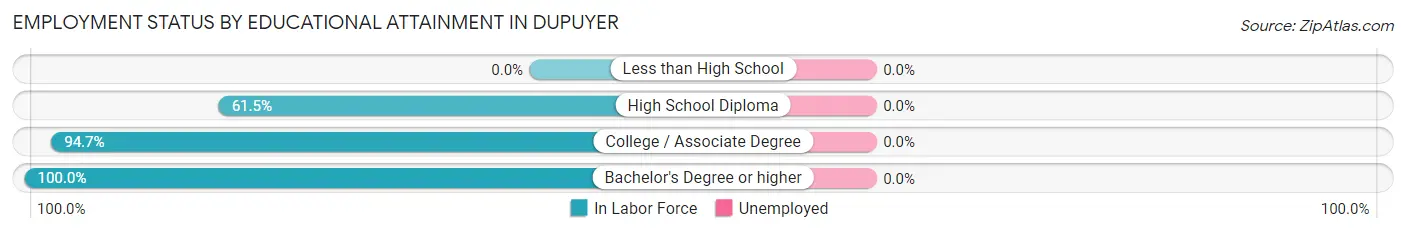
| Educational Attainment | In Labor Force | Unemployed |
| Less than High School | 0 (0.0%) | 0 (0.0%) |
| High School Diploma | 8 (61.5%) | 0 (0.0%) |
| College / Associate Degree | 18 (94.7%) | 0 (0.0%) |
| Bachelor's Degree or higher | 6 (100.0%) | 0 (0.0%) |
| Total | 32 (82.1%) | 0 (0.0%) |
Employment Occupations by Sex in Dupuyer
Management, Business, Science and Arts Occupations
The most common Management, Business, Science and Arts occupations in Dupuyer are , and Management (13 | 26.0%).
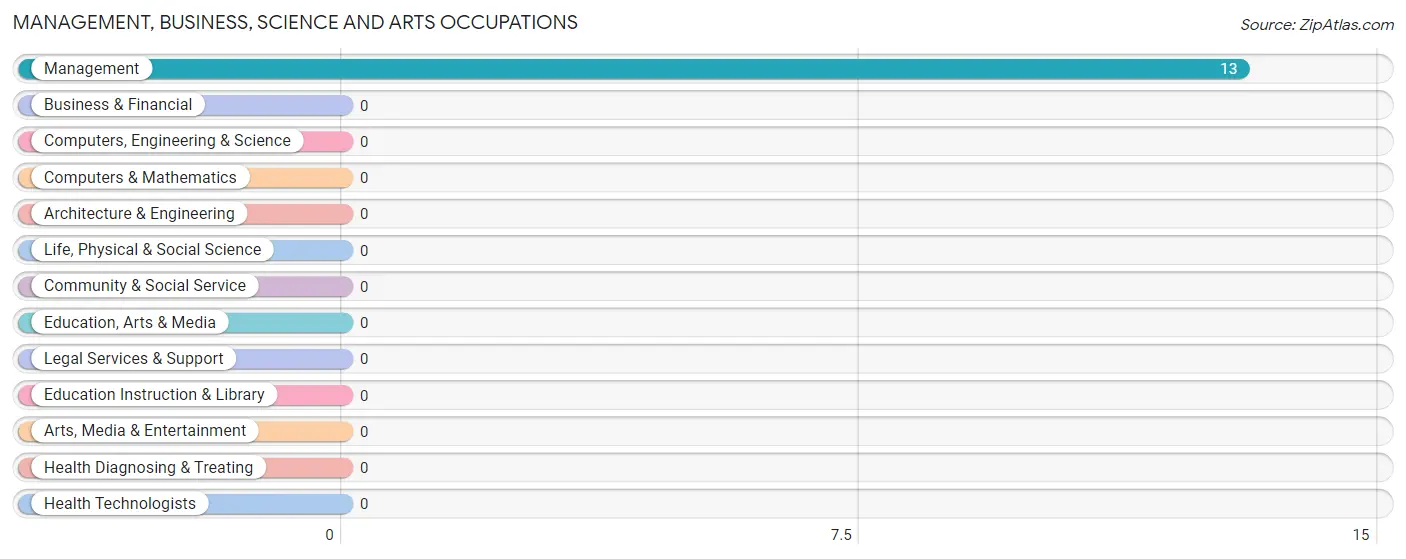
Management, Business, Science and Arts Occupations by Sex
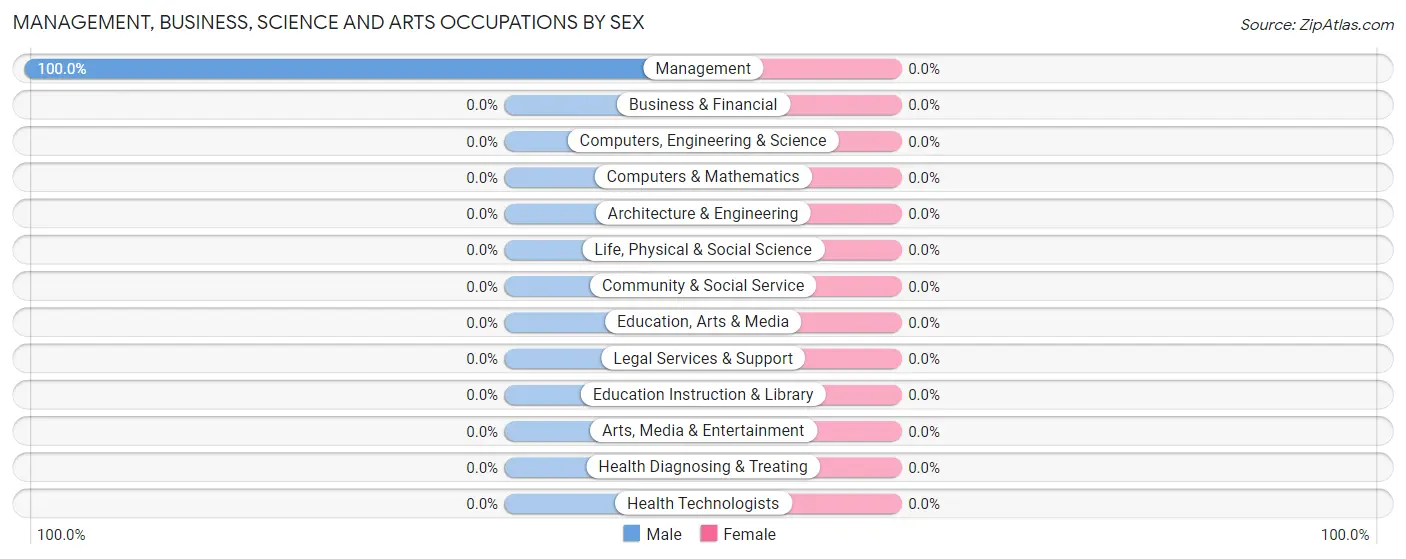
| Occupation | Male | Female |
| Management | 13 (100.0%) | 0 (0.0%) |
| Business & Financial | 0 (0.0%) | 0 (0.0%) |
| Computers, Engineering & Science | 0 (0.0%) | 0 (0.0%) |
| Computers & Mathematics | 0 (0.0%) | 0 (0.0%) |
| Architecture & Engineering | 0 (0.0%) | 0 (0.0%) |
| Life, Physical & Social Science | 0 (0.0%) | 0 (0.0%) |
| Community & Social Service | 0 (0.0%) | 0 (0.0%) |
| Education, Arts & Media | 0 (0.0%) | 0 (0.0%) |
| Legal Services & Support | 0 (0.0%) | 0 (0.0%) |
| Education Instruction & Library | 0 (0.0%) | 0 (0.0%) |
| Arts, Media & Entertainment | 0 (0.0%) | 0 (0.0%) |
| Health Diagnosing & Treating | 0 (0.0%) | 0 (0.0%) |
| Health Technologists | 0 (0.0%) | 0 (0.0%) |
| Total (Category) | 13 (100.0%) | 0 (0.0%) |
| Total (Overall) | 34 (68.0%) | 16 (32.0%) |
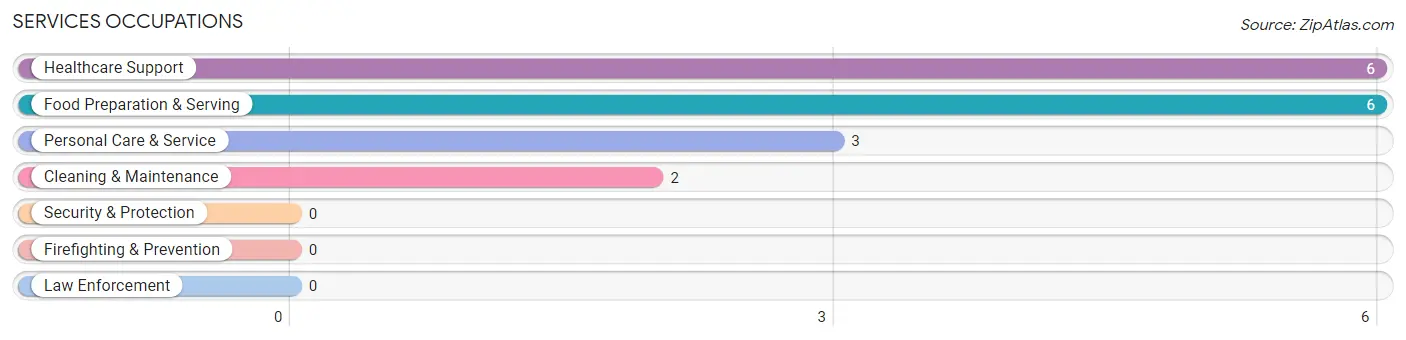
Services Occupations
The most common Services occupations in Dupuyer are Healthcare Support (6 | 12.0%), Food Preparation & Serving (6 | 12.0%), Personal Care & Service (3 | 6.0%), and Cleaning & Maintenance (2 | 4.0%).
Services Occupations by Sex
Within the Services occupations in Dupuyer, the most male-oriented occupations are Personal Care & Service (100.0%), and Healthcare Support (33.3%), while the most female-oriented occupations are Food Preparation & Serving (100.0%), Cleaning & Maintenance (100.0%), and Healthcare Support (66.7%).
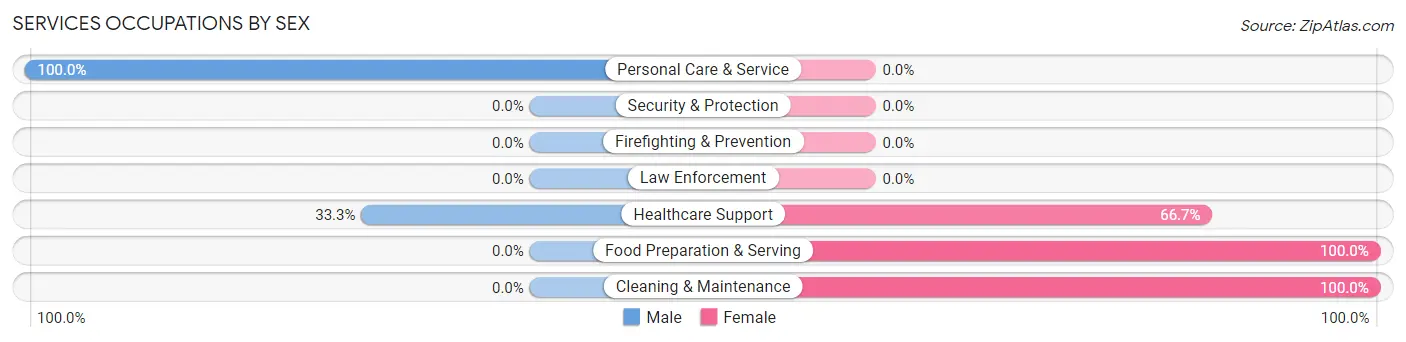
| Occupation | Male | Female |
| Healthcare Support | 2 (33.3%) | 4 (66.7%) |
| Security & Protection | 0 (0.0%) | 0 (0.0%) |
| Firefighting & Prevention | 0 (0.0%) | 0 (0.0%) |
| Law Enforcement | 0 (0.0%) | 0 (0.0%) |
| Food Preparation & Serving | 0 (0.0%) | 6 (100.0%) |
| Cleaning & Maintenance | 0 (0.0%) | 2 (100.0%) |
| Personal Care & Service | 3 (100.0%) | 0 (0.0%) |
| Total (Category) | 5 (29.4%) | 12 (70.6%) |
| Total (Overall) | 34 (68.0%) | 16 (32.0%) |
Sales and Office Occupations
The most common Sales and Office occupations in Dupuyer are , and Office & Administration (2 | 4.0%).
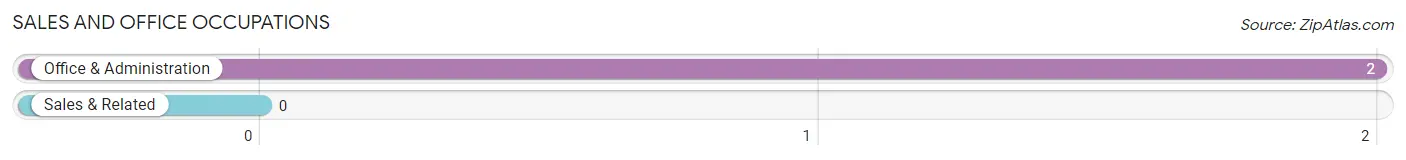
Sales and Office Occupations by Sex
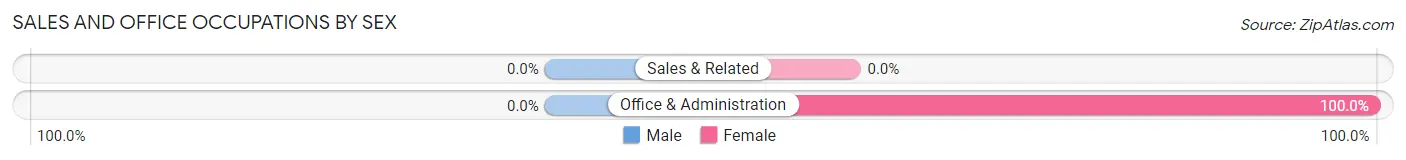
| Occupation | Male | Female |
| Sales & Related | 0 (0.0%) | 0 (0.0%) |
| Office & Administration | 0 (0.0%) | 2 (100.0%) |
| Total (Category) | 0 (0.0%) | 2 (100.0%) |
| Total (Overall) | 34 (68.0%) | 16 (32.0%) |
Natural Resources, Construction and Maintenance Occupations
The most common Natural Resources, Construction and Maintenance occupations in Dupuyer are , and Construction & Extraction (7 | 14.0%).
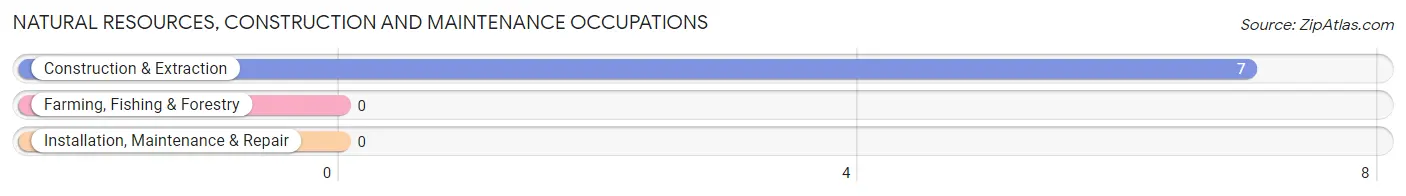
Natural Resources, Construction and Maintenance Occupations by Sex
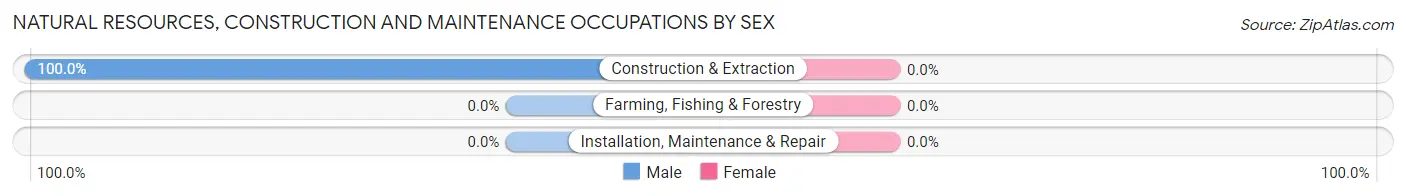
| Occupation | Male | Female |
| Farming, Fishing & Forestry | 0 (0.0%) | 0 (0.0%) |
| Construction & Extraction | 7 (100.0%) | 0 (0.0%) |
| Installation, Maintenance & Repair | 0 (0.0%) | 0 (0.0%) |
| Total (Category) | 7 (100.0%) | 0 (0.0%) |
| Total (Overall) | 34 (68.0%) | 16 (32.0%) |
Production, Transportation and Moving Occupations
The most common Production, Transportation and Moving occupations in Dupuyer are Material Moving (7 | 14.0%), and Transportation (4 | 8.0%).
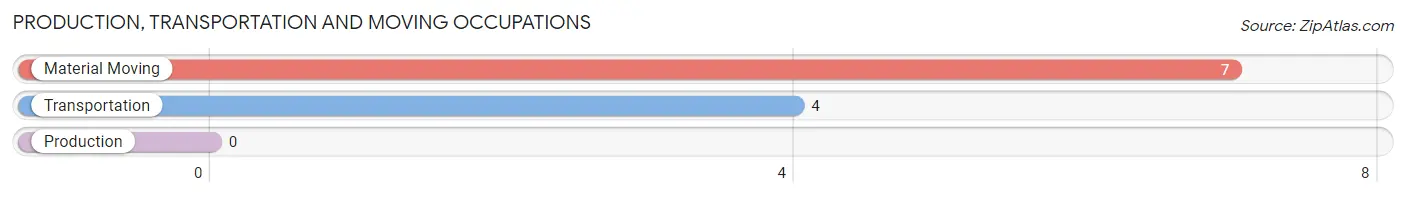
Production, Transportation and Moving Occupations by Sex
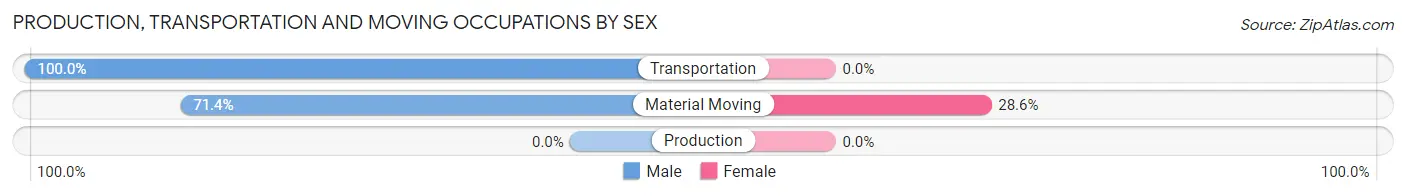
| Occupation | Male | Female |
| Production | 0 (0.0%) | 0 (0.0%) |
| Transportation | 4 (100.0%) | 0 (0.0%) |
| Material Moving | 5 (71.4%) | 2 (28.6%) |
| Total (Category) | 9 (81.8%) | 2 (18.2%) |
| Total (Overall) | 34 (68.0%) | 16 (32.0%) |
Employment Industries by Sex in Dupuyer
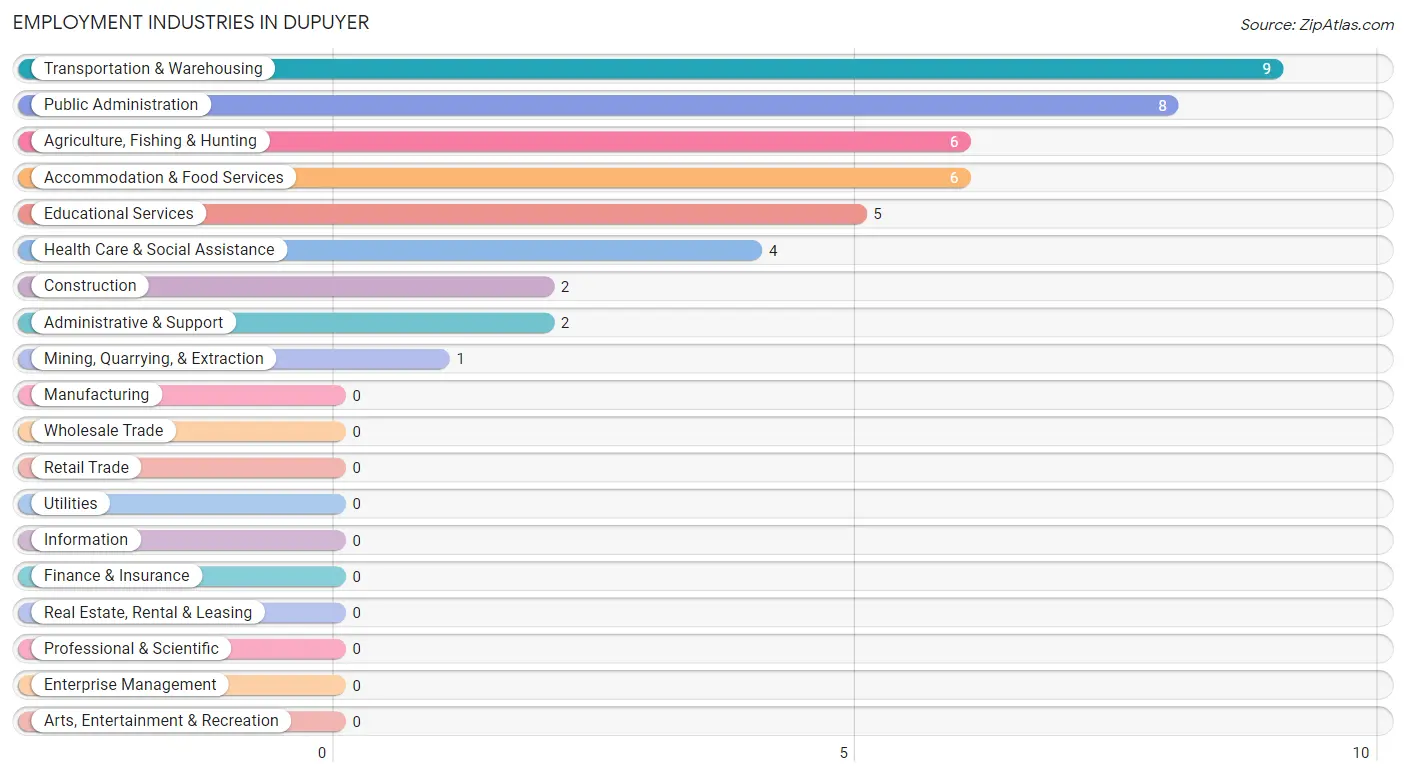
Employment Industries in Dupuyer
The major employment industries in Dupuyer include Transportation & Warehousing (9 | 18.0%), Public Administration (8 | 16.0%), Agriculture, Fishing & Hunting (6 | 12.0%), Accommodation & Food Services (6 | 12.0%), and Educational Services (5 | 10.0%).
Employment Industries by Sex in Dupuyer
The Dupuyer industries that see more men than women are Agriculture, Fishing & Hunting (100.0%), Mining, Quarrying, & Extraction (100.0%), and Construction (100.0%), whereas the industries that tend to have a higher number of women are Administrative & Support (100.0%), Accommodation & Food Services (100.0%), and Health Care & Social Assistance (50.0%).
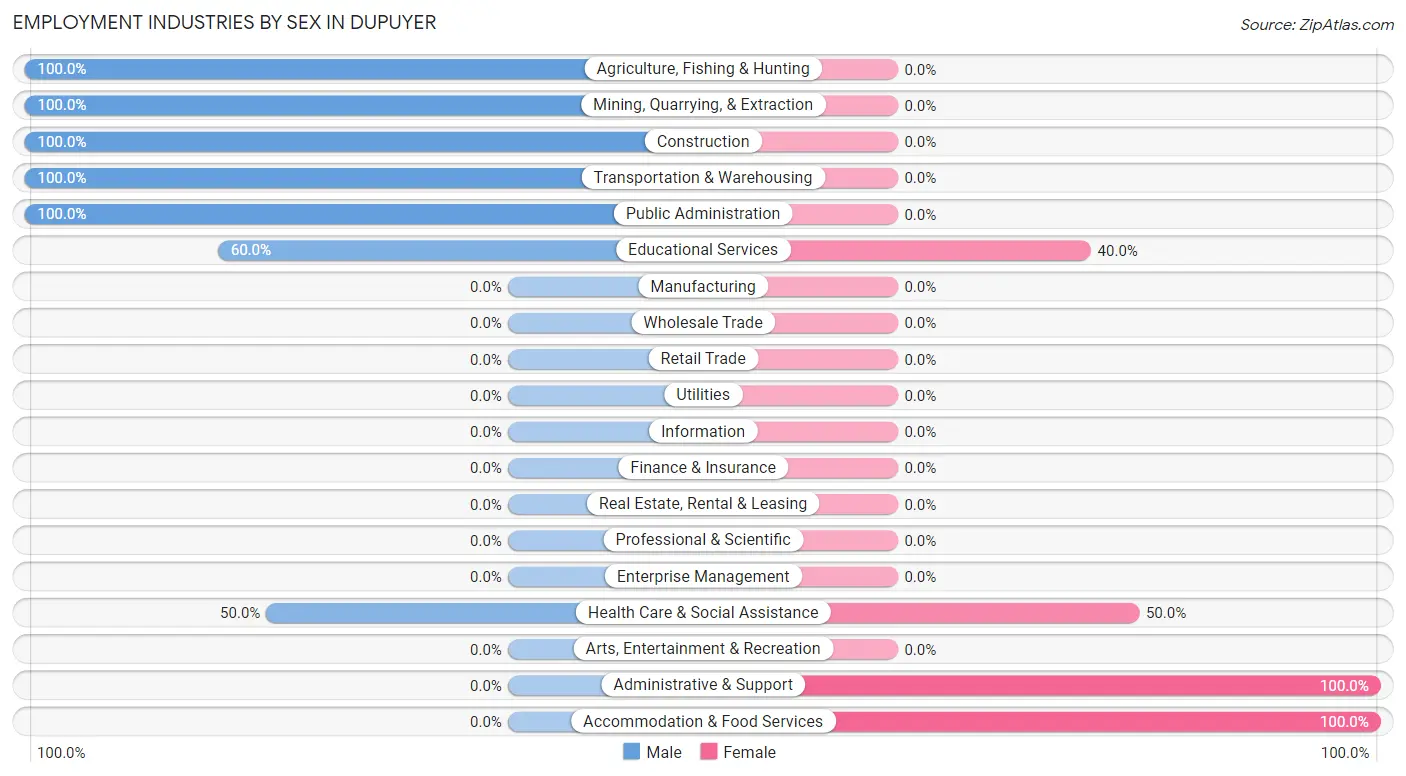
| Industry | Male | Female |
| Agriculture, Fishing & Hunting | 6 (100.0%) | 0 (0.0%) |
| Mining, Quarrying, & Extraction | 1 (100.0%) | 0 (0.0%) |
| Construction | 2 (100.0%) | 0 (0.0%) |
| Manufacturing | 0 (0.0%) | 0 (0.0%) |
| Wholesale Trade | 0 (0.0%) | 0 (0.0%) |
| Retail Trade | 0 (0.0%) | 0 (0.0%) |
| Transportation & Warehousing | 9 (100.0%) | 0 (0.0%) |
| Utilities | 0 (0.0%) | 0 (0.0%) |
| Information | 0 (0.0%) | 0 (0.0%) |
| Finance & Insurance | 0 (0.0%) | 0 (0.0%) |
| Real Estate, Rental & Leasing | 0 (0.0%) | 0 (0.0%) |
| Professional & Scientific | 0 (0.0%) | 0 (0.0%) |
| Enterprise Management | 0 (0.0%) | 0 (0.0%) |
| Administrative & Support | 0 (0.0%) | 2 (100.0%) |
| Educational Services | 3 (60.0%) | 2 (40.0%) |
| Health Care & Social Assistance | 2 (50.0%) | 2 (50.0%) |
| Arts, Entertainment & Recreation | 0 (0.0%) | 0 (0.0%) |
| Accommodation & Food Services | 0 (0.0%) | 6 (100.0%) |
| Public Administration | 8 (100.0%) | 0 (0.0%) |
| Total | 34 (68.0%) | 16 (32.0%) |
Education in Dupuyer
School Enrollment in Dupuyer
The most common levels of schooling among the 12 students in Dupuyer are kindergarten (4 | 33.3%), elementary school (4 | 33.3%), and middle school (4 | 33.3%).
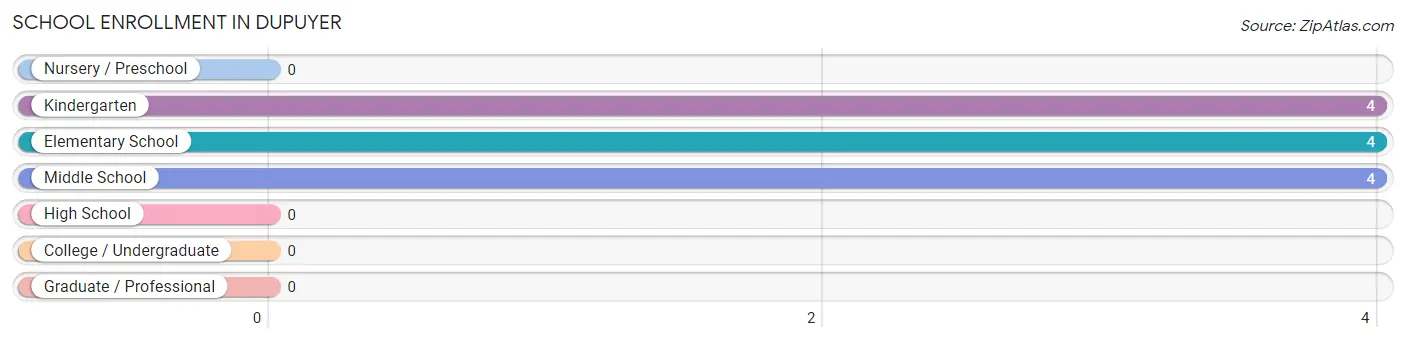
| School Level | # Students | % Students |
| Nursery / Preschool | 0 | 0.0% |
| Kindergarten | 4 | 33.3% |
| Elementary School | 4 | 33.3% |
| Middle School | 4 | 33.3% |
| High School | 0 | 0.0% |
| College / Undergraduate | 0 | 0.0% |
| Graduate / Professional | 0 | 0.0% |
| Total | 12 | 100.0% |
School Enrollment by Age by Funding Source in Dupuyer
Out of a total of 12 students who are enrolled in schools in Dupuyer, 2 (16.7%) attend a private institution, while the remaining 10 (83.3%) are enrolled in public schools. The age group of 5 to 9 year old has the highest likelihood of being enrolled in private schools, with 1 (20.0% in the age bracket) enrolled. Conversely, the age group of 10 to 14 year olds has the lowest likelihood of being enrolled in a private school, with 6 (85.7% in the age bracket) attending a public institution.
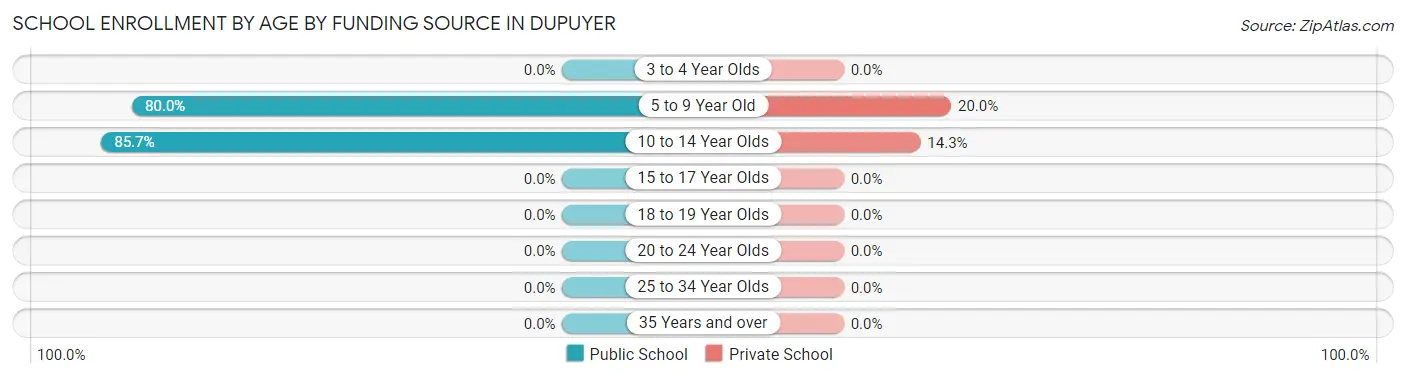
| Age Bracket | Public School | Private School |
| 3 to 4 Year Olds | 0 (0.0%) | 0 (0.0%) |
| 5 to 9 Year Old | 4 (80.0%) | 1 (20.0%) |
| 10 to 14 Year Olds | 6 (85.7%) | 1 (14.3%) |
| 15 to 17 Year Olds | 0 (0.0%) | 0 (0.0%) |
| 18 to 19 Year Olds | 0 (0.0%) | 0 (0.0%) |
| 20 to 24 Year Olds | 0 (0.0%) | 0 (0.0%) |
| 25 to 34 Year Olds | 0 (0.0%) | 0 (0.0%) |
| 35 Years and over | 0 (0.0%) | 0 (0.0%) |
| Total | 10 (83.3%) | 2 (16.7%) |
Educational Attainment by Field of Study in Dupuyer
Education (5 | 55.6%), bio, nature & agricultural (3 | 33.3%), and physical & health sciences (1 | 11.1%) are the most common fields of study among 9 individuals in Dupuyer who have obtained a bachelor's degree or higher.
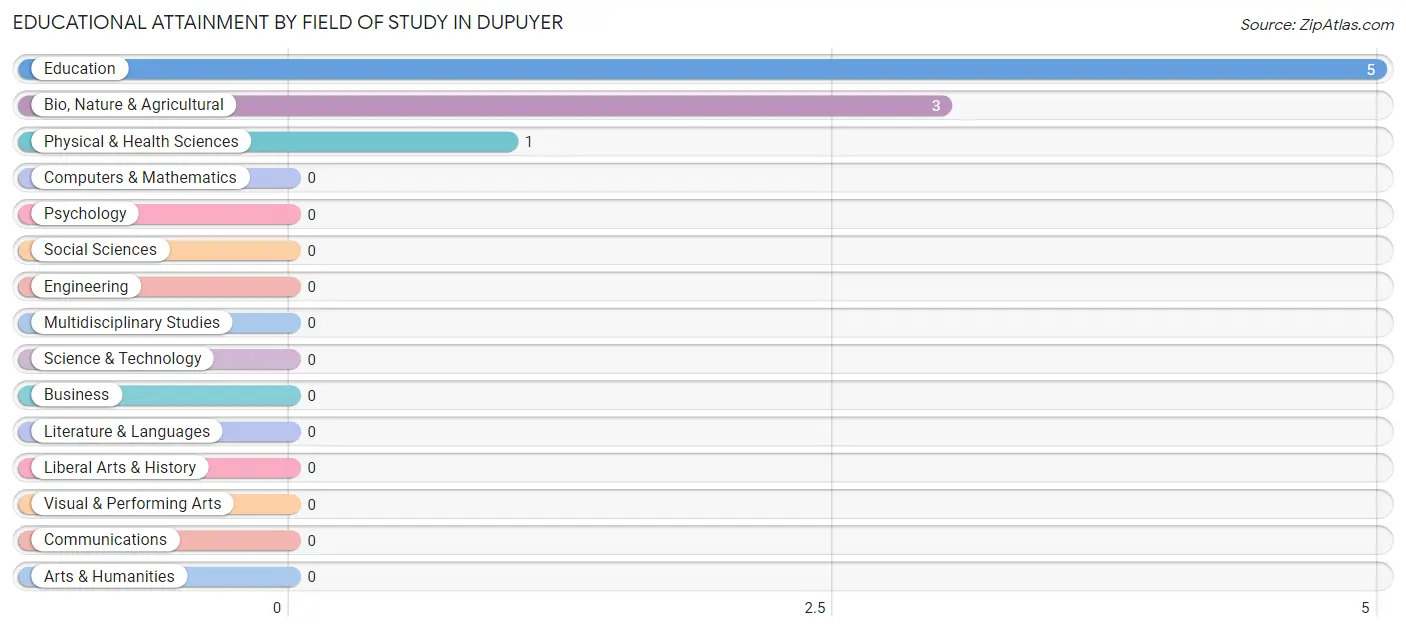
| Field of Study | # Graduates | % Graduates |
| Computers & Mathematics | 0 | 0.0% |
| Bio, Nature & Agricultural | 3 | 33.3% |
| Physical & Health Sciences | 1 | 11.1% |
| Psychology | 0 | 0.0% |
| Social Sciences | 0 | 0.0% |
| Engineering | 0 | 0.0% |
| Multidisciplinary Studies | 0 | 0.0% |
| Science & Technology | 0 | 0.0% |
| Business | 0 | 0.0% |
| Education | 5 | 55.6% |
| Literature & Languages | 0 | 0.0% |
| Liberal Arts & History | 0 | 0.0% |
| Visual & Performing Arts | 0 | 0.0% |
| Communications | 0 | 0.0% |
| Arts & Humanities | 0 | 0.0% |
| Total | 9 | 100.0% |
Transportation & Commute in Dupuyer
Vehicle Availability by Sex in Dupuyer
The most prevalent vehicle ownership categories in Dupuyer are males with 2 vehicles (8, accounting for 32.0%) and females with 2 vehicles (10, making up 57.1%).
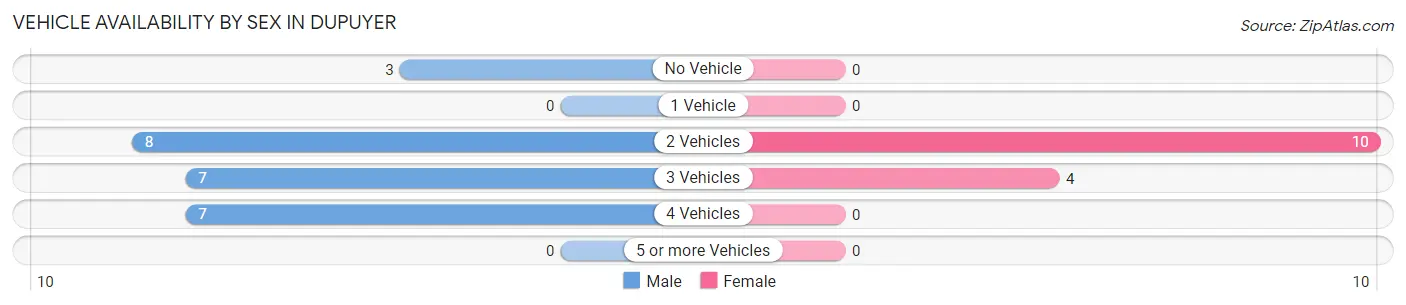
| Vehicles Available | Male | Female |
| No Vehicle | 3 (12.0%) | 0 (0.0%) |
| 1 Vehicle | 0 (0.0%) | 0 (0.0%) |
| 2 Vehicles | 8 (32.0%) | 10 (71.4%) |
| 3 Vehicles | 7 (28.0%) | 4 (28.6%) |
| 4 Vehicles | 7 (28.0%) | 0 (0.0%) |
| 5 or more Vehicles | 0 (0.0%) | 0 (0.0%) |
| Total | 25 (100.0%) | 14 (100.0%) |
Commute Time in Dupuyer
The most frequently occuring commute durations in Dupuyer are 30 to 34 minutes (8 commuters, 20.5%), 5 to 9 minutes (7 commuters, 17.9%), and 60 to 89 minutes (7 commuters, 17.9%).
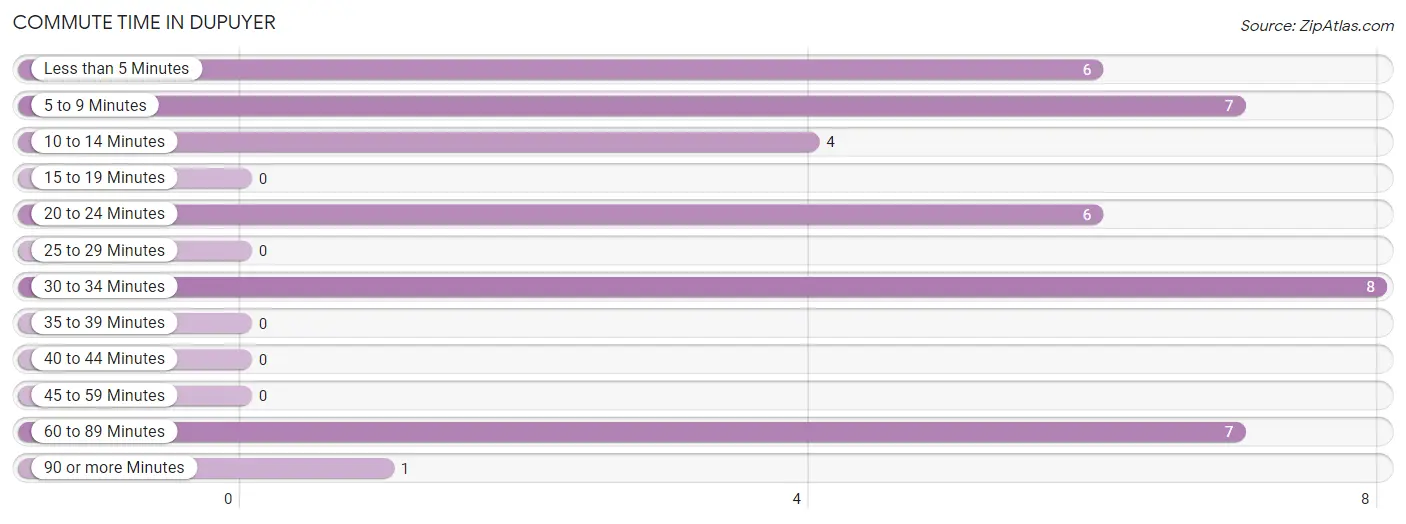
| Commute Time | # Commuters | % Commuters |
| Less than 5 Minutes | 6 | 15.4% |
| 5 to 9 Minutes | 7 | 17.9% |
| 10 to 14 Minutes | 4 | 10.3% |
| 15 to 19 Minutes | 0 | 0.0% |
| 20 to 24 Minutes | 6 | 15.4% |
| 25 to 29 Minutes | 0 | 0.0% |
| 30 to 34 Minutes | 8 | 20.5% |
| 35 to 39 Minutes | 0 | 0.0% |
| 40 to 44 Minutes | 0 | 0.0% |
| 45 to 59 Minutes | 0 | 0.0% |
| 60 to 89 Minutes | 7 | 17.9% |
| 90 or more Minutes | 1 | 2.6% |
Commute Time by Sex in Dupuyer
The most common commute times in Dupuyer are 5 to 9 minutes (7 commuters, 28.0%) for males and 20 to 24 minutes (5 commuters, 35.7%) for females.
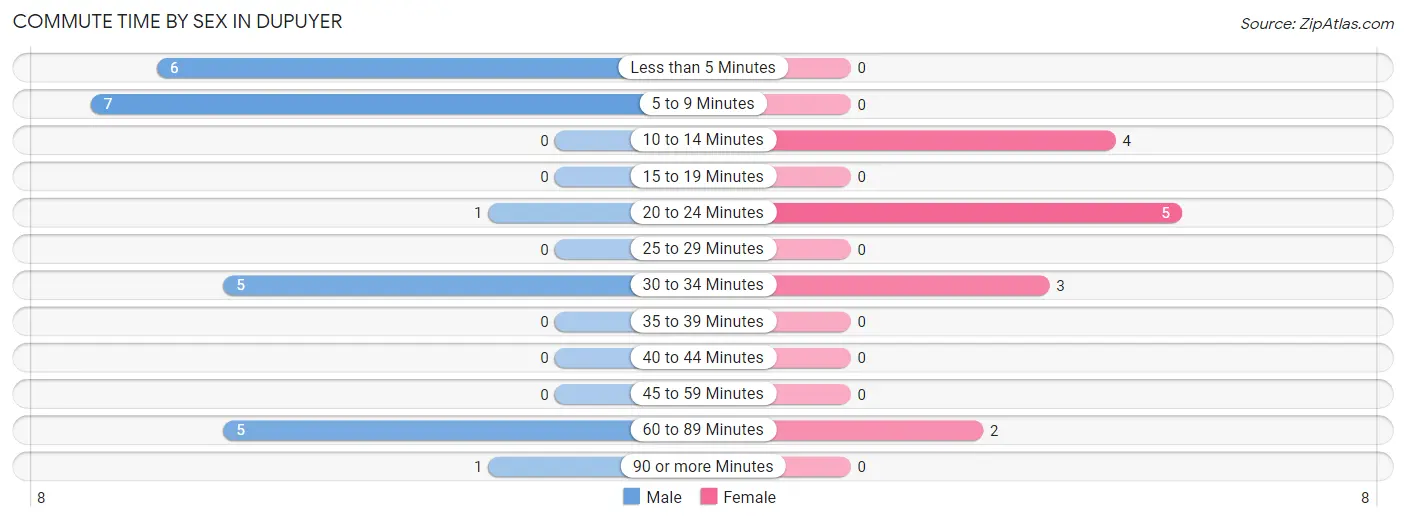
| Commute Time | Male | Female |
| Less than 5 Minutes | 6 (24.0%) | 0 (0.0%) |
| 5 to 9 Minutes | 7 (28.0%) | 0 (0.0%) |
| 10 to 14 Minutes | 0 (0.0%) | 4 (28.6%) |
| 15 to 19 Minutes | 0 (0.0%) | 0 (0.0%) |
| 20 to 24 Minutes | 1 (4.0%) | 5 (35.7%) |
| 25 to 29 Minutes | 0 (0.0%) | 0 (0.0%) |
| 30 to 34 Minutes | 5 (20.0%) | 3 (21.4%) |
| 35 to 39 Minutes | 0 (0.0%) | 0 (0.0%) |
| 40 to 44 Minutes | 0 (0.0%) | 0 (0.0%) |
| 45 to 59 Minutes | 0 (0.0%) | 0 (0.0%) |
| 60 to 89 Minutes | 5 (20.0%) | 2 (14.3%) |
| 90 or more Minutes | 1 (4.0%) | 0 (0.0%) |
Time of Departure to Work by Sex in Dupuyer
The most frequent times of departure to work in Dupuyer are 6:30 AM to 6:59 AM (9, 36.0%) for males and 12:00 PM to 3:59 PM (6, 42.9%) for females.
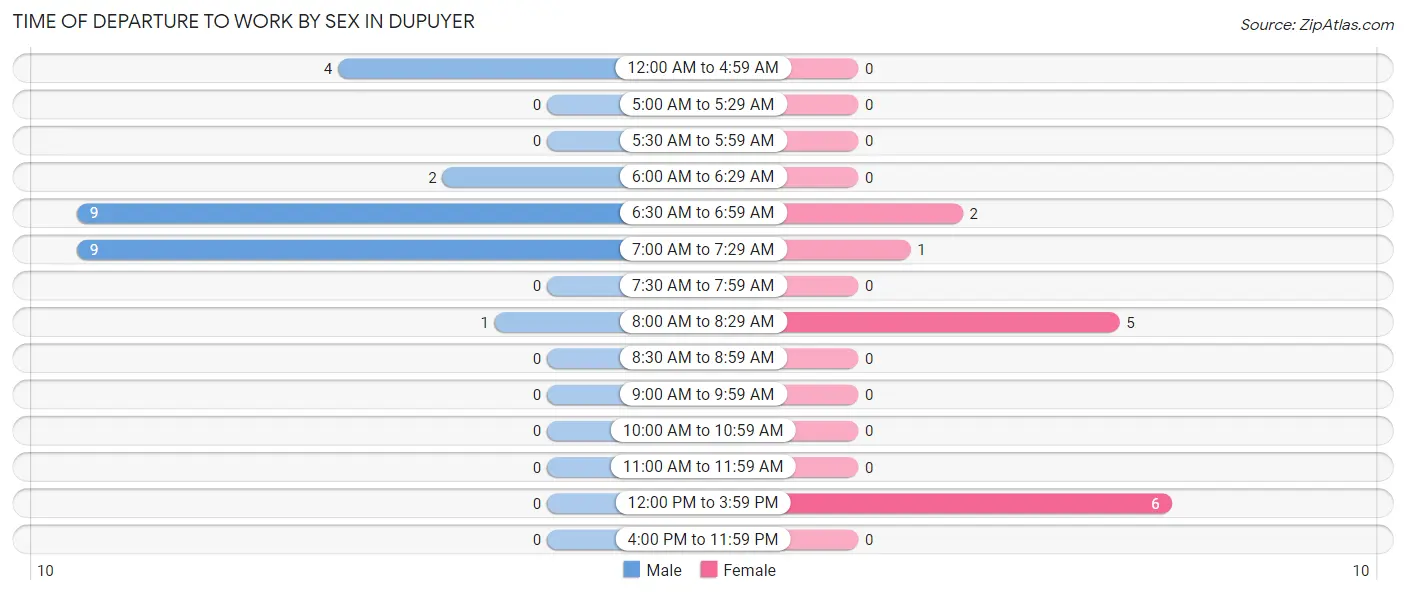
| Time of Departure | Male | Female |
| 12:00 AM to 4:59 AM | 4 (16.0%) | 0 (0.0%) |
| 5:00 AM to 5:29 AM | 0 (0.0%) | 0 (0.0%) |
| 5:30 AM to 5:59 AM | 0 (0.0%) | 0 (0.0%) |
| 6:00 AM to 6:29 AM | 2 (8.0%) | 0 (0.0%) |
| 6:30 AM to 6:59 AM | 9 (36.0%) | 2 (14.3%) |
| 7:00 AM to 7:29 AM | 9 (36.0%) | 1 (7.1%) |
| 7:30 AM to 7:59 AM | 0 (0.0%) | 0 (0.0%) |
| 8:00 AM to 8:29 AM | 1 (4.0%) | 5 (35.7%) |
| 8:30 AM to 8:59 AM | 0 (0.0%) | 0 (0.0%) |
| 9:00 AM to 9:59 AM | 0 (0.0%) | 0 (0.0%) |
| 10:00 AM to 10:59 AM | 0 (0.0%) | 0 (0.0%) |
| 11:00 AM to 11:59 AM | 0 (0.0%) | 0 (0.0%) |
| 12:00 PM to 3:59 PM | 0 (0.0%) | 6 (42.9%) |
| 4:00 PM to 11:59 PM | 0 (0.0%) | 0 (0.0%) |
| Total | 25 (100.0%) | 14 (100.0%) |
Housing Occupancy in Dupuyer
Occupancy by Ownership in Dupuyer
Of the total 44 dwellings in Dupuyer, owner-occupied units account for 36 (81.8%), while renter-occupied units make up 8 (18.2%).
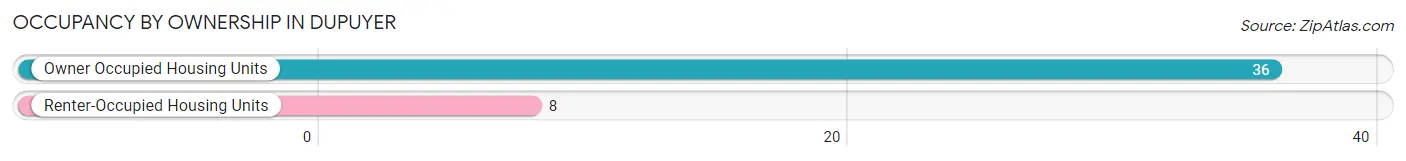
| Occupancy | # Housing Units | % Housing Units |
| Owner Occupied Housing Units | 36 | 81.8% |
| Renter-Occupied Housing Units | 8 | 18.2% |
| Total Occupied Housing Units | 44 | 100.0% |
Occupancy by Household Size in Dupuyer
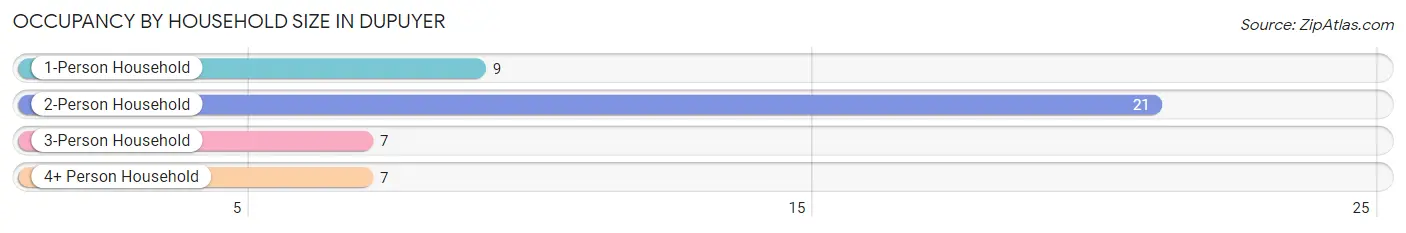
| Household Size | # Housing Units | % Housing Units |
| 1-Person Household | 9 | 20.4% |
| 2-Person Household | 21 | 47.7% |
| 3-Person Household | 7 | 15.9% |
| 4+ Person Household | 7 | 15.9% |
| Total Housing Units | 44 | 100.0% |
Occupancy by Ownership by Household Size in Dupuyer
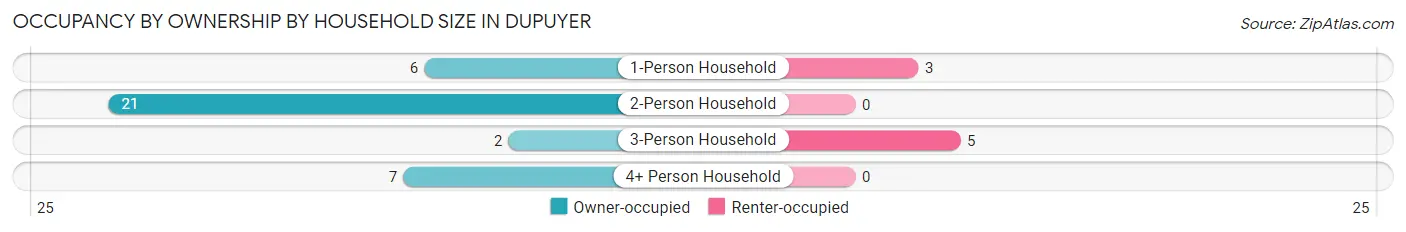
| Household Size | Owner-occupied | Renter-occupied |
| 1-Person Household | 6 (66.7%) | 3 (33.3%) |
| 2-Person Household | 21 (100.0%) | 0 (0.0%) |
| 3-Person Household | 2 (28.6%) | 5 (71.4%) |
| 4+ Person Household | 7 (100.0%) | 0 (0.0%) |
| Total Housing Units | 36 (81.8%) | 8 (18.2%) |
Occupancy by Educational Attainment in Dupuyer
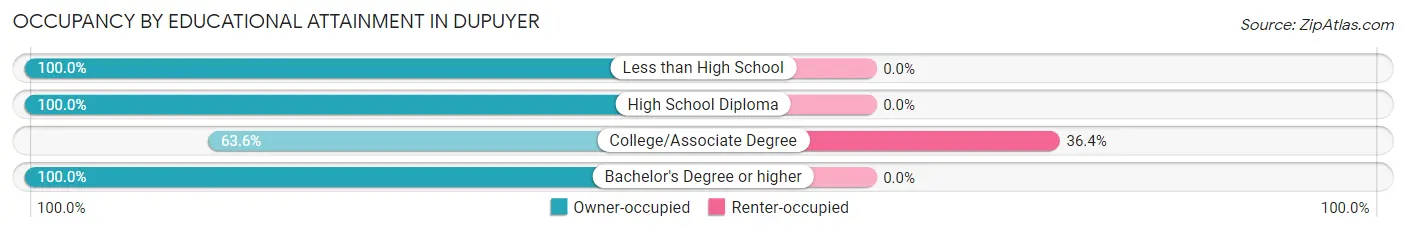
| Household Size | Owner-occupied | Renter-occupied |
| Less than High School | 2 (100.0%) | 0 (0.0%) |
| High School Diploma | 14 (100.0%) | 0 (0.0%) |
| College/Associate Degree | 14 (63.6%) | 8 (36.4%) |
| Bachelor's Degree or higher | 6 (100.0%) | 0 (0.0%) |
Occupancy by Age of Householder in Dupuyer
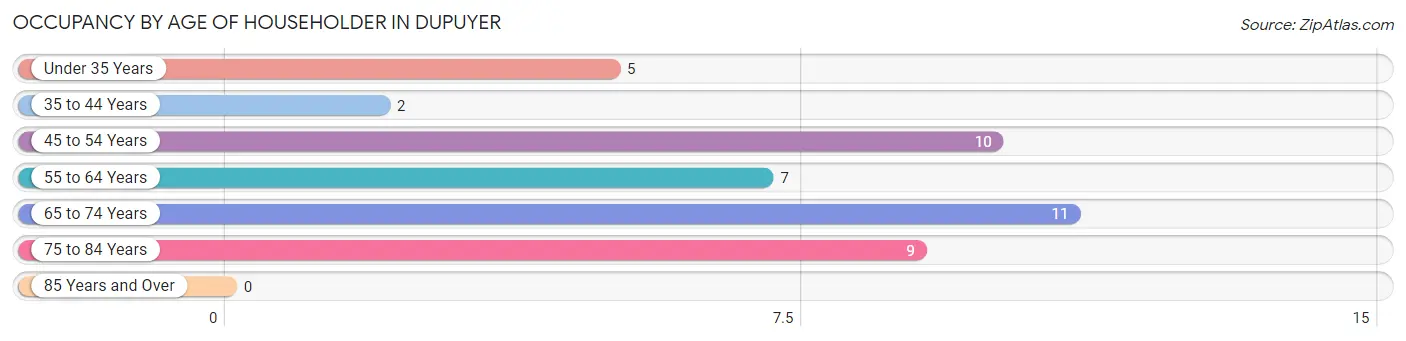
| Age Bracket | # Households | % Households |
| Under 35 Years | 5 | 11.4% |
| 35 to 44 Years | 2 | 4.5% |
| 45 to 54 Years | 10 | 22.7% |
| 55 to 64 Years | 7 | 15.9% |
| 65 to 74 Years | 11 | 25.0% |
| 75 to 84 Years | 9 | 20.4% |
| 85 Years and Over | 0 | 0.0% |
| Total | 44 | 100.0% |
Housing Finances in Dupuyer
Median Income by Occupancy in Dupuyer
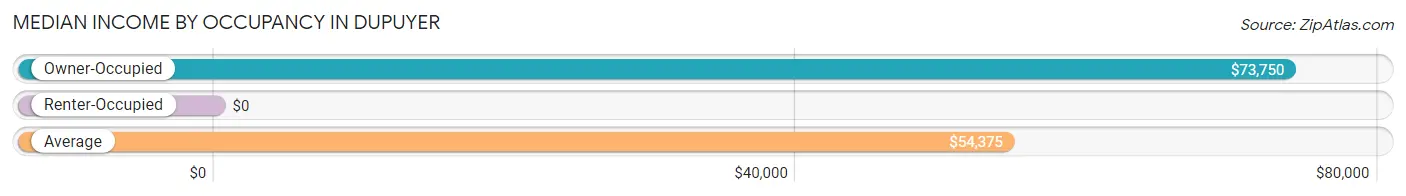
| Occupancy Type | # Households | Median Income |
| Owner-Occupied | 36 (81.8%) | $73,750 |
| Renter-Occupied | 8 (18.2%) | $0 |
| Average | 44 (100.0%) | $54,375 |
Occupancy by Householder Income Bracket in Dupuyer
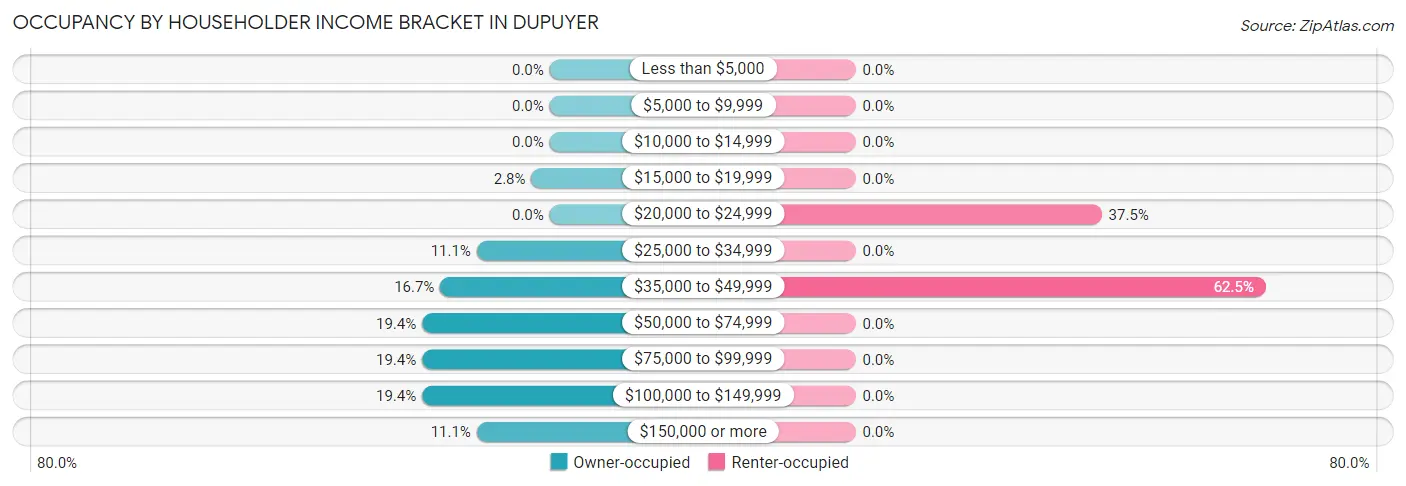
| Income Bracket | Owner-occupied | Renter-occupied |
| Less than $5,000 | 0 (0.0%) | 0 (0.0%) |
| $5,000 to $9,999 | 0 (0.0%) | 0 (0.0%) |
| $10,000 to $14,999 | 0 (0.0%) | 0 (0.0%) |
| $15,000 to $19,999 | 1 (2.8%) | 0 (0.0%) |
| $20,000 to $24,999 | 0 (0.0%) | 3 (37.5%) |
| $25,000 to $34,999 | 4 (11.1%) | 0 (0.0%) |
| $35,000 to $49,999 | 6 (16.7%) | 5 (62.5%) |
| $50,000 to $74,999 | 7 (19.4%) | 0 (0.0%) |
| $75,000 to $99,999 | 7 (19.4%) | 0 (0.0%) |
| $100,000 to $149,999 | 7 (19.4%) | 0 (0.0%) |
| $150,000 or more | 4 (11.1%) | 0 (0.0%) |
| Total | 36 (100.0%) | 8 (100.0%) |
Monthly Housing Cost Tiers in Dupuyer
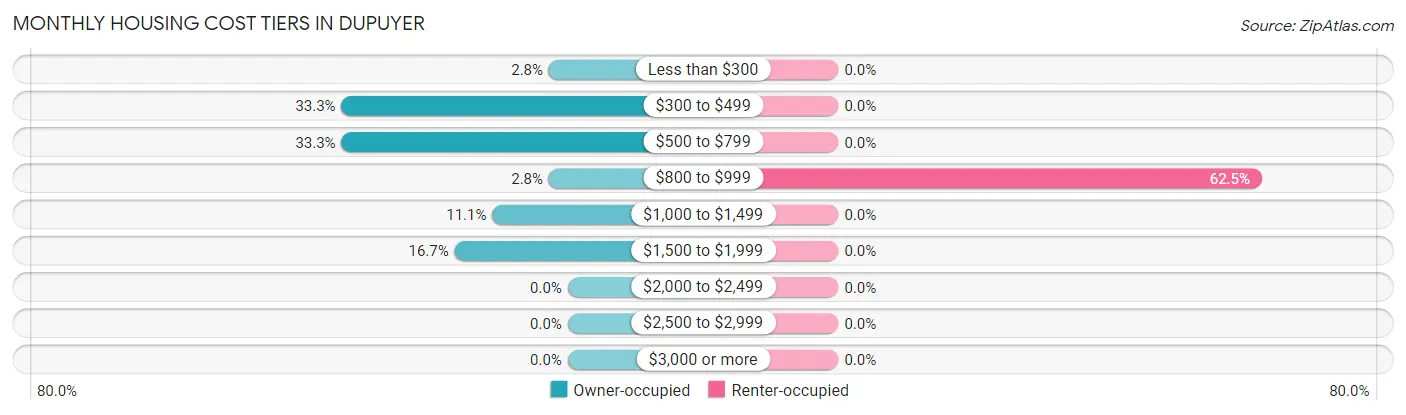
| Monthly Cost | Owner-occupied | Renter-occupied |
| Less than $300 | 1 (2.8%) | 0 (0.0%) |
| $300 to $499 | 12 (33.3%) | 0 (0.0%) |
| $500 to $799 | 12 (33.3%) | 0 (0.0%) |
| $800 to $999 | 1 (2.8%) | 5 (62.5%) |
| $1,000 to $1,499 | 4 (11.1%) | 0 (0.0%) |
| $1,500 to $1,999 | 6 (16.7%) | 0 (0.0%) |
| $2,000 to $2,499 | 0 (0.0%) | 0 (0.0%) |
| $2,500 to $2,999 | 0 (0.0%) | 0 (0.0%) |
| $3,000 or more | 0 (0.0%) | 0 (0.0%) |
| Total | 36 (100.0%) | 8 (100.0%) |
Physical Housing Characteristics in Dupuyer
Housing Structures in Dupuyer
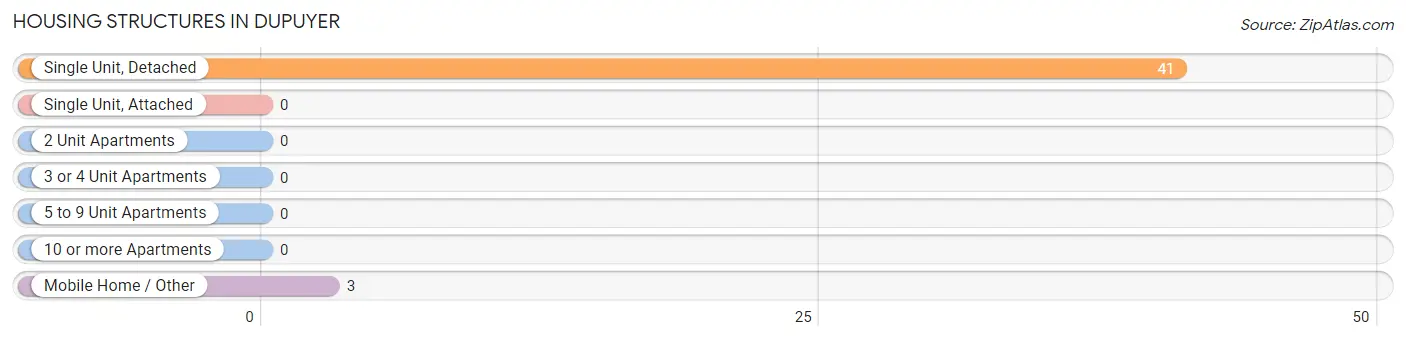
| Structure Type | # Housing Units | % Housing Units |
| Single Unit, Detached | 41 | 93.2% |
| Single Unit, Attached | 0 | 0.0% |
| 2 Unit Apartments | 0 | 0.0% |
| 3 or 4 Unit Apartments | 0 | 0.0% |
| 5 to 9 Unit Apartments | 0 | 0.0% |
| 10 or more Apartments | 0 | 0.0% |
| Mobile Home / Other | 3 | 6.8% |
| Total | 44 | 100.0% |
Housing Structures by Occupancy in Dupuyer
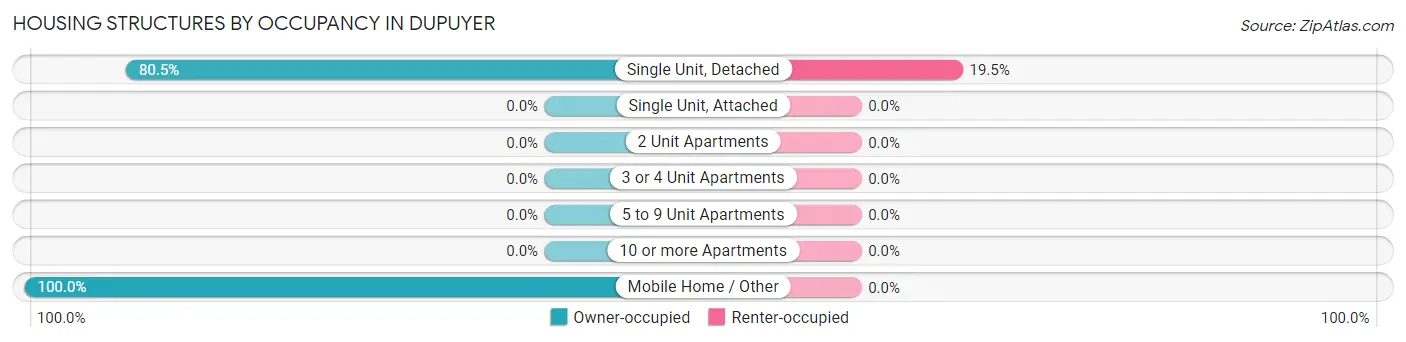
| Structure Type | Owner-occupied | Renter-occupied |
| Single Unit, Detached | 33 (80.5%) | 8 (19.5%) |
| Single Unit, Attached | 0 (0.0%) | 0 (0.0%) |
| 2 Unit Apartments | 0 (0.0%) | 0 (0.0%) |
| 3 or 4 Unit Apartments | 0 (0.0%) | 0 (0.0%) |
| 5 to 9 Unit Apartments | 0 (0.0%) | 0 (0.0%) |
| 10 or more Apartments | 0 (0.0%) | 0 (0.0%) |
| Mobile Home / Other | 3 (100.0%) | 0 (0.0%) |
| Total | 36 (81.8%) | 8 (18.2%) |
Housing Structures by Number of Rooms in Dupuyer
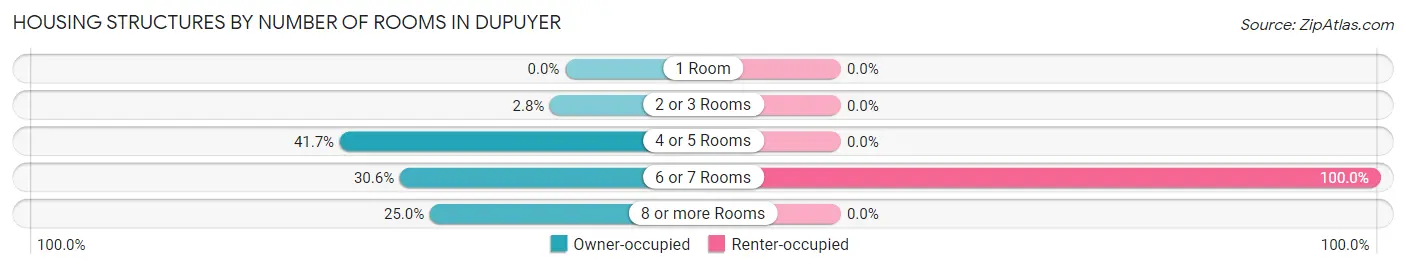
| Number of Rooms | Owner-occupied | Renter-occupied |
| 1 Room | 0 (0.0%) | 0 (0.0%) |
| 2 or 3 Rooms | 1 (2.8%) | 0 (0.0%) |
| 4 or 5 Rooms | 15 (41.7%) | 0 (0.0%) |
| 6 or 7 Rooms | 11 (30.6%) | 8 (100.0%) |
| 8 or more Rooms | 9 (25.0%) | 0 (0.0%) |
| Total | 36 (100.0%) | 8 (100.0%) |
Housing Structure by Heating Type in Dupuyer
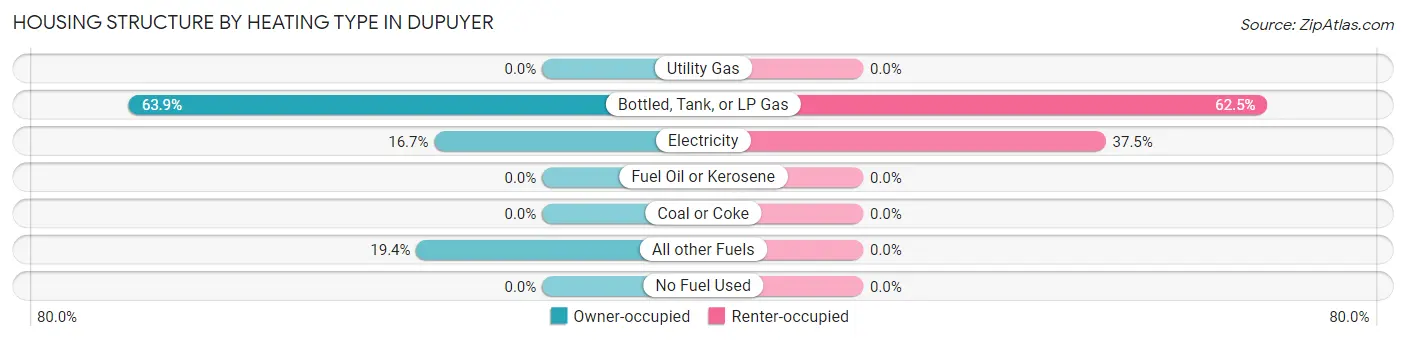
| Heating Type | Owner-occupied | Renter-occupied |
| Utility Gas | 0 (0.0%) | 0 (0.0%) |
| Bottled, Tank, or LP Gas | 23 (63.9%) | 5 (62.5%) |
| Electricity | 6 (16.7%) | 3 (37.5%) |
| Fuel Oil or Kerosene | 0 (0.0%) | 0 (0.0%) |
| Coal or Coke | 0 (0.0%) | 0 (0.0%) |
| All other Fuels | 7 (19.4%) | 0 (0.0%) |
| No Fuel Used | 0 (0.0%) | 0 (0.0%) |
| Total | 36 (100.0%) | 8 (100.0%) |
Household Vehicle Usage in Dupuyer
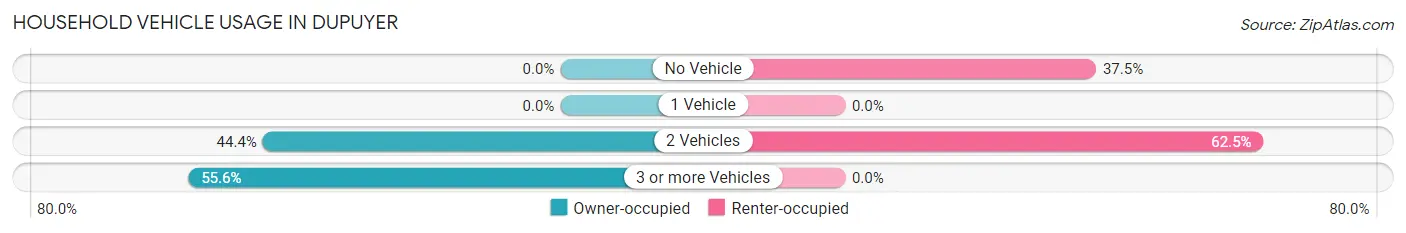
| Vehicles per Household | Owner-occupied | Renter-occupied |
| No Vehicle | 0 (0.0%) | 3 (37.5%) |
| 1 Vehicle | 0 (0.0%) | 0 (0.0%) |
| 2 Vehicles | 16 (44.4%) | 5 (62.5%) |
| 3 or more Vehicles | 20 (55.6%) | 0 (0.0%) |
| Total | 36 (100.0%) | 8 (100.0%) |
Real Estate & Mortgages in Dupuyer
Real Estate and Mortgage Overview in Dupuyer
| Characteristic | Without Mortgage | With Mortgage |
| Housing Units | 17 | 19 |
| Median Property Value | $143,800 | $173,400 |
| Median Household Income | $52,813 | $4 |
| Monthly Housing Costs | $450 | $0 |
| Real Estate Taxes | $1,167 | $0 |
Property Value by Mortgage Status in Dupuyer
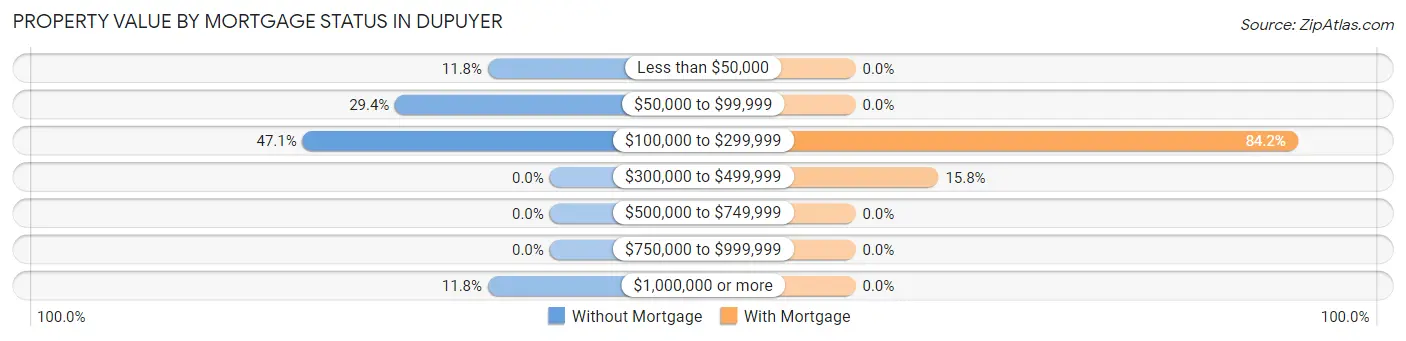
| Property Value | Without Mortgage | With Mortgage |
| Less than $50,000 | 2 (11.8%) | 0 (0.0%) |
| $50,000 to $99,999 | 5 (29.4%) | 0 (0.0%) |
| $100,000 to $299,999 | 8 (47.1%) | 16 (84.2%) |
| $300,000 to $499,999 | 0 (0.0%) | 3 (15.8%) |
| $500,000 to $749,999 | 0 (0.0%) | 0 (0.0%) |
| $750,000 to $999,999 | 0 (0.0%) | 0 (0.0%) |
| $1,000,000 or more | 2 (11.8%) | 0 (0.0%) |
| Total | 17 (100.0%) | 19 (100.0%) |
Household Income by Mortgage Status in Dupuyer
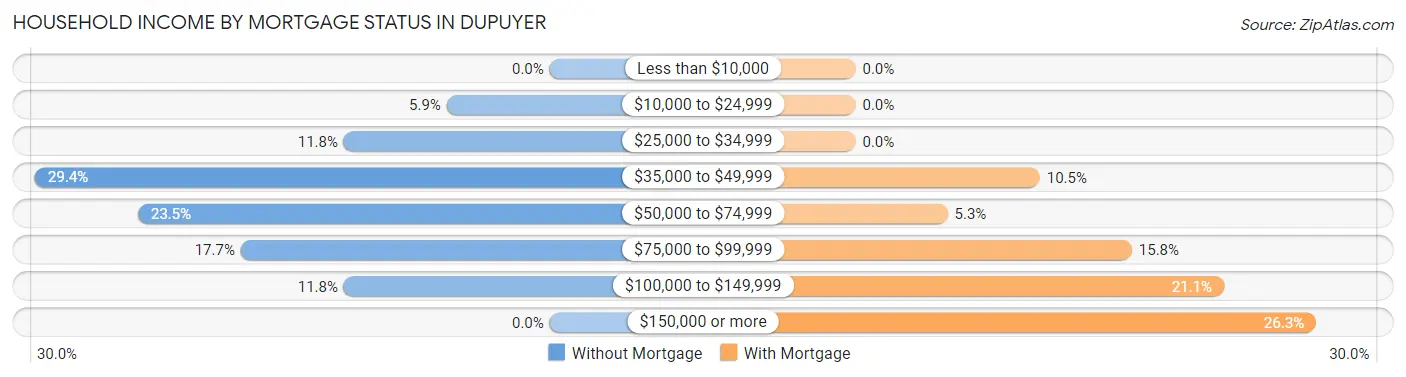
| Household Income | Without Mortgage | With Mortgage |
| Less than $10,000 | 0 (0.0%) | 0 (0.0%) |
| $10,000 to $24,999 | 1 (5.9%) | 0 (0.0%) |
| $25,000 to $34,999 | 2 (11.8%) | 0 (0.0%) |
| $35,000 to $49,999 | 5 (29.4%) | 2 (10.5%) |
| $50,000 to $74,999 | 4 (23.5%) | 1 (5.3%) |
| $75,000 to $99,999 | 3 (17.6%) | 3 (15.8%) |
| $100,000 to $149,999 | 2 (11.8%) | 4 (21.0%) |
| $150,000 or more | 0 (0.0%) | 5 (26.3%) |
| Total | 17 (100.0%) | 19 (100.0%) |
Property Value to Household Income Ratio in Dupuyer
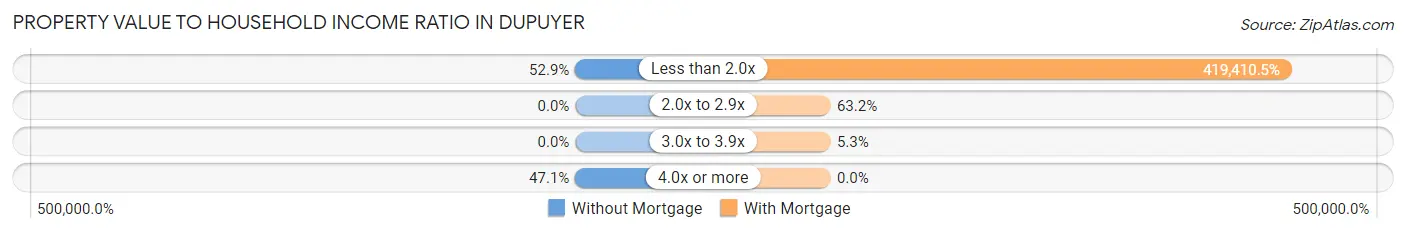
| Value-to-Income Ratio | Without Mortgage | With Mortgage |
| Less than 2.0x | 9 (52.9%) | 79,688 (419,410.5%) |
| 2.0x to 2.9x | 0 (0.0%) | 12 (63.2%) |
| 3.0x to 3.9x | 0 (0.0%) | 1 (5.3%) |
| 4.0x or more | 8 (47.1%) | 0 (0.0%) |
| Total | 17 (100.0%) | 19 (100.0%) |
Real Estate Taxes by Mortgage Status in Dupuyer
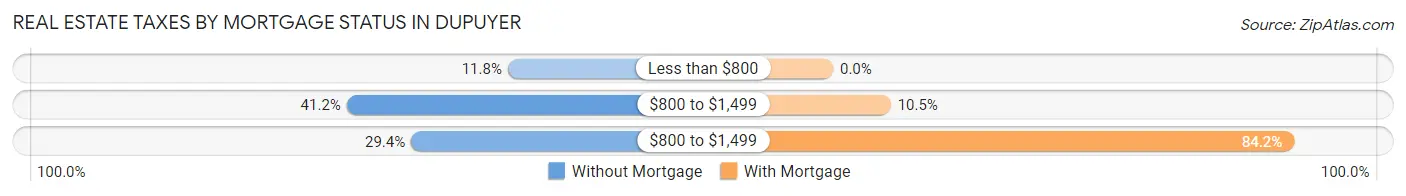
| Property Taxes | Without Mortgage | With Mortgage |
| Less than $800 | 2 (11.8%) | 0 (0.0%) |
| $800 to $1,499 | 7 (41.2%) | 2 (10.5%) |
| $800 to $1,499 | 5 (29.4%) | 16 (84.2%) |
| Total | 17 (100.0%) | 19 (100.0%) |
Health & Disability in Dupuyer
Health Insurance Coverage by Age in Dupuyer
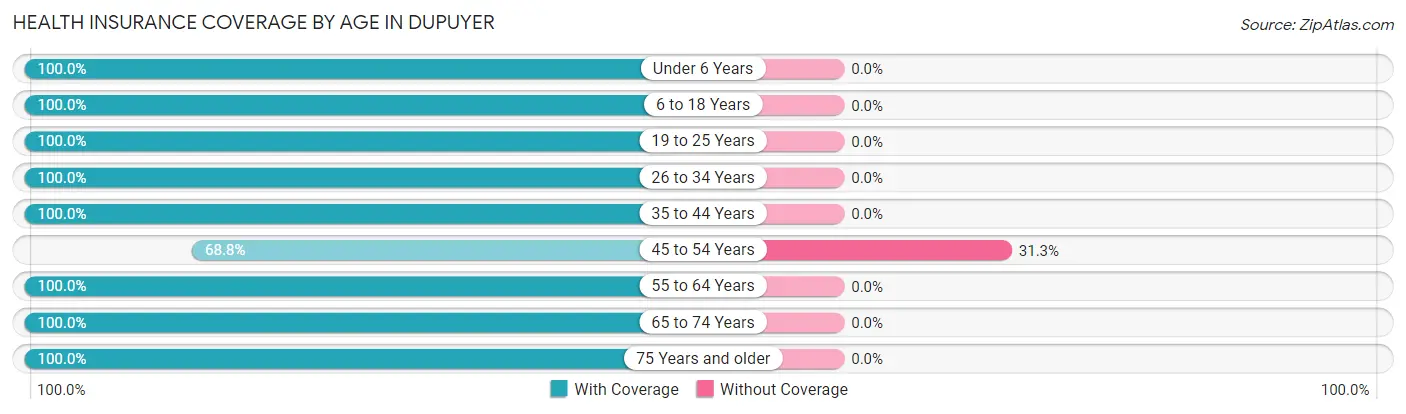
| Age Bracket | With Coverage | Without Coverage |
| Under 6 Years | 12 (100.0%) | 0 (0.0%) |
| 6 to 18 Years | 8 (100.0%) | 0 (0.0%) |
| 19 to 25 Years | 10 (100.0%) | 0 (0.0%) |
| 26 to 34 Years | 10 (100.0%) | 0 (0.0%) |
| 35 to 44 Years | 3 (100.0%) | 0 (0.0%) |
| 45 to 54 Years | 11 (68.8%) | 5 (31.2%) |
| 55 to 64 Years | 10 (100.0%) | 0 (0.0%) |
| 65 to 74 Years | 28 (100.0%) | 0 (0.0%) |
| 75 Years and older | 19 (100.0%) | 0 (0.0%) |
| Total | 111 (95.7%) | 5 (4.3%) |
Health Insurance Coverage by Citizenship Status in Dupuyer
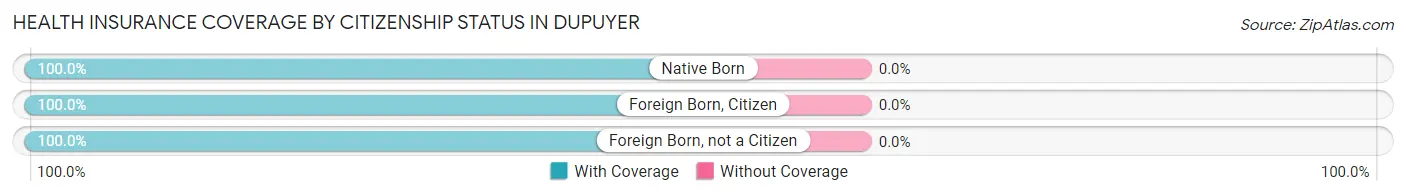
| Citizenship Status | With Coverage | Without Coverage |
| Native Born | 12 (100.0%) | 0 (0.0%) |
| Foreign Born, Citizen | 8 (100.0%) | 0 (0.0%) |
| Foreign Born, not a Citizen | 10 (100.0%) | 0 (0.0%) |
Health Insurance Coverage by Household Income in Dupuyer
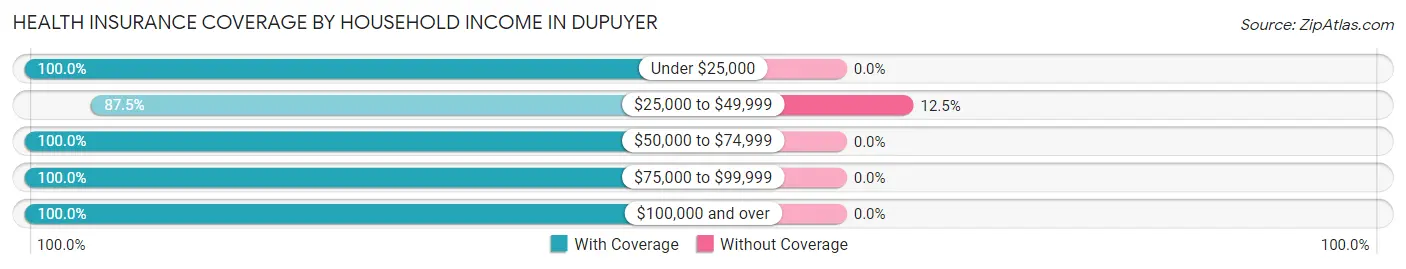
| Household Income | With Coverage | Without Coverage |
| Under $25,000 | 7 (100.0%) | 0 (0.0%) |
| $25,000 to $49,999 | 35 (87.5%) | 5 (12.5%) |
| $50,000 to $74,999 | 23 (100.0%) | 0 (0.0%) |
| $75,000 to $99,999 | 17 (100.0%) | 0 (0.0%) |
| $100,000 and over | 29 (100.0%) | 0 (0.0%) |
Public vs Private Health Insurance Coverage by Age in Dupuyer
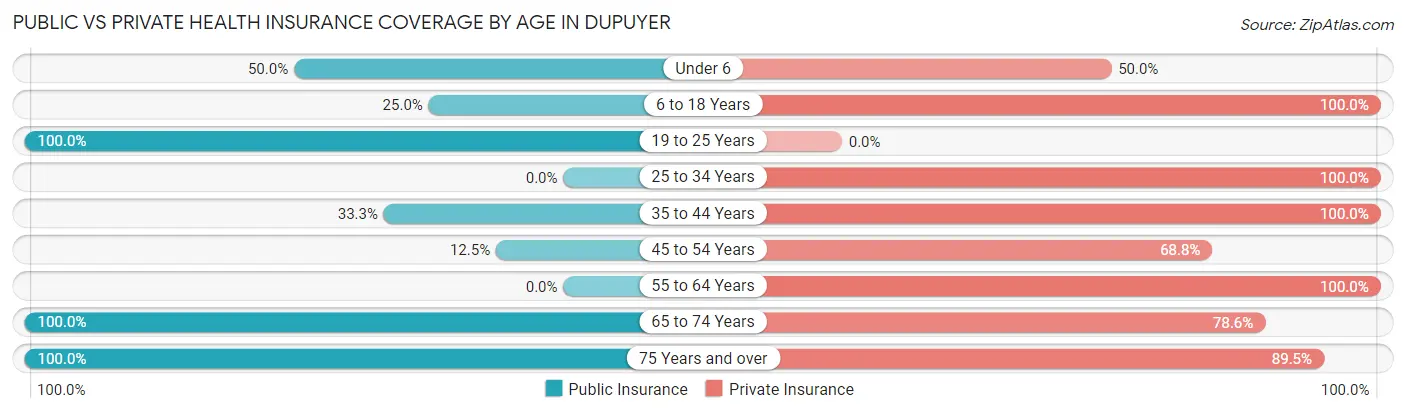
| Age Bracket | Public Insurance | Private Insurance |
| Under 6 | 6 (50.0%) | 6 (50.0%) |
| 6 to 18 Years | 2 (25.0%) | 8 (100.0%) |
| 19 to 25 Years | 10 (100.0%) | 0 (0.0%) |
| 25 to 34 Years | 0 (0.0%) | 10 (100.0%) |
| 35 to 44 Years | 1 (33.3%) | 3 (100.0%) |
| 45 to 54 Years | 2 (12.5%) | 11 (68.8%) |
| 55 to 64 Years | 0 (0.0%) | 10 (100.0%) |
| 65 to 74 Years | 28 (100.0%) | 22 (78.6%) |
| 75 Years and over | 19 (100.0%) | 17 (89.5%) |
| Total | 68 (58.6%) | 87 (75.0%) |
Disability Status by Sex by Age in Dupuyer
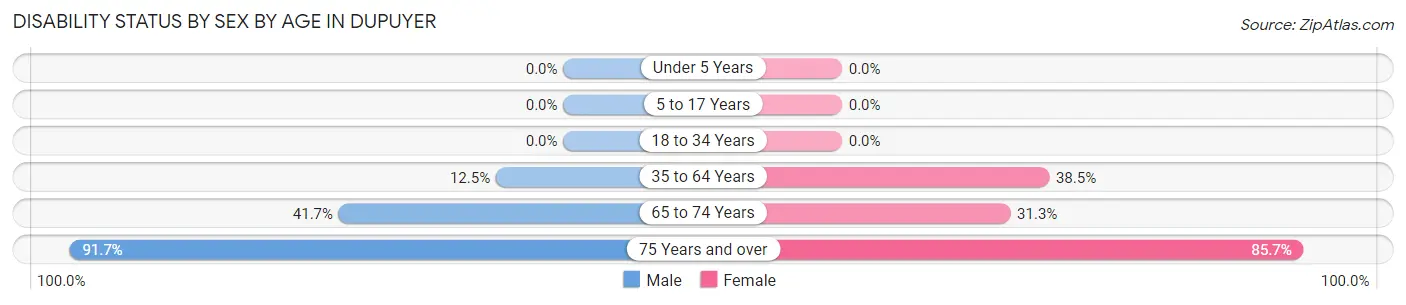
| Age Bracket | Male | Female |
| Under 5 Years | 0 (0.0%) | 0 (0.0%) |
| 5 to 17 Years | 0 (0.0%) | 0 (0.0%) |
| 18 to 34 Years | 0 (0.0%) | 0 (0.0%) |
| 35 to 64 Years | 2 (12.5%) | 5 (38.5%) |
| 65 to 74 Years | 5 (41.7%) | 5 (31.2%) |
| 75 Years and over | 11 (91.7%) | 6 (85.7%) |
Disability Class by Sex by Age in Dupuyer
Disability Class: Hearing Difficulty
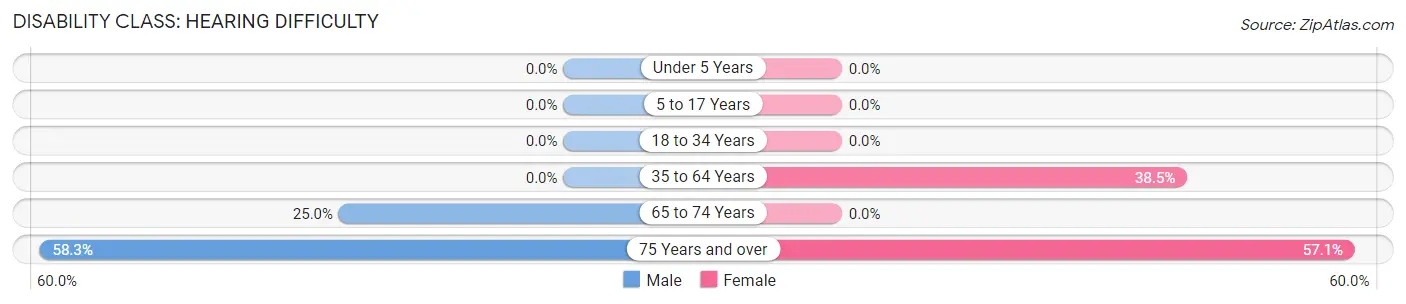
| Age Bracket | Male | Female |
| Under 5 Years | 0 (0.0%) | 0 (0.0%) |
| 5 to 17 Years | 0 (0.0%) | 0 (0.0%) |
| 18 to 34 Years | 0 (0.0%) | 0 (0.0%) |
| 35 to 64 Years | 0 (0.0%) | 5 (38.5%) |
| 65 to 74 Years | 3 (25.0%) | 0 (0.0%) |
| 75 Years and over | 7 (58.3%) | 4 (57.1%) |
Disability Class: Vision Difficulty
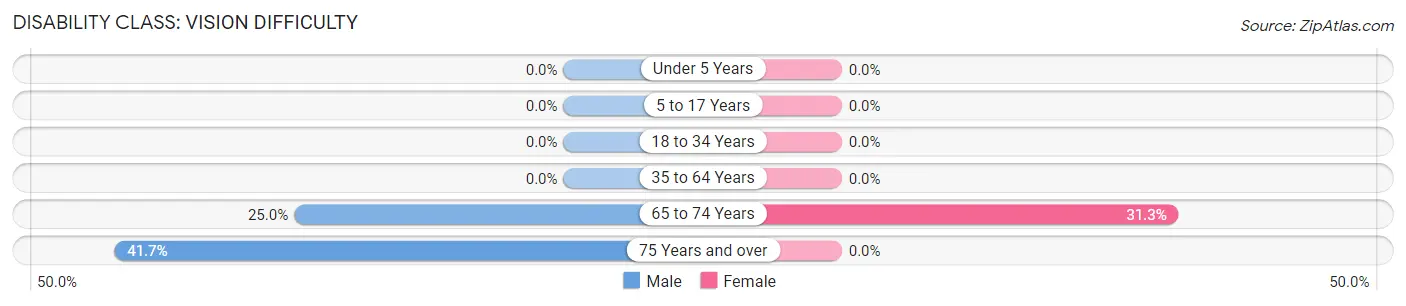
| Age Bracket | Male | Female |
| Under 5 Years | 0 (0.0%) | 0 (0.0%) |
| 5 to 17 Years | 0 (0.0%) | 0 (0.0%) |
| 18 to 34 Years | 0 (0.0%) | 0 (0.0%) |
| 35 to 64 Years | 0 (0.0%) | 0 (0.0%) |
| 65 to 74 Years | 3 (25.0%) | 5 (31.2%) |
| 75 Years and over | 5 (41.7%) | 0 (0.0%) |
Disability Class: Cognitive Difficulty
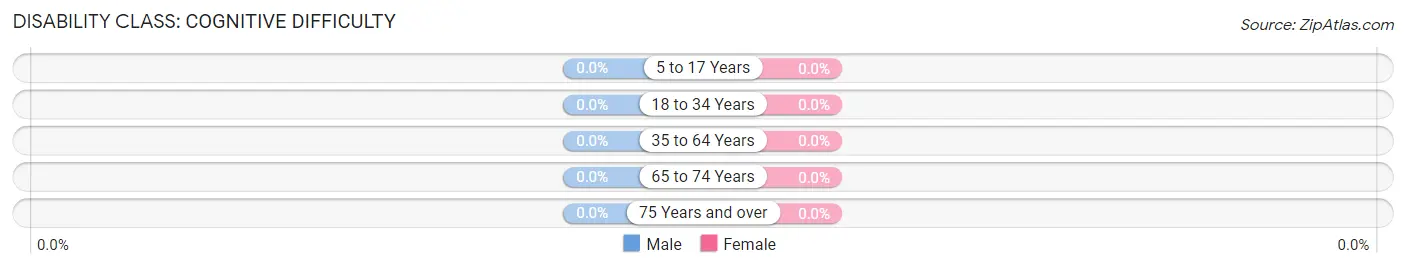
| Age Bracket | Male | Female |
| 5 to 17 Years | 0 (0.0%) | 0 (0.0%) |
| 18 to 34 Years | 0 (0.0%) | 0 (0.0%) |
| 35 to 64 Years | 0 (0.0%) | 0 (0.0%) |
| 65 to 74 Years | 0 (0.0%) | 0 (0.0%) |
| 75 Years and over | 0 (0.0%) | 0 (0.0%) |
Disability Class: Ambulatory Difficulty
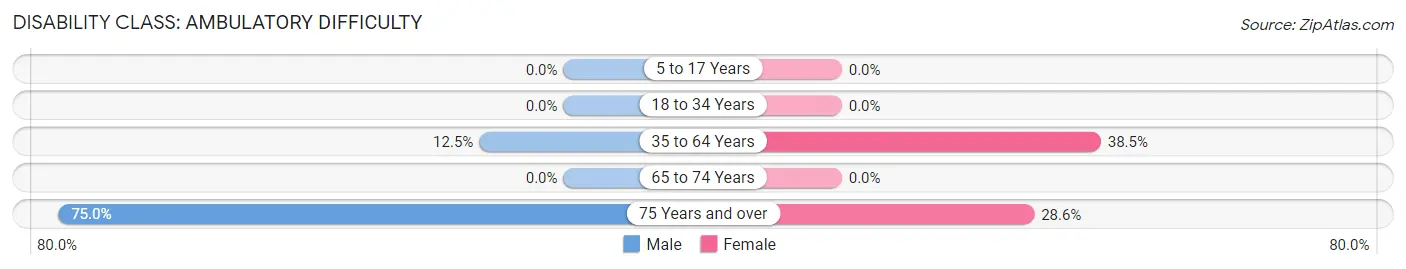
| Age Bracket | Male | Female |
| 5 to 17 Years | 0 (0.0%) | 0 (0.0%) |
| 18 to 34 Years | 0 (0.0%) | 0 (0.0%) |
| 35 to 64 Years | 2 (12.5%) | 5 (38.5%) |
| 65 to 74 Years | 0 (0.0%) | 0 (0.0%) |
| 75 Years and over | 9 (75.0%) | 2 (28.6%) |
Disability Class: Self-Care Difficulty
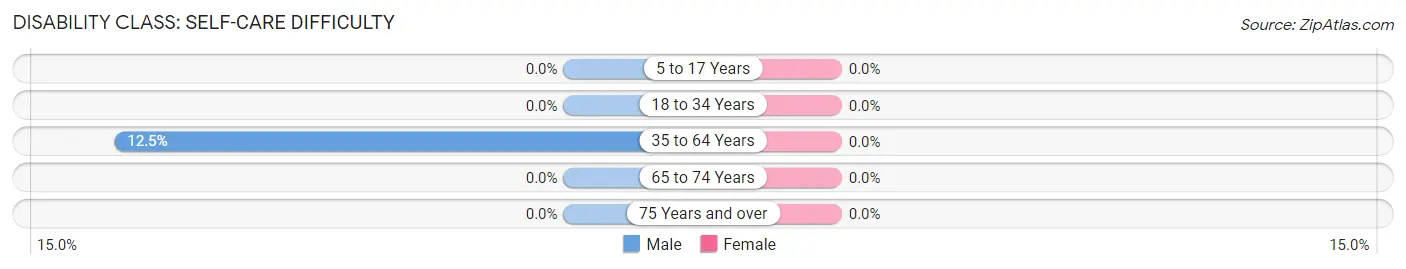
| Age Bracket | Male | Female |
| 5 to 17 Years | 0 (0.0%) | 0 (0.0%) |
| 18 to 34 Years | 0 (0.0%) | 0 (0.0%) |
| 35 to 64 Years | 2 (12.5%) | 0 (0.0%) |
| 65 to 74 Years | 0 (0.0%) | 0 (0.0%) |
| 75 Years and over | 0 (0.0%) | 0 (0.0%) |
Technology Access in Dupuyer
Computing Device Access in Dupuyer
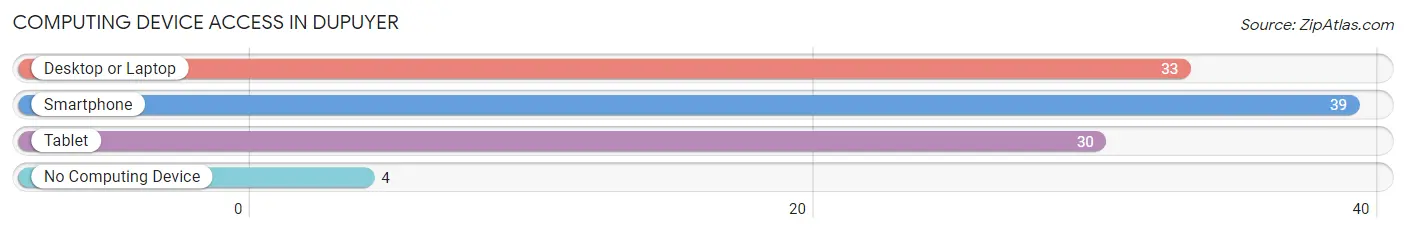
| Device Type | # Households | % Households |
| Desktop or Laptop | 33 | 75.0% |
| Smartphone | 39 | 88.6% |
| Tablet | 30 | 68.2% |
| No Computing Device | 4 | 9.1% |
| Total | 44 | 100.0% |
Internet Access in Dupuyer
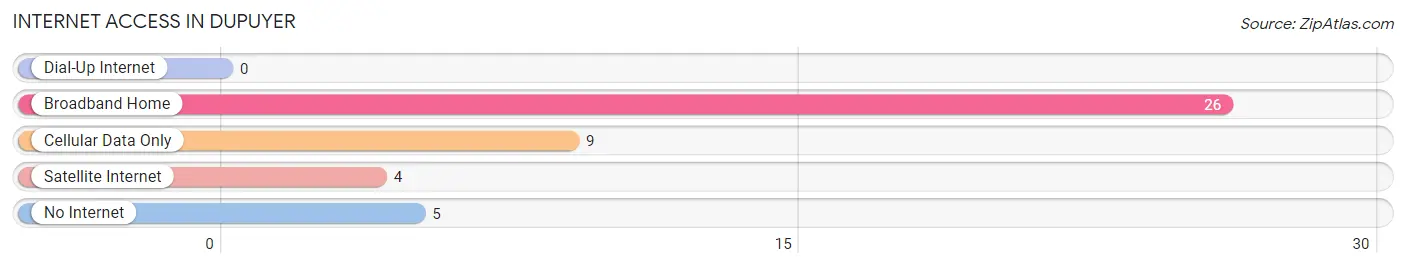
| Internet Type | # Households | % Households |
| Dial-Up Internet | 0 | 0.0% |
| Broadband Home | 26 | 59.1% |
| Cellular Data Only | 9 | 20.4% |
| Satellite Internet | 4 | 9.1% |
| No Internet | 5 | 11.4% |
| Total | 44 | 100.0% |
Dupuyer Summary
Dupuyer, Montana is a small unincorporated community located in Pondera County, Montana. It is situated in the Rocky Mountain Front, a region of the Rocky Mountains that extends from the Canadian border to the Wyoming border. The town is located on the Blackfeet Indian Reservation, and is home to the Blackfeet Nation. The population of Dupuyer was estimated to be around 200 in 2020.
History
Dupuyer was founded in 1887 by French-Canadian fur trappers who were looking for a place to settle. The town was named after a French-Canadian trapper named Dupuyer, who was the first to settle in the area. The town was originally a trading post for the Blackfeet Nation, and was a popular stop for travelers and traders.
In the early 1900s, Dupuyer began to grow as a ranching and farming community. The town was home to several ranches, and the surrounding area was used for grazing cattle and sheep. The town also had a post office, a school, and a general store.
In the 1950s, the town began to decline as the population moved away to larger cities. The post office closed in the 1960s, and the school closed in the 1970s. The town was nearly abandoned by the 1980s, but has since seen a resurgence in population.
Geography
Dupuyer is located in the Rocky Mountain Front, a region of the Rocky Mountains that extends from the Canadian border to the Wyoming border. The town is situated in a valley surrounded by mountains, and is located on the Blackfeet Indian Reservation. The town is located at an elevation of 4,400 feet, and has a semi-arid climate with hot summers and cold winters.
Economy
The economy of Dupuyer is largely based on ranching and farming. The town is home to several ranches, and the surrounding area is used for grazing cattle and sheep. The town also has a general store, and several small businesses.
Demographics
The population of Dupuyer was estimated to be around 200 in 2020. The town is predominantly white, with a small Native American population. The median household income in Dupuyer is $35,000, and the median home value is $150,000. The town has a high poverty rate, with nearly 30% of the population living below the poverty line.
Common Questions
What is Per Capita Income in Dupuyer?
Per Capita income in Dupuyer is $30,597.
What is the Median Family Income in Dupuyer?
Median Family Income in Dupuyer is $54,688.
What is the Median Household income in Dupuyer?
Median Household Income in Dupuyer is $54,375.
What is Inequality or Gini Index in Dupuyer?
Inequality or Gini Index in Dupuyer is 0.32.
What is the Total Population of Dupuyer?
Total Population of Dupuyer is 116.
What is the Total Male Population of Dupuyer?
Total Male Population of Dupuyer is 55.
What is the Total Female Population of Dupuyer?
Total Female Population of Dupuyer is 61.
What is the Ratio of Males per 100 Females in Dupuyer?
There are 90.16 Males per 100 Females in Dupuyer.
What is the Ratio of Females per 100 Males in Dupuyer?
There are 110.91 Females per 100 Males in Dupuyer.
What is the Median Population Age in Dupuyer?
Median Population Age in Dupuyer is 50.8 Years.
What is the Average Family Size in Dupuyer
Average Family Size in Dupuyer is 3.1 People.
What is the Average Household Size in Dupuyer
Average Household Size in Dupuyer is 2.6 People.
How Large is the Labor Force in Dupuyer?
There are 51 People in the Labor Forcein in Dupuyer.
What is the Percentage of People in the Labor Force in Dupuyer?
53.1% of People are in the Labor Force in Dupuyer.
What is the Unemployment Rate in Dupuyer?
Unemployment Rate in Dupuyer is 2.0%.