Drummond, MT Map & Demographics
Drummond Map
Drummond Overview
$24,882
PER CAPITA INCOME
$54,531
AVG FAMILY INCOME
61.7%
WAGE / INCOME GAP [ % ]
38.3¢/ $1
WAGE / INCOME GAP [ $ ]
0.44
INEQUALITY / GINI INDEX
277
TOTAL POPULATION
149
MALE POPULATION
128
FEMALE POPULATION
116.41
MALES / 100 FEMALES
85.91
FEMALES / 100 MALES
50.2
MEDIAN AGE
3.5
AVG FAMILY SIZE
2.7
AVG HOUSEHOLD SIZE
103
LABOR FORCE [ PEOPLE ]
46.8%
PERCENT IN LABOR FORCE
1.9%
UNEMPLOYMENT RATE
Drummond Zip Codes
Drummond Area Codes
Income in Drummond
Income Overview in Drummond
| Characteristic | Number | Measure |
| Per Capita Income | 277 | $24,882 |
| Median Family Income | 71 | $54,531 |
| Mean Family Income | 71 | $62,055 |
| Median Household Income | 101 | $0 |
| Mean Household Income | 101 | $52,107 |
| Income Deficit | 71 | $0 |
| Wage / Income Gap (%) | 277 | 61.74% |
| Wage / Income Gap ($) | 277 | 38.26¢ per $1 |
| Gini / Inequality Index | 277 | 0.44 |
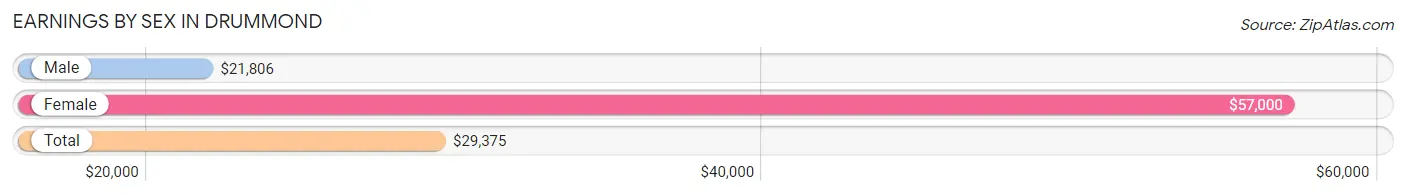
Earnings by Sex in Drummond
Average Earnings in Drummond are $29,375, $21,806 for men and $57,000 for women, a difference of 61.7%.
| Sex | Number | Average Earnings |
| Male | 49 (48.5%) | $21,806 |
| Female | 52 (51.5%) | $57,000 |
| Total | 101 (100.0%) | $29,375 |
Earnings by Sex by Income Bracket in Drummond
The most common earnings brackets in Drummond are $20,000 to $22,499 for men (27 | 55.1%) and $55,000 to $64,999 for women (29 | 55.8%).
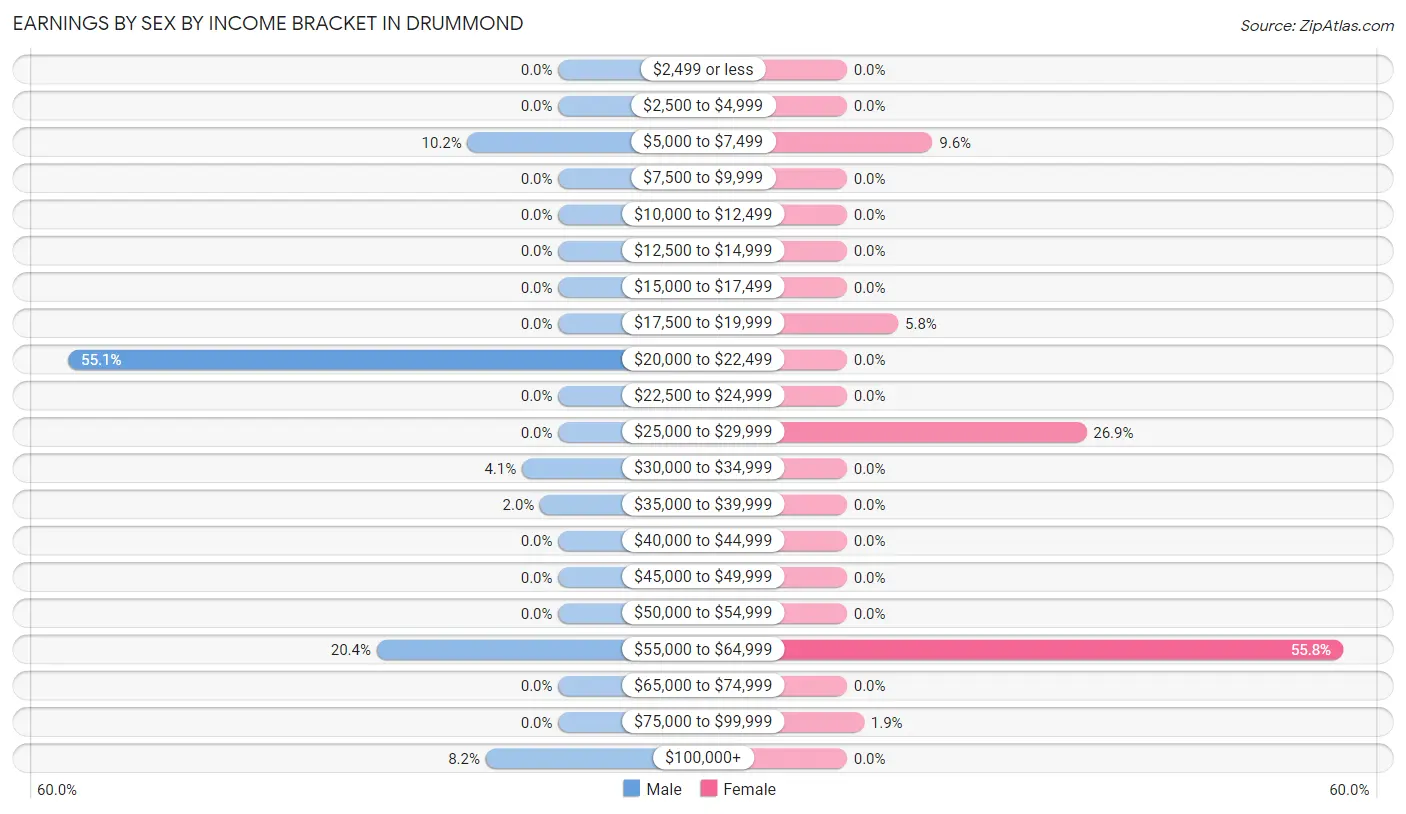
| Income | Male | Female |
| $2,499 or less | 0 (0.0%) | 0 (0.0%) |
| $2,500 to $4,999 | 0 (0.0%) | 0 (0.0%) |
| $5,000 to $7,499 | 5 (10.2%) | 5 (9.6%) |
| $7,500 to $9,999 | 0 (0.0%) | 0 (0.0%) |
| $10,000 to $12,499 | 0 (0.0%) | 0 (0.0%) |
| $12,500 to $14,999 | 0 (0.0%) | 0 (0.0%) |
| $15,000 to $17,499 | 0 (0.0%) | 0 (0.0%) |
| $17,500 to $19,999 | 0 (0.0%) | 3 (5.8%) |
| $20,000 to $22,499 | 27 (55.1%) | 0 (0.0%) |
| $22,500 to $24,999 | 0 (0.0%) | 0 (0.0%) |
| $25,000 to $29,999 | 0 (0.0%) | 14 (26.9%) |
| $30,000 to $34,999 | 2 (4.1%) | 0 (0.0%) |
| $35,000 to $39,999 | 1 (2.0%) | 0 (0.0%) |
| $40,000 to $44,999 | 0 (0.0%) | 0 (0.0%) |
| $45,000 to $49,999 | 0 (0.0%) | 0 (0.0%) |
| $50,000 to $54,999 | 0 (0.0%) | 0 (0.0%) |
| $55,000 to $64,999 | 10 (20.4%) | 29 (55.8%) |
| $65,000 to $74,999 | 0 (0.0%) | 0 (0.0%) |
| $75,000 to $99,999 | 0 (0.0%) | 1 (1.9%) |
| $100,000+ | 4 (8.2%) | 0 (0.0%) |
| Total | 49 (100.0%) | 52 (100.0%) |
Earnings by Sex by Educational Attainment in Drummond
| Educational Attainment | Male Income | Female Income |
| Less than High School | - | - |
| High School Diploma | - | - |
| College or Associate's Degree | - | - |
| Bachelor's Degree | - | - |
| Graduate Degree | - | - |
| Total | $21,806 | $57,500 |
Family Income in Drummond
Family Income Brackets in Drummond
According to the Drummond family income data, there are 25 families falling into the $50,000 to $74,999 income range, which is the most common income bracket and makes up 35.2% of all families.
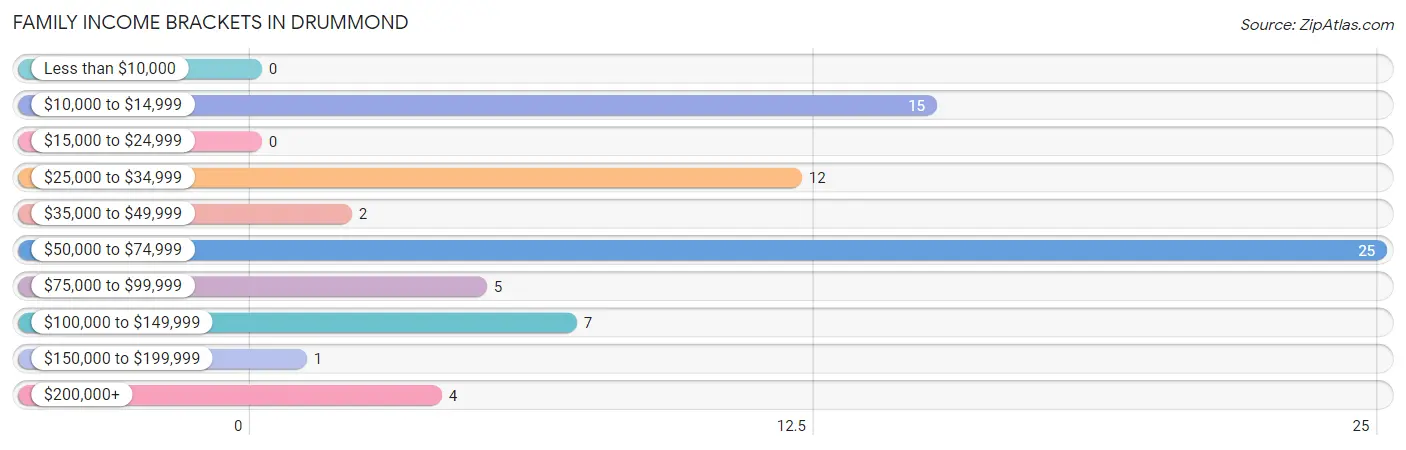
| Income Bracket | # Families | % Families |
| Less than $10,000 | 0 | 0.0% |
| $10,000 to $14,999 | 15 | 21.1% |
| $15,000 to $24,999 | 0 | 0.0% |
| $25,000 to $34,999 | 12 | 16.9% |
| $35,000 to $49,999 | 2 | 2.8% |
| $50,000 to $74,999 | 25 | 35.2% |
| $75,000 to $99,999 | 5 | 7.0% |
| $100,000 to $149,999 | 7 | 9.9% |
| $150,000 to $199,999 | 1 | 1.4% |
| $200,000+ | 4 | 5.6% |
Family Income by Famaliy Size in Drummond
4-person families (10 | 14.1%) account for the highest median family income in Drummond with $58,571 per family, while 2-person families (49 | 69.0%) have the highest median income of $17,054 per family member.
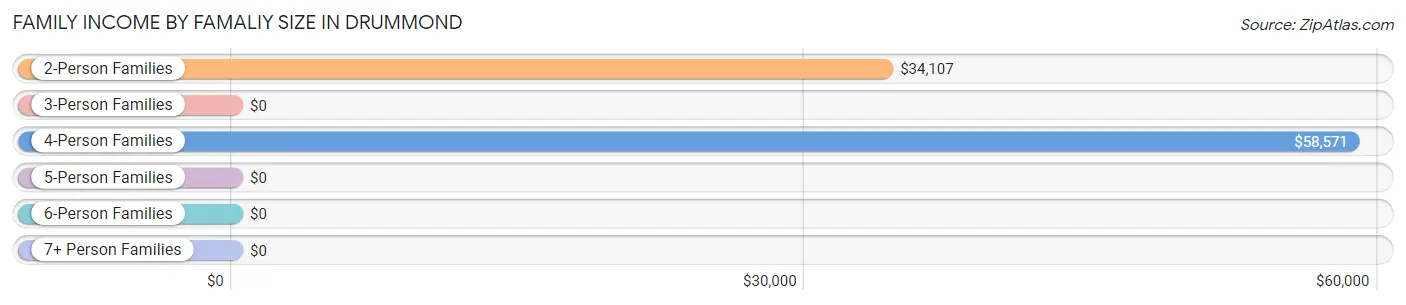
| Income Bracket | # Families | Median Income |
| 2-Person Families | 49 (69.0%) | $34,107 |
| 3-Person Families | 5 (7.0%) | $0 |
| 4-Person Families | 10 (14.1%) | $58,571 |
| 5-Person Families | 7 (9.9%) | $0 |
| 6-Person Families | 0 (0.0%) | $0 |
| 7+ Person Families | 0 (0.0%) | $0 |
| Total | 71 (100.0%) | $54,531 |
Family Income by Number of Earners in Drummond
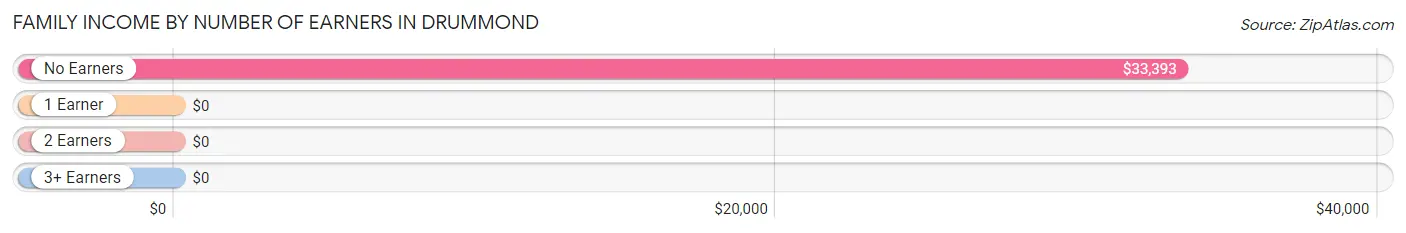
| Number of Earners | # Families | Median Income |
| No Earners | 35 (49.3%) | $33,393 |
| 1 Earner | 18 (25.4%) | $0 |
| 2 Earners | 18 (25.4%) | $0 |
| 3+ Earners | 0 (0.0%) | $0 |
| Total | 71 (100.0%) | $54,531 |
Household Income in Drummond
Household Income Brackets in Drummond
With 28 households falling in the category, the $10,000 to $14,999 income range is the most frequent in Drummond, accounting for 27.7% of all households.
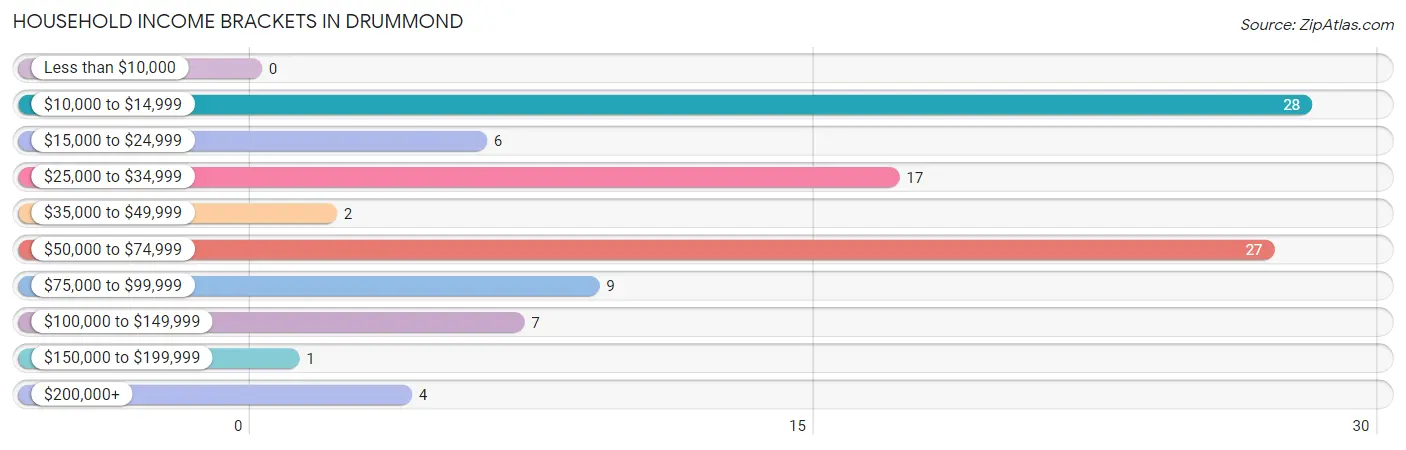
| Income Bracket | # Households | % Households |
| Less than $10,000 | 0 | 0.0% |
| $10,000 to $14,999 | 28 | 27.7% |
| $15,000 to $24,999 | 6 | 5.9% |
| $25,000 to $34,999 | 17 | 16.8% |
| $35,000 to $49,999 | 2 | 2.0% |
| $50,000 to $74,999 | 27 | 26.7% |
| $75,000 to $99,999 | 9 | 8.9% |
| $100,000 to $149,999 | 7 | 6.9% |
| $150,000 to $199,999 | 1 | 1.0% |
| $200,000+ | 4 | 4.0% |
Household Income by Householder Age in Drummond
The median household income in Drummond is $0, with the highest median household income of $56,000 found in the 25 to 44 years age bracket for the primary householder. A total of 18 households (17.8%) fall into this category.
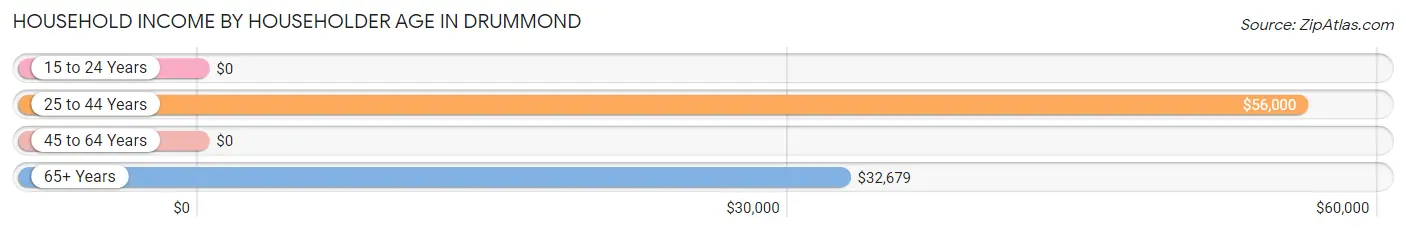
| Income Bracket | # Households | Median Income |
| 15 to 24 Years | 0 (0.0%) | $0 |
| 25 to 44 Years | 18 (17.8%) | $56,000 |
| 45 to 64 Years | 22 (21.8%) | $0 |
| 65+ Years | 61 (60.4%) | $32,679 |
| Total | 101 (100.0%) | $0 |
Poverty in Drummond
Income Below Poverty by Sex and Age in Drummond
With 16.8% poverty level for males and 13.3% for females among the residents of Drummond, 55 to 64 year old males and 18 to 24 year old females are the most vulnerable to poverty, with 15 males (60.0%) and 2 females (100.0%) in their respective age groups living below the poverty level.
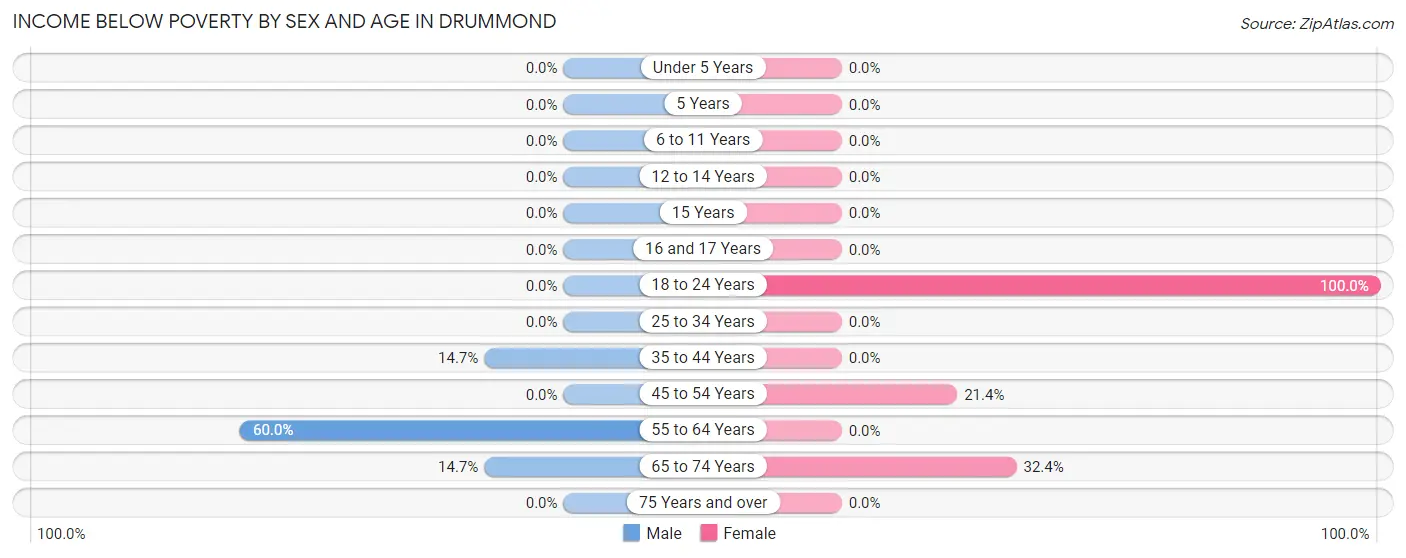
| Age Bracket | Male | Female |
| Under 5 Years | 0 (0.0%) | 0 (0.0%) |
| 5 Years | 0 (0.0%) | 0 (0.0%) |
| 6 to 11 Years | 0 (0.0%) | 0 (0.0%) |
| 12 to 14 Years | 0 (0.0%) | 0 (0.0%) |
| 15 Years | 0 (0.0%) | 0 (0.0%) |
| 16 and 17 Years | 0 (0.0%) | 0 (0.0%) |
| 18 to 24 Years | 0 (0.0%) | 2 (100.0%) |
| 25 to 34 Years | 0 (0.0%) | 0 (0.0%) |
| 35 to 44 Years | 5 (14.7%) | 0 (0.0%) |
| 45 to 54 Years | 0 (0.0%) | 3 (21.4%) |
| 55 to 64 Years | 15 (60.0%) | 0 (0.0%) |
| 65 to 74 Years | 5 (14.7%) | 12 (32.4%) |
| 75 Years and over | 0 (0.0%) | 0 (0.0%) |
| Total | 25 (16.8%) | 17 (13.3%) |
Income Above Poverty by Sex and Age in Drummond
According to the poverty statistics in Drummond, males aged under 5 years and females aged under 5 years are the age groups that are most secure financially, with 100.0% of males and 100.0% of females in these age groups living above the poverty line.
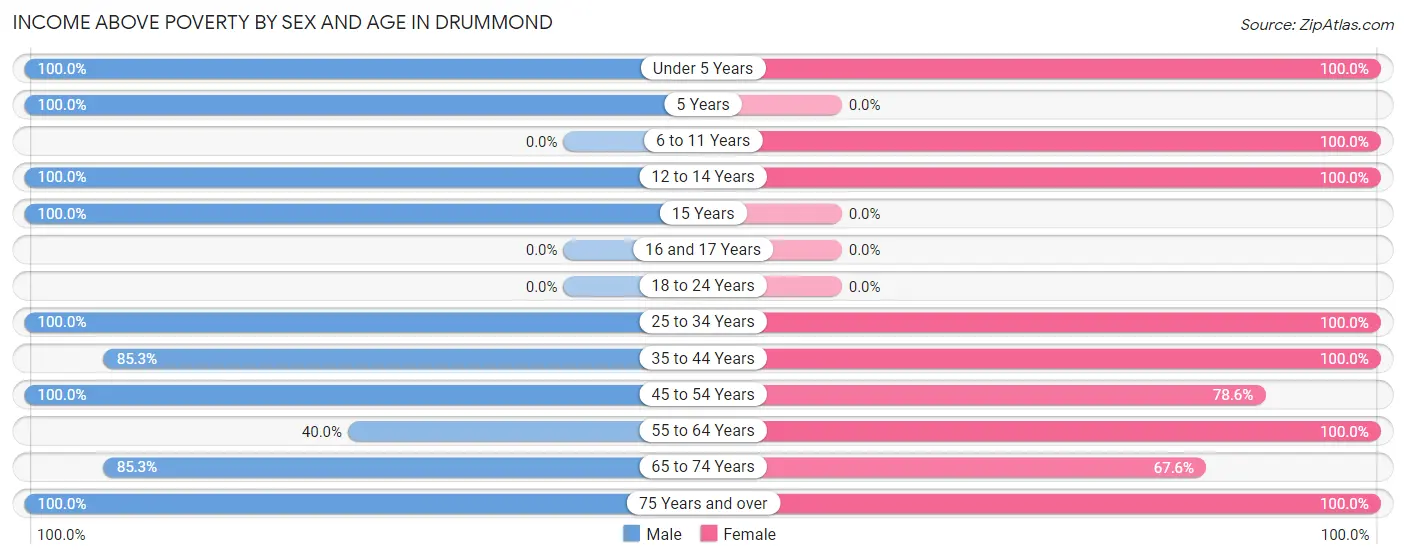
| Age Bracket | Male | Female |
| Under 5 Years | 7 (100.0%) | 14 (100.0%) |
| 5 Years | 6 (100.0%) | 0 (0.0%) |
| 6 to 11 Years | 0 (0.0%) | 7 (100.0%) |
| 12 to 14 Years | 13 (100.0%) | 9 (100.0%) |
| 15 Years | 1 (100.0%) | 0 (0.0%) |
| 16 and 17 Years | 0 (0.0%) | 0 (0.0%) |
| 18 to 24 Years | 0 (0.0%) | 0 (0.0%) |
| 25 to 34 Years | 9 (100.0%) | 4 (100.0%) |
| 35 to 44 Years | 29 (85.3%) | 29 (100.0%) |
| 45 to 54 Years | 4 (100.0%) | 11 (78.6%) |
| 55 to 64 Years | 10 (40.0%) | 11 (100.0%) |
| 65 to 74 Years | 29 (85.3%) | 25 (67.6%) |
| 75 Years and over | 16 (100.0%) | 1 (100.0%) |
| Total | 124 (83.2%) | 111 (86.7%) |
Income Below Poverty Among Married-Couple Families in Drummond
The poverty statistics for married-couple families in Drummond show that 22.7% or 15 of the total 66 families live below the poverty line. Families with no children have the highest poverty rate of 30.6%, comprising of 15 families. On the other hand, families with 1 or 2 children have the lowest poverty rate of 0.0%, which includes 0 families.
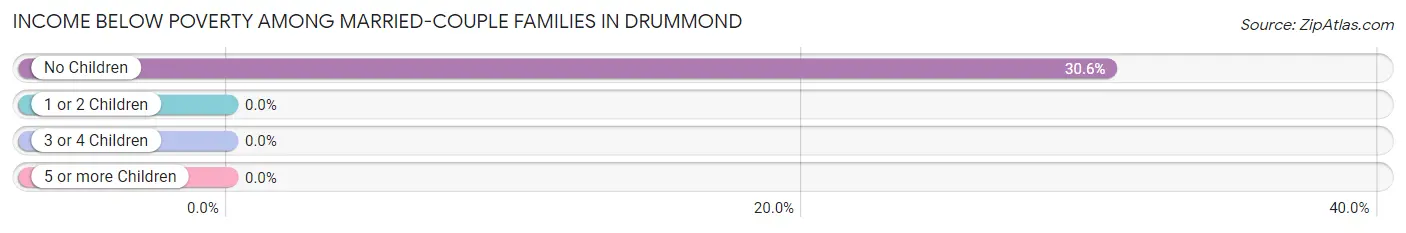
| Children | Above Poverty | Below Poverty |
| No Children | 34 (69.4%) | 15 (30.6%) |
| 1 or 2 Children | 17 (100.0%) | 0 (0.0%) |
| 3 or 4 Children | 0 (0.0%) | 0 (0.0%) |
| 5 or more Children | 0 (0.0%) | 0 (0.0%) |
| Total | 51 (77.3%) | 15 (22.7%) |
Income Below Poverty Among Single-Parent Households in Drummond
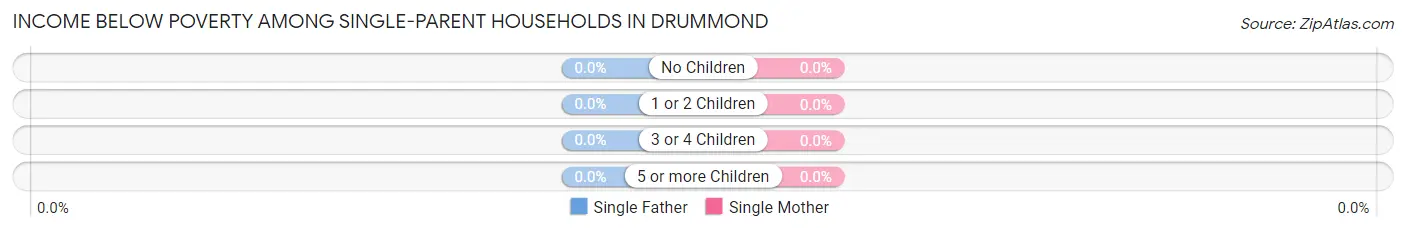
| Children | Single Father | Single Mother |
| No Children | 0 (0.0%) | 0 (0.0%) |
| 1 or 2 Children | 0 (0.0%) | 0 (0.0%) |
| 3 or 4 Children | 0 (0.0%) | 0 (0.0%) |
| 5 or more Children | 0 (0.0%) | 0 (0.0%) |
| Total | 0 (0.0%) | 0 (0.0%) |
Income Below Poverty Among Married-Couple vs Single-Parent Households in Drummond
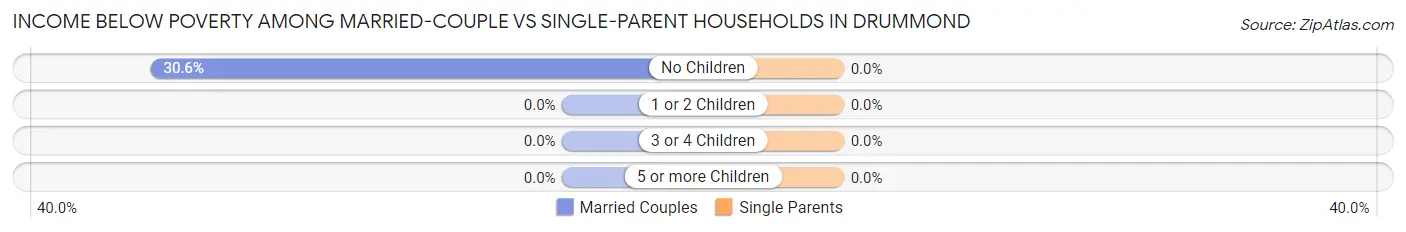
| Children | Married-Couple Families | Single-Parent Households |
| No Children | 15 (30.6%) | 0 (0.0%) |
| 1 or 2 Children | 0 (0.0%) | 0 (0.0%) |
| 3 or 4 Children | 0 (0.0%) | 0 (0.0%) |
| 5 or more Children | 0 (0.0%) | 0 (0.0%) |
| Total | 15 (22.7%) | 0 (0.0%) |
Race in Drummond
The most populous races in Drummond are White / Caucasian (253 | 91.3%), Two or more Races (18 | 6.5%), and Native / Alaskan (6 | 2.2%).
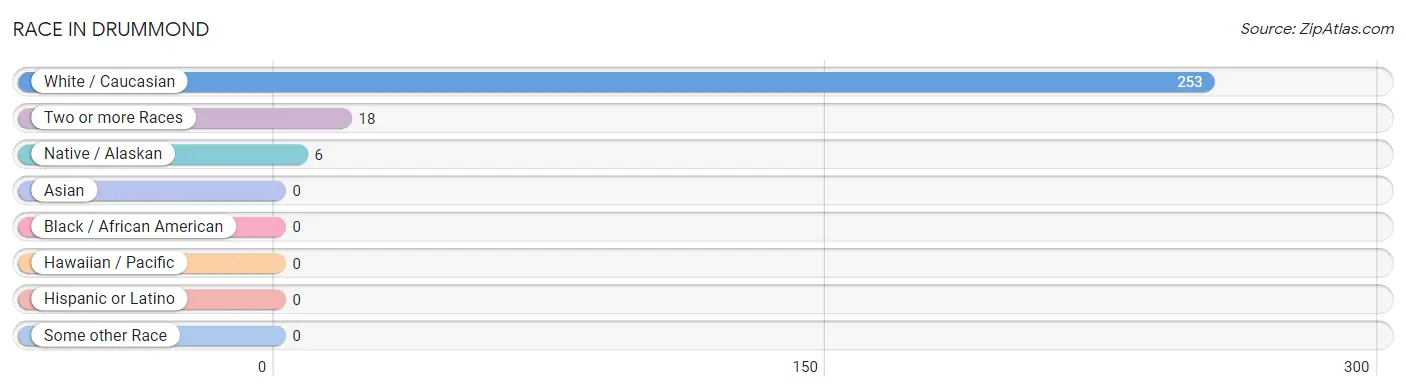
| Race | # Population | % Population |
| Asian | 0 | 0.0% |
| Black / African American | 0 | 0.0% |
| Hawaiian / Pacific | 0 | 0.0% |
| Hispanic or Latino | 0 | 0.0% |
| Native / Alaskan | 6 | 2.2% |
| White / Caucasian | 253 | 91.3% |
| Two or more Races | 18 | 6.5% |
| Some other Race | 0 | 0.0% |
| Total | 277 | 100.0% |
Ancestry in Drummond
The most populous ancestries reported in Drummond are American (51 | 18.4%), German (51 | 18.4%), Norwegian (35 | 12.6%), Swedish (31 | 11.2%), and Irish (29 | 10.5%), together accounting for 71.1% of all Drummond residents.
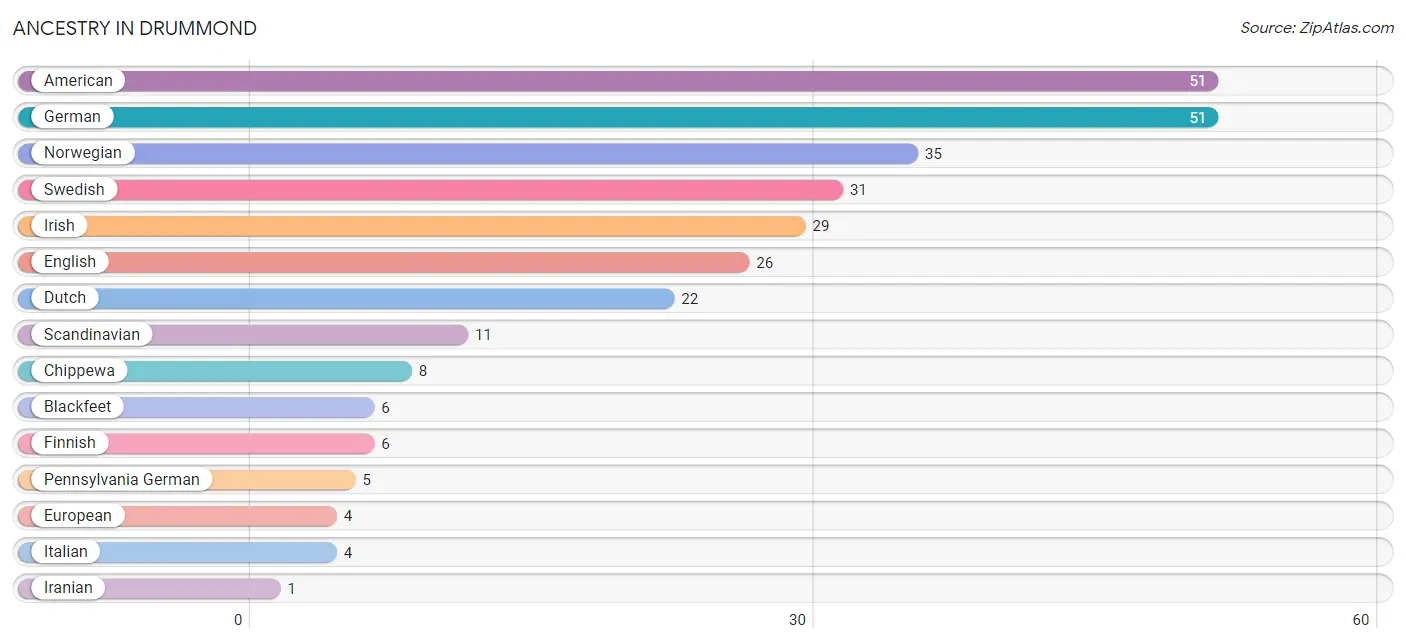
| Ancestry | # Population | % Population |
| American | 51 | 18.4% |
| Blackfeet | 6 | 2.2% |
| Chippewa | 8 | 2.9% |
| Dutch | 22 | 7.9% |
| English | 26 | 9.4% |
| European | 4 | 1.4% |
| Finnish | 6 | 2.2% |
| German | 51 | 18.4% |
| Iranian | 1 | 0.4% |
| Irish | 29 | 10.5% |
| Italian | 4 | 1.4% |
| Norwegian | 35 | 12.6% |
| Pennsylvania German | 5 | 1.8% |
| Scandinavian | 11 | 4.0% |
| Swedish | 31 | 11.2% | View All 15 Rows |
Immigrants in Drummond
The most numerous immigrant groups reported in Drummond came from Asia (1 | 0.4%), Iran (1 | 0.4%), and South Central Asia (1 | 0.4%), together accounting for 1.1% of all Drummond residents.
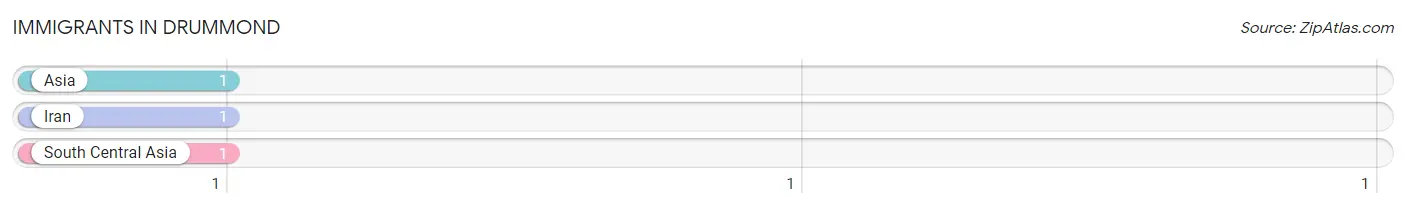
| Immigration Origin | # Population | % Population |
| Asia | 1 | 0.4% |
| Iran | 1 | 0.4% |
| South Central Asia | 1 | 0.4% | View All 3 Rows |
Sex and Age in Drummond
Sex and Age in Drummond
The most populous age groups in Drummond are 35 to 39 Years (32 | 21.5%) for men and 40 to 44 Years (24 | 18.8%) for women.
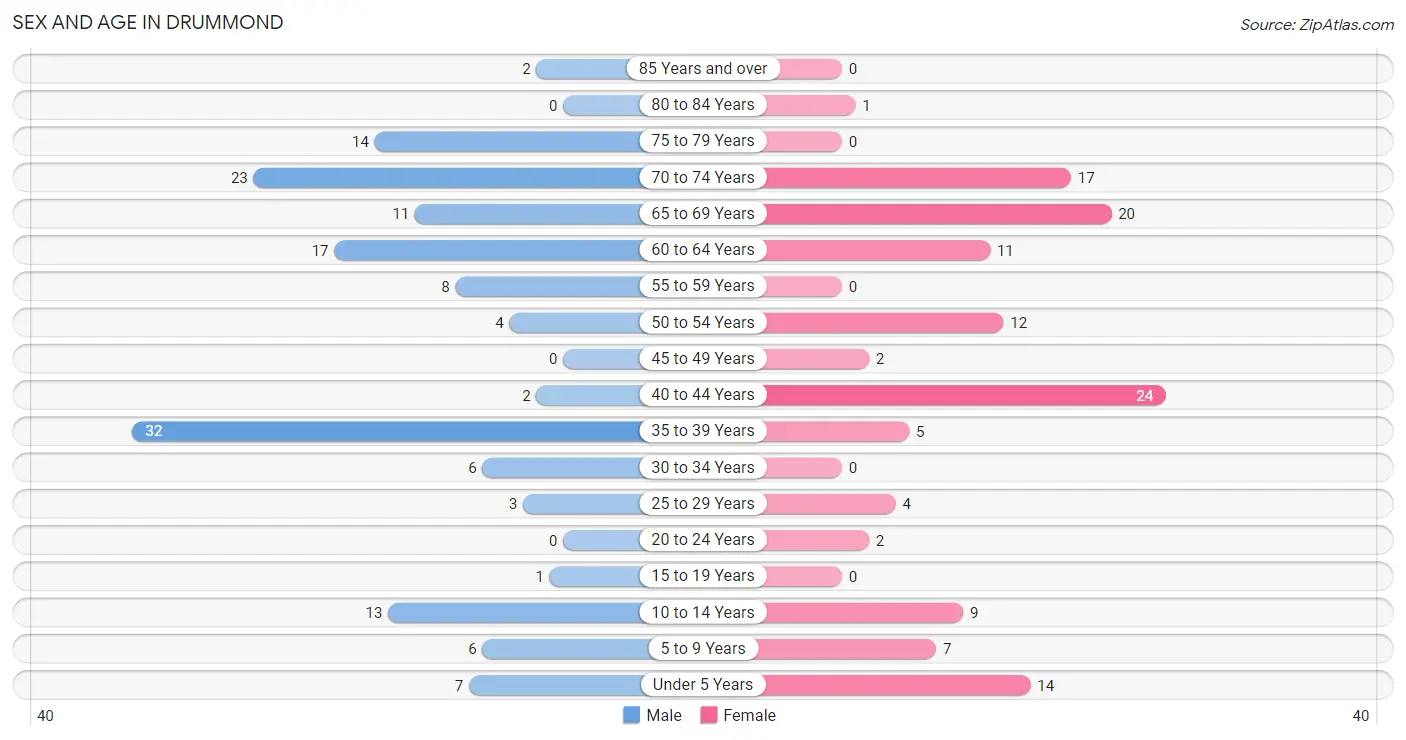
| Age Bracket | Male | Female |
| Under 5 Years | 7 (4.7%) | 14 (10.9%) |
| 5 to 9 Years | 6 (4.0%) | 7 (5.5%) |
| 10 to 14 Years | 13 (8.7%) | 9 (7.0%) |
| 15 to 19 Years | 1 (0.7%) | 0 (0.0%) |
| 20 to 24 Years | 0 (0.0%) | 2 (1.6%) |
| 25 to 29 Years | 3 (2.0%) | 4 (3.1%) |
| 30 to 34 Years | 6 (4.0%) | 0 (0.0%) |
| 35 to 39 Years | 32 (21.5%) | 5 (3.9%) |
| 40 to 44 Years | 2 (1.3%) | 24 (18.8%) |
| 45 to 49 Years | 0 (0.0%) | 2 (1.6%) |
| 50 to 54 Years | 4 (2.7%) | 12 (9.4%) |
| 55 to 59 Years | 8 (5.4%) | 0 (0.0%) |
| 60 to 64 Years | 17 (11.4%) | 11 (8.6%) |
| 65 to 69 Years | 11 (7.4%) | 20 (15.6%) |
| 70 to 74 Years | 23 (15.4%) | 17 (13.3%) |
| 75 to 79 Years | 14 (9.4%) | 0 (0.0%) |
| 80 to 84 Years | 0 (0.0%) | 1 (0.8%) |
| 85 Years and over | 2 (1.3%) | 0 (0.0%) |
| Total | 149 (100.0%) | 128 (100.0%) |
Families and Households in Drummond
Median Family Size in Drummond
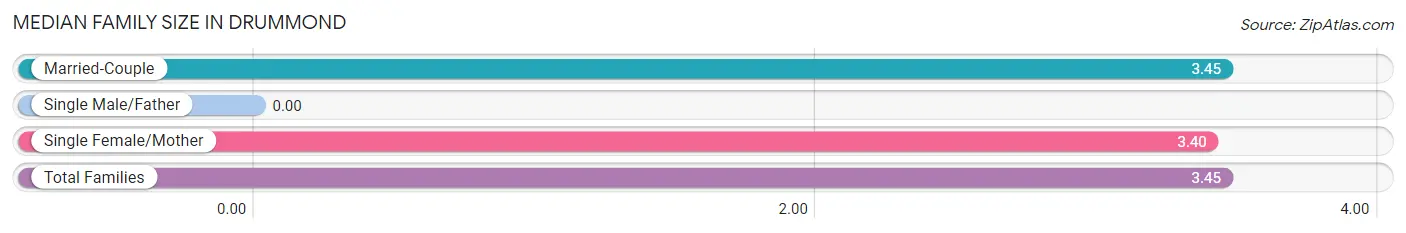
| Family Type | # Families | Family Size |
| Married-Couple | 66 (93.0%) | 3.45 |
| Single Male/Father | 0 (0.0%) | - |
| Single Female/Mother | 5 (7.0%) | 3.40 |
| Total Families | 71 (100.0%) | 3.45 |
Median Household Size in Drummond
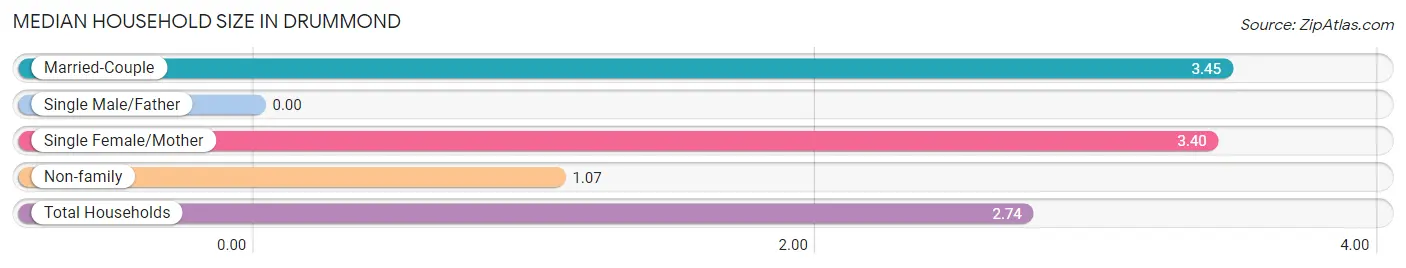
| Household Type | # Households | Household Size |
| Married-Couple | 66 (65.3%) | 3.45 |
| Single Male/Father | 0 (0.0%) | - |
| Single Female/Mother | 5 (5.0%) | 3.40 |
| Non-family | 30 (29.7%) | 1.07 |
| Total Households | 101 (100.0%) | 2.74 |
Household Size by Marriage Status in Drummond
Out of a total of 101 households in Drummond, 71 (70.3%) are family households, while 30 (29.7%) are nonfamily households. The most numerous type of family households are 2-person households, comprising 49, and the most common type of nonfamily households are 1-person households, comprising 28.
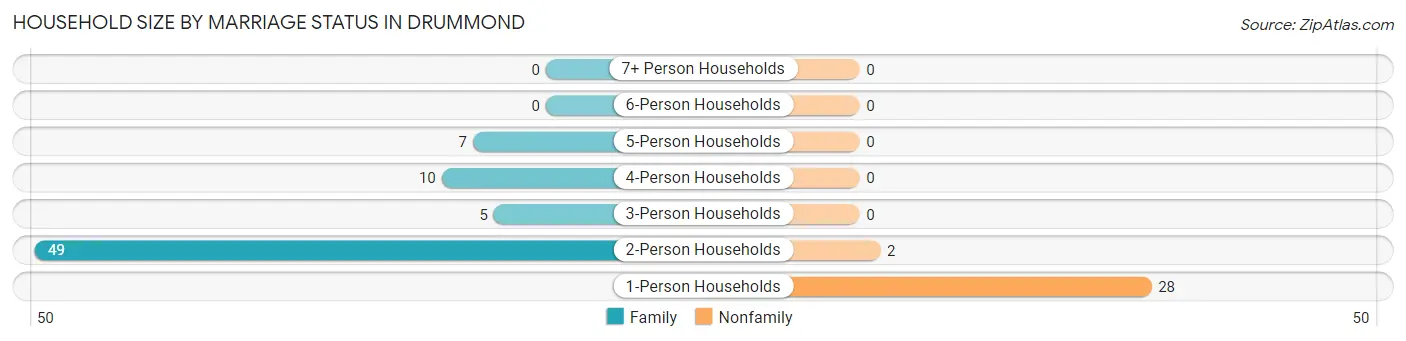
| Household Size | Family Households | Nonfamily Households |
| 1-Person Households | - | 28 (27.7%) |
| 2-Person Households | 49 (48.5%) | 2 (2.0%) |
| 3-Person Households | 5 (5.0%) | 0 (0.0%) |
| 4-Person Households | 10 (9.9%) | 0 (0.0%) |
| 5-Person Households | 7 (6.9%) | 0 (0.0%) |
| 6-Person Households | 0 (0.0%) | 0 (0.0%) |
| 7+ Person Households | 0 (0.0%) | 0 (0.0%) |
| Total | 71 (70.3%) | 30 (29.7%) |
Female Fertility in Drummond
Fertility by Age in Drummond
| Age Bracket | Women with Births | Births / 1,000 Women |
| 15 to 19 years | 0 (0.0%) | 0.0 |
| 20 to 34 years | 0 (0.0%) | 0.0 |
| 35 to 50 years | 0 (0.0%) | 0.0 |
| Total | 0 (0.0%) | 0.0 |
Fertility by Age by Marriage Status in Drummond
| Age Bracket | Married | Unmarried |
| 15 to 19 years | 0 (0.0%) | 0 (0.0%) |
| 20 to 34 years | 0 (0.0%) | 0 (0.0%) |
| 35 to 50 years | 0 (0.0%) | 0 (0.0%) |
| Total | 0 (0.0%) | 0 (0.0%) |
Fertility by Education in Drummond
| Educational Attainment | Women with Births | Births / 1,000 Women |
| Less than High School | 0 (0.0%) | 0.0 |
| High School Diploma | 0 (0.0%) | 0.0 |
| College or Associate's Degree | 0 (0.0%) | 0.0 |
| Bachelor's Degree | 0 (0.0%) | 0.0 |
| Graduate Degree | 0 (0.0%) | 0.0 |
| Total | 0 (0.0%) | 0.0 |
Fertility by Education by Marriage Status in Drummond
| Educational Attainment | Married | Unmarried |
| Less than High School | 0 (0.0%) | 0 (0.0%) |
| High School Diploma | 0 (0.0%) | 0 (0.0%) |
| College or Associate's Degree | 0 (0.0%) | 0 (0.0%) |
| Bachelor's Degree | 0 (0.0%) | 0 (0.0%) |
| Graduate Degree | 0 (0.0%) | 0 (0.0%) |
| Total | 0 (0.0%) | 0 (0.0%) |
Employment Characteristics in Drummond
Employment by Class of Employer in Drummond
Among the 101 employed individuals in Drummond, private company employees (34 | 33.7%), local government employees (31 | 30.7%), and self-employed (incorporated) (26 | 25.7%) make up the most common classes of employment.
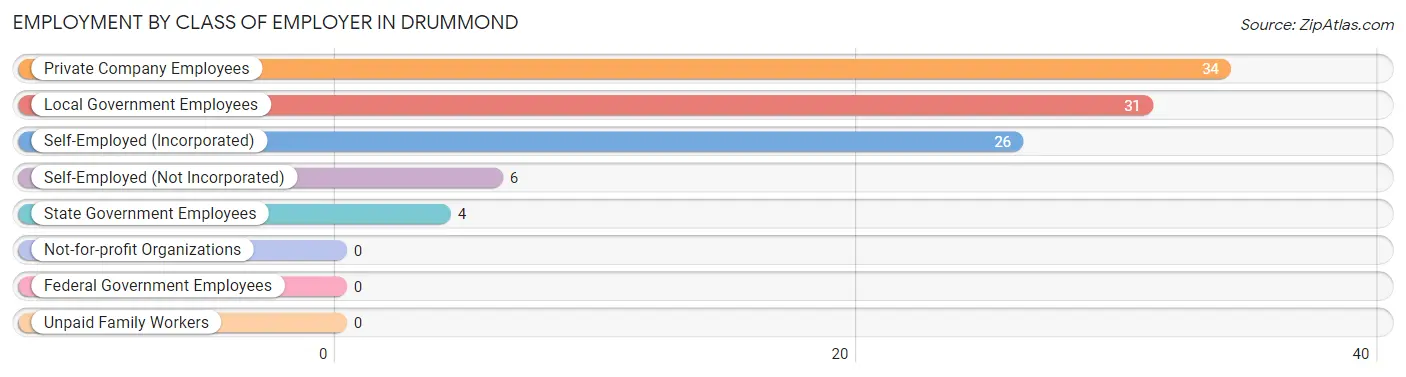
| Employer Class | # Employees | % Employees |
| Private Company Employees | 34 | 33.7% |
| Self-Employed (Incorporated) | 26 | 25.7% |
| Self-Employed (Not Incorporated) | 6 | 5.9% |
| Not-for-profit Organizations | 0 | 0.0% |
| Local Government Employees | 31 | 30.7% |
| State Government Employees | 4 | 4.0% |
| Federal Government Employees | 0 | 0.0% |
| Unpaid Family Workers | 0 | 0.0% |
| Total | 101 | 100.0% |
Employment Status by Age in Drummond
According to the labor force statistics for Drummond, out of the total population over 16 years of age (220), 46.8% or 103 individuals are in the labor force, with 1.9% or 2 of them unemployed. The age group with the highest labor force participation rate is 20 to 24 years, with 100.0% or 2 individuals in the labor force. Within the labor force, the 45 to 54 years age range has the highest percentage of unemployed individuals, with 11.1% or 2 of them being unemployed.
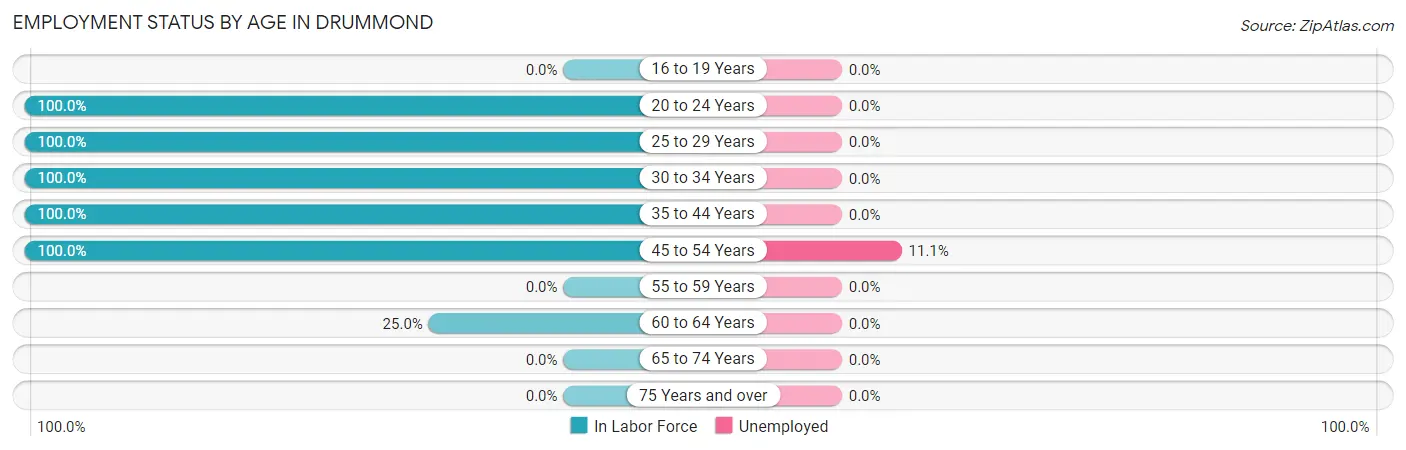
| Age Bracket | In Labor Force | Unemployed |
| 16 to 19 Years | 0 (0.0%) | 0 (0.0%) |
| 20 to 24 Years | 2 (100.0%) | 0 (0.0%) |
| 25 to 29 Years | 7 (100.0%) | 0 (0.0%) |
| 30 to 34 Years | 6 (100.0%) | 0 (0.0%) |
| 35 to 44 Years | 63 (100.0%) | 0 (0.0%) |
| 45 to 54 Years | 18 (100.0%) | 2 (11.1%) |
| 55 to 59 Years | 0 (0.0%) | 0 (0.0%) |
| 60 to 64 Years | 7 (25.0%) | 0 (0.0%) |
| 65 to 74 Years | 0 (0.0%) | 0 (0.0%) |
| 75 Years and over | 0 (0.0%) | 0 (0.0%) |
| Total | 103 (46.8%) | 2 (1.9%) |
Employment Status by Educational Attainment in Drummond
According to labor force statistics for Drummond, 77.7% of individuals (101) out of the total population between 25 and 64 years of age (130) are in the labor force, with 2.0% or 2 of them being unemployed. The group with the highest labor force participation rate are those with the educational attainment of less than high school, with 100.0% or 24 individuals in the labor force. Within the labor force, individuals with college / associate degree education have the highest percentage of unemployment, with 12.5% or 2 of them being unemployed.
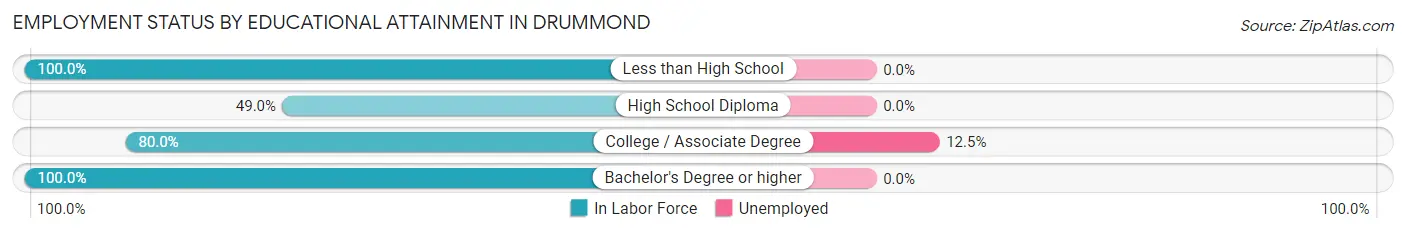
| Educational Attainment | In Labor Force | Unemployed |
| Less than High School | 24 (100.0%) | 0 (0.0%) |
| High School Diploma | 24 (49.0%) | 0 (0.0%) |
| College / Associate Degree | 16 (80.0%) | 2 (12.5%) |
| Bachelor's Degree or higher | 37 (100.0%) | 0 (0.0%) |
| Total | 101 (77.7%) | 3 (2.0%) |
Employment Occupations by Sex in Drummond
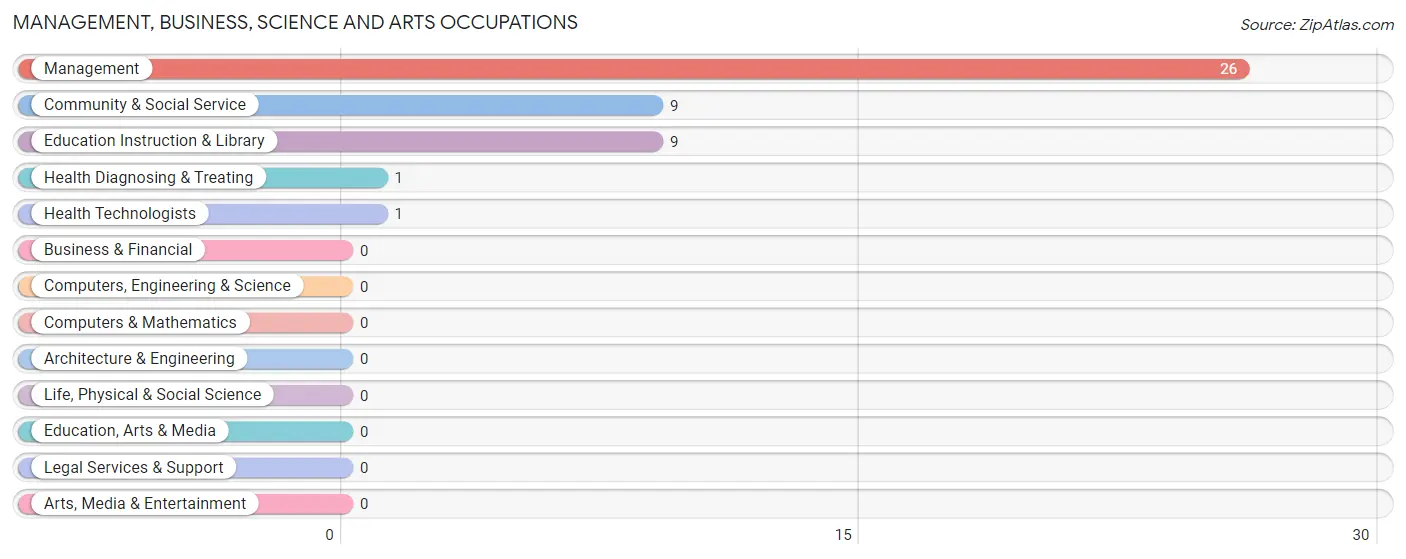
Management, Business, Science and Arts Occupations
The most common Management, Business, Science and Arts occupations in Drummond are Management (26 | 25.7%), Community & Social Service (9 | 8.9%), Education Instruction & Library (9 | 8.9%), Health Diagnosing & Treating (1 | 1.0%), and Health Technologists (1 | 1.0%).
Management, Business, Science and Arts Occupations by Sex
Within the Management, Business, Science and Arts occupations in Drummond, the most male-oriented occupations are Community & Social Service (22.2%), Education Instruction & Library (22.2%), and Management (7.7%), while the most female-oriented occupations are Health Diagnosing & Treating (100.0%), Health Technologists (100.0%), and Management (92.3%).
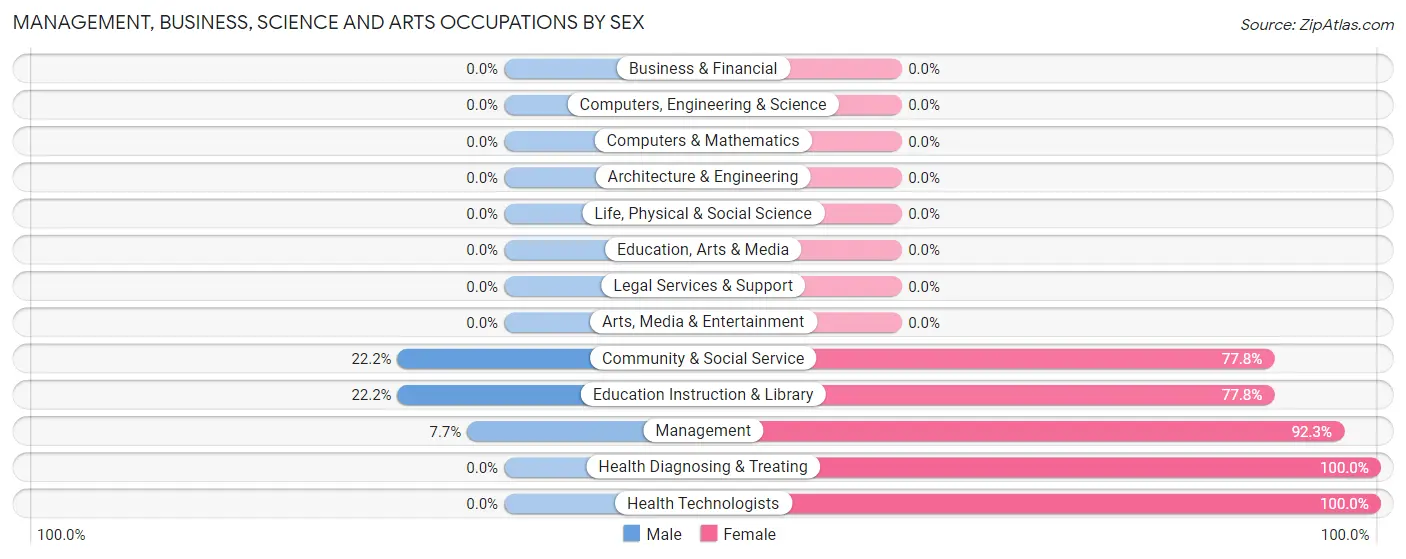
| Occupation | Male | Female |
| Management | 2 (7.7%) | 24 (92.3%) |
| Business & Financial | 0 (0.0%) | 0 (0.0%) |
| Computers, Engineering & Science | 0 (0.0%) | 0 (0.0%) |
| Computers & Mathematics | 0 (0.0%) | 0 (0.0%) |
| Architecture & Engineering | 0 (0.0%) | 0 (0.0%) |
| Life, Physical & Social Science | 0 (0.0%) | 0 (0.0%) |
| Community & Social Service | 2 (22.2%) | 7 (77.8%) |
| Education, Arts & Media | 0 (0.0%) | 0 (0.0%) |
| Legal Services & Support | 0 (0.0%) | 0 (0.0%) |
| Education Instruction & Library | 2 (22.2%) | 7 (77.8%) |
| Arts, Media & Entertainment | 0 (0.0%) | 0 (0.0%) |
| Health Diagnosing & Treating | 0 (0.0%) | 1 (100.0%) |
| Health Technologists | 0 (0.0%) | 1 (100.0%) |
| Total (Category) | 4 (11.1%) | 32 (88.9%) |
| Total (Overall) | 49 (48.5%) | 52 (51.5%) |
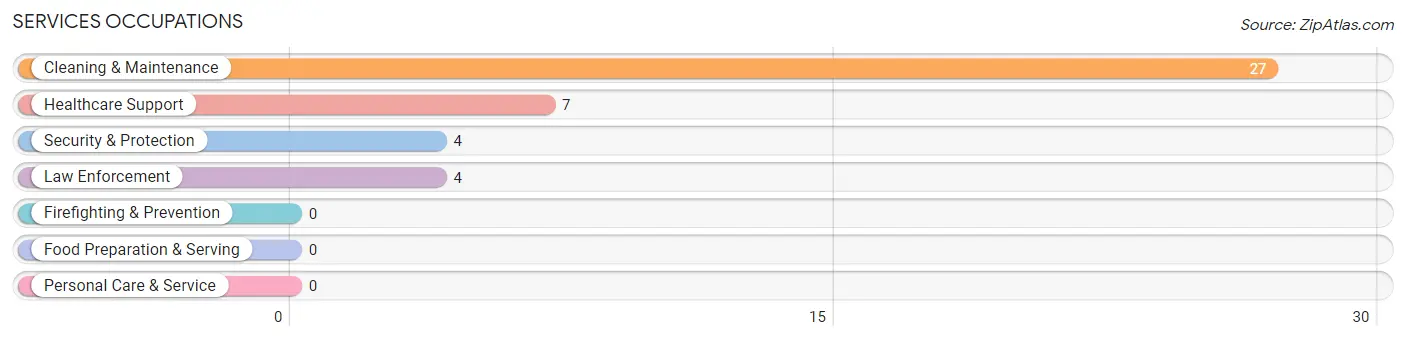
Services Occupations
The most common Services occupations in Drummond are Cleaning & Maintenance (27 | 26.7%), Healthcare Support (7 | 6.9%), Security & Protection (4 | 4.0%), and Law Enforcement (4 | 4.0%).
Services Occupations by Sex
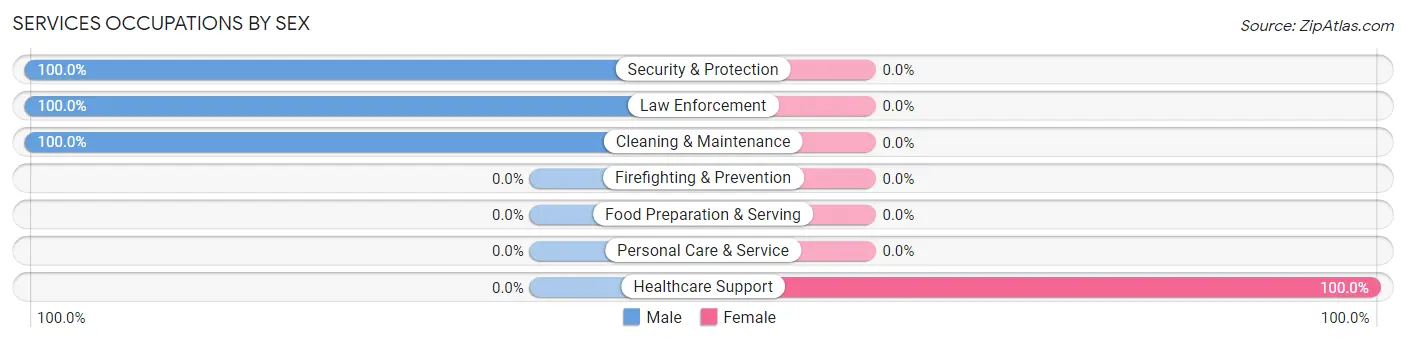
| Occupation | Male | Female |
| Healthcare Support | 0 (0.0%) | 7 (100.0%) |
| Security & Protection | 4 (100.0%) | 0 (0.0%) |
| Firefighting & Prevention | 0 (0.0%) | 0 (0.0%) |
| Law Enforcement | 4 (100.0%) | 0 (0.0%) |
| Food Preparation & Serving | 0 (0.0%) | 0 (0.0%) |
| Cleaning & Maintenance | 27 (100.0%) | 0 (0.0%) |
| Personal Care & Service | 0 (0.0%) | 0 (0.0%) |
| Total (Category) | 31 (81.6%) | 7 (18.4%) |
| Total (Overall) | 49 (48.5%) | 52 (51.5%) |
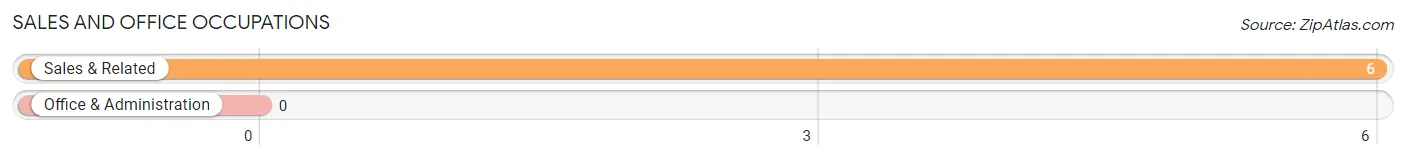
Sales and Office Occupations
The most common Sales and Office occupations in Drummond are , and Sales & Related (6 | 5.9%).
Sales and Office Occupations by Sex
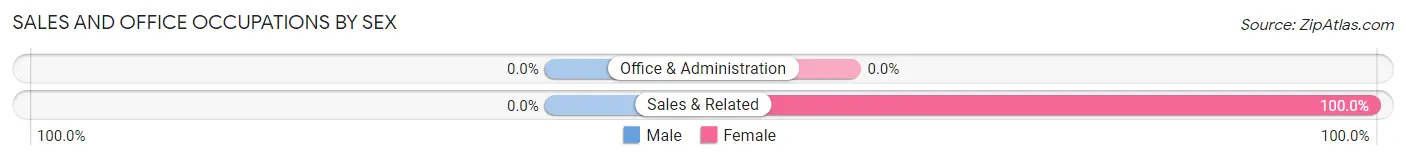
| Occupation | Male | Female |
| Sales & Related | 0 (0.0%) | 6 (100.0%) |
| Office & Administration | 0 (0.0%) | 0 (0.0%) |
| Total (Category) | 0 (0.0%) | 6 (100.0%) |
| Total (Overall) | 49 (48.5%) | 52 (51.5%) |
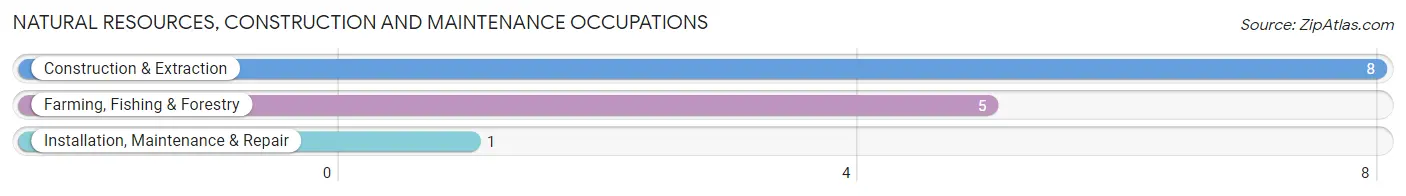
Natural Resources, Construction and Maintenance Occupations
The most common Natural Resources, Construction and Maintenance occupations in Drummond are Construction & Extraction (8 | 7.9%), Farming, Fishing & Forestry (5 | 5.0%), and Installation, Maintenance & Repair (1 | 1.0%).
Natural Resources, Construction and Maintenance Occupations by Sex
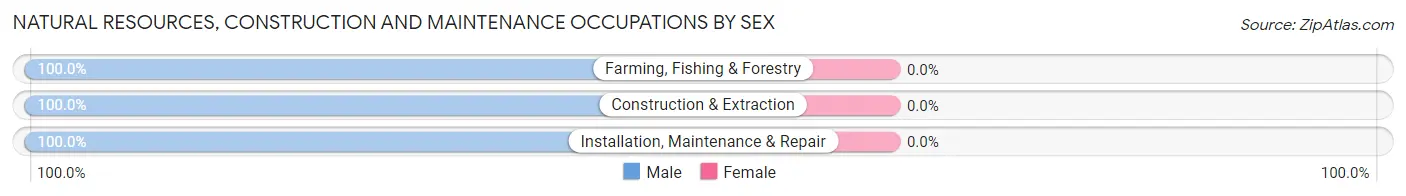
| Occupation | Male | Female |
| Farming, Fishing & Forestry | 5 (100.0%) | 0 (0.0%) |
| Construction & Extraction | 8 (100.0%) | 0 (0.0%) |
| Installation, Maintenance & Repair | 1 (100.0%) | 0 (0.0%) |
| Total (Category) | 14 (100.0%) | 0 (0.0%) |
| Total (Overall) | 49 (48.5%) | 52 (51.5%) |
Production, Transportation and Moving Occupations
The most common Production, Transportation and Moving occupations in Drummond are Transportation (5 | 5.0%), and Production (2 | 2.0%).
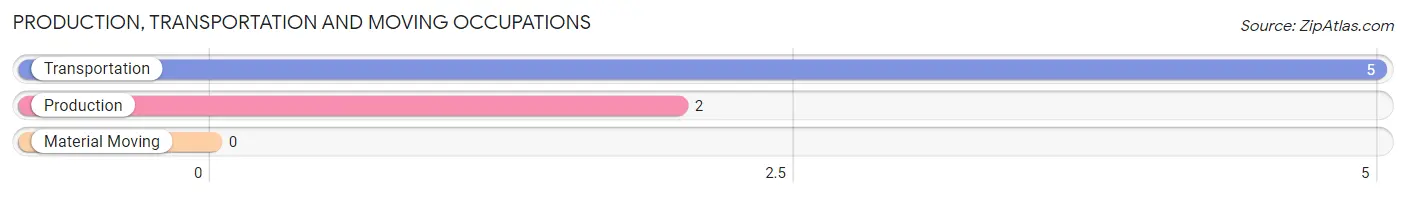
Production, Transportation and Moving Occupations by Sex
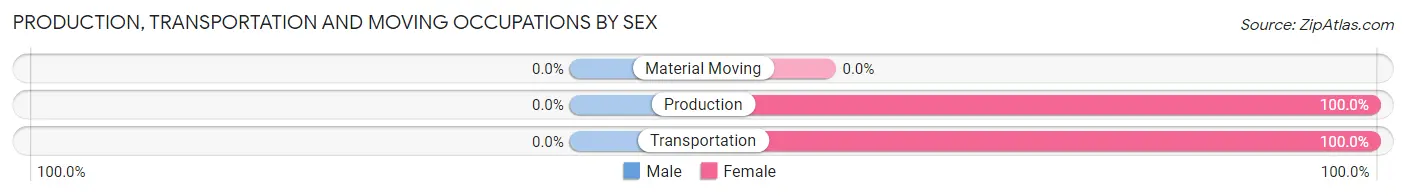
| Occupation | Male | Female |
| Production | 0 (0.0%) | 2 (100.0%) |
| Transportation | 0 (0.0%) | 5 (100.0%) |
| Material Moving | 0 (0.0%) | 0 (0.0%) |
| Total (Category) | 0 (0.0%) | 7 (100.0%) |
| Total (Overall) | 49 (48.5%) | 52 (51.5%) |
Employment Industries by Sex in Drummond
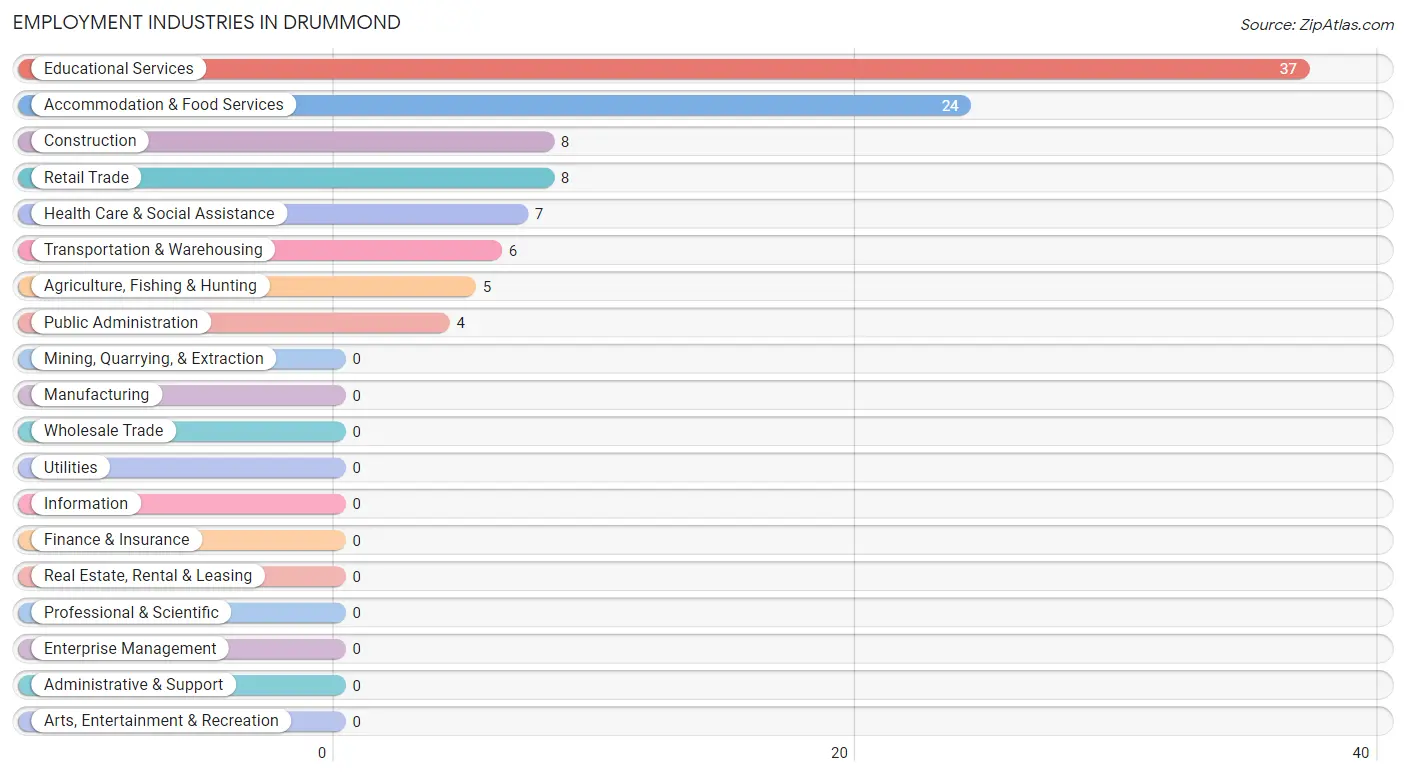
Employment Industries in Drummond
The major employment industries in Drummond include Educational Services (37 | 36.6%), Accommodation & Food Services (24 | 23.8%), Construction (8 | 7.9%), Retail Trade (8 | 7.9%), and Health Care & Social Assistance (7 | 6.9%).
Employment Industries by Sex in Drummond
The Drummond industries that see more men than women are Agriculture, Fishing & Hunting (100.0%), Construction (100.0%), and Public Administration (100.0%), whereas the industries that tend to have a higher number of women are Retail Trade (100.0%), Health Care & Social Assistance (100.0%), and Accommodation & Food Services (100.0%).
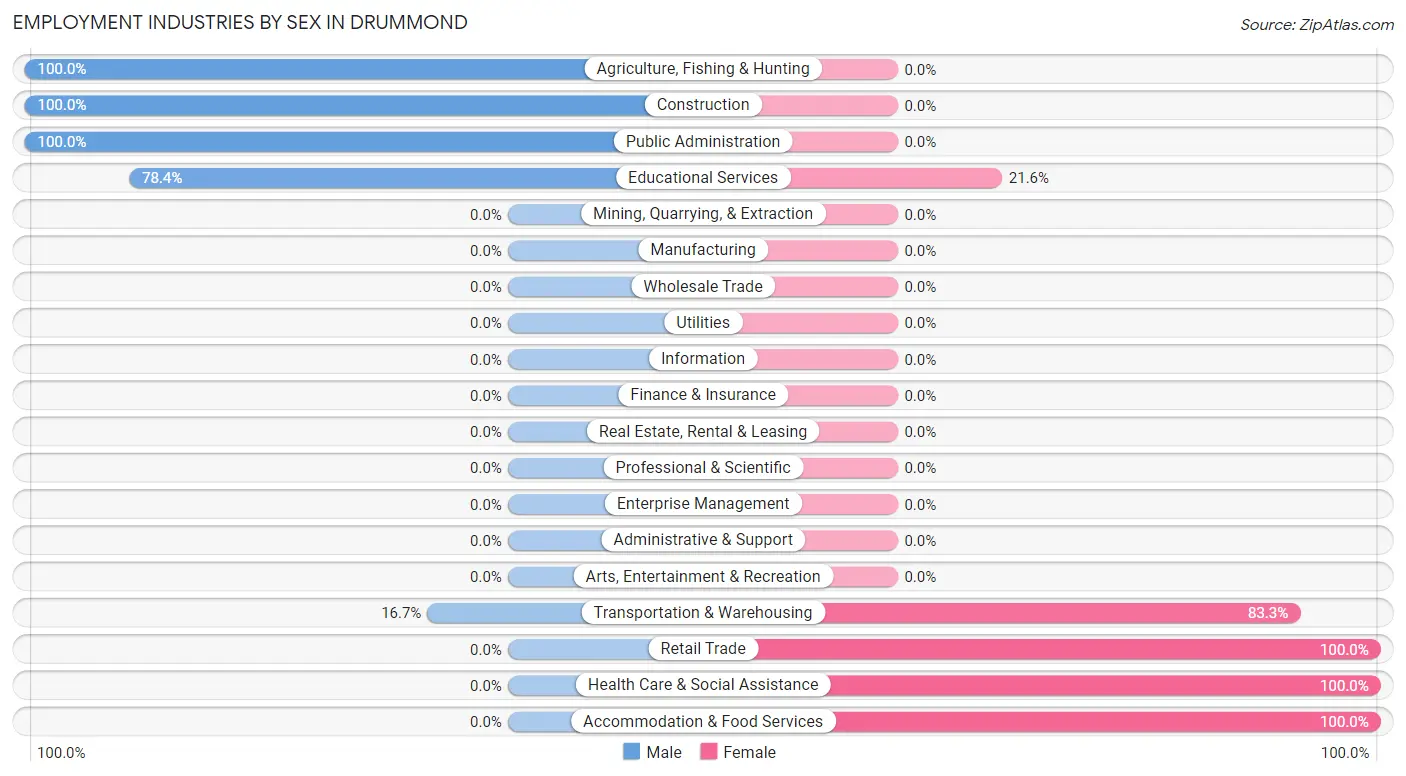
| Industry | Male | Female |
| Agriculture, Fishing & Hunting | 5 (100.0%) | 0 (0.0%) |
| Mining, Quarrying, & Extraction | 0 (0.0%) | 0 (0.0%) |
| Construction | 8 (100.0%) | 0 (0.0%) |
| Manufacturing | 0 (0.0%) | 0 (0.0%) |
| Wholesale Trade | 0 (0.0%) | 0 (0.0%) |
| Retail Trade | 0 (0.0%) | 8 (100.0%) |
| Transportation & Warehousing | 1 (16.7%) | 5 (83.3%) |
| Utilities | 0 (0.0%) | 0 (0.0%) |
| Information | 0 (0.0%) | 0 (0.0%) |
| Finance & Insurance | 0 (0.0%) | 0 (0.0%) |
| Real Estate, Rental & Leasing | 0 (0.0%) | 0 (0.0%) |
| Professional & Scientific | 0 (0.0%) | 0 (0.0%) |
| Enterprise Management | 0 (0.0%) | 0 (0.0%) |
| Administrative & Support | 0 (0.0%) | 0 (0.0%) |
| Educational Services | 29 (78.4%) | 8 (21.6%) |
| Health Care & Social Assistance | 0 (0.0%) | 7 (100.0%) |
| Arts, Entertainment & Recreation | 0 (0.0%) | 0 (0.0%) |
| Accommodation & Food Services | 0 (0.0%) | 24 (100.0%) |
| Public Administration | 4 (100.0%) | 0 (0.0%) |
| Total | 49 (48.5%) | 52 (51.5%) |
Education in Drummond
School Enrollment in Drummond
The most common levels of schooling among the 43 students in Drummond are middle school (13 | 30.2%), high school (10 | 23.3%), and elementary school (7 | 16.3%).
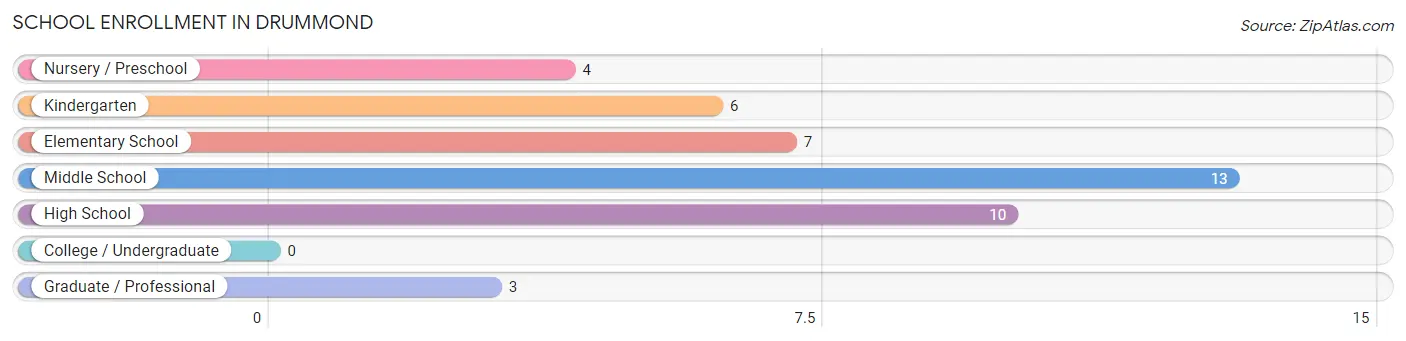
| School Level | # Students | % Students |
| Nursery / Preschool | 4 | 9.3% |
| Kindergarten | 6 | 14.0% |
| Elementary School | 7 | 16.3% |
| Middle School | 13 | 30.2% |
| High School | 10 | 23.3% |
| College / Undergraduate | 0 | 0.0% |
| Graduate / Professional | 3 | 7.0% |
| Total | 43 | 100.0% |
School Enrollment by Age by Funding Source in Drummond
Out of a total of 43 students who are enrolled in schools in Drummond, 1 (2.3%) attend a private institution, while the remaining 42 (97.7%) are enrolled in public schools. The age group of 25 to 34 year olds has the highest likelihood of being enrolled in private schools, with 1 (100.0% in the age bracket) enrolled. Conversely, the age group of 3 to 4 year olds has the lowest likelihood of being enrolled in a private school, with 4 (100.0% in the age bracket) attending a public institution.
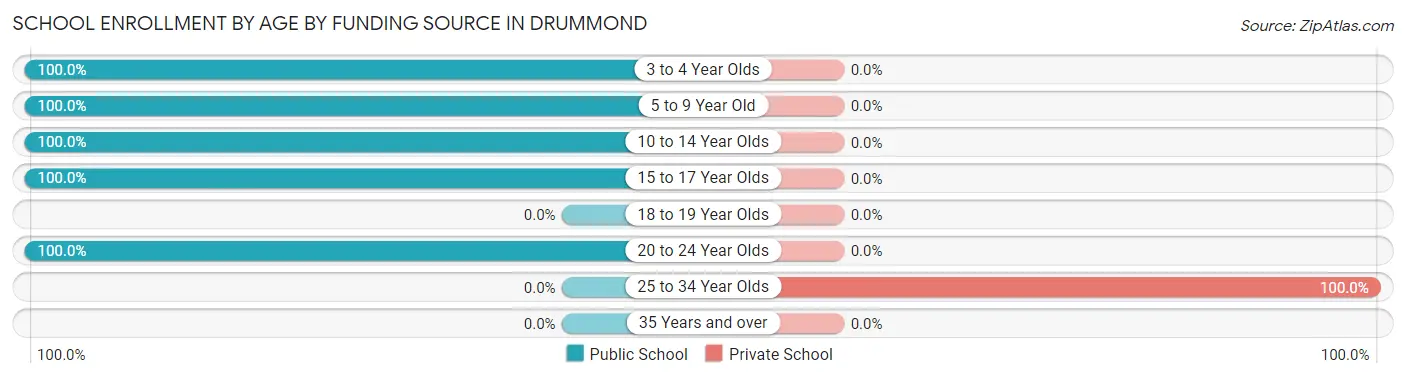
| Age Bracket | Public School | Private School |
| 3 to 4 Year Olds | 4 (100.0%) | 0 (0.0%) |
| 5 to 9 Year Old | 13 (100.0%) | 0 (0.0%) |
| 10 to 14 Year Olds | 22 (100.0%) | 0 (0.0%) |
| 15 to 17 Year Olds | 1 (100.0%) | 0 (0.0%) |
| 18 to 19 Year Olds | 0 (0.0%) | 0 (0.0%) |
| 20 to 24 Year Olds | 2 (100.0%) | 0 (0.0%) |
| 25 to 34 Year Olds | 0 (0.0%) | 1 (100.0%) |
| 35 Years and over | 0 (0.0%) | 0 (0.0%) |
| Total | 42 (97.7%) | 1 (2.3%) |
Educational Attainment by Field of Study in Drummond
Engineering (33 | 60.0%), education (16 | 29.1%), and social sciences (6 | 10.9%) are the most common fields of study among 55 individuals in Drummond who have obtained a bachelor's degree or higher.
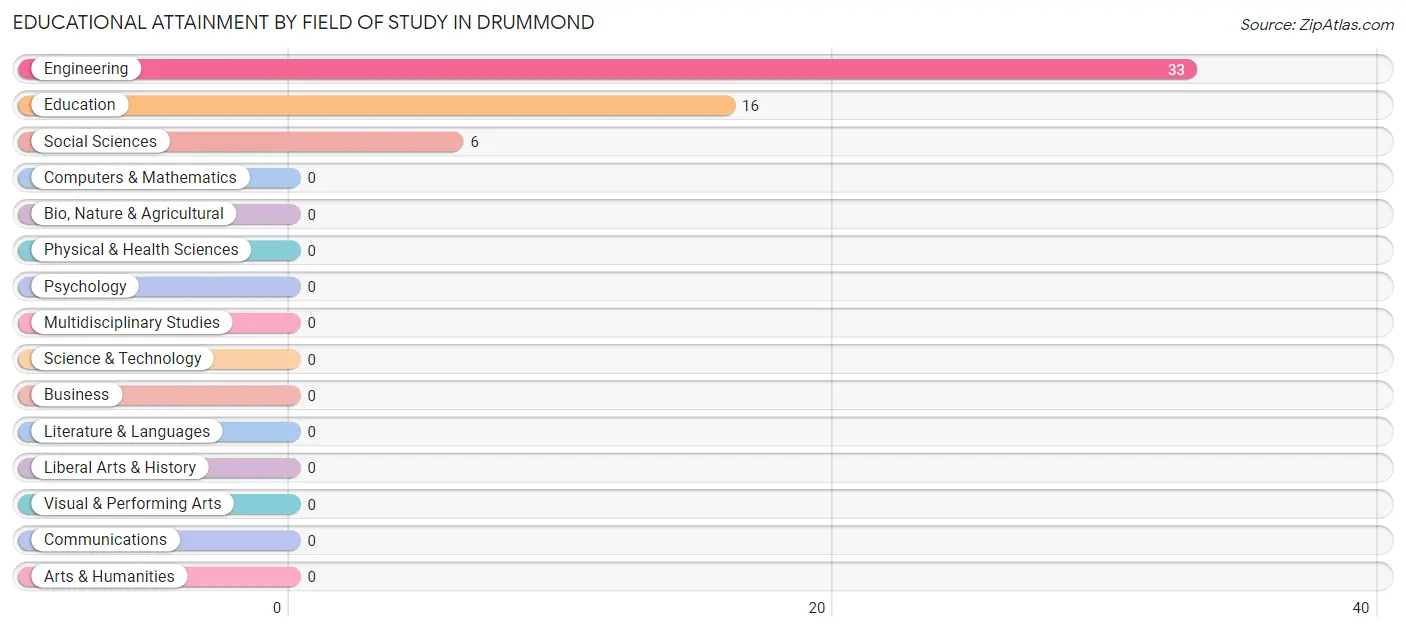
| Field of Study | # Graduates | % Graduates |
| Computers & Mathematics | 0 | 0.0% |
| Bio, Nature & Agricultural | 0 | 0.0% |
| Physical & Health Sciences | 0 | 0.0% |
| Psychology | 0 | 0.0% |
| Social Sciences | 6 | 10.9% |
| Engineering | 33 | 60.0% |
| Multidisciplinary Studies | 0 | 0.0% |
| Science & Technology | 0 | 0.0% |
| Business | 0 | 0.0% |
| Education | 16 | 29.1% |
| Literature & Languages | 0 | 0.0% |
| Liberal Arts & History | 0 | 0.0% |
| Visual & Performing Arts | 0 | 0.0% |
| Communications | 0 | 0.0% |
| Arts & Humanities | 0 | 0.0% |
| Total | 55 | 100.0% |
Transportation & Commute in Drummond
Vehicle Availability by Sex in Drummond
The most prevalent vehicle ownership categories in Drummond are males with 2 vehicles (36, accounting for 73.5%) and females with 2 vehicles (28, making up 69.2%).
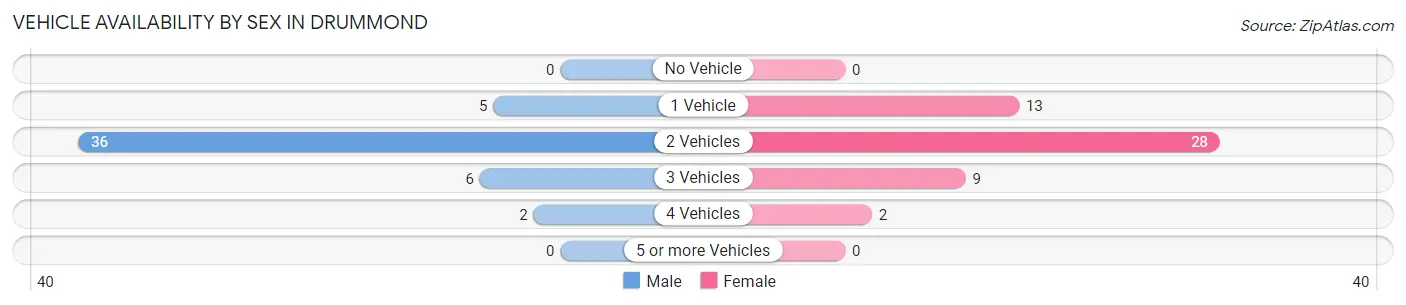
| Vehicles Available | Male | Female |
| No Vehicle | 0 (0.0%) | 0 (0.0%) |
| 1 Vehicle | 5 (10.2%) | 13 (25.0%) |
| 2 Vehicles | 36 (73.5%) | 28 (53.8%) |
| 3 Vehicles | 6 (12.2%) | 9 (17.3%) |
| 4 Vehicles | 2 (4.1%) | 2 (3.8%) |
| 5 or more Vehicles | 0 (0.0%) | 0 (0.0%) |
| Total | 49 (100.0%) | 52 (100.0%) |
Commute Time in Drummond
The most frequently occuring commute durations in Drummond are 5 to 9 minutes (38 commuters, 38.4%), 15 to 19 minutes (27 commuters, 27.3%), and less than 5 minutes (14 commuters, 14.1%).
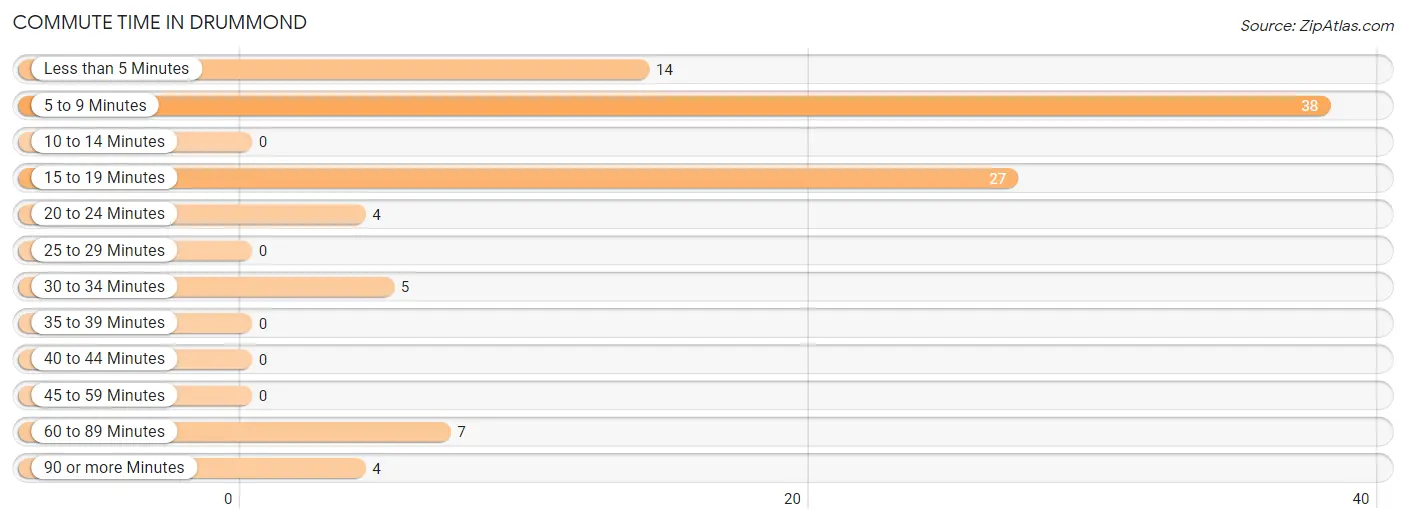
| Commute Time | # Commuters | % Commuters |
| Less than 5 Minutes | 14 | 14.1% |
| 5 to 9 Minutes | 38 | 38.4% |
| 10 to 14 Minutes | 0 | 0.0% |
| 15 to 19 Minutes | 27 | 27.3% |
| 20 to 24 Minutes | 4 | 4.0% |
| 25 to 29 Minutes | 0 | 0.0% |
| 30 to 34 Minutes | 5 | 5.1% |
| 35 to 39 Minutes | 0 | 0.0% |
| 40 to 44 Minutes | 0 | 0.0% |
| 45 to 59 Minutes | 0 | 0.0% |
| 60 to 89 Minutes | 7 | 7.1% |
| 90 or more Minutes | 4 | 4.0% |
Commute Time by Sex in Drummond
The most common commute times in Drummond are 15 to 19 minutes (27 commuters, 57.5%) for males and 5 to 9 minutes (29 commuters, 55.8%) for females.
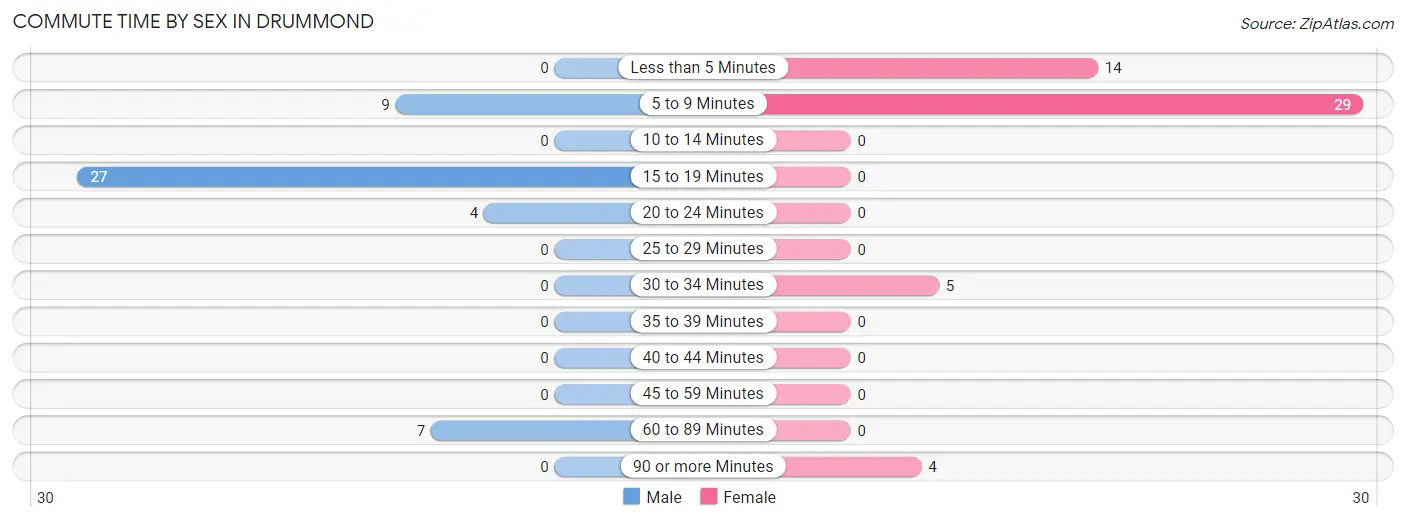
| Commute Time | Male | Female |
| Less than 5 Minutes | 0 (0.0%) | 14 (26.9%) |
| 5 to 9 Minutes | 9 (19.2%) | 29 (55.8%) |
| 10 to 14 Minutes | 0 (0.0%) | 0 (0.0%) |
| 15 to 19 Minutes | 27 (57.5%) | 0 (0.0%) |
| 20 to 24 Minutes | 4 (8.5%) | 0 (0.0%) |
| 25 to 29 Minutes | 0 (0.0%) | 0 (0.0%) |
| 30 to 34 Minutes | 0 (0.0%) | 5 (9.6%) |
| 35 to 39 Minutes | 0 (0.0%) | 0 (0.0%) |
| 40 to 44 Minutes | 0 (0.0%) | 0 (0.0%) |
| 45 to 59 Minutes | 0 (0.0%) | 0 (0.0%) |
| 60 to 89 Minutes | 7 (14.9%) | 0 (0.0%) |
| 90 or more Minutes | 0 (0.0%) | 4 (7.7%) |
Time of Departure to Work by Sex in Drummond
The most frequent times of departure to work in Drummond are 6:00 AM to 6:29 AM (34, 72.3%) for males and 5:00 AM to 5:29 AM (24, 46.2%) for females.
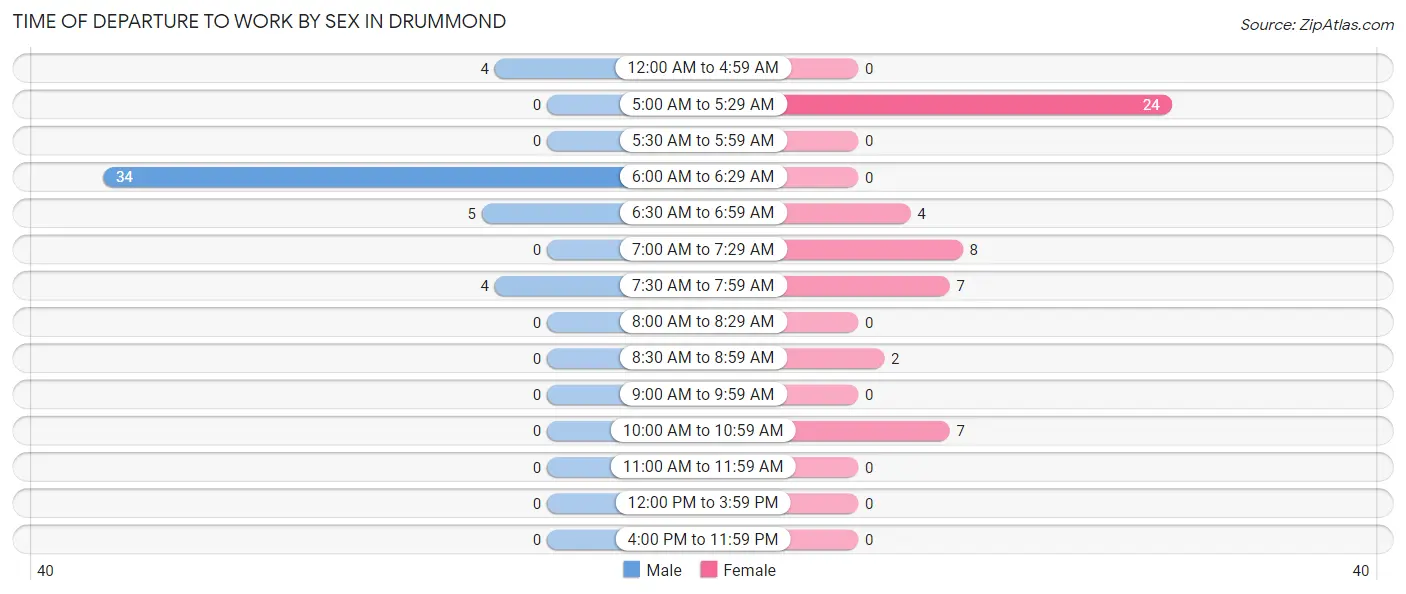
| Time of Departure | Male | Female |
| 12:00 AM to 4:59 AM | 4 (8.5%) | 0 (0.0%) |
| 5:00 AM to 5:29 AM | 0 (0.0%) | 24 (46.2%) |
| 5:30 AM to 5:59 AM | 0 (0.0%) | 0 (0.0%) |
| 6:00 AM to 6:29 AM | 34 (72.3%) | 0 (0.0%) |
| 6:30 AM to 6:59 AM | 5 (10.6%) | 4 (7.7%) |
| 7:00 AM to 7:29 AM | 0 (0.0%) | 8 (15.4%) |
| 7:30 AM to 7:59 AM | 4 (8.5%) | 7 (13.5%) |
| 8:00 AM to 8:29 AM | 0 (0.0%) | 0 (0.0%) |
| 8:30 AM to 8:59 AM | 0 (0.0%) | 2 (3.8%) |
| 9:00 AM to 9:59 AM | 0 (0.0%) | 0 (0.0%) |
| 10:00 AM to 10:59 AM | 0 (0.0%) | 7 (13.5%) |
| 11:00 AM to 11:59 AM | 0 (0.0%) | 0 (0.0%) |
| 12:00 PM to 3:59 PM | 0 (0.0%) | 0 (0.0%) |
| 4:00 PM to 11:59 PM | 0 (0.0%) | 0 (0.0%) |
| Total | 47 (100.0%) | 52 (100.0%) |
Housing Occupancy in Drummond
Occupancy by Ownership in Drummond
Of the total 101 dwellings in Drummond, owner-occupied units account for 68 (67.3%), while renter-occupied units make up 33 (32.7%).
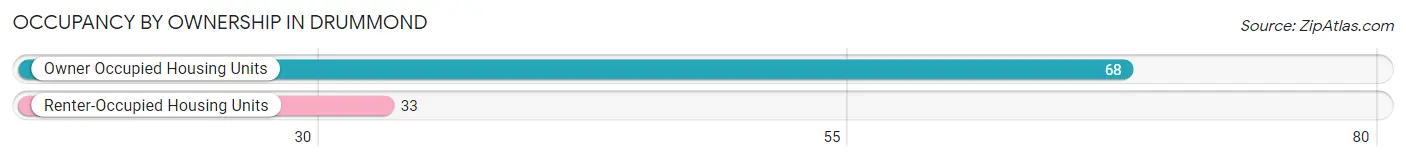
| Occupancy | # Housing Units | % Housing Units |
| Owner Occupied Housing Units | 68 | 67.3% |
| Renter-Occupied Housing Units | 33 | 32.7% |
| Total Occupied Housing Units | 101 | 100.0% |
Occupancy by Household Size in Drummond
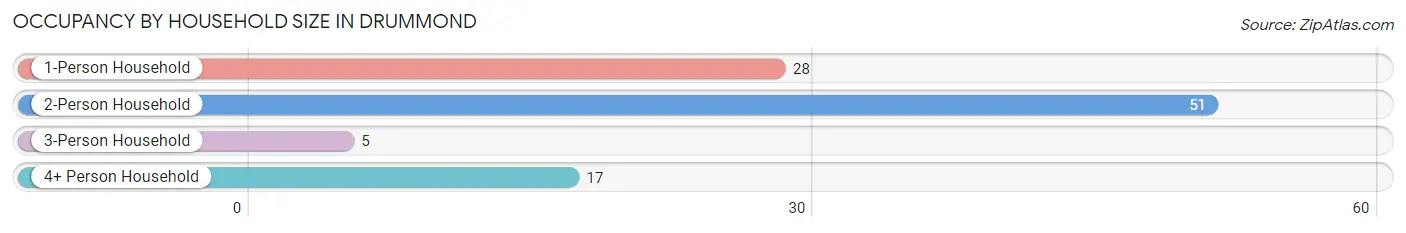
| Household Size | # Housing Units | % Housing Units |
| 1-Person Household | 28 | 27.7% |
| 2-Person Household | 51 | 50.5% |
| 3-Person Household | 5 | 5.0% |
| 4+ Person Household | 17 | 16.8% |
| Total Housing Units | 101 | 100.0% |
Occupancy by Ownership by Household Size in Drummond
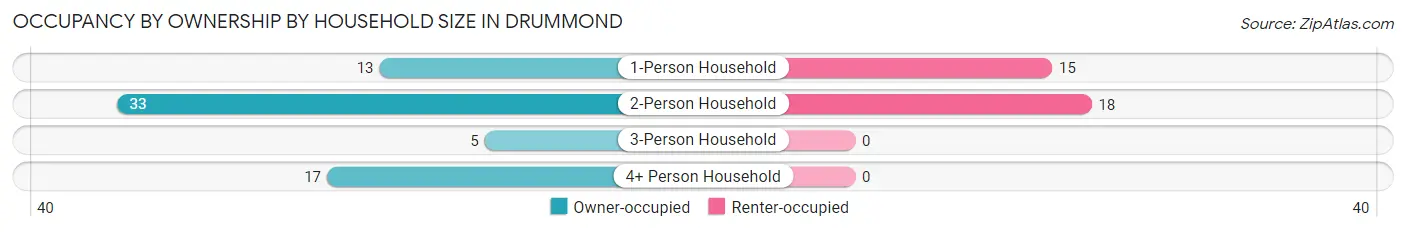
| Household Size | Owner-occupied | Renter-occupied |
| 1-Person Household | 13 (46.4%) | 15 (53.6%) |
| 2-Person Household | 33 (64.7%) | 18 (35.3%) |
| 3-Person Household | 5 (100.0%) | 0 (0.0%) |
| 4+ Person Household | 17 (100.0%) | 0 (0.0%) |
| Total Housing Units | 68 (67.3%) | 33 (32.7%) |
Occupancy by Educational Attainment in Drummond
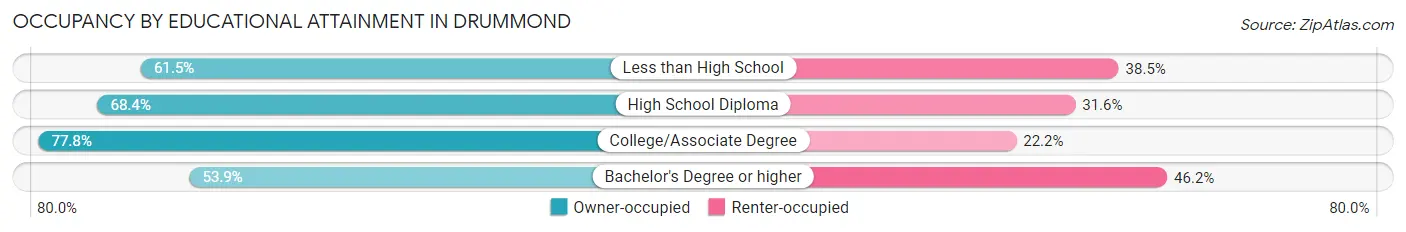
| Household Size | Owner-occupied | Renter-occupied |
| Less than High School | 8 (61.5%) | 5 (38.5%) |
| High School Diploma | 39 (68.4%) | 18 (31.6%) |
| College/Associate Degree | 14 (77.8%) | 4 (22.2%) |
| Bachelor's Degree or higher | 7 (53.8%) | 6 (46.2%) |
Occupancy by Age of Householder in Drummond
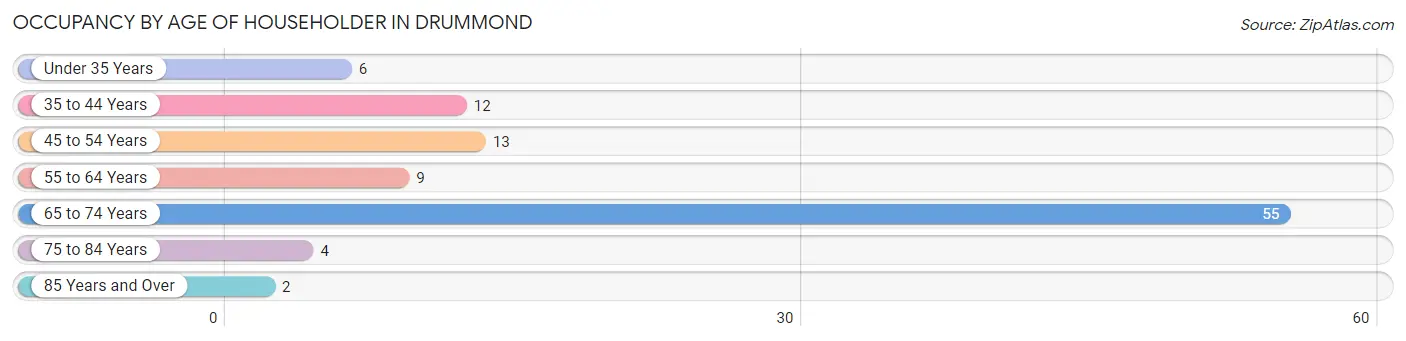
| Age Bracket | # Households | % Households |
| Under 35 Years | 6 | 5.9% |
| 35 to 44 Years | 12 | 11.9% |
| 45 to 54 Years | 13 | 12.9% |
| 55 to 64 Years | 9 | 8.9% |
| 65 to 74 Years | 55 | 54.5% |
| 75 to 84 Years | 4 | 4.0% |
| 85 Years and Over | 2 | 2.0% |
| Total | 101 | 100.0% |
Housing Finances in Drummond
Median Income by Occupancy in Drummond
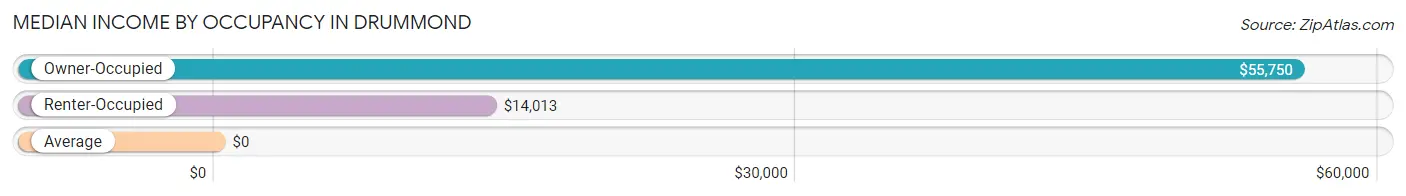
| Occupancy Type | # Households | Median Income |
| Owner-Occupied | 68 (67.3%) | $55,750 |
| Renter-Occupied | 33 (32.7%) | $14,013 |
| Average | 101 (100.0%) | $0 |
Occupancy by Householder Income Bracket in Drummond
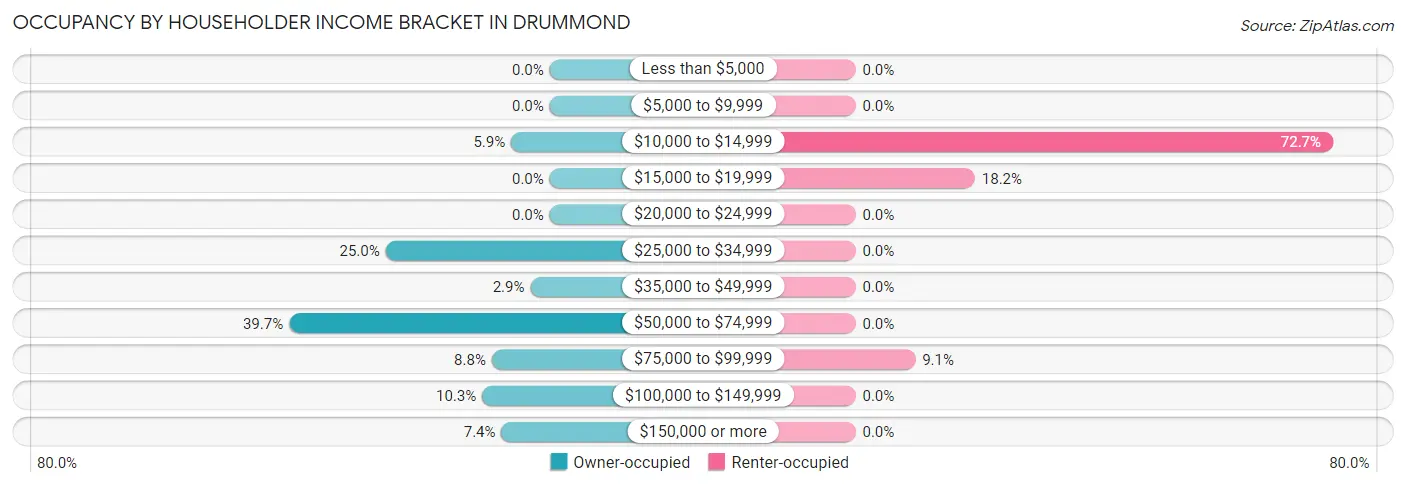
| Income Bracket | Owner-occupied | Renter-occupied |
| Less than $5,000 | 0 (0.0%) | 0 (0.0%) |
| $5,000 to $9,999 | 0 (0.0%) | 0 (0.0%) |
| $10,000 to $14,999 | 4 (5.9%) | 24 (72.7%) |
| $15,000 to $19,999 | 0 (0.0%) | 6 (18.2%) |
| $20,000 to $24,999 | 0 (0.0%) | 0 (0.0%) |
| $25,000 to $34,999 | 17 (25.0%) | 0 (0.0%) |
| $35,000 to $49,999 | 2 (2.9%) | 0 (0.0%) |
| $50,000 to $74,999 | 27 (39.7%) | 0 (0.0%) |
| $75,000 to $99,999 | 6 (8.8%) | 3 (9.1%) |
| $100,000 to $149,999 | 7 (10.3%) | 0 (0.0%) |
| $150,000 or more | 5 (7.3%) | 0 (0.0%) |
| Total | 68 (100.0%) | 33 (100.0%) |
Monthly Housing Cost Tiers in Drummond
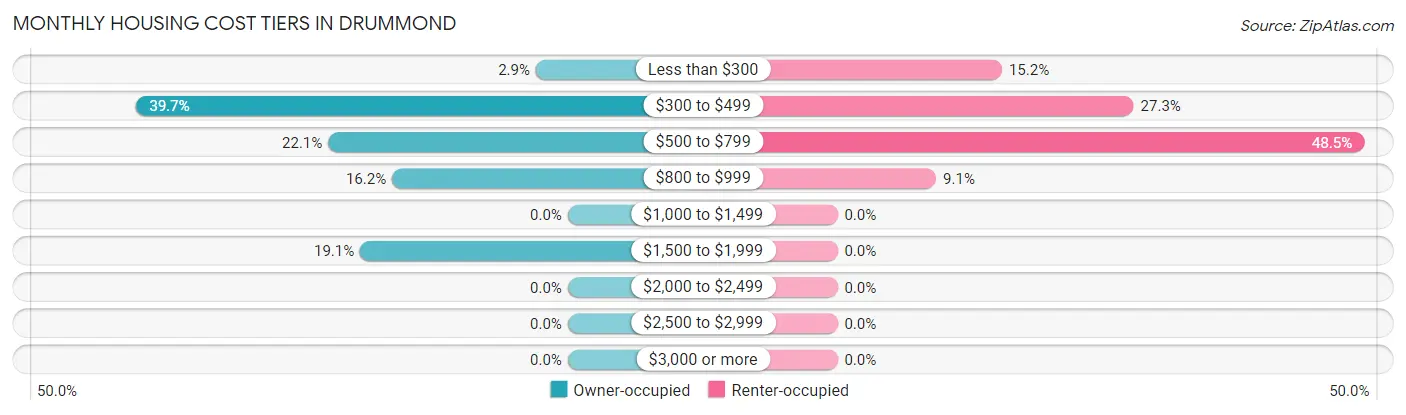
| Monthly Cost | Owner-occupied | Renter-occupied |
| Less than $300 | 2 (2.9%) | 5 (15.1%) |
| $300 to $499 | 27 (39.7%) | 9 (27.3%) |
| $500 to $799 | 15 (22.1%) | 16 (48.5%) |
| $800 to $999 | 11 (16.2%) | 3 (9.1%) |
| $1,000 to $1,499 | 0 (0.0%) | 0 (0.0%) |
| $1,500 to $1,999 | 13 (19.1%) | 0 (0.0%) |
| $2,000 to $2,499 | 0 (0.0%) | 0 (0.0%) |
| $2,500 to $2,999 | 0 (0.0%) | 0 (0.0%) |
| $3,000 or more | 0 (0.0%) | 0 (0.0%) |
| Total | 68 (100.0%) | 33 (100.0%) |
Physical Housing Characteristics in Drummond
Housing Structures in Drummond
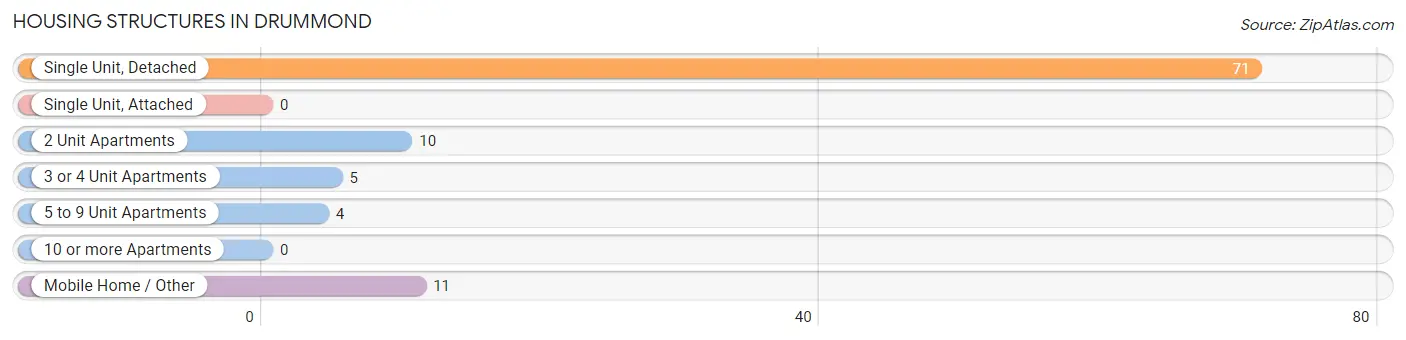
| Structure Type | # Housing Units | % Housing Units |
| Single Unit, Detached | 71 | 70.3% |
| Single Unit, Attached | 0 | 0.0% |
| 2 Unit Apartments | 10 | 9.9% |
| 3 or 4 Unit Apartments | 5 | 5.0% |
| 5 to 9 Unit Apartments | 4 | 4.0% |
| 10 or more Apartments | 0 | 0.0% |
| Mobile Home / Other | 11 | 10.9% |
| Total | 101 | 100.0% |
Housing Structures by Occupancy in Drummond
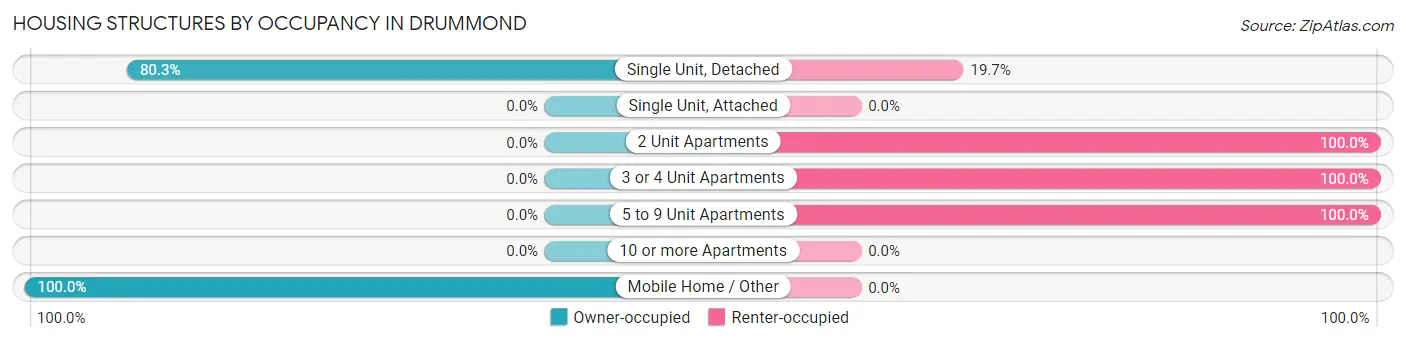
| Structure Type | Owner-occupied | Renter-occupied |
| Single Unit, Detached | 57 (80.3%) | 14 (19.7%) |
| Single Unit, Attached | 0 (0.0%) | 0 (0.0%) |
| 2 Unit Apartments | 0 (0.0%) | 10 (100.0%) |
| 3 or 4 Unit Apartments | 0 (0.0%) | 5 (100.0%) |
| 5 to 9 Unit Apartments | 0 (0.0%) | 4 (100.0%) |
| 10 or more Apartments | 0 (0.0%) | 0 (0.0%) |
| Mobile Home / Other | 11 (100.0%) | 0 (0.0%) |
| Total | 68 (67.3%) | 33 (32.7%) |
Housing Structures by Number of Rooms in Drummond
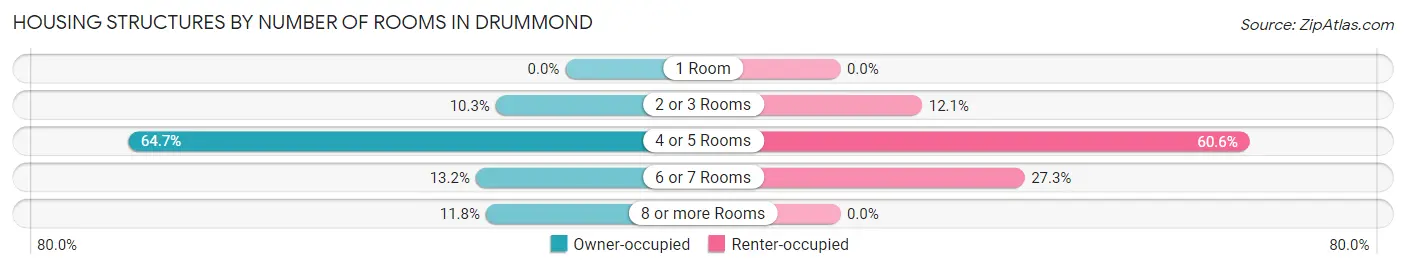
| Number of Rooms | Owner-occupied | Renter-occupied |
| 1 Room | 0 (0.0%) | 0 (0.0%) |
| 2 or 3 Rooms | 7 (10.3%) | 4 (12.1%) |
| 4 or 5 Rooms | 44 (64.7%) | 20 (60.6%) |
| 6 or 7 Rooms | 9 (13.2%) | 9 (27.3%) |
| 8 or more Rooms | 8 (11.8%) | 0 (0.0%) |
| Total | 68 (100.0%) | 33 (100.0%) |
Housing Structure by Heating Type in Drummond
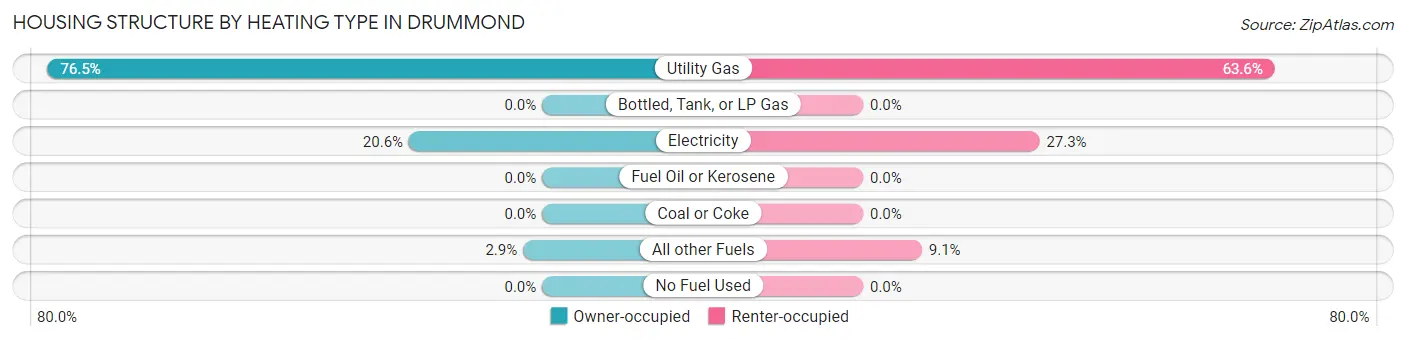
| Heating Type | Owner-occupied | Renter-occupied |
| Utility Gas | 52 (76.5%) | 21 (63.6%) |
| Bottled, Tank, or LP Gas | 0 (0.0%) | 0 (0.0%) |
| Electricity | 14 (20.6%) | 9 (27.3%) |
| Fuel Oil or Kerosene | 0 (0.0%) | 0 (0.0%) |
| Coal or Coke | 0 (0.0%) | 0 (0.0%) |
| All other Fuels | 2 (2.9%) | 3 (9.1%) |
| No Fuel Used | 0 (0.0%) | 0 (0.0%) |
| Total | 68 (100.0%) | 33 (100.0%) |
Household Vehicle Usage in Drummond
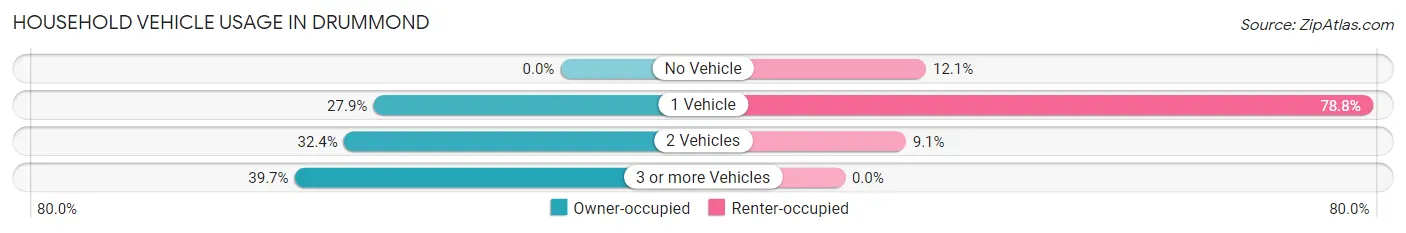
| Vehicles per Household | Owner-occupied | Renter-occupied |
| No Vehicle | 0 (0.0%) | 4 (12.1%) |
| 1 Vehicle | 19 (27.9%) | 26 (78.8%) |
| 2 Vehicles | 22 (32.4%) | 3 (9.1%) |
| 3 or more Vehicles | 27 (39.7%) | 0 (0.0%) |
| Total | 68 (100.0%) | 33 (100.0%) |
Real Estate & Mortgages in Drummond
Real Estate and Mortgage Overview in Drummond
| Characteristic | Without Mortgage | With Mortgage |
| Housing Units | 31 | 37 |
| Median Property Value | $156,300 | $118,500 |
| Median Household Income | $57,250 | $1 |
| Monthly Housing Costs | $380 | $0 |
| Real Estate Taxes | $2,036 | $0 |
Property Value by Mortgage Status in Drummond
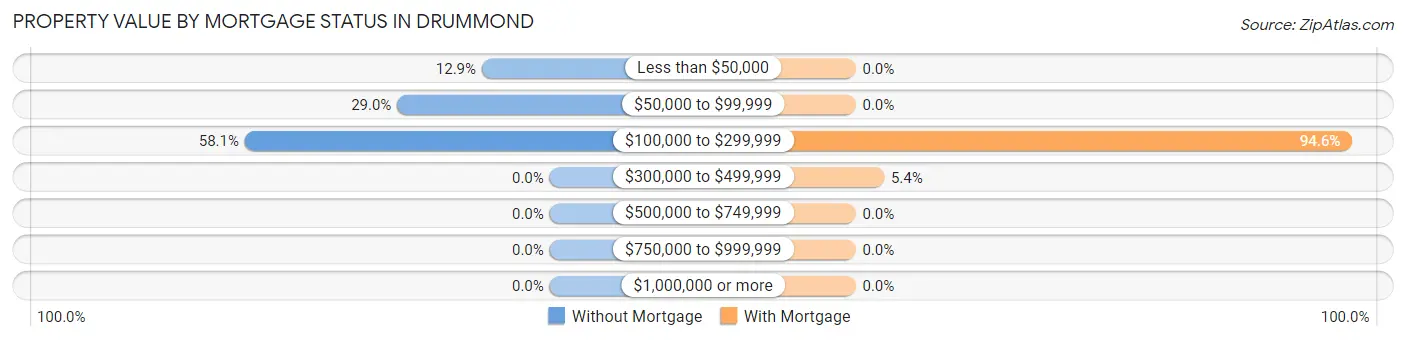
| Property Value | Without Mortgage | With Mortgage |
| Less than $50,000 | 4 (12.9%) | 0 (0.0%) |
| $50,000 to $99,999 | 9 (29.0%) | 0 (0.0%) |
| $100,000 to $299,999 | 18 (58.1%) | 35 (94.6%) |
| $300,000 to $499,999 | 0 (0.0%) | 2 (5.4%) |
| $500,000 to $749,999 | 0 (0.0%) | 0 (0.0%) |
| $750,000 to $999,999 | 0 (0.0%) | 0 (0.0%) |
| $1,000,000 or more | 0 (0.0%) | 0 (0.0%) |
| Total | 31 (100.0%) | 37 (100.0%) |
Household Income by Mortgage Status in Drummond
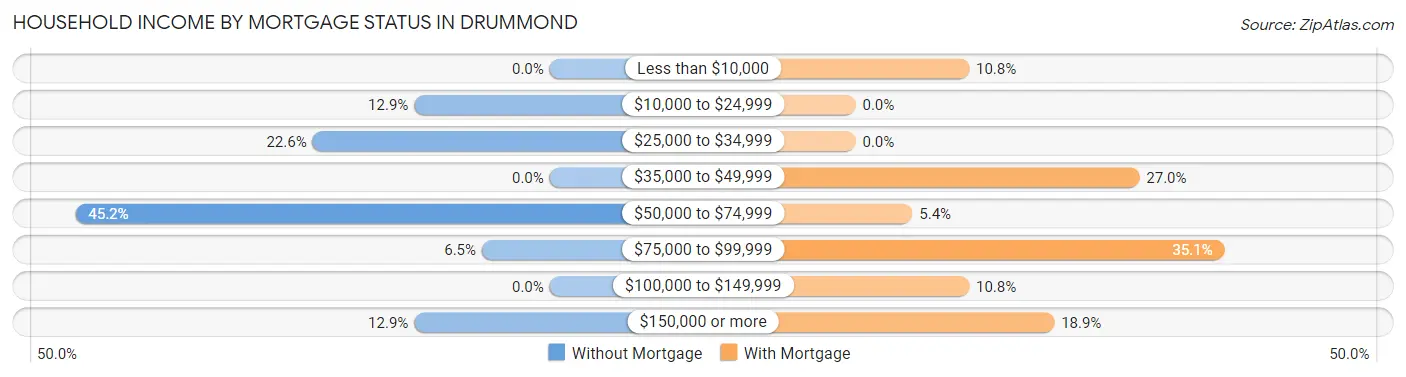
| Household Income | Without Mortgage | With Mortgage |
| Less than $10,000 | 0 (0.0%) | 4 (10.8%) |
| $10,000 to $24,999 | 4 (12.9%) | 0 (0.0%) |
| $25,000 to $34,999 | 7 (22.6%) | 0 (0.0%) |
| $35,000 to $49,999 | 0 (0.0%) | 10 (27.0%) |
| $50,000 to $74,999 | 14 (45.2%) | 2 (5.4%) |
| $75,000 to $99,999 | 2 (6.5%) | 13 (35.1%) |
| $100,000 to $149,999 | 0 (0.0%) | 4 (10.8%) |
| $150,000 or more | 4 (12.9%) | 7 (18.9%) |
| Total | 31 (100.0%) | 37 (100.0%) |
Property Value to Household Income Ratio in Drummond
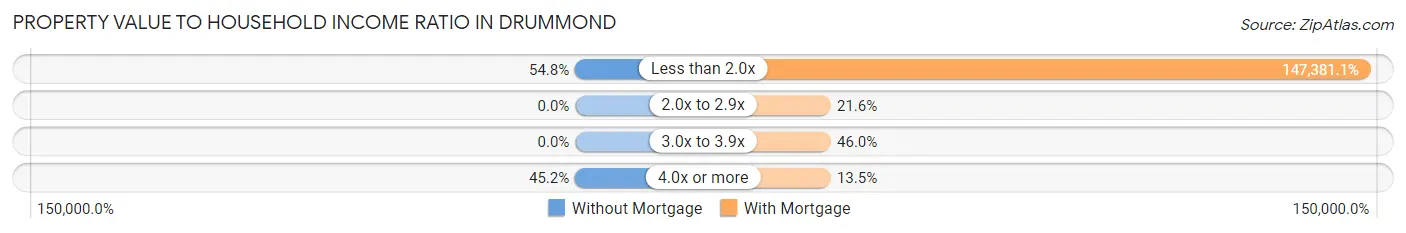
| Value-to-Income Ratio | Without Mortgage | With Mortgage |
| Less than 2.0x | 17 (54.8%) | 54,531 (147,381.1%) |
| 2.0x to 2.9x | 0 (0.0%) | 8 (21.6%) |
| 3.0x to 3.9x | 0 (0.0%) | 17 (46.0%) |
| 4.0x or more | 14 (45.2%) | 5 (13.5%) |
| Total | 31 (100.0%) | 37 (100.0%) |
Real Estate Taxes by Mortgage Status in Drummond
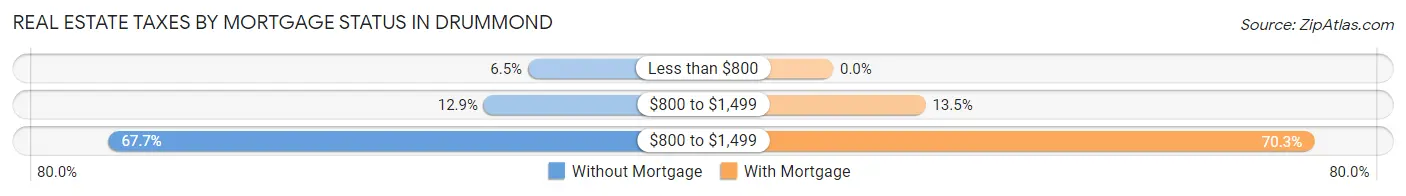
| Property Taxes | Without Mortgage | With Mortgage |
| Less than $800 | 2 (6.5%) | 0 (0.0%) |
| $800 to $1,499 | 4 (12.9%) | 5 (13.5%) |
| $800 to $1,499 | 21 (67.7%) | 26 (70.3%) |
| Total | 31 (100.0%) | 37 (100.0%) |
Health & Disability in Drummond
Health Insurance Coverage by Age in Drummond
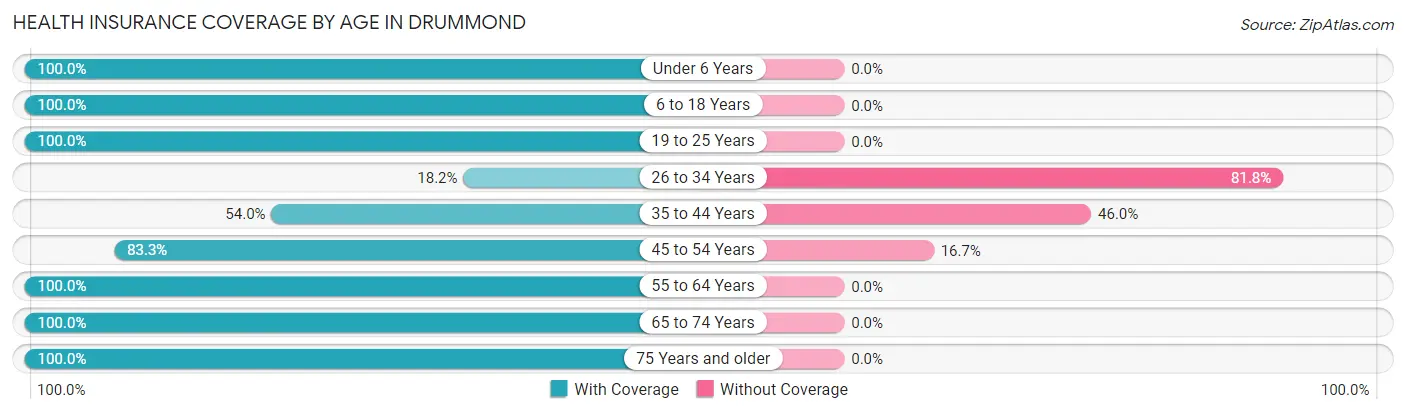
| Age Bracket | With Coverage | Without Coverage |
| Under 6 Years | 27 (100.0%) | 0 (0.0%) |
| 6 to 18 Years | 30 (100.0%) | 0 (0.0%) |
| 19 to 25 Years | 4 (100.0%) | 0 (0.0%) |
| 26 to 34 Years | 2 (18.2%) | 9 (81.8%) |
| 35 to 44 Years | 34 (54.0%) | 29 (46.0%) |
| 45 to 54 Years | 15 (83.3%) | 3 (16.7%) |
| 55 to 64 Years | 36 (100.0%) | 0 (0.0%) |
| 65 to 74 Years | 71 (100.0%) | 0 (0.0%) |
| 75 Years and older | 17 (100.0%) | 0 (0.0%) |
| Total | 236 (85.2%) | 41 (14.8%) |
Health Insurance Coverage by Citizenship Status in Drummond
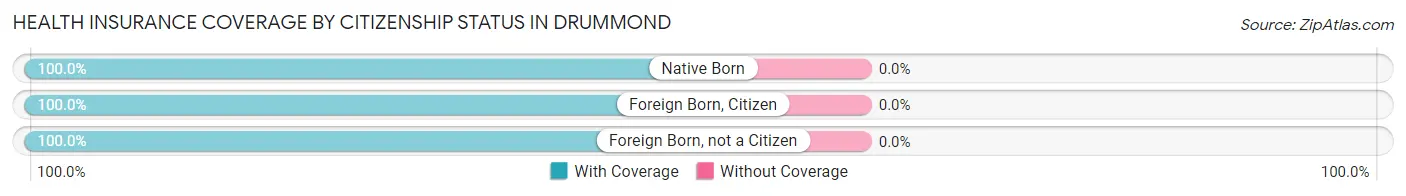
| Citizenship Status | With Coverage | Without Coverage |
| Native Born | 27 (100.0%) | 0 (0.0%) |
| Foreign Born, Citizen | 30 (100.0%) | 0 (0.0%) |
| Foreign Born, not a Citizen | 4 (100.0%) | 0 (0.0%) |
Health Insurance Coverage by Household Income in Drummond
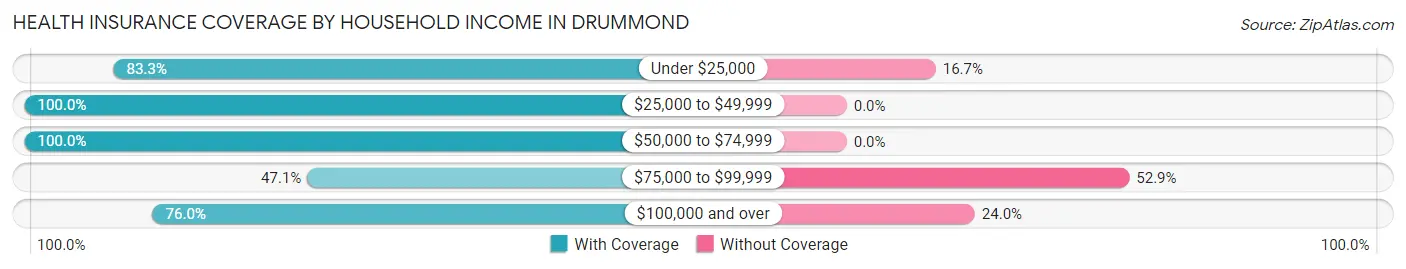
| Household Income | With Coverage | Without Coverage |
| Under $25,000 | 40 (83.3%) | 8 (16.7%) |
| $25,000 to $49,999 | 30 (100.0%) | 0 (0.0%) |
| $50,000 to $74,999 | 82 (100.0%) | 0 (0.0%) |
| $75,000 to $99,999 | 8 (47.1%) | 9 (52.9%) |
| $100,000 and over | 76 (76.0%) | 24 (24.0%) |
Public vs Private Health Insurance Coverage by Age in Drummond
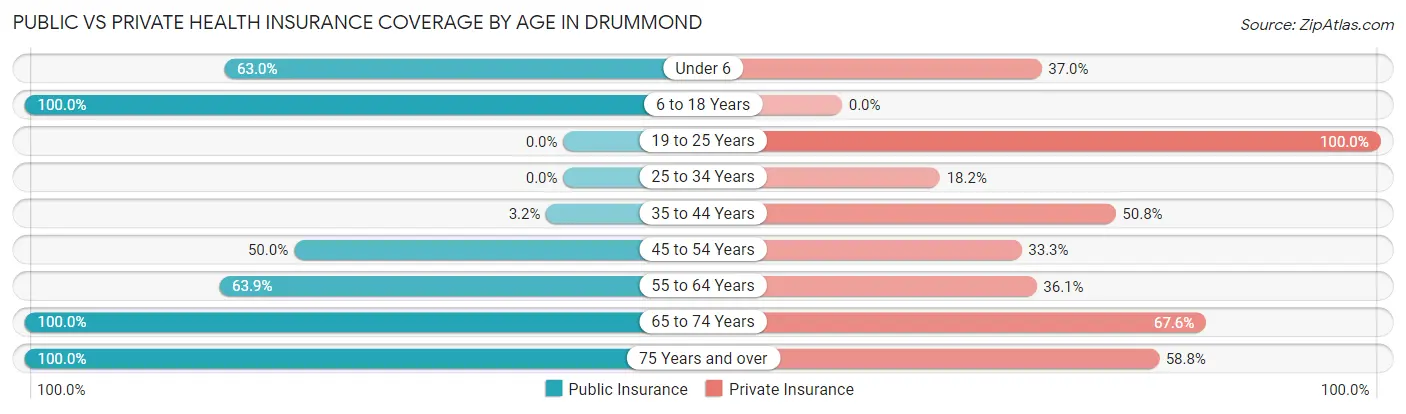
| Age Bracket | Public Insurance | Private Insurance |
| Under 6 | 17 (63.0%) | 10 (37.0%) |
| 6 to 18 Years | 30 (100.0%) | 0 (0.0%) |
| 19 to 25 Years | 0 (0.0%) | 4 (100.0%) |
| 25 to 34 Years | 0 (0.0%) | 2 (18.2%) |
| 35 to 44 Years | 2 (3.2%) | 32 (50.8%) |
| 45 to 54 Years | 9 (50.0%) | 6 (33.3%) |
| 55 to 64 Years | 23 (63.9%) | 13 (36.1%) |
| 65 to 74 Years | 71 (100.0%) | 48 (67.6%) |
| 75 Years and over | 17 (100.0%) | 10 (58.8%) |
| Total | 169 (61.0%) | 125 (45.1%) |
Disability Status by Sex by Age in Drummond
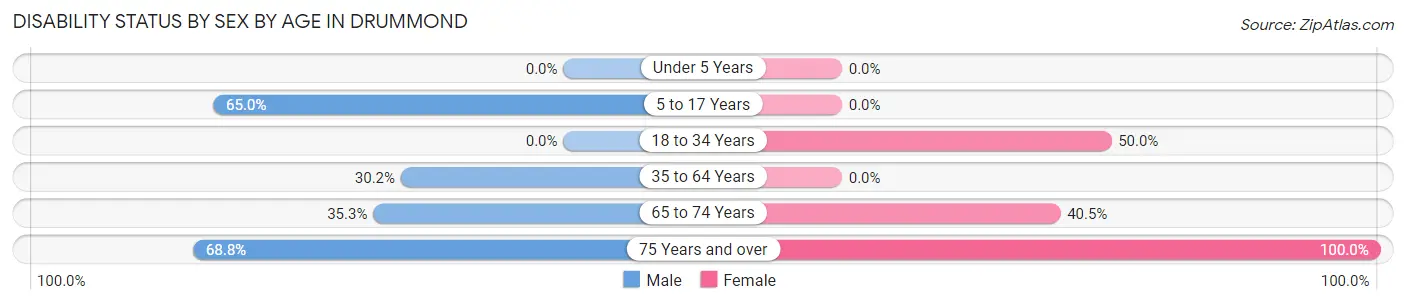
| Age Bracket | Male | Female |
| Under 5 Years | 0 (0.0%) | 0 (0.0%) |
| 5 to 17 Years | 13 (65.0%) | 0 (0.0%) |
| 18 to 34 Years | 0 (0.0%) | 3 (50.0%) |
| 35 to 64 Years | 19 (30.2%) | 0 (0.0%) |
| 65 to 74 Years | 12 (35.3%) | 15 (40.5%) |
| 75 Years and over | 11 (68.8%) | 1 (100.0%) |
Disability Class by Sex by Age in Drummond
Disability Class: Hearing Difficulty
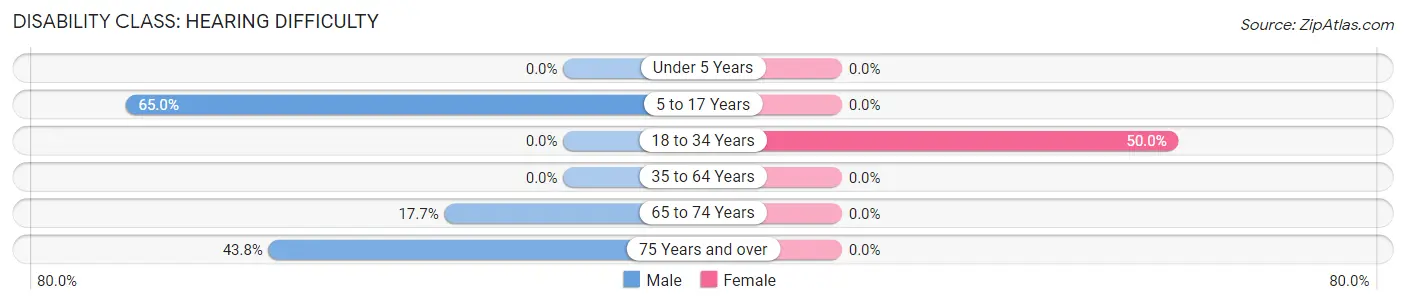
| Age Bracket | Male | Female |
| Under 5 Years | 0 (0.0%) | 0 (0.0%) |
| 5 to 17 Years | 13 (65.0%) | 0 (0.0%) |
| 18 to 34 Years | 0 (0.0%) | 3 (50.0%) |
| 35 to 64 Years | 0 (0.0%) | 0 (0.0%) |
| 65 to 74 Years | 6 (17.6%) | 0 (0.0%) |
| 75 Years and over | 7 (43.8%) | 0 (0.0%) |
Disability Class: Vision Difficulty
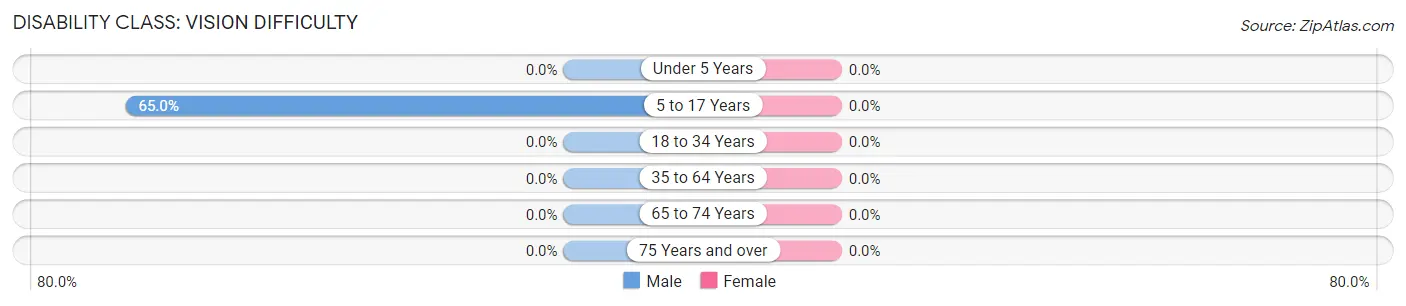
| Age Bracket | Male | Female |
| Under 5 Years | 0 (0.0%) | 0 (0.0%) |
| 5 to 17 Years | 13 (65.0%) | 0 (0.0%) |
| 18 to 34 Years | 0 (0.0%) | 0 (0.0%) |
| 35 to 64 Years | 0 (0.0%) | 0 (0.0%) |
| 65 to 74 Years | 0 (0.0%) | 0 (0.0%) |
| 75 Years and over | 0 (0.0%) | 0 (0.0%) |
Disability Class: Cognitive Difficulty
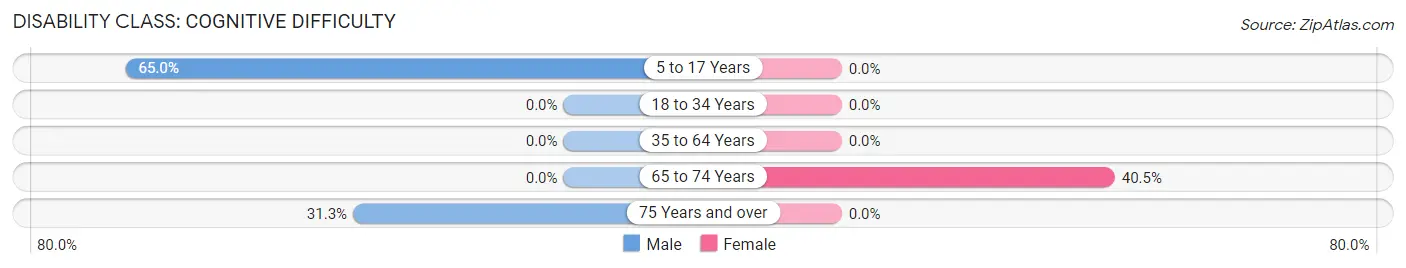
| Age Bracket | Male | Female |
| 5 to 17 Years | 13 (65.0%) | 0 (0.0%) |
| 18 to 34 Years | 0 (0.0%) | 0 (0.0%) |
| 35 to 64 Years | 0 (0.0%) | 0 (0.0%) |
| 65 to 74 Years | 0 (0.0%) | 15 (40.5%) |
| 75 Years and over | 5 (31.2%) | 0 (0.0%) |
Disability Class: Ambulatory Difficulty
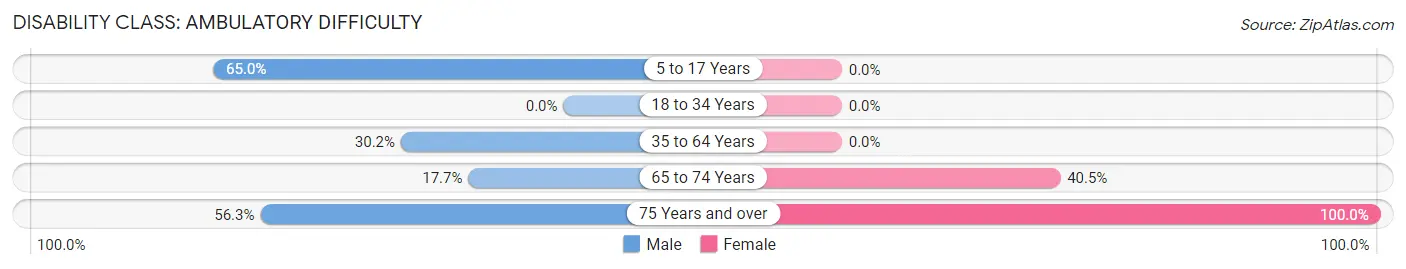
| Age Bracket | Male | Female |
| 5 to 17 Years | 13 (65.0%) | 0 (0.0%) |
| 18 to 34 Years | 0 (0.0%) | 0 (0.0%) |
| 35 to 64 Years | 19 (30.2%) | 0 (0.0%) |
| 65 to 74 Years | 6 (17.6%) | 15 (40.5%) |
| 75 Years and over | 9 (56.2%) | 1 (100.0%) |
Disability Class: Self-Care Difficulty
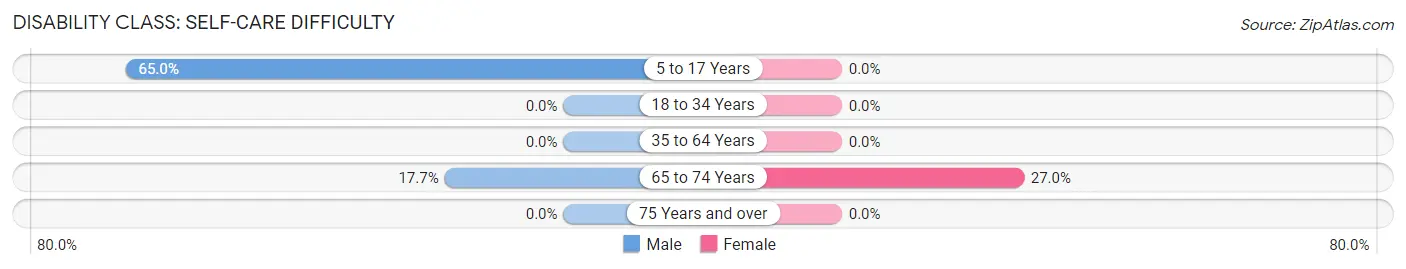
| Age Bracket | Male | Female |
| 5 to 17 Years | 13 (65.0%) | 0 (0.0%) |
| 18 to 34 Years | 0 (0.0%) | 0 (0.0%) |
| 35 to 64 Years | 0 (0.0%) | 0 (0.0%) |
| 65 to 74 Years | 6 (17.6%) | 10 (27.0%) |
| 75 Years and over | 0 (0.0%) | 0 (0.0%) |
Technology Access in Drummond
Computing Device Access in Drummond
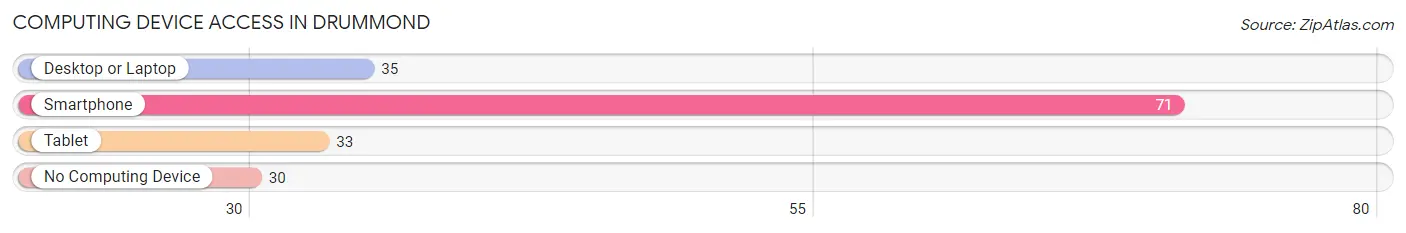
| Device Type | # Households | % Households |
| Desktop or Laptop | 35 | 34.6% |
| Smartphone | 71 | 70.3% |
| Tablet | 33 | 32.7% |
| No Computing Device | 30 | 29.7% |
| Total | 101 | 100.0% |
Internet Access in Drummond
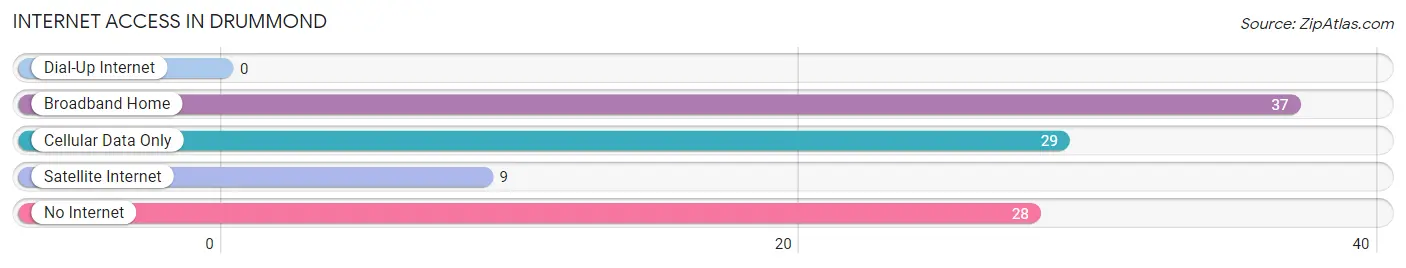
| Internet Type | # Households | % Households |
| Dial-Up Internet | 0 | 0.0% |
| Broadband Home | 37 | 36.6% |
| Cellular Data Only | 29 | 28.7% |
| Satellite Internet | 9 | 8.9% |
| No Internet | 28 | 27.7% |
| Total | 101 | 100.0% |
Drummond Summary
Drummond, Montana is a small town located in Granite County, in the western part of the state. It is situated at the base of the Rocky Mountains, and is surrounded by the Flathead National Forest. The town has a population of approximately 1,000 people, and is the county seat of Granite County.
History
Drummond was founded in 1883 by a group of settlers from Wisconsin. The town was named after the Drummond family, who were among the first settlers. The town was originally a mining town, and the Drummond Mining Company was the first to operate in the area. The town grew quickly, and by the early 1900s, it had become a bustling center of commerce.
In the early 1900s, the town was home to a number of businesses, including a hotel, a bank, a general store, a blacksmith shop, and a saloon. The town also had a school, a post office, and a newspaper.
In the 1920s, the town began to decline as the mining industry began to decline. The Great Depression further exacerbated the decline, and by the 1940s, the town had become a ghost town.
In the 1950s, the town began to experience a resurgence, as the timber industry began to take off. The town was also home to a number of logging camps, and the timber industry provided much-needed jobs for the townspeople.
Geography
Drummond is located in western Montana, in Granite County. The town is situated at the base of the Rocky Mountains, and is surrounded by the Flathead National Forest. The town is located at an elevation of 4,000 feet, and has a total area of 1.2 square miles.
The town is located on the banks of the Clark Fork River, and is surrounded by mountains and forests. The town is located near the Flathead National Forest, which is home to a variety of wildlife, including elk, deer, and moose.
Economy
The economy of Drummond is largely based on the timber industry. The town is home to a number of logging camps, and the timber industry provides much-needed jobs for the townspeople. The town is also home to a number of small businesses, including restaurants, stores, and other services.
The town is also home to a number of tourist attractions, including the Drummond Historical Museum, which houses artifacts from the town’s past. The town is also home to a number of outdoor recreation opportunities, including fishing, hunting, and camping.
Demographics
As of the 2010 census, the population of Drummond was 1,000 people. The town is predominantly white, with a small percentage of Native American and Hispanic residents. The median household income in the town is $35,000, and the median age is 44 years. The town has a high rate of poverty, with nearly 20% of the population living below the poverty line.
Common Questions
What is Per Capita Income in Drummond?
Per Capita income in Drummond is $24,882.
What is the Median Family Income in Drummond?
Median Family Income in Drummond is $54,531.
What is Income or Wage Gap in Drummond?
Income or Wage Gap in Drummond is 61.7%.
Women in Drummond earn 38.3 cents for every dollar earned by a man.
What is Inequality or Gini Index in Drummond?
Inequality or Gini Index in Drummond is 0.44.
What is the Total Population of Drummond?
Total Population of Drummond is 277.
What is the Total Male Population of Drummond?
Total Male Population of Drummond is 149.
What is the Total Female Population of Drummond?
Total Female Population of Drummond is 128.
What is the Ratio of Males per 100 Females in Drummond?
There are 116.41 Males per 100 Females in Drummond.
What is the Ratio of Females per 100 Males in Drummond?
There are 85.91 Females per 100 Males in Drummond.
What is the Median Population Age in Drummond?
Median Population Age in Drummond is 50.2 Years.
What is the Average Family Size in Drummond
Average Family Size in Drummond is 3.5 People.
What is the Average Household Size in Drummond
Average Household Size in Drummond is 2.7 People.
How Large is the Labor Force in Drummond?
There are 103 People in the Labor Forcein in Drummond.
What is the Percentage of People in the Labor Force in Drummond?
46.8% of People are in the Labor Force in Drummond.
What is the Unemployment Rate in Drummond?
Unemployment Rate in Drummond is 1.9%.