Custer, MT Map & Demographics
Custer Map
Custer Overview
$35,805
PER CAPITA INCOME
$96,250
AVG FAMILY INCOME
$63,750
AVG HOUSEHOLD INCOME
0.37
INEQUALITY / GINI INDEX
146
TOTAL POPULATION
68
MALE POPULATION
78
FEMALE POPULATION
87.18
MALES / 100 FEMALES
114.71
FEMALES / 100 MALES
59.4
MEDIAN AGE
3.1
AVG FAMILY SIZE
1.9
AVG HOUSEHOLD SIZE
79
LABOR FORCE [ PEOPLE ]
62.2%
PERCENT IN LABOR FORCE
2.5%
UNEMPLOYMENT RATE
Custer Zip Codes
Custer Area Codes
Income in Custer
Income Overview in Custer
Per Capita Income in Custer is $35,805, while median incomes of families and households are $96,250 and $63,750 respectively.
| Characteristic | Number | Measure |
| Per Capita Income | 146 | $35,805 |
| Median Family Income | 24 | $96,250 |
| Mean Family Income | 24 | $99,775 |
| Median Household Income | 75 | $63,750 |
| Mean Household Income | 75 | $70,587 |
| Income Deficit | 24 | $0 |
| Wage / Income Gap (%) | 146 | 0.00% |
| Wage / Income Gap ($) | 146 | 100.00¢ per $1 |
| Gini / Inequality Index | 146 | 0.37 |
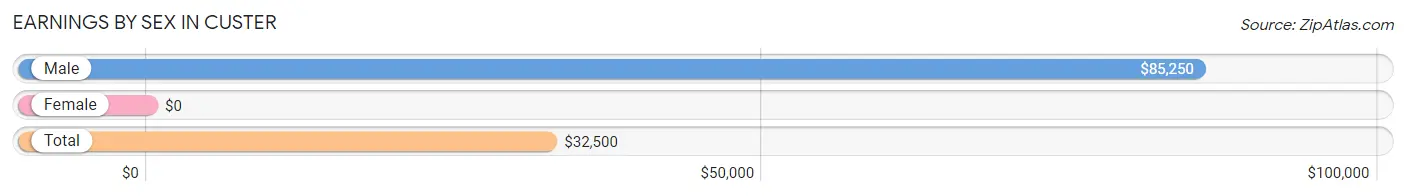
Earnings by Sex in Custer
| Sex | Number | Average Earnings |
| Male | 49 (55.7%) | $85,250 |
| Female | 39 (44.3%) | $0 |
| Total | 88 (100.0%) | $32,500 |
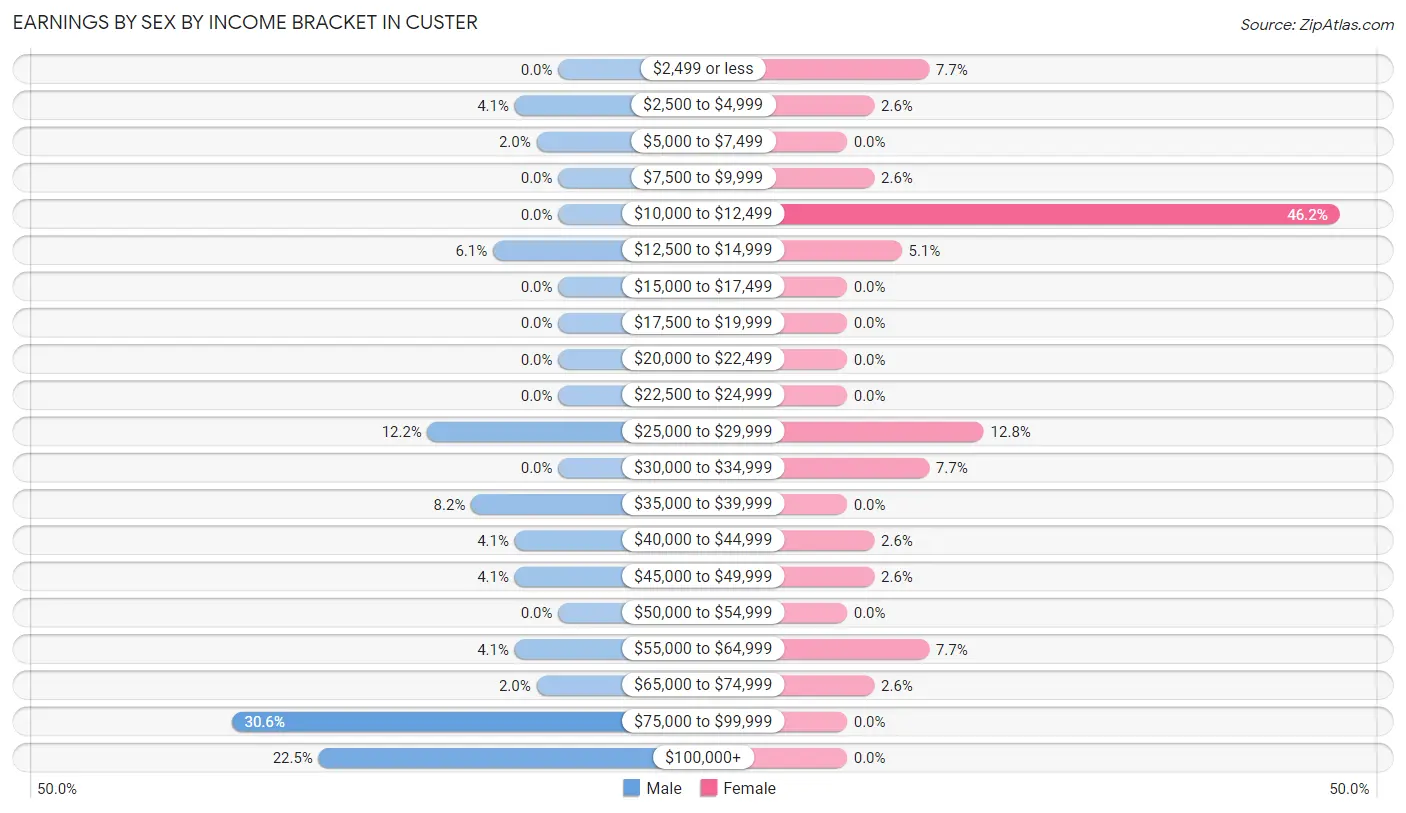
Earnings by Sex by Income Bracket in Custer
The most common earnings brackets in Custer are $75,000 to $99,999 for men (15 | 30.6%) and $10,000 to $12,499 for women (18 | 46.2%).
| Income | Male | Female |
| $2,499 or less | 0 (0.0%) | 3 (7.7%) |
| $2,500 to $4,999 | 2 (4.1%) | 1 (2.6%) |
| $5,000 to $7,499 | 1 (2.0%) | 0 (0.0%) |
| $7,500 to $9,999 | 0 (0.0%) | 1 (2.6%) |
| $10,000 to $12,499 | 0 (0.0%) | 18 (46.2%) |
| $12,500 to $14,999 | 3 (6.1%) | 2 (5.1%) |
| $15,000 to $17,499 | 0 (0.0%) | 0 (0.0%) |
| $17,500 to $19,999 | 0 (0.0%) | 0 (0.0%) |
| $20,000 to $22,499 | 0 (0.0%) | 0 (0.0%) |
| $22,500 to $24,999 | 0 (0.0%) | 0 (0.0%) |
| $25,000 to $29,999 | 6 (12.2%) | 5 (12.8%) |
| $30,000 to $34,999 | 0 (0.0%) | 3 (7.7%) |
| $35,000 to $39,999 | 4 (8.2%) | 0 (0.0%) |
| $40,000 to $44,999 | 2 (4.1%) | 1 (2.6%) |
| $45,000 to $49,999 | 2 (4.1%) | 1 (2.6%) |
| $50,000 to $54,999 | 0 (0.0%) | 0 (0.0%) |
| $55,000 to $64,999 | 2 (4.1%) | 3 (7.7%) |
| $65,000 to $74,999 | 1 (2.0%) | 1 (2.6%) |
| $75,000 to $99,999 | 15 (30.6%) | 0 (0.0%) |
| $100,000+ | 11 (22.5%) | 0 (0.0%) |
| Total | 49 (100.0%) | 39 (100.0%) |
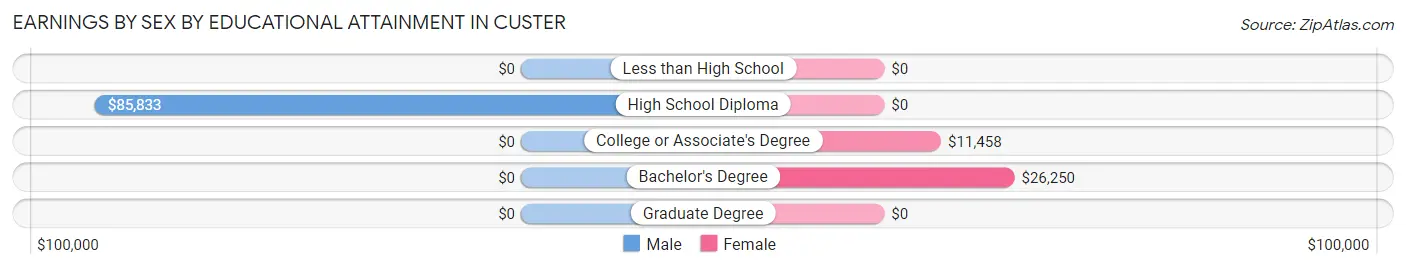
Earnings by Sex by Educational Attainment in Custer
| Educational Attainment | Male Income | Female Income |
| Less than High School | - | - |
| High School Diploma | $85,833 | $0 |
| College or Associate's Degree | - | - |
| Bachelor's Degree | - | - |
| Graduate Degree | - | - |
| Total | $85,417 | $0 |
Family Income in Custer
Family Income Brackets in Custer
According to the Custer family income data, there are 7 families falling into the $100,000 to $149,999 income range, which is the most common income bracket and makes up 29.2% of all families.
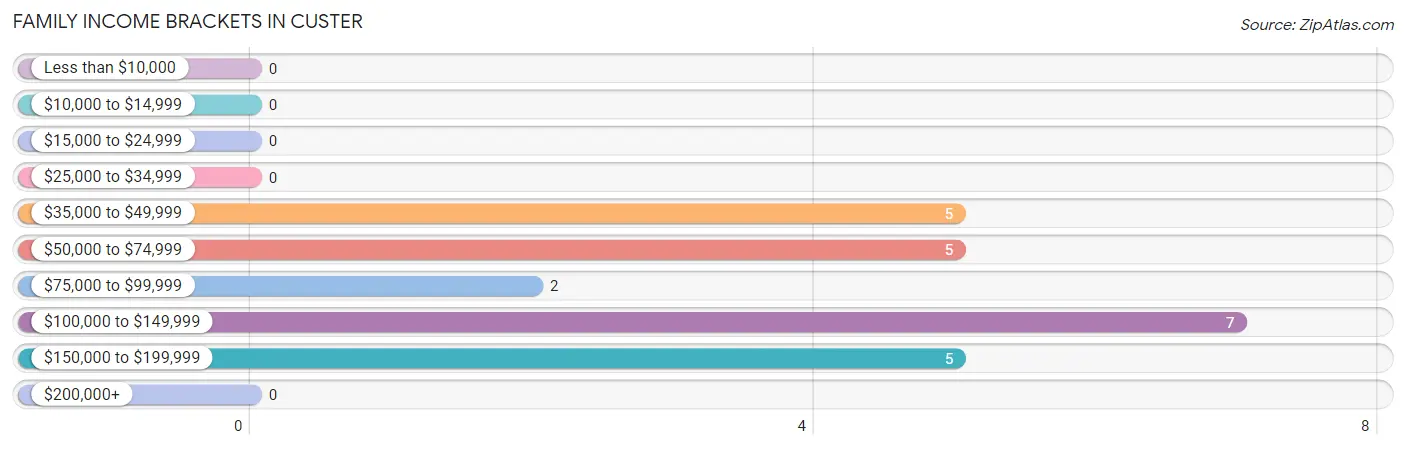
| Income Bracket | # Families | % Families |
| Less than $10,000 | 0 | 0.0% |
| $10,000 to $14,999 | 0 | 0.0% |
| $15,000 to $24,999 | 0 | 0.0% |
| $25,000 to $34,999 | 0 | 0.0% |
| $35,000 to $49,999 | 5 | 20.8% |
| $50,000 to $74,999 | 5 | 20.8% |
| $75,000 to $99,999 | 2 | 8.3% |
| $100,000 to $149,999 | 7 | 29.2% |
| $150,000 to $199,999 | 5 | 20.8% |
| $200,000+ | 0 | 0.0% |
Family Income by Famaliy Size in Custer
2-person families (12 | 50.0%) account for the highest median family income in Custer with $75,000 per family, while 2-person families (12 | 50.0%) have the highest median income of $37,500 per family member.
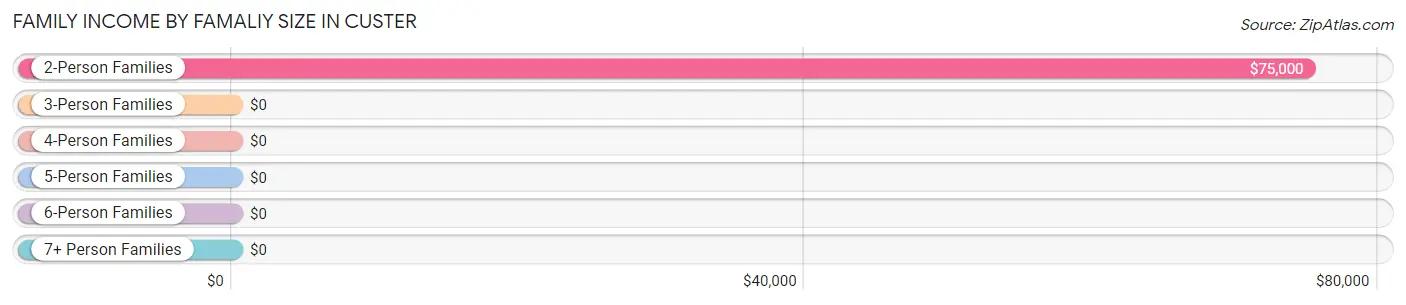
| Income Bracket | # Families | Median Income |
| 2-Person Families | 12 (50.0%) | $75,000 |
| 3-Person Families | 5 (20.8%) | $0 |
| 4-Person Families | 1 (4.2%) | $0 |
| 5-Person Families | 2 (8.3%) | $0 |
| 6-Person Families | 2 (8.3%) | $0 |
| 7+ Person Families | 2 (8.3%) | $0 |
| Total | 24 (100.0%) | $96,250 |
Family Income by Number of Earners in Custer
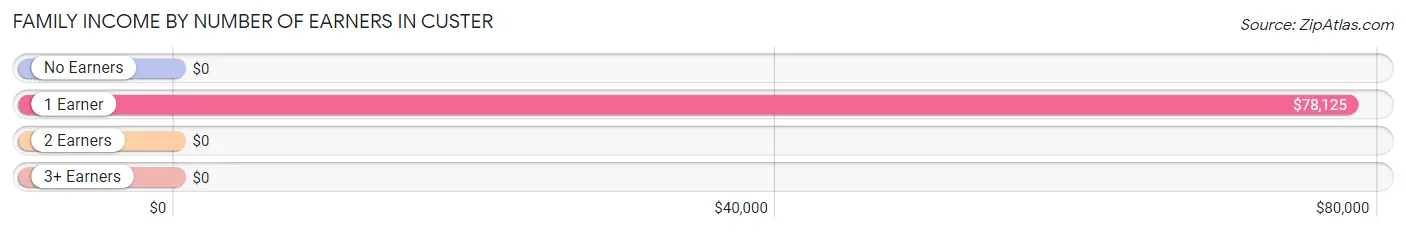
| Number of Earners | # Families | Median Income |
| No Earners | 1 (4.2%) | $0 |
| 1 Earner | 11 (45.8%) | $78,125 |
| 2 Earners | 5 (20.8%) | $0 |
| 3+ Earners | 7 (29.2%) | $0 |
| Total | 24 (100.0%) | $96,250 |
Household Income in Custer
Household Income Brackets in Custer
With 19 households falling in the category, the $75,000 to $99,999 income range is the most frequent in Custer, accounting for 25.3% of all households.
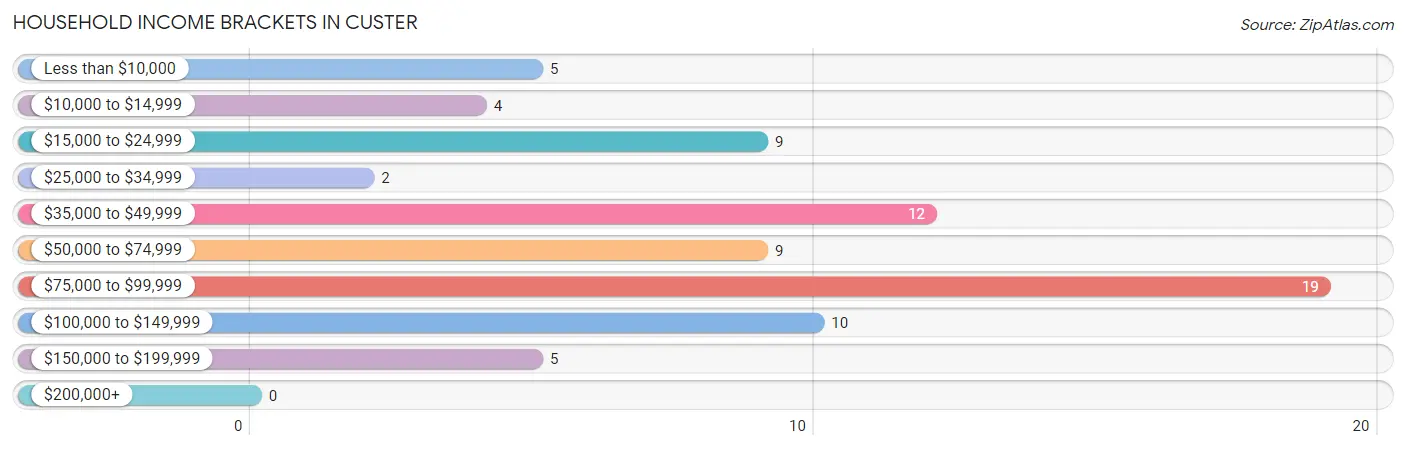
| Income Bracket | # Households | % Households |
| Less than $10,000 | 5 | 6.7% |
| $10,000 to $14,999 | 4 | 5.3% |
| $15,000 to $24,999 | 9 | 12.0% |
| $25,000 to $34,999 | 2 | 2.7% |
| $35,000 to $49,999 | 12 | 16.0% |
| $50,000 to $74,999 | 9 | 12.0% |
| $75,000 to $99,999 | 19 | 25.3% |
| $100,000 to $149,999 | 10 | 13.3% |
| $150,000 to $199,999 | 5 | 6.7% |
| $200,000+ | 0 | 0.0% |
Household Income by Householder Age in Custer
The median household income in Custer is $63,750, with the highest median household income of $99,167 found in the 45 to 64 years age bracket for the primary householder. A total of 32 households (42.7%) fall into this category. Meanwhile, the 15 to 24 years age bracket for the primary householder has the lowest median household income of $0, with 6 households (8.0%) in this group.
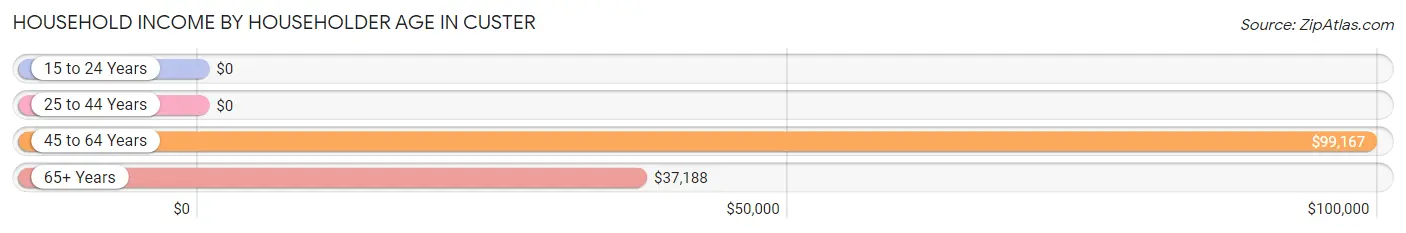
| Income Bracket | # Households | Median Income |
| 15 to 24 Years | 6 (8.0%) | $0 |
| 25 to 44 Years | 6 (8.0%) | $0 |
| 45 to 64 Years | 32 (42.7%) | $99,167 |
| 65+ Years | 31 (41.3%) | $37,188 |
| Total | 75 (100.0%) | $63,750 |
Poverty in Custer
Income Below Poverty by Sex and Age in Custer
With 2.9% poverty level for males and 29.5% for females among the residents of Custer, 55 to 64 year old males and 55 to 64 year old females are the most vulnerable to poverty, with 2 males (7.1%) and 18 females (60.0%) in their respective age groups living below the poverty level.
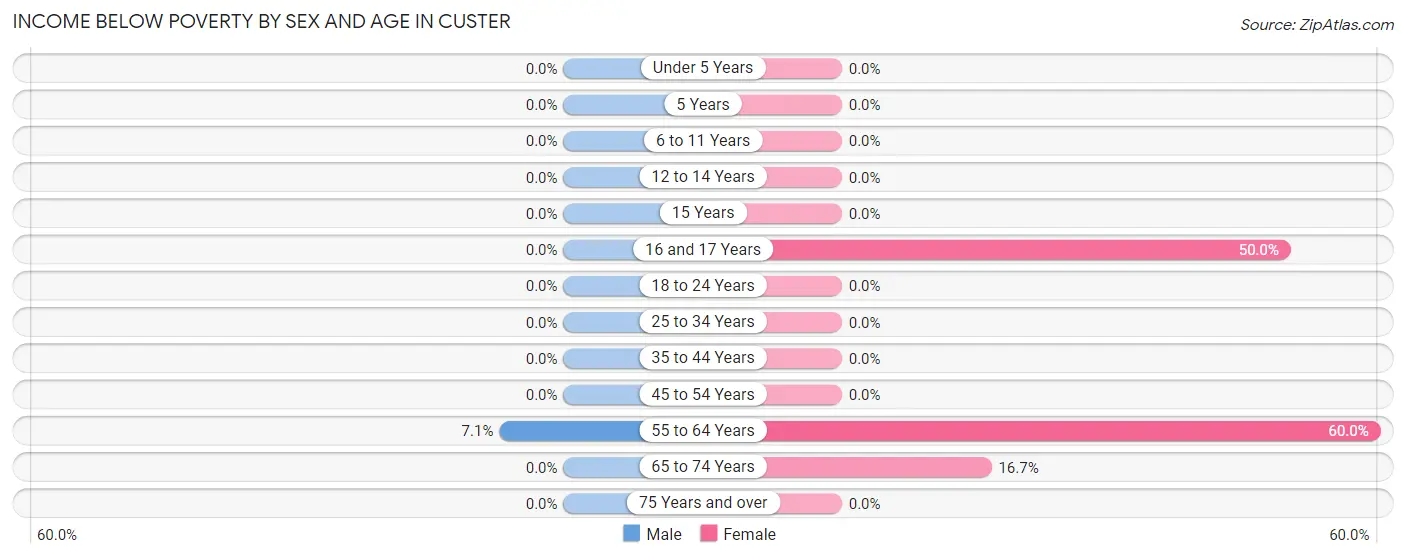
| Age Bracket | Male | Female |
| Under 5 Years | 0 (0.0%) | 0 (0.0%) |
| 5 Years | 0 (0.0%) | 0 (0.0%) |
| 6 to 11 Years | 0 (0.0%) | 0 (0.0%) |
| 12 to 14 Years | 0 (0.0%) | 0 (0.0%) |
| 15 Years | 0 (0.0%) | 0 (0.0%) |
| 16 and 17 Years | 0 (0.0%) | 3 (50.0%) |
| 18 to 24 Years | 0 (0.0%) | 0 (0.0%) |
| 25 to 34 Years | 0 (0.0%) | 0 (0.0%) |
| 35 to 44 Years | 0 (0.0%) | 0 (0.0%) |
| 45 to 54 Years | 0 (0.0%) | 0 (0.0%) |
| 55 to 64 Years | 2 (7.1%) | 18 (60.0%) |
| 65 to 74 Years | 0 (0.0%) | 2 (16.7%) |
| 75 Years and over | 0 (0.0%) | 0 (0.0%) |
| Total | 2 (2.9%) | 23 (29.5%) |
Income Above Poverty by Sex and Age in Custer
According to the poverty statistics in Custer, males aged under 5 years and females aged under 5 years are the age groups that are most secure financially, with 100.0% of males and 100.0% of females in these age groups living above the poverty line.
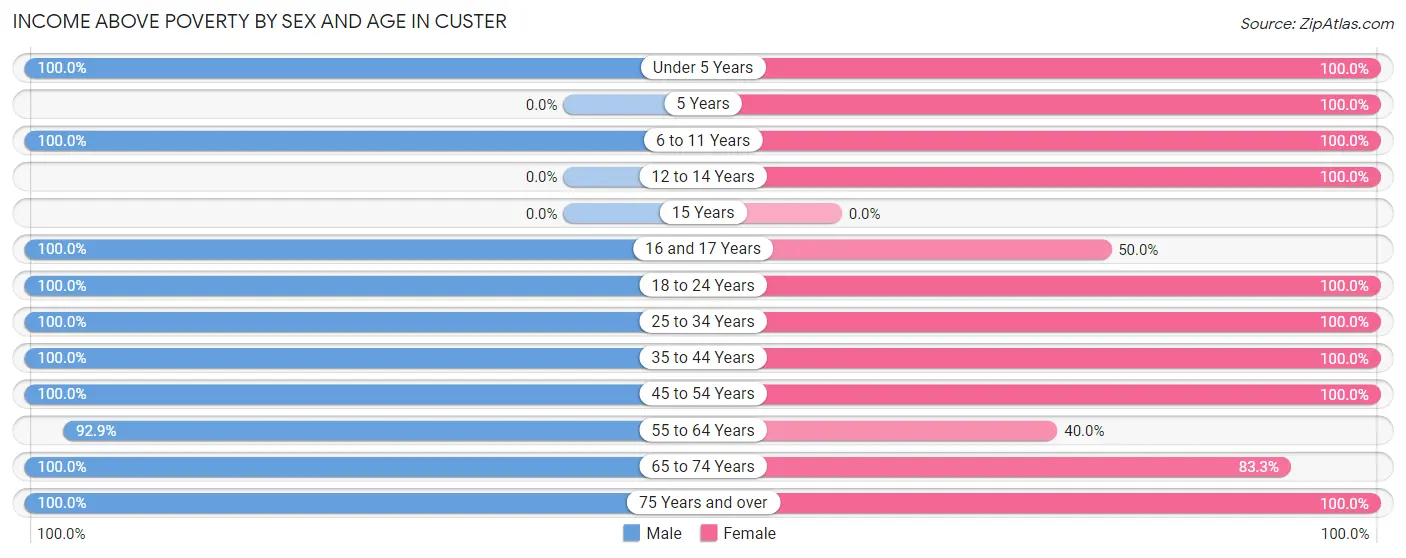
| Age Bracket | Male | Female |
| Under 5 Years | 1 (100.0%) | 2 (100.0%) |
| 5 Years | 0 (0.0%) | 1 (100.0%) |
| 6 to 11 Years | 4 (100.0%) | 7 (100.0%) |
| 12 to 14 Years | 0 (0.0%) | 4 (100.0%) |
| 15 Years | 0 (0.0%) | 0 (0.0%) |
| 16 and 17 Years | 2 (100.0%) | 3 (50.0%) |
| 18 to 24 Years | 2 (100.0%) | 1 (100.0%) |
| 25 to 34 Years | 8 (100.0%) | 2 (100.0%) |
| 35 to 44 Years | 4 (100.0%) | 4 (100.0%) |
| 45 to 54 Years | 1 (100.0%) | 2 (100.0%) |
| 55 to 64 Years | 26 (92.9%) | 12 (40.0%) |
| 65 to 74 Years | 9 (100.0%) | 10 (83.3%) |
| 75 Years and over | 9 (100.0%) | 7 (100.0%) |
| Total | 66 (97.1%) | 55 (70.5%) |
Income Below Poverty Among Married-Couple Families in Custer
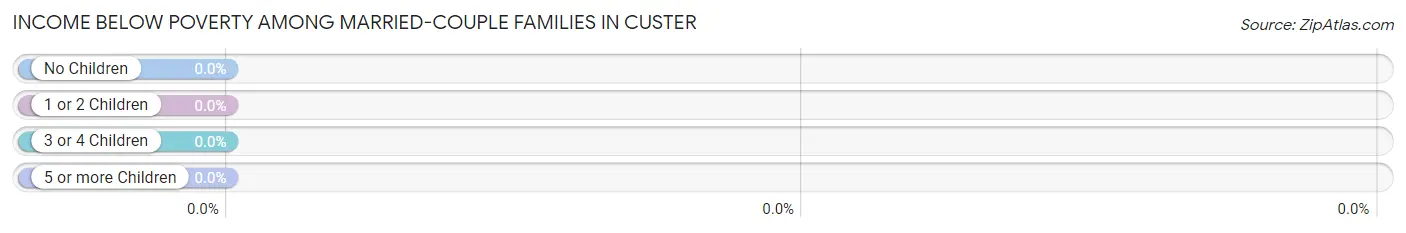
| Children | Above Poverty | Below Poverty |
| No Children | 15 (100.0%) | 0 (0.0%) |
| 1 or 2 Children | 1 (100.0%) | 0 (0.0%) |
| 3 or 4 Children | 4 (100.0%) | 0 (0.0%) |
| 5 or more Children | 2 (100.0%) | 0 (0.0%) |
| Total | 22 (100.0%) | 0 (0.0%) |
Income Below Poverty Among Single-Parent Households in Custer
| Children | Single Father | Single Mother |
| No Children | 0 (0.0%) | 0 (0.0%) |
| 1 or 2 Children | 0 (0.0%) | 0 (0.0%) |
| 3 or 4 Children | 0 (0.0%) | 0 (0.0%) |
| 5 or more Children | 0 (0.0%) | 0 (0.0%) |
| Total | 0 (0.0%) | 0 (0.0%) |
Income Below Poverty Among Married-Couple vs Single-Parent Households in Custer
| Children | Married-Couple Families | Single-Parent Households |
| No Children | 0 (0.0%) | 0 (0.0%) |
| 1 or 2 Children | 0 (0.0%) | 0 (0.0%) |
| 3 or 4 Children | 0 (0.0%) | 0 (0.0%) |
| 5 or more Children | 0 (0.0%) | 0 (0.0%) |
| Total | 0 (0.0%) | 0 (0.0%) |
Race in Custer
The most populous races in Custer are White / Caucasian (142 | 97.3%), Hispanic or Latino (7 | 4.8%), and Two or more Races (4 | 2.7%).
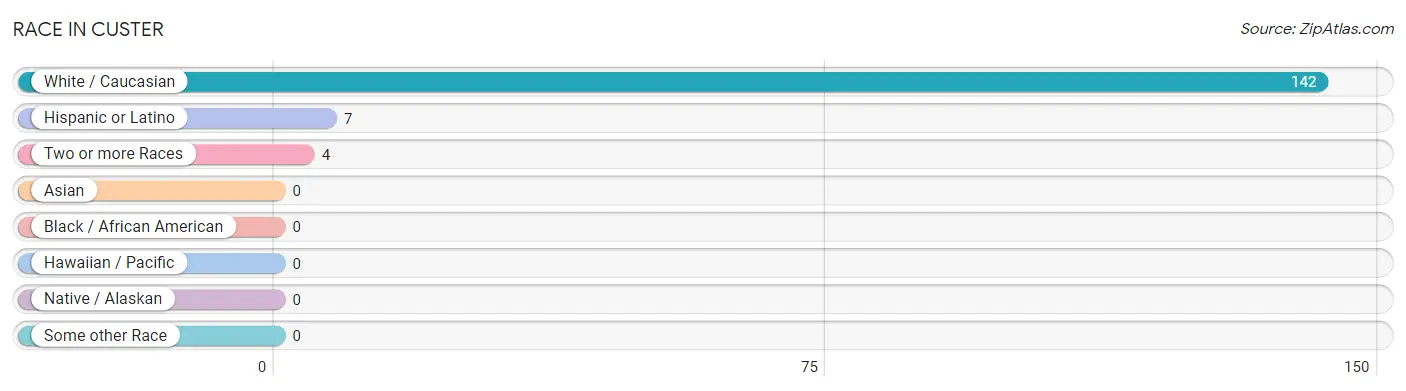
| Race | # Population | % Population |
| Asian | 0 | 0.0% |
| Black / African American | 0 | 0.0% |
| Hawaiian / Pacific | 0 | 0.0% |
| Hispanic or Latino | 7 | 4.8% |
| Native / Alaskan | 0 | 0.0% |
| White / Caucasian | 142 | 97.3% |
| Two or more Races | 4 | 2.7% |
| Some other Race | 0 | 0.0% |
| Total | 146 | 100.0% |
Ancestry in Custer
The most populous ancestries reported in Custer are German (53 | 36.3%), Norwegian (50 | 34.3%), English (26 | 17.8%), Irish (13 | 8.9%), and American (12 | 8.2%), together accounting for 105.5% of all Custer residents.
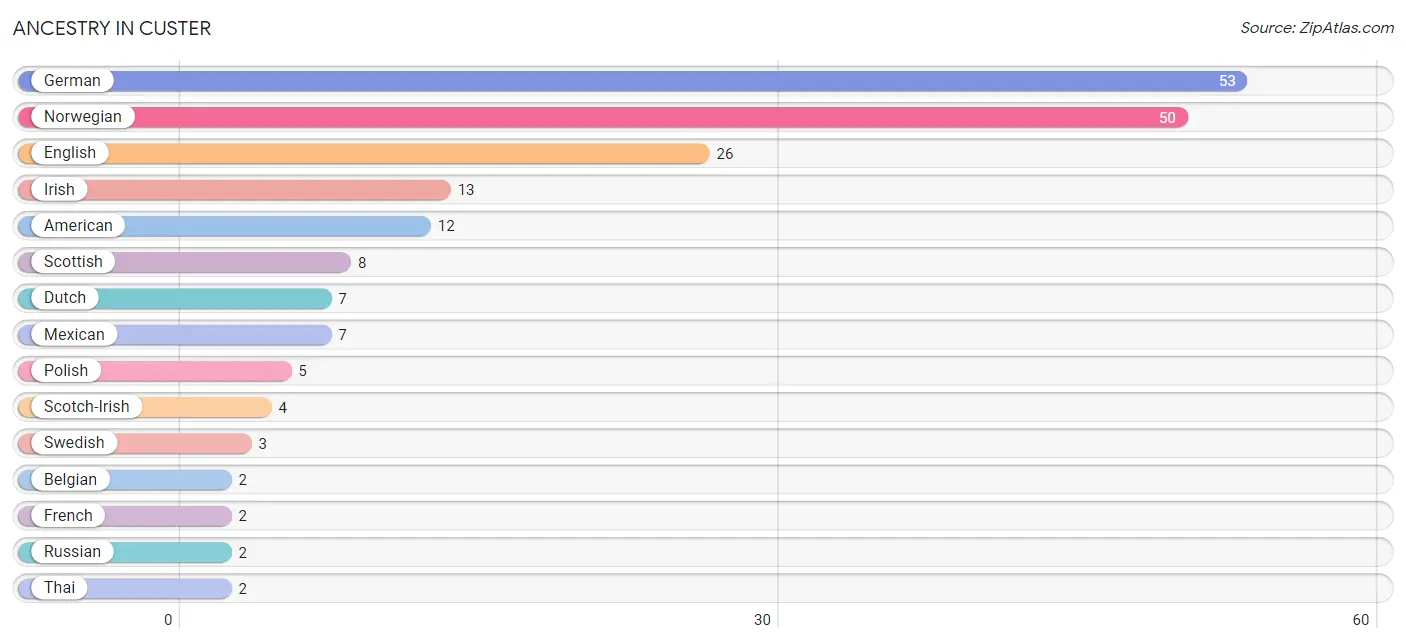
| Ancestry | # Population | % Population |
| American | 12 | 8.2% |
| Belgian | 2 | 1.4% |
| Czech | 1 | 0.7% |
| Dutch | 7 | 4.8% |
| English | 26 | 17.8% |
| French | 2 | 1.4% |
| German | 53 | 36.3% |
| Irish | 13 | 8.9% |
| Mexican | 7 | 4.8% |
| Norwegian | 50 | 34.3% |
| Polish | 5 | 3.4% |
| Russian | 2 | 1.4% |
| Scotch-Irish | 4 | 2.7% |
| Scottish | 8 | 5.5% |
| Swedish | 3 | 2.1% |
| Thai | 2 | 1.4% |
| Ukrainian | 1 | 0.7% | View All 17 Rows |
Immigrants in Custer

| Immigration Origin | # Population | % Population | View All 0 Rows |
Sex and Age in Custer
Sex and Age in Custer
The most populous age groups in Custer are 55 to 59 Years (25 | 36.8%) for men and 60 to 64 Years (23 | 29.5%) for women.
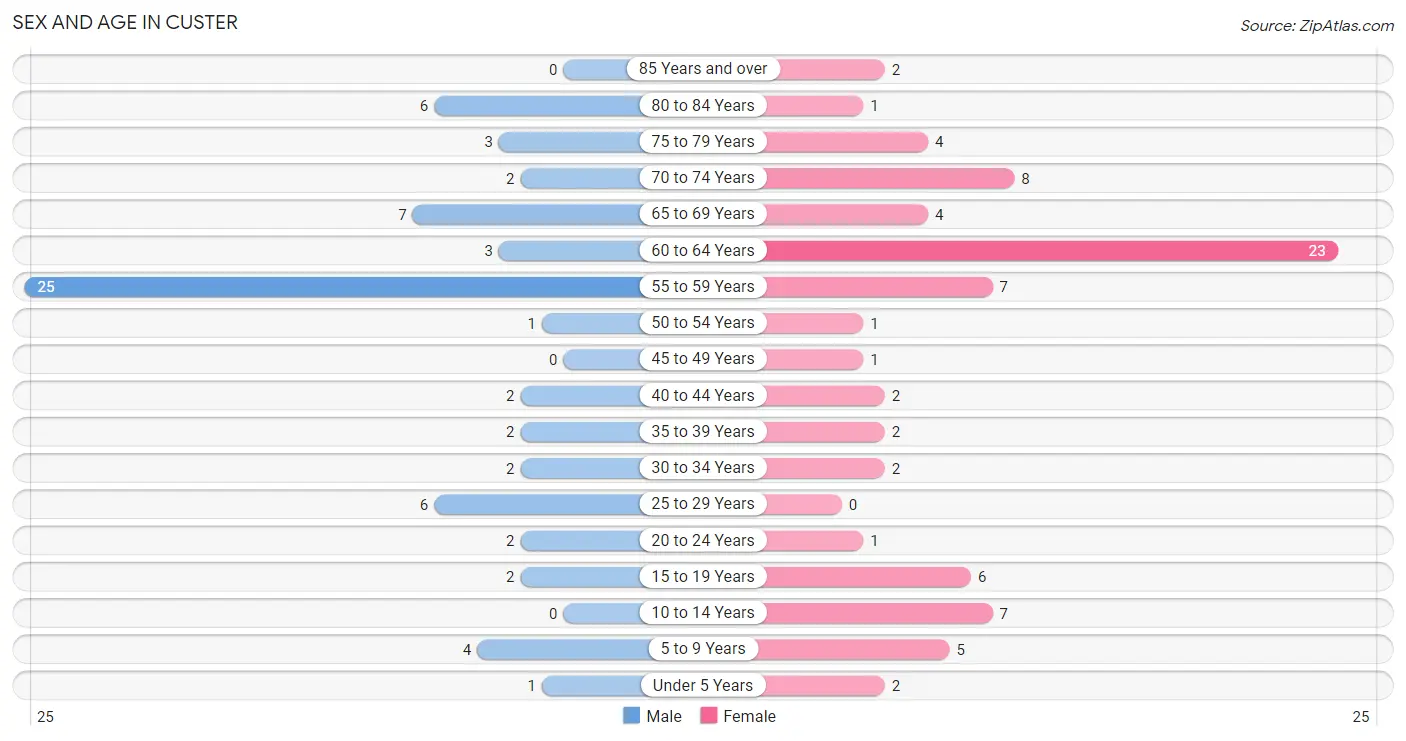
| Age Bracket | Male | Female |
| Under 5 Years | 1 (1.5%) | 2 (2.6%) |
| 5 to 9 Years | 4 (5.9%) | 5 (6.4%) |
| 10 to 14 Years | 0 (0.0%) | 7 (9.0%) |
| 15 to 19 Years | 2 (2.9%) | 6 (7.7%) |
| 20 to 24 Years | 2 (2.9%) | 1 (1.3%) |
| 25 to 29 Years | 6 (8.8%) | 0 (0.0%) |
| 30 to 34 Years | 2 (2.9%) | 2 (2.6%) |
| 35 to 39 Years | 2 (2.9%) | 2 (2.6%) |
| 40 to 44 Years | 2 (2.9%) | 2 (2.6%) |
| 45 to 49 Years | 0 (0.0%) | 1 (1.3%) |
| 50 to 54 Years | 1 (1.5%) | 1 (1.3%) |
| 55 to 59 Years | 25 (36.8%) | 7 (9.0%) |
| 60 to 64 Years | 3 (4.4%) | 23 (29.5%) |
| 65 to 69 Years | 7 (10.3%) | 4 (5.1%) |
| 70 to 74 Years | 2 (2.9%) | 8 (10.3%) |
| 75 to 79 Years | 3 (4.4%) | 4 (5.1%) |
| 80 to 84 Years | 6 (8.8%) | 1 (1.3%) |
| 85 Years and over | 0 (0.0%) | 2 (2.6%) |
| Total | 68 (100.0%) | 78 (100.0%) |
Families and Households in Custer
Median Family Size in Custer
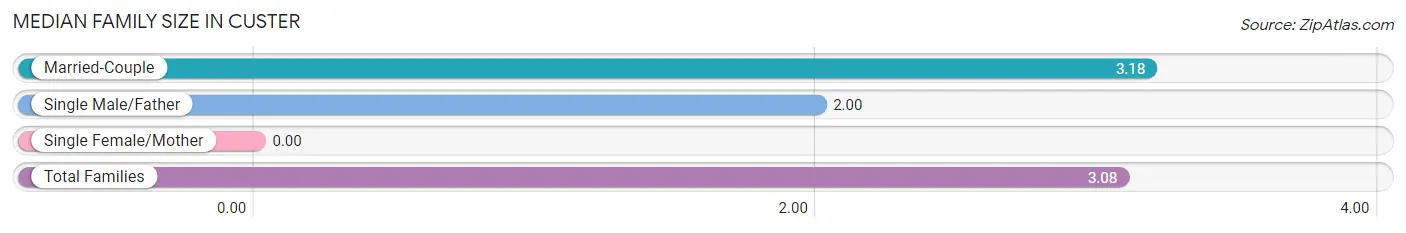
| Family Type | # Families | Family Size |
| Married-Couple | 22 (91.7%) | 3.18 |
| Single Male/Father | 2 (8.3%) | 2.00 |
| Single Female/Mother | 0 (0.0%) | - |
| Total Families | 24 (100.0%) | 3.08 |
Median Household Size in Custer
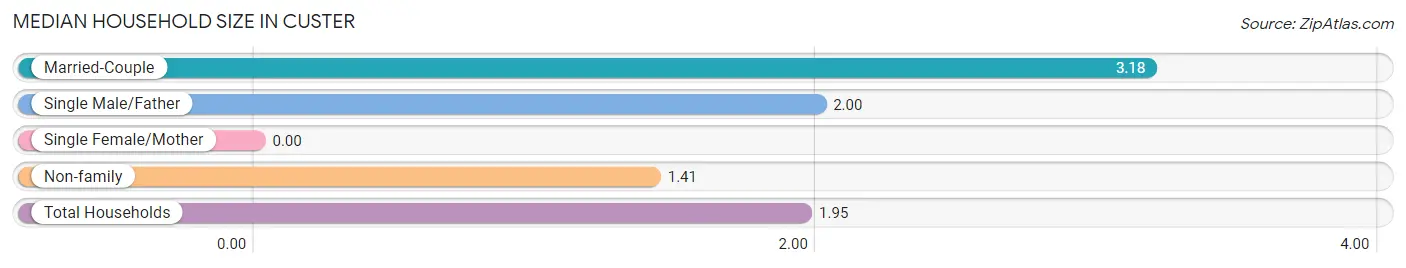
| Household Type | # Households | Household Size |
| Married-Couple | 22 (29.3%) | 3.18 |
| Single Male/Father | 2 (2.7%) | 2.00 |
| Single Female/Mother | 0 (0.0%) | - |
| Non-family | 51 (68.0%) | 1.41 |
| Total Households | 75 (100.0%) | 1.95 |
Household Size by Marriage Status in Custer
Out of a total of 75 households in Custer, 24 (32.0%) are family households, while 51 (68.0%) are nonfamily households. The most numerous type of family households are 2-person households, comprising 12, and the most common type of nonfamily households are 1-person households, comprising 33.
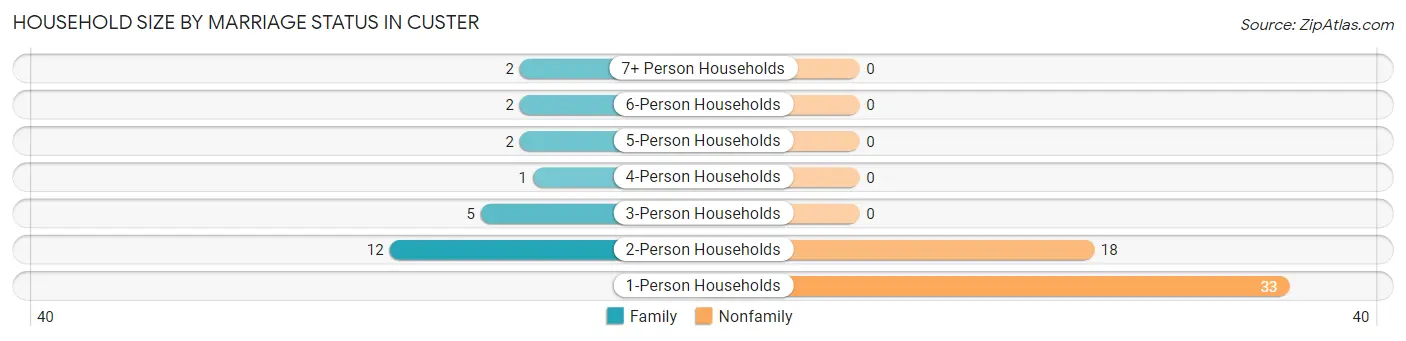
| Household Size | Family Households | Nonfamily Households |
| 1-Person Households | - | 33 (44.0%) |
| 2-Person Households | 12 (16.0%) | 18 (24.0%) |
| 3-Person Households | 5 (6.7%) | 0 (0.0%) |
| 4-Person Households | 1 (1.3%) | 0 (0.0%) |
| 5-Person Households | 2 (2.7%) | 0 (0.0%) |
| 6-Person Households | 2 (2.7%) | 0 (0.0%) |
| 7+ Person Households | 2 (2.7%) | 0 (0.0%) |
| Total | 24 (32.0%) | 51 (68.0%) |
Female Fertility in Custer
Fertility by Age in Custer
| Age Bracket | Women with Births | Births / 1,000 Women |
| 15 to 19 years | 0 (0.0%) | 0.0 |
| 20 to 34 years | 0 (0.0%) | 0.0 |
| 35 to 50 years | 0 (0.0%) | 0.0 |
| Total | 0 (0.0%) | 0.0 |
Fertility by Age by Marriage Status in Custer
| Age Bracket | Married | Unmarried |
| 15 to 19 years | 0 (0.0%) | 0 (0.0%) |
| 20 to 34 years | 0 (0.0%) | 0 (0.0%) |
| 35 to 50 years | 0 (0.0%) | 0 (0.0%) |
| Total | 0 (0.0%) | 0 (0.0%) |
Fertility by Education in Custer
| Educational Attainment | Women with Births | Births / 1,000 Women |
| Less than High School | 0 (0.0%) | 0.0 |
| High School Diploma | 0 (0.0%) | 0.0 |
| College or Associate's Degree | 0 (0.0%) | 0.0 |
| Bachelor's Degree | 0 (0.0%) | 0.0 |
| Graduate Degree | 0 (0.0%) | 0.0 |
| Total | 0 (0.0%) | 0.0 |
Fertility by Education by Marriage Status in Custer
| Educational Attainment | Married | Unmarried |
| Less than High School | 0 (0.0%) | 0 (0.0%) |
| High School Diploma | 0 (0.0%) | 0 (0.0%) |
| College or Associate's Degree | 0 (0.0%) | 0 (0.0%) |
| Bachelor's Degree | 0 (0.0%) | 0 (0.0%) |
| Graduate Degree | 0 (0.0%) | 0 (0.0%) |
| Total | 0 (0.0%) | 0 (0.0%) |
Employment Characteristics in Custer
Employment by Class of Employer in Custer
Among the 77 employed individuals in Custer, private company employees (57 | 74.0%), not-for-profit organizations (6 | 7.8%), and local government employees (6 | 7.8%) make up the most common classes of employment.
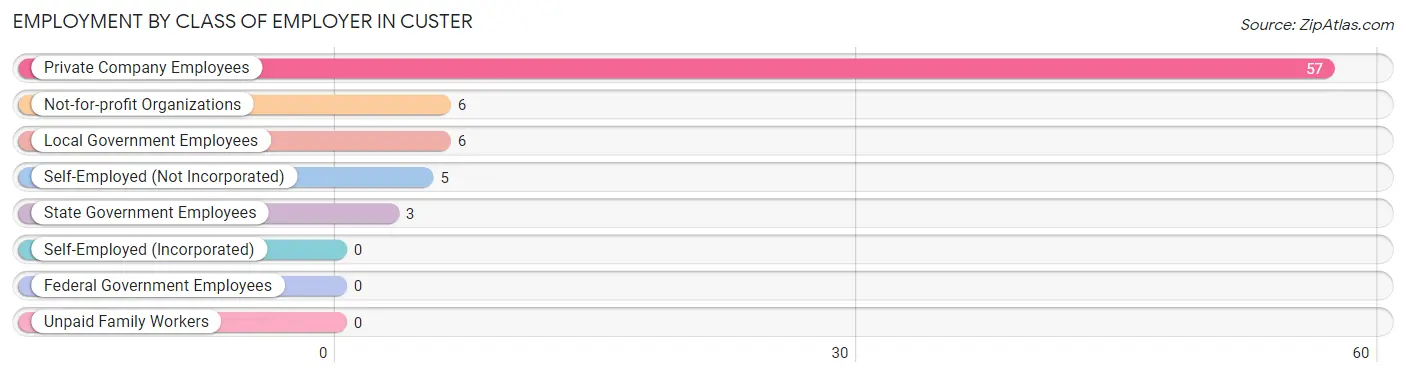
| Employer Class | # Employees | % Employees |
| Private Company Employees | 57 | 74.0% |
| Self-Employed (Incorporated) | 0 | 0.0% |
| Self-Employed (Not Incorporated) | 5 | 6.5% |
| Not-for-profit Organizations | 6 | 7.8% |
| Local Government Employees | 6 | 7.8% |
| State Government Employees | 3 | 3.9% |
| Federal Government Employees | 0 | 0.0% |
| Unpaid Family Workers | 0 | 0.0% |
| Total | 77 | 100.0% |
Employment Status by Age in Custer
According to the labor force statistics for Custer, out of the total population over 16 years of age (127), 62.2% or 79 individuals are in the labor force, with 2.5% or 2 of them unemployed. The age group with the highest labor force participation rate is 20 to 24 years, with 100.0% or 3 individuals in the labor force. Within the labor force, the 65 to 74 years age range has the highest percentage of unemployed individuals, with 40.0% or 2 of them being unemployed.
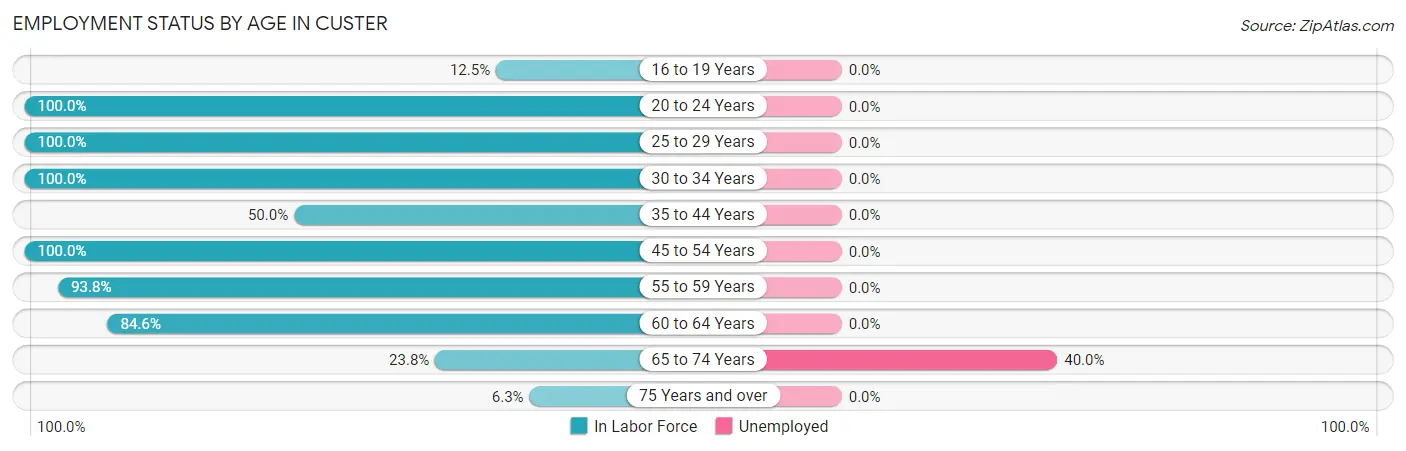
| Age Bracket | In Labor Force | Unemployed |
| 16 to 19 Years | 1 (12.5%) | 0 (0.0%) |
| 20 to 24 Years | 3 (100.0%) | 0 (0.0%) |
| 25 to 29 Years | 6 (100.0%) | 0 (0.0%) |
| 30 to 34 Years | 4 (100.0%) | 0 (0.0%) |
| 35 to 44 Years | 4 (50.0%) | 0 (0.0%) |
| 45 to 54 Years | 3 (100.0%) | 0 (0.0%) |
| 55 to 59 Years | 30 (93.8%) | 0 (0.0%) |
| 60 to 64 Years | 22 (84.6%) | 0 (0.0%) |
| 65 to 74 Years | 5 (23.8%) | 2 (40.0%) |
| 75 Years and over | 1 (6.3%) | 0 (0.0%) |
| Total | 79 (62.2%) | 2 (2.5%) |
Employment Status by Educational Attainment in Custer
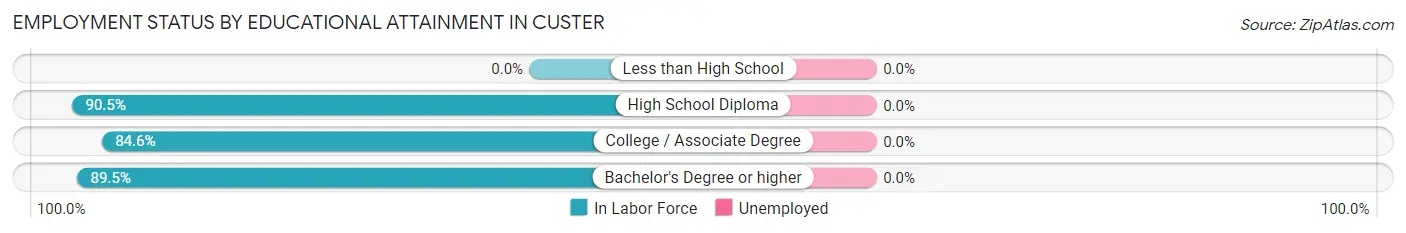
| Educational Attainment | In Labor Force | Unemployed |
| Less than High School | 0 (0.0%) | 0 (0.0%) |
| High School Diploma | 19 (90.5%) | 0 (0.0%) |
| College / Associate Degree | 33 (84.6%) | 0 (0.0%) |
| Bachelor's Degree or higher | 17 (89.5%) | 0 (0.0%) |
| Total | 69 (87.3%) | 0 (0.0%) |
Employment Occupations by Sex in Custer
Management, Business, Science and Arts Occupations
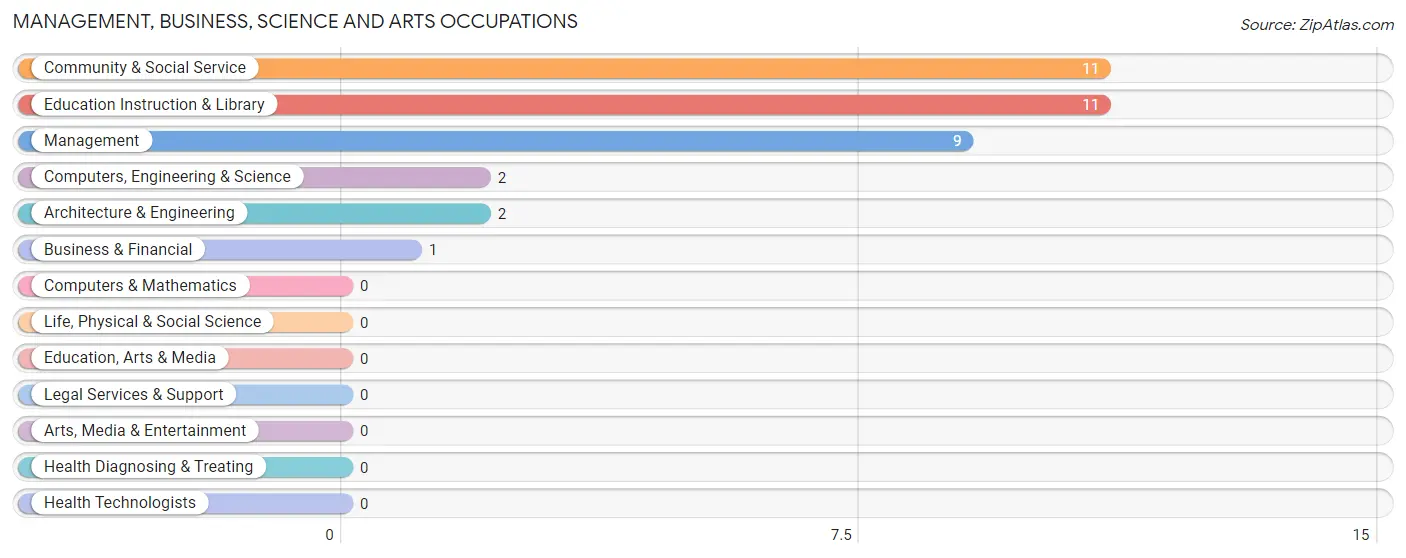
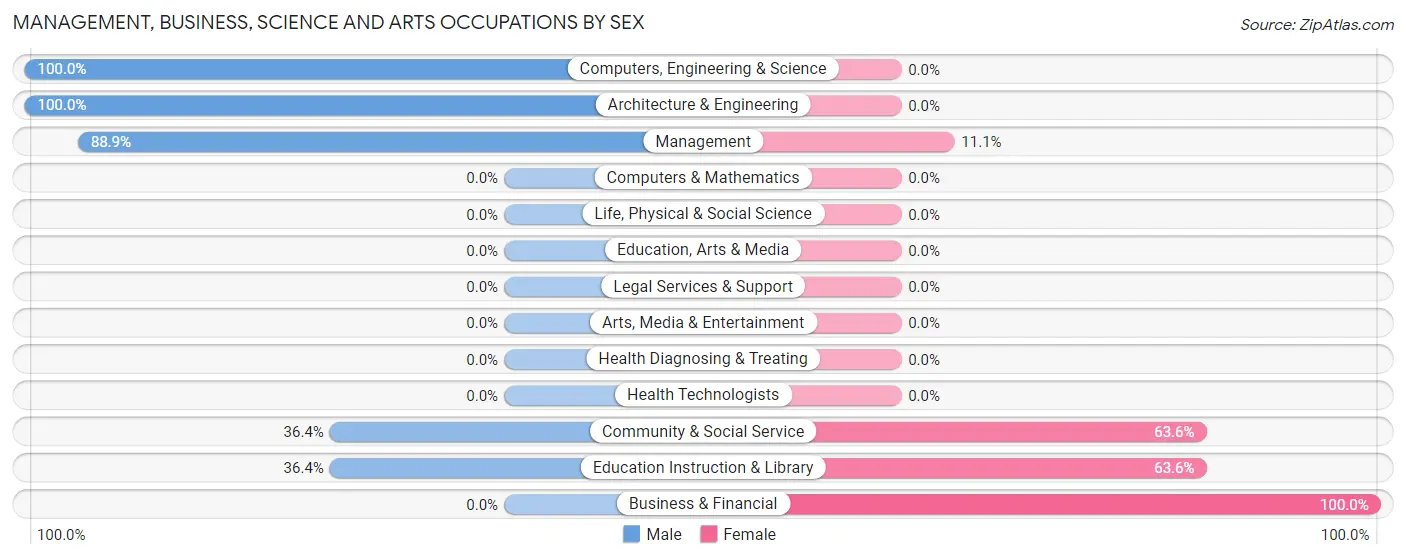
The most common Management, Business, Science and Arts occupations in Custer are Community & Social Service (11 | 14.3%), Education Instruction & Library (11 | 14.3%), Management (9 | 11.7%), Computers, Engineering & Science (2 | 2.6%), and Architecture & Engineering (2 | 2.6%).
Management, Business, Science and Arts Occupations by Sex
Within the Management, Business, Science and Arts occupations in Custer, the most male-oriented occupations are Computers, Engineering & Science (100.0%), Architecture & Engineering (100.0%), and Management (88.9%), while the most female-oriented occupations are Business & Financial (100.0%), Community & Social Service (63.6%), and Education Instruction & Library (63.6%).
| Occupation | Male | Female |
| Management | 8 (88.9%) | 1 (11.1%) |
| Business & Financial | 0 (0.0%) | 1 (100.0%) |
| Computers, Engineering & Science | 2 (100.0%) | 0 (0.0%) |
| Computers & Mathematics | 0 (0.0%) | 0 (0.0%) |
| Architecture & Engineering | 2 (100.0%) | 0 (0.0%) |
| Life, Physical & Social Science | 0 (0.0%) | 0 (0.0%) |
| Community & Social Service | 4 (36.4%) | 7 (63.6%) |
| Education, Arts & Media | 0 (0.0%) | 0 (0.0%) |
| Legal Services & Support | 0 (0.0%) | 0 (0.0%) |
| Education Instruction & Library | 4 (36.4%) | 7 (63.6%) |
| Arts, Media & Entertainment | 0 (0.0%) | 0 (0.0%) |
| Health Diagnosing & Treating | 0 (0.0%) | 0 (0.0%) |
| Health Technologists | 0 (0.0%) | 0 (0.0%) |
| Total (Category) | 14 (60.9%) | 9 (39.1%) |
| Total (Overall) | 44 (57.1%) | 33 (42.9%) |
Services Occupations
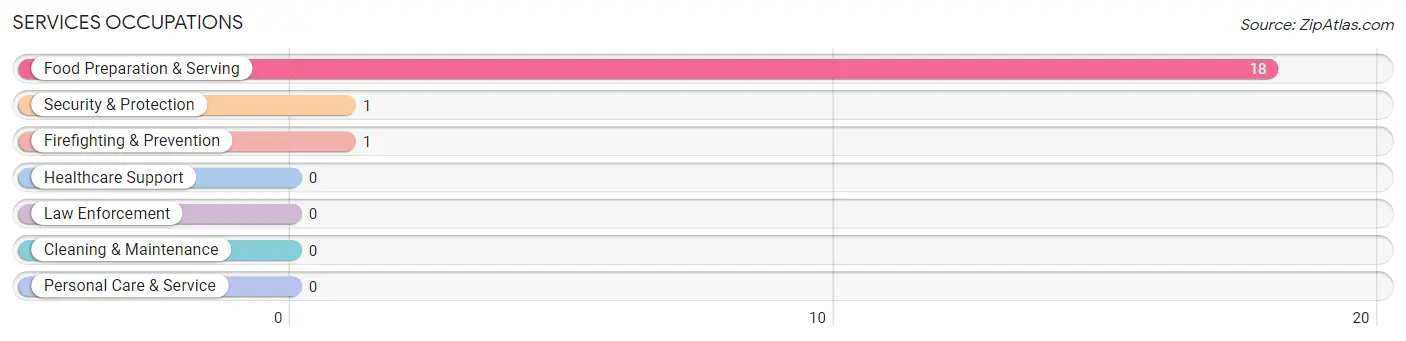
The most common Services occupations in Custer are Food Preparation & Serving (18 | 23.4%), Security & Protection (1 | 1.3%), and Firefighting & Prevention (1 | 1.3%).
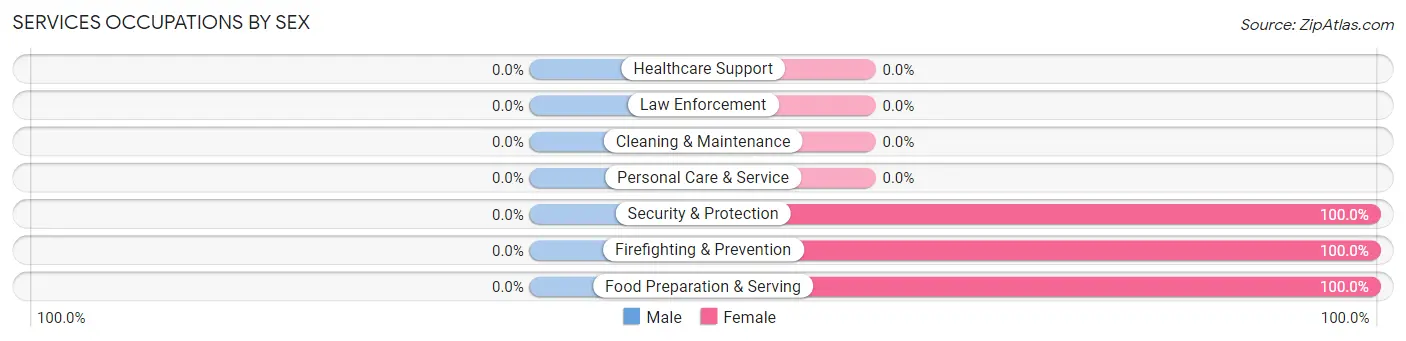
Services Occupations by Sex
| Occupation | Male | Female |
| Healthcare Support | 0 (0.0%) | 0 (0.0%) |
| Security & Protection | 0 (0.0%) | 1 (100.0%) |
| Firefighting & Prevention | 0 (0.0%) | 1 (100.0%) |
| Law Enforcement | 0 (0.0%) | 0 (0.0%) |
| Food Preparation & Serving | 0 (0.0%) | 18 (100.0%) |
| Cleaning & Maintenance | 0 (0.0%) | 0 (0.0%) |
| Personal Care & Service | 0 (0.0%) | 0 (0.0%) |
| Total (Category) | 0 (0.0%) | 19 (100.0%) |
| Total (Overall) | 44 (57.1%) | 33 (42.9%) |
Sales and Office Occupations
The most common Sales and Office occupations in Custer are , and Sales & Related (12 | 15.6%).

Sales and Office Occupations by Sex

| Occupation | Male | Female |
| Sales & Related | 7 (58.3%) | 5 (41.7%) |
| Office & Administration | 0 (0.0%) | 0 (0.0%) |
| Total (Category) | 7 (58.3%) | 5 (41.7%) |
| Total (Overall) | 44 (57.1%) | 33 (42.9%) |
Natural Resources, Construction and Maintenance Occupations
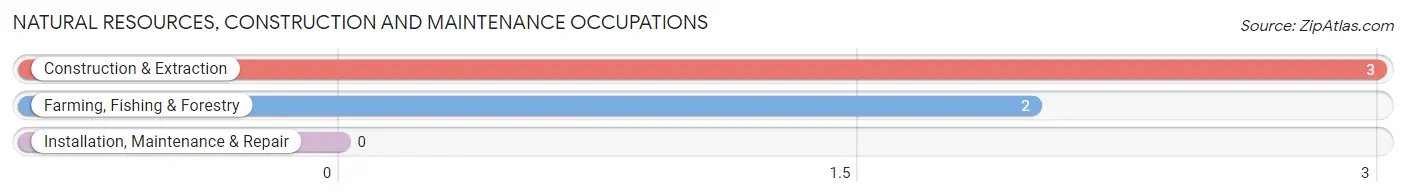
The most common Natural Resources, Construction and Maintenance occupations in Custer are Construction & Extraction (3 | 3.9%), and Farming, Fishing & Forestry (2 | 2.6%).
Natural Resources, Construction and Maintenance Occupations by Sex
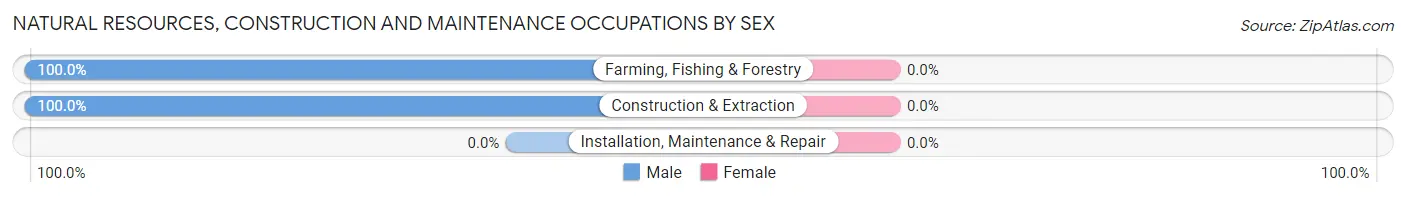
| Occupation | Male | Female |
| Farming, Fishing & Forestry | 2 (100.0%) | 0 (0.0%) |
| Construction & Extraction | 3 (100.0%) | 0 (0.0%) |
| Installation, Maintenance & Repair | 0 (0.0%) | 0 (0.0%) |
| Total (Category) | 5 (100.0%) | 0 (0.0%) |
| Total (Overall) | 44 (57.1%) | 33 (42.9%) |
Production, Transportation and Moving Occupations
The most common Production, Transportation and Moving occupations in Custer are , and Transportation (18 | 23.4%).
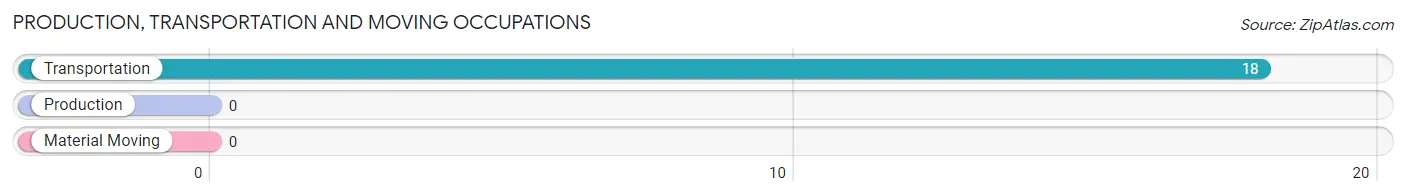
Production, Transportation and Moving Occupations by Sex
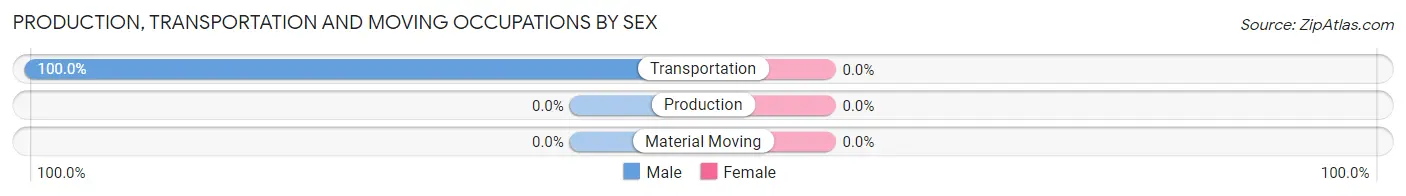
| Occupation | Male | Female |
| Production | 0 (0.0%) | 0 (0.0%) |
| Transportation | 18 (100.0%) | 0 (0.0%) |
| Material Moving | 0 (0.0%) | 0 (0.0%) |
| Total (Category) | 18 (100.0%) | 0 (0.0%) |
| Total (Overall) | 44 (57.1%) | 33 (42.9%) |
Employment Industries by Sex in Custer
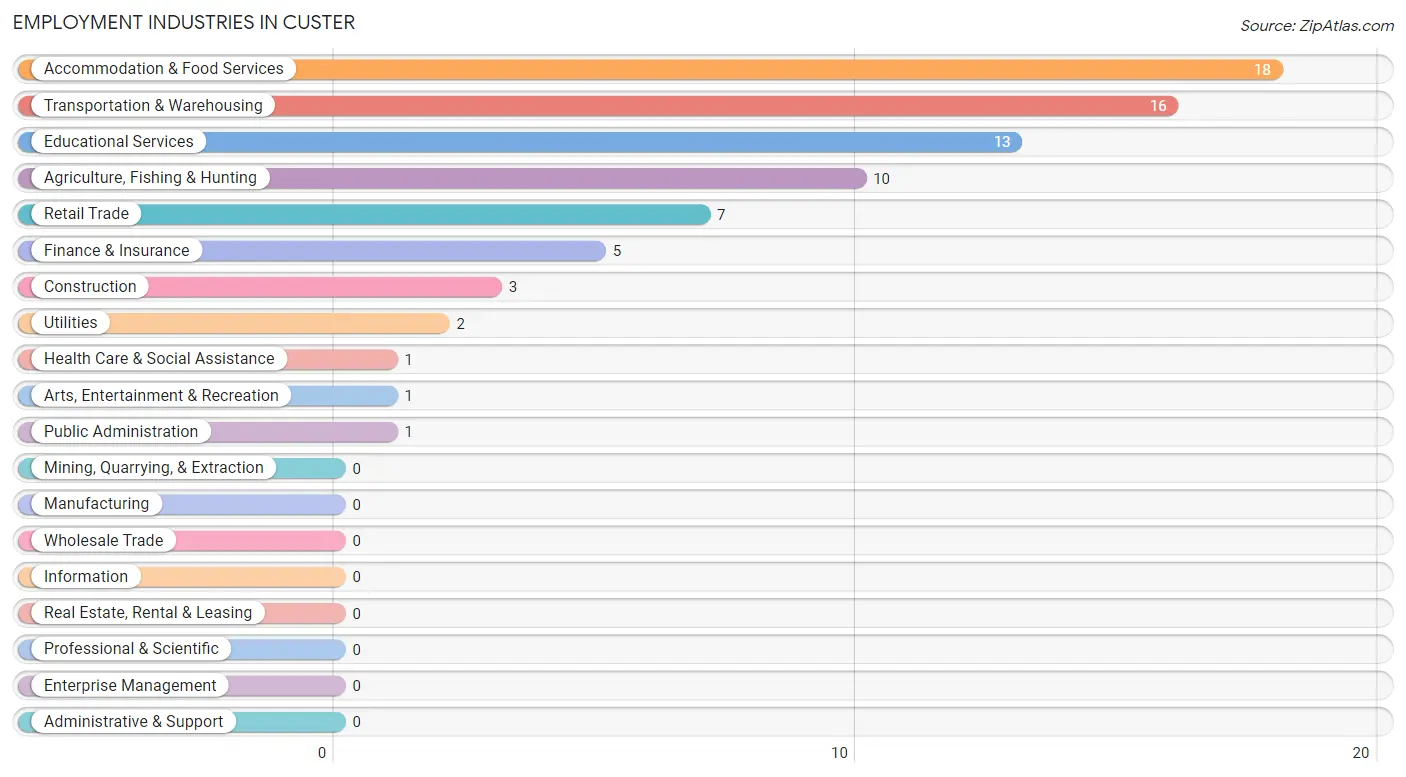
Employment Industries in Custer
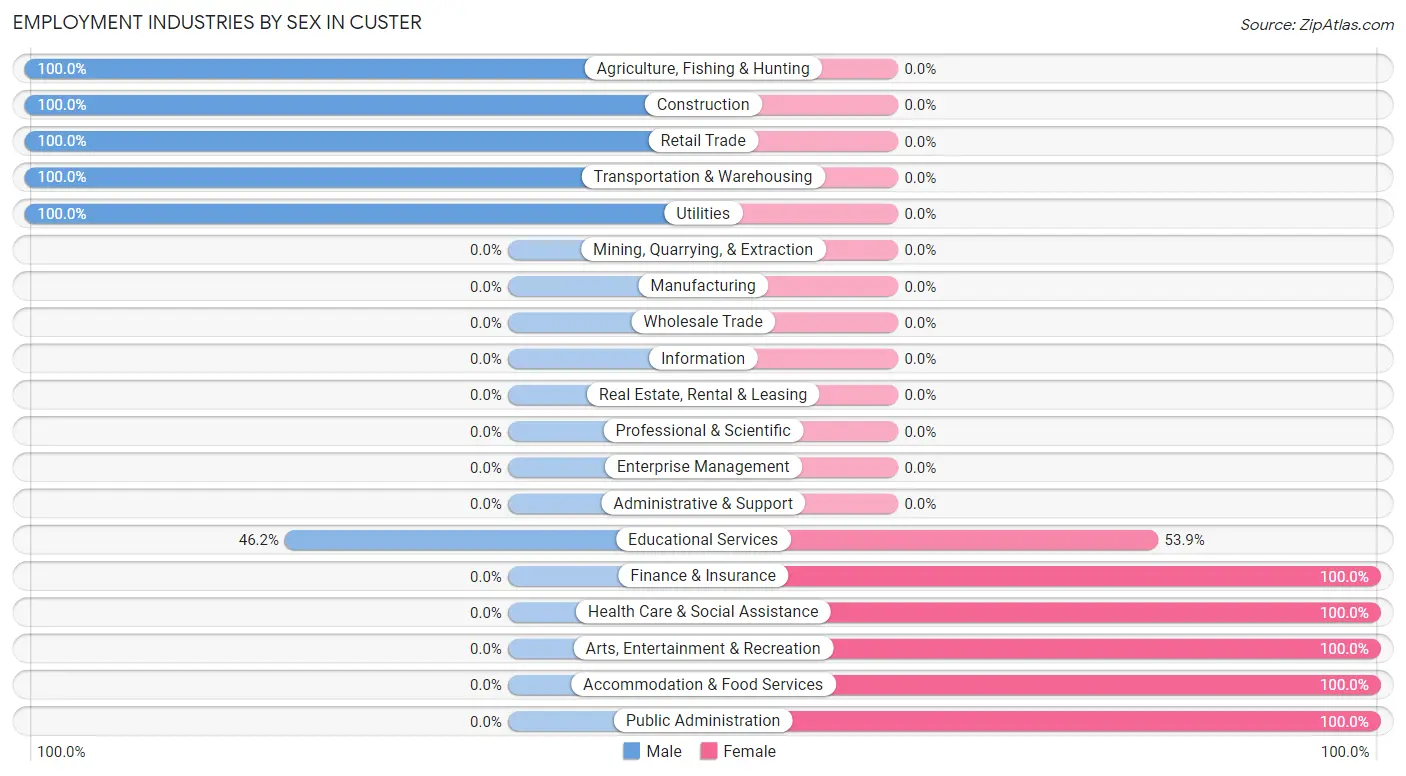
The major employment industries in Custer include Accommodation & Food Services (18 | 23.4%), Transportation & Warehousing (16 | 20.8%), Educational Services (13 | 16.9%), Agriculture, Fishing & Hunting (10 | 13.0%), and Retail Trade (7 | 9.1%).
Employment Industries by Sex in Custer
The Custer industries that see more men than women are Agriculture, Fishing & Hunting (100.0%), Construction (100.0%), and Retail Trade (100.0%), whereas the industries that tend to have a higher number of women are Finance & Insurance (100.0%), Health Care & Social Assistance (100.0%), and Arts, Entertainment & Recreation (100.0%).
| Industry | Male | Female |
| Agriculture, Fishing & Hunting | 10 (100.0%) | 0 (0.0%) |
| Mining, Quarrying, & Extraction | 0 (0.0%) | 0 (0.0%) |
| Construction | 3 (100.0%) | 0 (0.0%) |
| Manufacturing | 0 (0.0%) | 0 (0.0%) |
| Wholesale Trade | 0 (0.0%) | 0 (0.0%) |
| Retail Trade | 7 (100.0%) | 0 (0.0%) |
| Transportation & Warehousing | 16 (100.0%) | 0 (0.0%) |
| Utilities | 2 (100.0%) | 0 (0.0%) |
| Information | 0 (0.0%) | 0 (0.0%) |
| Finance & Insurance | 0 (0.0%) | 5 (100.0%) |
| Real Estate, Rental & Leasing | 0 (0.0%) | 0 (0.0%) |
| Professional & Scientific | 0 (0.0%) | 0 (0.0%) |
| Enterprise Management | 0 (0.0%) | 0 (0.0%) |
| Administrative & Support | 0 (0.0%) | 0 (0.0%) |
| Educational Services | 6 (46.2%) | 7 (53.8%) |
| Health Care & Social Assistance | 0 (0.0%) | 1 (100.0%) |
| Arts, Entertainment & Recreation | 0 (0.0%) | 1 (100.0%) |
| Accommodation & Food Services | 0 (0.0%) | 18 (100.0%) |
| Public Administration | 0 (0.0%) | 1 (100.0%) |
| Total | 44 (57.1%) | 33 (42.9%) |
Education in Custer
School Enrollment in Custer
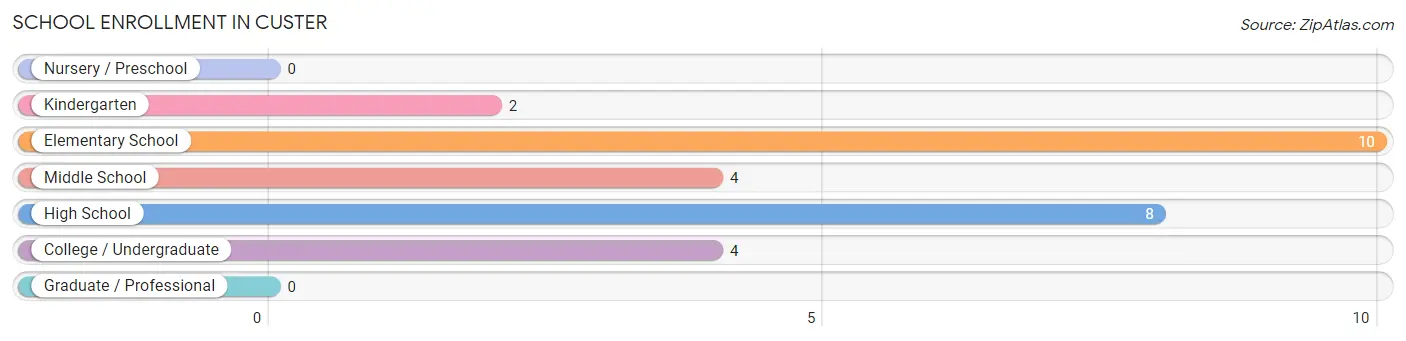
The most common levels of schooling among the 28 students in Custer are elementary school (10 | 35.7%), high school (8 | 28.6%), and middle school (4 | 14.3%).
| School Level | # Students | % Students |
| Nursery / Preschool | 0 | 0.0% |
| Kindergarten | 2 | 7.1% |
| Elementary School | 10 | 35.7% |
| Middle School | 4 | 14.3% |
| High School | 8 | 28.6% |
| College / Undergraduate | 4 | 14.3% |
| Graduate / Professional | 0 | 0.0% |
| Total | 28 | 100.0% |
School Enrollment by Age by Funding Source in Custer
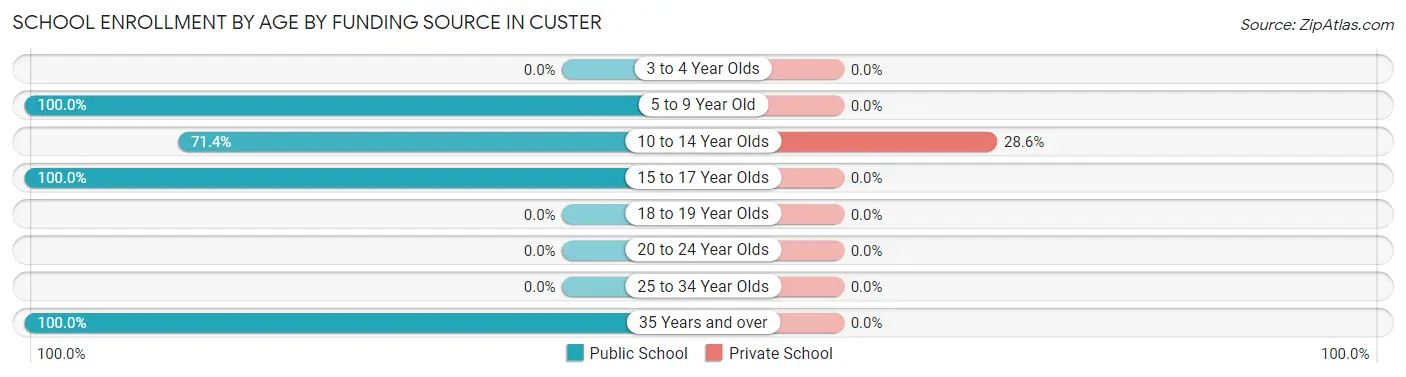
Out of a total of 28 students who are enrolled in schools in Custer, 2 (7.1%) attend a private institution, while the remaining 26 (92.9%) are enrolled in public schools. The age group of 10 to 14 year olds has the highest likelihood of being enrolled in private schools, with 2 (28.6% in the age bracket) enrolled. Conversely, the age group of 5 to 9 year old has the lowest likelihood of being enrolled in a private school, with 9 (100.0% in the age bracket) attending a public institution.
| Age Bracket | Public School | Private School |
| 3 to 4 Year Olds | 0 (0.0%) | 0 (0.0%) |
| 5 to 9 Year Old | 9 (100.0%) | 0 (0.0%) |
| 10 to 14 Year Olds | 5 (71.4%) | 2 (28.6%) |
| 15 to 17 Year Olds | 8 (100.0%) | 0 (0.0%) |
| 18 to 19 Year Olds | 0 (0.0%) | 0 (0.0%) |
| 20 to 24 Year Olds | 0 (0.0%) | 0 (0.0%) |
| 25 to 34 Year Olds | 0 (0.0%) | 0 (0.0%) |
| 35 Years and over | 4 (100.0%) | 0 (0.0%) |
| Total | 26 (92.9%) | 2 (7.1%) |
Educational Attainment by Field of Study in Custer
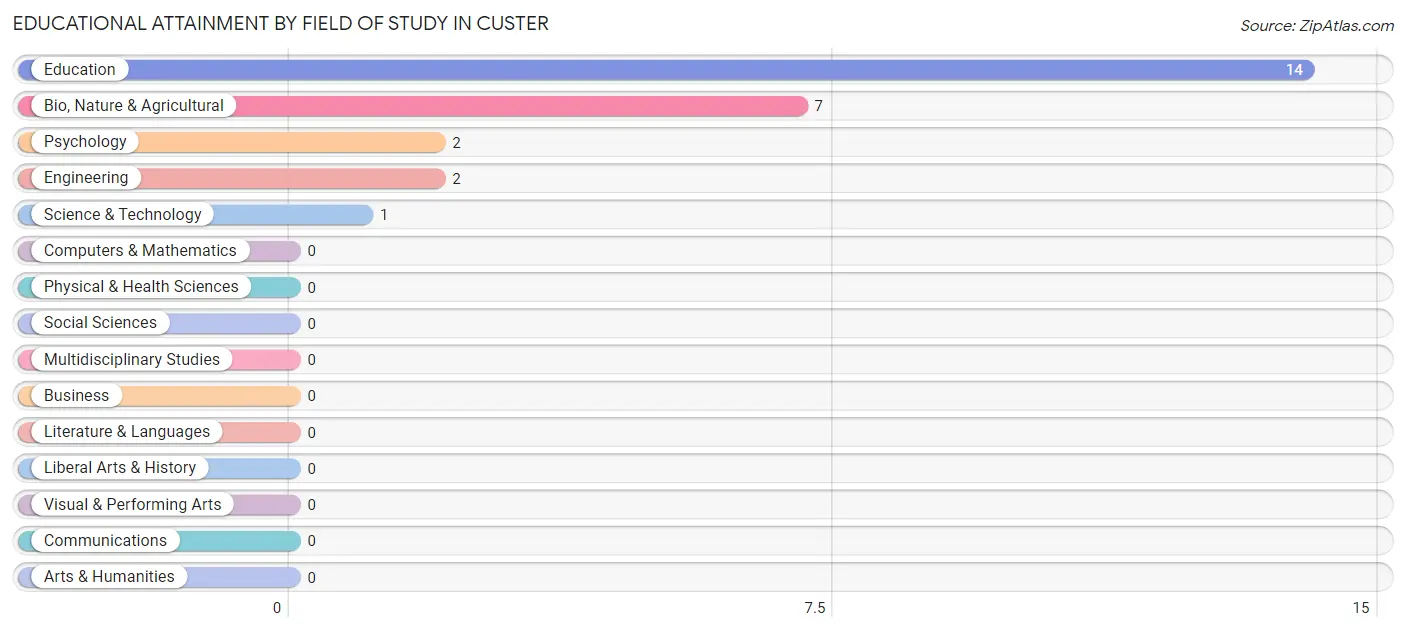
Education (14 | 53.8%), bio, nature & agricultural (7 | 26.9%), psychology (2 | 7.7%), engineering (2 | 7.7%), and science & technology (1 | 3.8%) are the most common fields of study among 26 individuals in Custer who have obtained a bachelor's degree or higher.
| Field of Study | # Graduates | % Graduates |
| Computers & Mathematics | 0 | 0.0% |
| Bio, Nature & Agricultural | 7 | 26.9% |
| Physical & Health Sciences | 0 | 0.0% |
| Psychology | 2 | 7.7% |
| Social Sciences | 0 | 0.0% |
| Engineering | 2 | 7.7% |
| Multidisciplinary Studies | 0 | 0.0% |
| Science & Technology | 1 | 3.8% |
| Business | 0 | 0.0% |
| Education | 14 | 53.8% |
| Literature & Languages | 0 | 0.0% |
| Liberal Arts & History | 0 | 0.0% |
| Visual & Performing Arts | 0 | 0.0% |
| Communications | 0 | 0.0% |
| Arts & Humanities | 0 | 0.0% |
| Total | 26 | 100.0% |
Transportation & Commute in Custer
Vehicle Availability by Sex in Custer
The most prevalent vehicle ownership categories in Custer are males with 2 vehicles (20, accounting for 45.5%) and females with 2 vehicles (21, making up 60.6%).
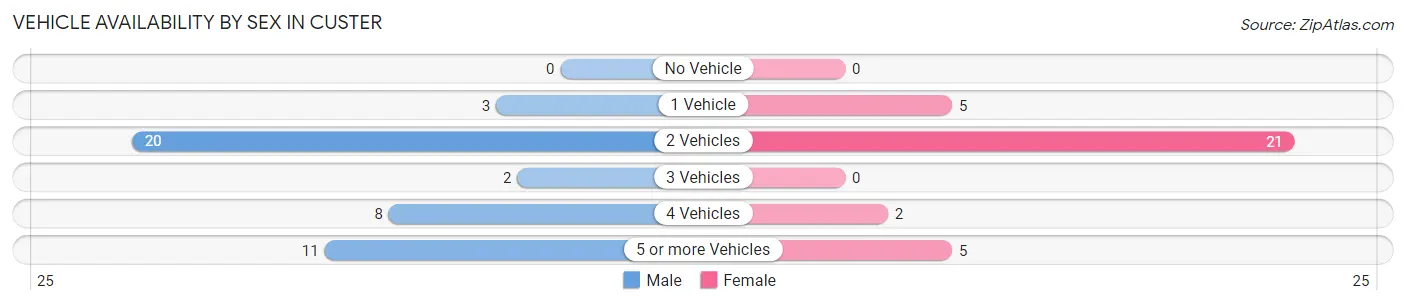
| Vehicles Available | Male | Female |
| No Vehicle | 0 (0.0%) | 0 (0.0%) |
| 1 Vehicle | 3 (6.8%) | 5 (15.1%) |
| 2 Vehicles | 20 (45.5%) | 21 (63.6%) |
| 3 Vehicles | 2 (4.5%) | 0 (0.0%) |
| 4 Vehicles | 8 (18.2%) | 2 (6.1%) |
| 5 or more Vehicles | 11 (25.0%) | 5 (15.1%) |
| Total | 44 (100.0%) | 33 (100.0%) |
Commute Time in Custer
The most frequently occuring commute durations in Custer are 30 to 34 minutes (34 commuters, 44.7%), 45 to 59 minutes (16 commuters, 21.0%), and less than 5 minutes (9 commuters, 11.8%).
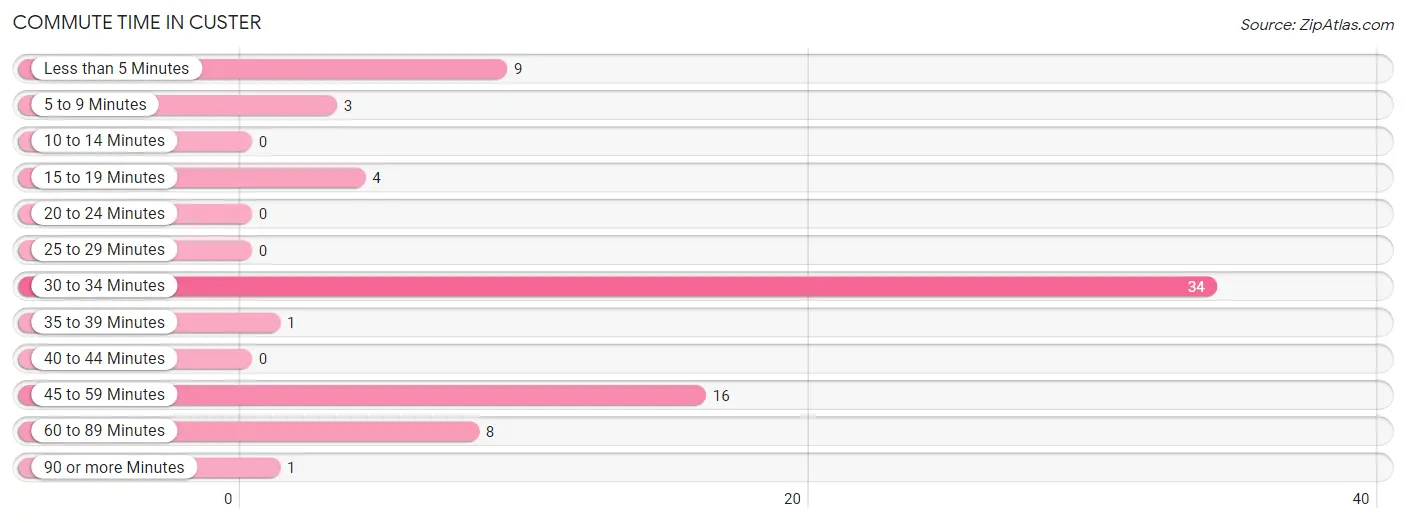
| Commute Time | # Commuters | % Commuters |
| Less than 5 Minutes | 9 | 11.8% |
| 5 to 9 Minutes | 3 | 4.0% |
| 10 to 14 Minutes | 0 | 0.0% |
| 15 to 19 Minutes | 4 | 5.3% |
| 20 to 24 Minutes | 0 | 0.0% |
| 25 to 29 Minutes | 0 | 0.0% |
| 30 to 34 Minutes | 34 | 44.7% |
| 35 to 39 Minutes | 1 | 1.3% |
| 40 to 44 Minutes | 0 | 0.0% |
| 45 to 59 Minutes | 16 | 21.0% |
| 60 to 89 Minutes | 8 | 10.5% |
| 90 or more Minutes | 1 | 1.3% |
Commute Time by Sex in Custer
The most common commute times in Custer are 45 to 59 minutes (16 commuters, 36.4%) for males and 30 to 34 minutes (24 commuters, 75.0%) for females.
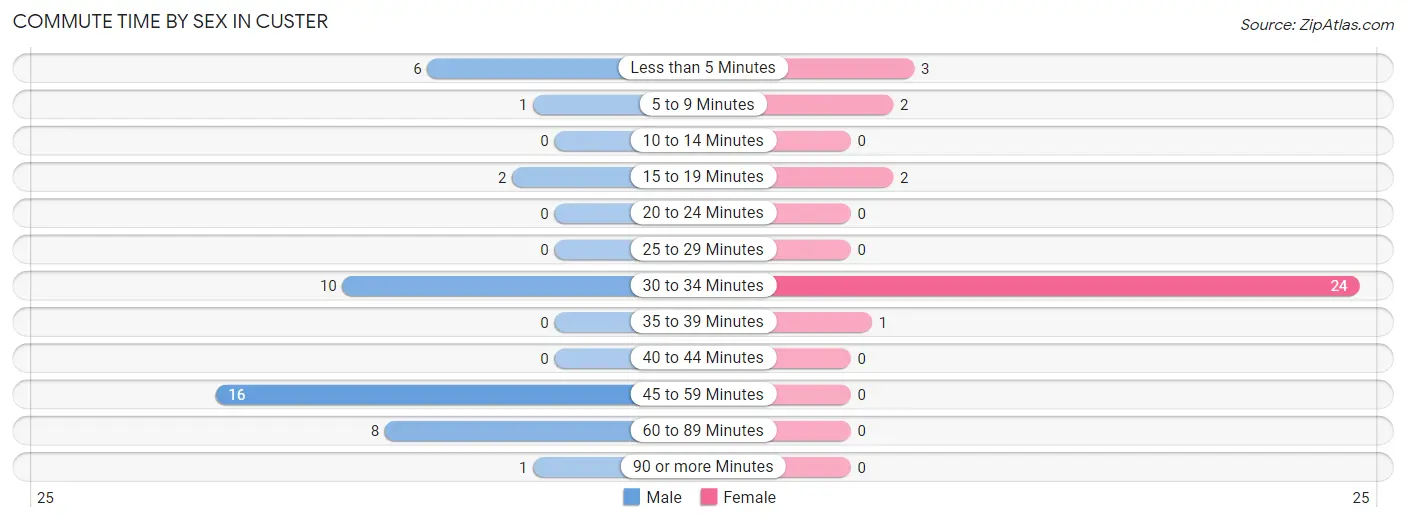
| Commute Time | Male | Female |
| Less than 5 Minutes | 6 (13.6%) | 3 (9.4%) |
| 5 to 9 Minutes | 1 (2.3%) | 2 (6.2%) |
| 10 to 14 Minutes | 0 (0.0%) | 0 (0.0%) |
| 15 to 19 Minutes | 2 (4.5%) | 2 (6.2%) |
| 20 to 24 Minutes | 0 (0.0%) | 0 (0.0%) |
| 25 to 29 Minutes | 0 (0.0%) | 0 (0.0%) |
| 30 to 34 Minutes | 10 (22.7%) | 24 (75.0%) |
| 35 to 39 Minutes | 0 (0.0%) | 1 (3.1%) |
| 40 to 44 Minutes | 0 (0.0%) | 0 (0.0%) |
| 45 to 59 Minutes | 16 (36.4%) | 0 (0.0%) |
| 60 to 89 Minutes | 8 (18.2%) | 0 (0.0%) |
| 90 or more Minutes | 1 (2.3%) | 0 (0.0%) |
Time of Departure to Work by Sex in Custer
The most frequent times of departure to work in Custer are 6:00 AM to 6:29 AM (23, 52.3%) for males and 4:00 PM to 11:59 PM (18, 56.2%) for females.
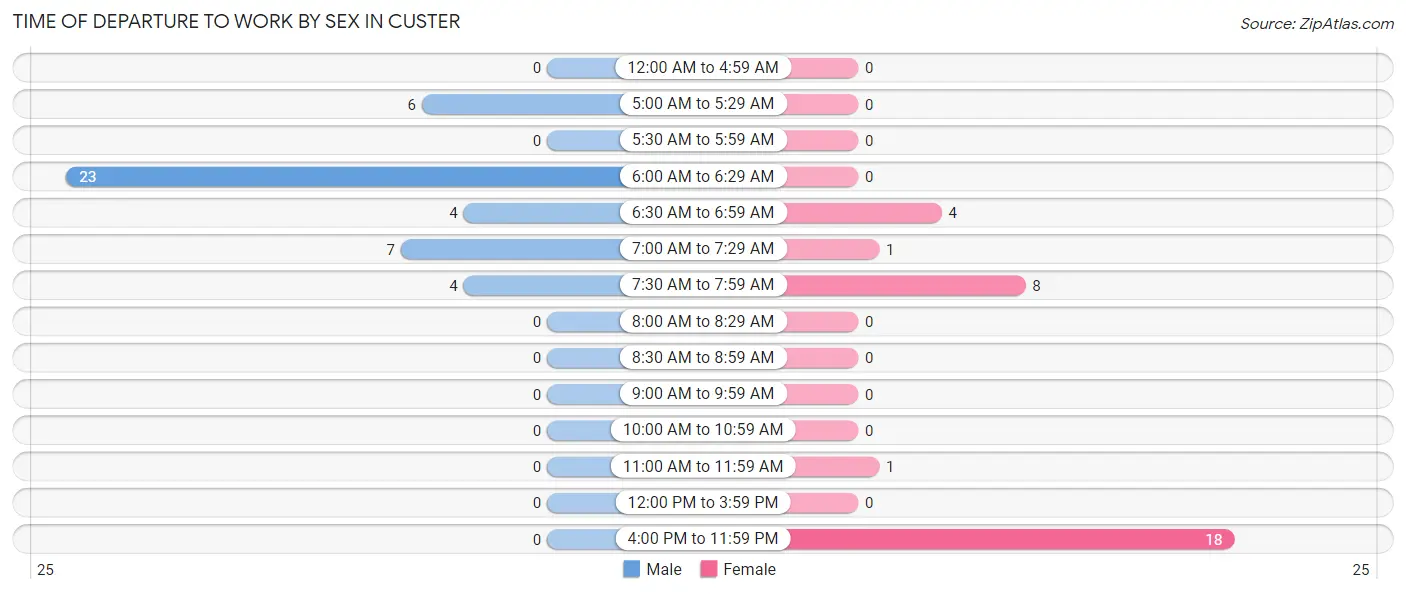
| Time of Departure | Male | Female |
| 12:00 AM to 4:59 AM | 0 (0.0%) | 0 (0.0%) |
| 5:00 AM to 5:29 AM | 6 (13.6%) | 0 (0.0%) |
| 5:30 AM to 5:59 AM | 0 (0.0%) | 0 (0.0%) |
| 6:00 AM to 6:29 AM | 23 (52.3%) | 0 (0.0%) |
| 6:30 AM to 6:59 AM | 4 (9.1%) | 4 (12.5%) |
| 7:00 AM to 7:29 AM | 7 (15.9%) | 1 (3.1%) |
| 7:30 AM to 7:59 AM | 4 (9.1%) | 8 (25.0%) |
| 8:00 AM to 8:29 AM | 0 (0.0%) | 0 (0.0%) |
| 8:30 AM to 8:59 AM | 0 (0.0%) | 0 (0.0%) |
| 9:00 AM to 9:59 AM | 0 (0.0%) | 0 (0.0%) |
| 10:00 AM to 10:59 AM | 0 (0.0%) | 0 (0.0%) |
| 11:00 AM to 11:59 AM | 0 (0.0%) | 1 (3.1%) |
| 12:00 PM to 3:59 PM | 0 (0.0%) | 0 (0.0%) |
| 4:00 PM to 11:59 PM | 0 (0.0%) | 18 (56.2%) |
| Total | 44 (100.0%) | 32 (100.0%) |
Housing Occupancy in Custer
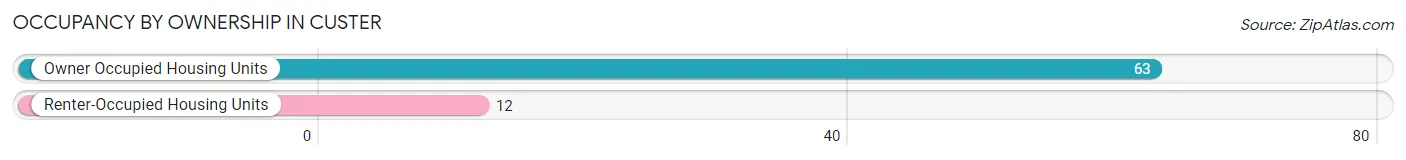
Occupancy by Ownership in Custer
Of the total 75 dwellings in Custer, owner-occupied units account for 63 (84.0%), while renter-occupied units make up 12 (16.0%).
| Occupancy | # Housing Units | % Housing Units |
| Owner Occupied Housing Units | 63 | 84.0% |
| Renter-Occupied Housing Units | 12 | 16.0% |
| Total Occupied Housing Units | 75 | 100.0% |
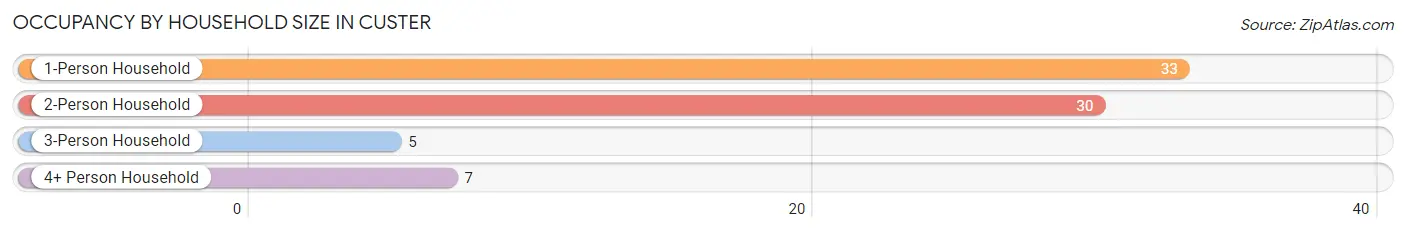
Occupancy by Household Size in Custer
| Household Size | # Housing Units | % Housing Units |
| 1-Person Household | 33 | 44.0% |
| 2-Person Household | 30 | 40.0% |
| 3-Person Household | 5 | 6.7% |
| 4+ Person Household | 7 | 9.3% |
| Total Housing Units | 75 | 100.0% |
Occupancy by Ownership by Household Size in Custer
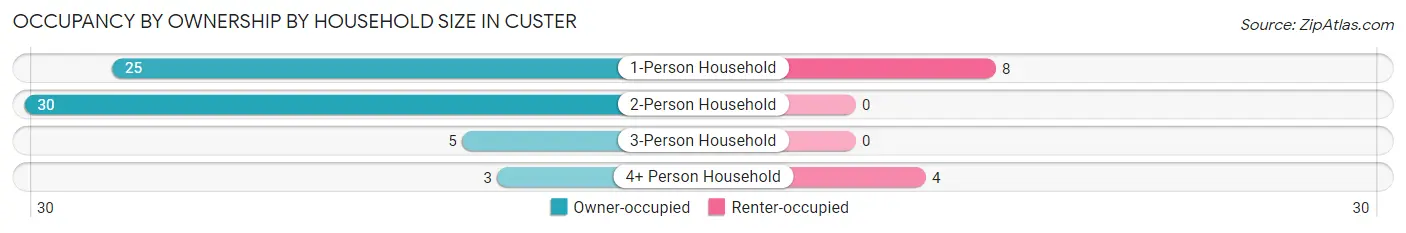
| Household Size | Owner-occupied | Renter-occupied |
| 1-Person Household | 25 (75.8%) | 8 (24.2%) |
| 2-Person Household | 30 (100.0%) | 0 (0.0%) |
| 3-Person Household | 5 (100.0%) | 0 (0.0%) |
| 4+ Person Household | 3 (42.9%) | 4 (57.1%) |
| Total Housing Units | 63 (84.0%) | 12 (16.0%) |
Occupancy by Educational Attainment in Custer
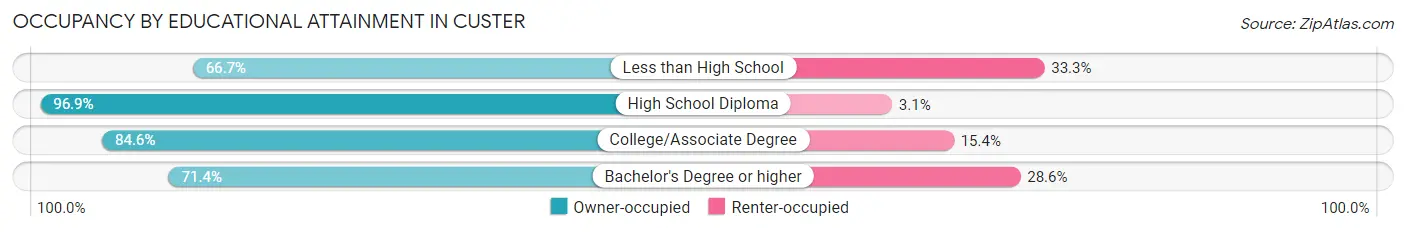
| Household Size | Owner-occupied | Renter-occupied |
| Less than High School | 6 (66.7%) | 3 (33.3%) |
| High School Diploma | 31 (96.9%) | 1 (3.1%) |
| College/Associate Degree | 11 (84.6%) | 2 (15.4%) |
| Bachelor's Degree or higher | 15 (71.4%) | 6 (28.6%) |
Occupancy by Age of Householder in Custer
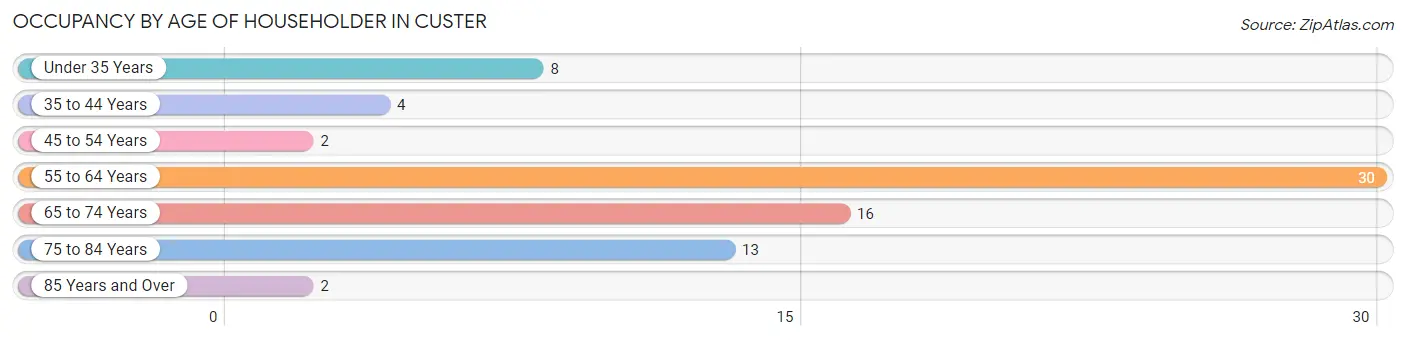
| Age Bracket | # Households | % Households |
| Under 35 Years | 8 | 10.7% |
| 35 to 44 Years | 4 | 5.3% |
| 45 to 54 Years | 2 | 2.7% |
| 55 to 64 Years | 30 | 40.0% |
| 65 to 74 Years | 16 | 21.3% |
| 75 to 84 Years | 13 | 17.3% |
| 85 Years and Over | 2 | 2.7% |
| Total | 75 | 100.0% |
Housing Finances in Custer
Median Income by Occupancy in Custer
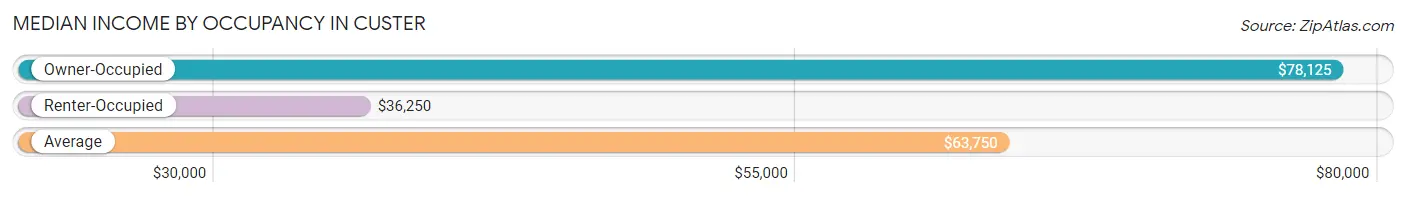
| Occupancy Type | # Households | Median Income |
| Owner-Occupied | 63 (84.0%) | $78,125 |
| Renter-Occupied | 12 (16.0%) | $36,250 |
| Average | 75 (100.0%) | $63,750 |
Occupancy by Householder Income Bracket in Custer
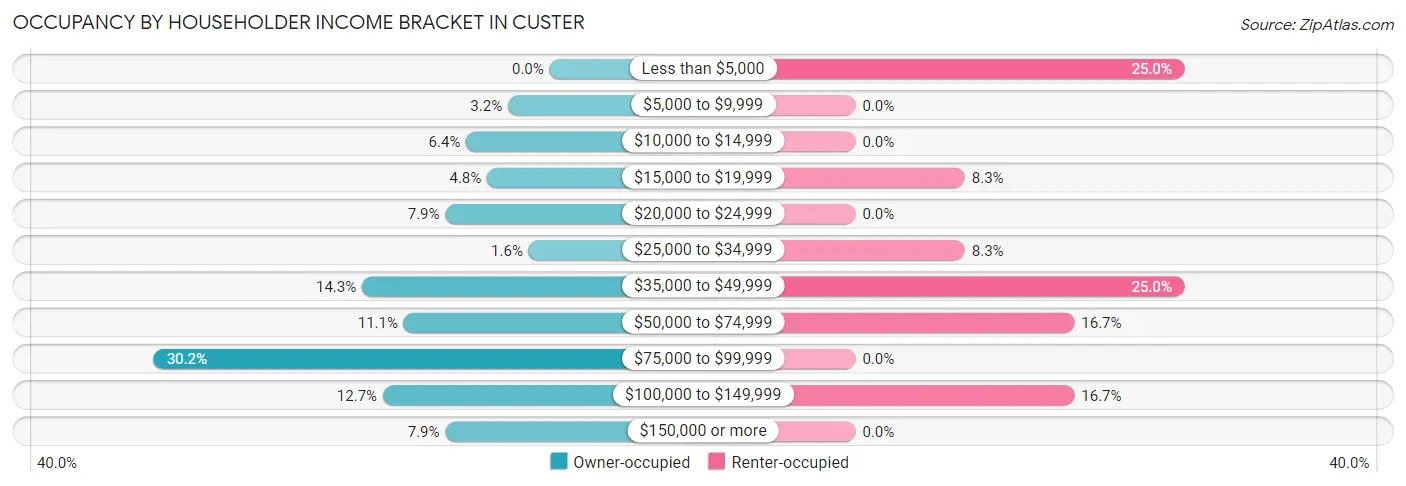
| Income Bracket | Owner-occupied | Renter-occupied |
| Less than $5,000 | 0 (0.0%) | 3 (25.0%) |
| $5,000 to $9,999 | 2 (3.2%) | 0 (0.0%) |
| $10,000 to $14,999 | 4 (6.4%) | 0 (0.0%) |
| $15,000 to $19,999 | 3 (4.8%) | 1 (8.3%) |
| $20,000 to $24,999 | 5 (7.9%) | 0 (0.0%) |
| $25,000 to $34,999 | 1 (1.6%) | 1 (8.3%) |
| $35,000 to $49,999 | 9 (14.3%) | 3 (25.0%) |
| $50,000 to $74,999 | 7 (11.1%) | 2 (16.7%) |
| $75,000 to $99,999 | 19 (30.2%) | 0 (0.0%) |
| $100,000 to $149,999 | 8 (12.7%) | 2 (16.7%) |
| $150,000 or more | 5 (7.9%) | 0 (0.0%) |
| Total | 63 (100.0%) | 12 (100.0%) |
Monthly Housing Cost Tiers in Custer
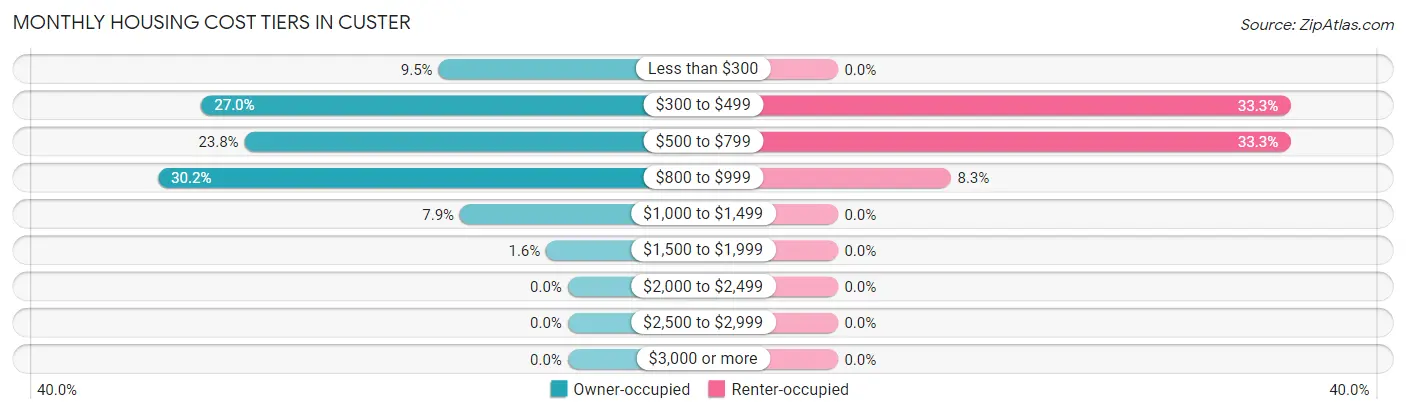
| Monthly Cost | Owner-occupied | Renter-occupied |
| Less than $300 | 6 (9.5%) | 0 (0.0%) |
| $300 to $499 | 17 (27.0%) | 4 (33.3%) |
| $500 to $799 | 15 (23.8%) | 4 (33.3%) |
| $800 to $999 | 19 (30.2%) | 1 (8.3%) |
| $1,000 to $1,499 | 5 (7.9%) | 0 (0.0%) |
| $1,500 to $1,999 | 1 (1.6%) | 0 (0.0%) |
| $2,000 to $2,499 | 0 (0.0%) | 0 (0.0%) |
| $2,500 to $2,999 | 0 (0.0%) | 0 (0.0%) |
| $3,000 or more | 0 (0.0%) | 0 (0.0%) |
| Total | 63 (100.0%) | 12 (100.0%) |
Physical Housing Characteristics in Custer
Housing Structures in Custer
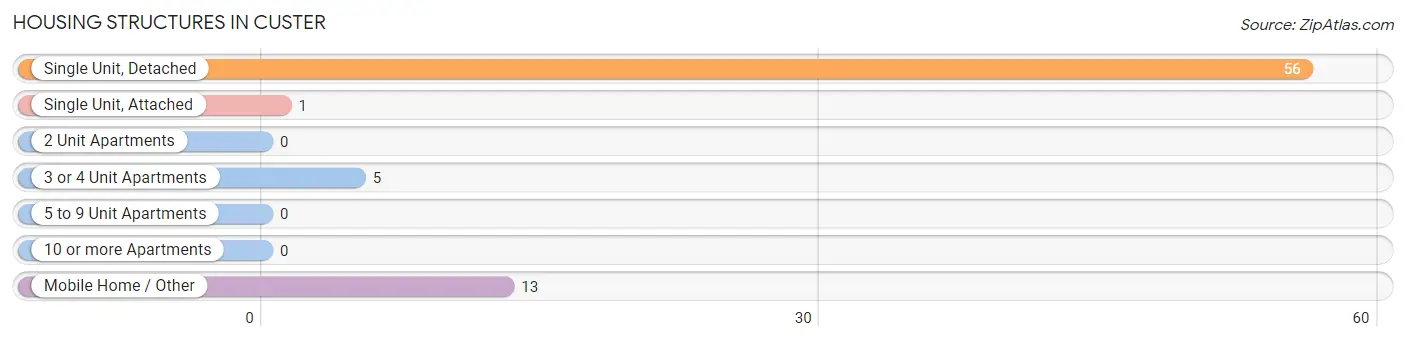
| Structure Type | # Housing Units | % Housing Units |
| Single Unit, Detached | 56 | 74.7% |
| Single Unit, Attached | 1 | 1.3% |
| 2 Unit Apartments | 0 | 0.0% |
| 3 or 4 Unit Apartments | 5 | 6.7% |
| 5 to 9 Unit Apartments | 0 | 0.0% |
| 10 or more Apartments | 0 | 0.0% |
| Mobile Home / Other | 13 | 17.3% |
| Total | 75 | 100.0% |
Housing Structures by Occupancy in Custer
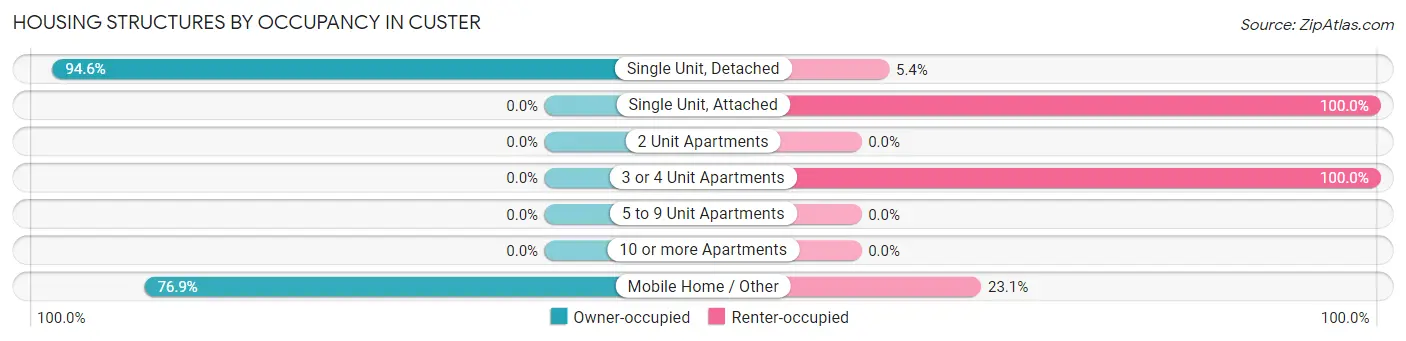
| Structure Type | Owner-occupied | Renter-occupied |
| Single Unit, Detached | 53 (94.6%) | 3 (5.4%) |
| Single Unit, Attached | 0 (0.0%) | 1 (100.0%) |
| 2 Unit Apartments | 0 (0.0%) | 0 (0.0%) |
| 3 or 4 Unit Apartments | 0 (0.0%) | 5 (100.0%) |
| 5 to 9 Unit Apartments | 0 (0.0%) | 0 (0.0%) |
| 10 or more Apartments | 0 (0.0%) | 0 (0.0%) |
| Mobile Home / Other | 10 (76.9%) | 3 (23.1%) |
| Total | 63 (84.0%) | 12 (16.0%) |
Housing Structures by Number of Rooms in Custer
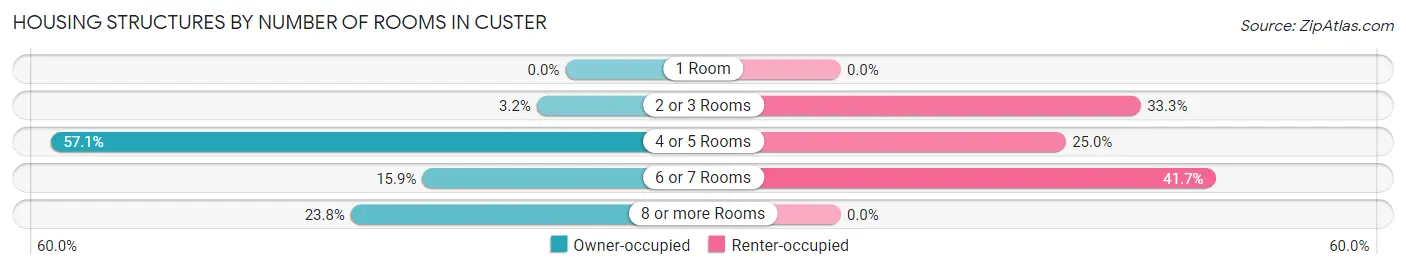
| Number of Rooms | Owner-occupied | Renter-occupied |
| 1 Room | 0 (0.0%) | 0 (0.0%) |
| 2 or 3 Rooms | 2 (3.2%) | 4 (33.3%) |
| 4 or 5 Rooms | 36 (57.1%) | 3 (25.0%) |
| 6 or 7 Rooms | 10 (15.9%) | 5 (41.7%) |
| 8 or more Rooms | 15 (23.8%) | 0 (0.0%) |
| Total | 63 (100.0%) | 12 (100.0%) |
Housing Structure by Heating Type in Custer
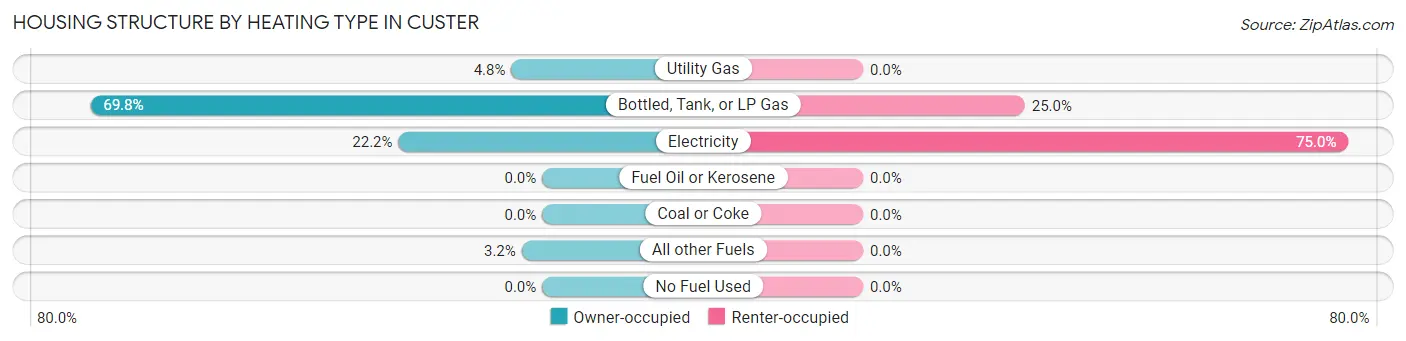
| Heating Type | Owner-occupied | Renter-occupied |
| Utility Gas | 3 (4.8%) | 0 (0.0%) |
| Bottled, Tank, or LP Gas | 44 (69.8%) | 3 (25.0%) |
| Electricity | 14 (22.2%) | 9 (75.0%) |
| Fuel Oil or Kerosene | 0 (0.0%) | 0 (0.0%) |
| Coal or Coke | 0 (0.0%) | 0 (0.0%) |
| All other Fuels | 2 (3.2%) | 0 (0.0%) |
| No Fuel Used | 0 (0.0%) | 0 (0.0%) |
| Total | 63 (100.0%) | 12 (100.0%) |
Household Vehicle Usage in Custer
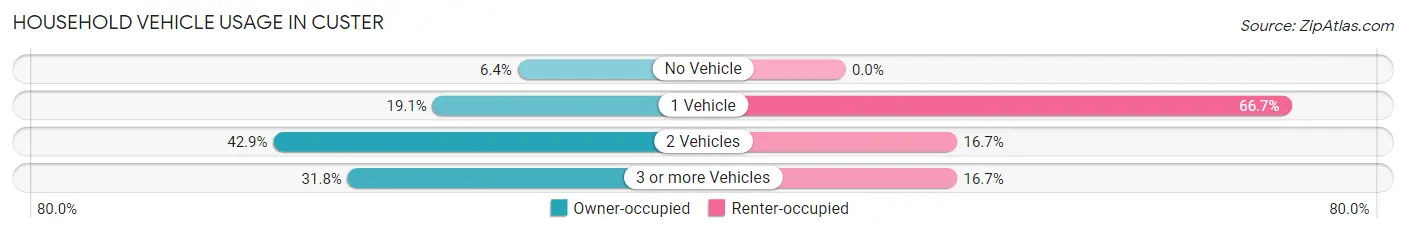
| Vehicles per Household | Owner-occupied | Renter-occupied |
| No Vehicle | 4 (6.4%) | 0 (0.0%) |
| 1 Vehicle | 12 (19.1%) | 8 (66.7%) |
| 2 Vehicles | 27 (42.9%) | 2 (16.7%) |
| 3 or more Vehicles | 20 (31.8%) | 2 (16.7%) |
| Total | 63 (100.0%) | 12 (100.0%) |
Real Estate & Mortgages in Custer
Real Estate and Mortgage Overview in Custer
| Characteristic | Without Mortgage | With Mortgage |
| Housing Units | 37 | 26 |
| Median Property Value | $134,400 | $114,700 |
| Median Household Income | $60,625 | $0 |
| Monthly Housing Costs | $468 | $0 |
| Real Estate Taxes | $1,295 | $1 |
Property Value by Mortgage Status in Custer
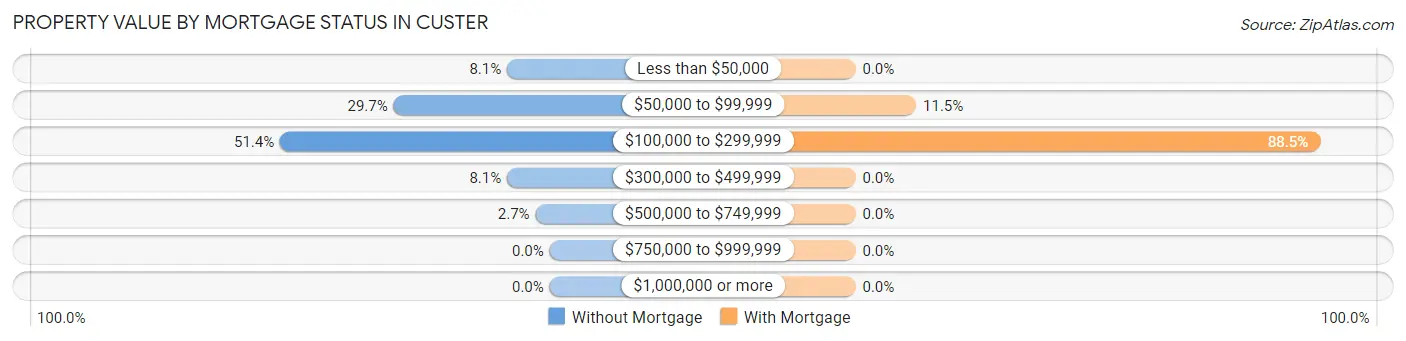
| Property Value | Without Mortgage | With Mortgage |
| Less than $50,000 | 3 (8.1%) | 0 (0.0%) |
| $50,000 to $99,999 | 11 (29.7%) | 3 (11.5%) |
| $100,000 to $299,999 | 19 (51.3%) | 23 (88.5%) |
| $300,000 to $499,999 | 3 (8.1%) | 0 (0.0%) |
| $500,000 to $749,999 | 1 (2.7%) | 0 (0.0%) |
| $750,000 to $999,999 | 0 (0.0%) | 0 (0.0%) |
| $1,000,000 or more | 0 (0.0%) | 0 (0.0%) |
| Total | 37 (100.0%) | 26 (100.0%) |
Household Income by Mortgage Status in Custer
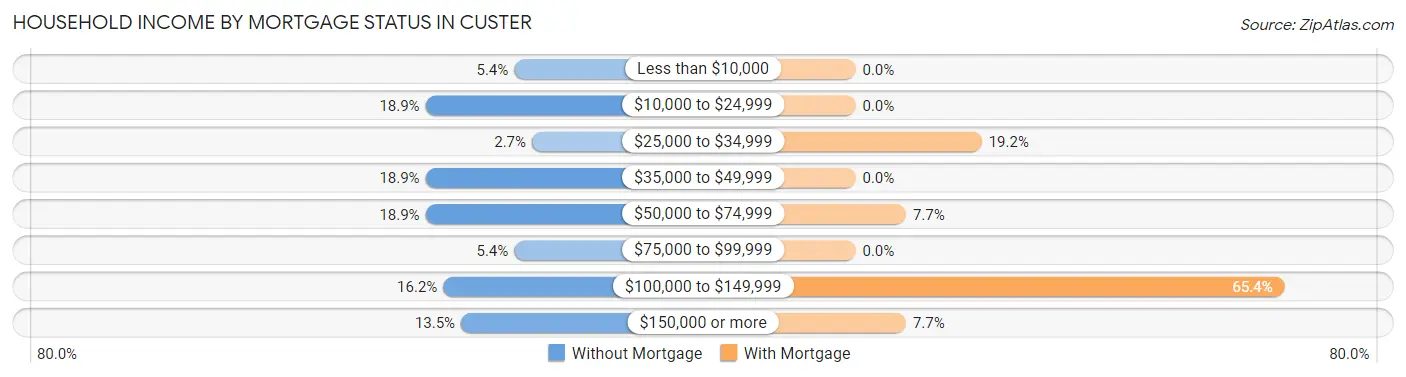
| Household Income | Without Mortgage | With Mortgage |
| Less than $10,000 | 2 (5.4%) | 0 (0.0%) |
| $10,000 to $24,999 | 7 (18.9%) | 0 (0.0%) |
| $25,000 to $34,999 | 1 (2.7%) | 5 (19.2%) |
| $35,000 to $49,999 | 7 (18.9%) | 0 (0.0%) |
| $50,000 to $74,999 | 7 (18.9%) | 2 (7.7%) |
| $75,000 to $99,999 | 2 (5.4%) | 0 (0.0%) |
| $100,000 to $149,999 | 6 (16.2%) | 17 (65.4%) |
| $150,000 or more | 5 (13.5%) | 2 (7.7%) |
| Total | 37 (100.0%) | 26 (100.0%) |
Property Value to Household Income Ratio in Custer
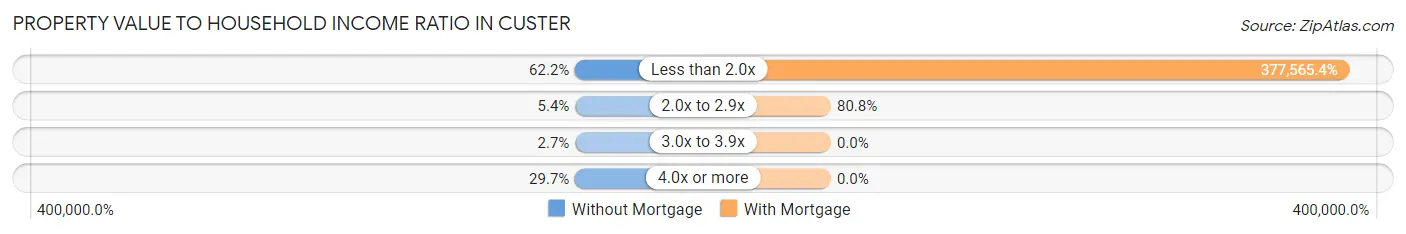
| Value-to-Income Ratio | Without Mortgage | With Mortgage |
| Less than 2.0x | 23 (62.2%) | 98,167 (377,565.4%) |
| 2.0x to 2.9x | 2 (5.4%) | 21 (80.8%) |
| 3.0x to 3.9x | 1 (2.7%) | 0 (0.0%) |
| 4.0x or more | 11 (29.7%) | 0 (0.0%) |
| Total | 37 (100.0%) | 26 (100.0%) |
Real Estate Taxes by Mortgage Status in Custer
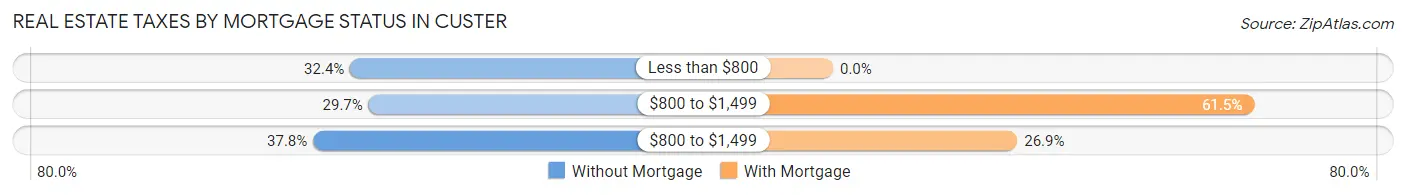
| Property Taxes | Without Mortgage | With Mortgage |
| Less than $800 | 12 (32.4%) | 0 (0.0%) |
| $800 to $1,499 | 11 (29.7%) | 16 (61.5%) |
| $800 to $1,499 | 14 (37.8%) | 7 (26.9%) |
| Total | 37 (100.0%) | 26 (100.0%) |
Health & Disability in Custer
Health Insurance Coverage by Age in Custer
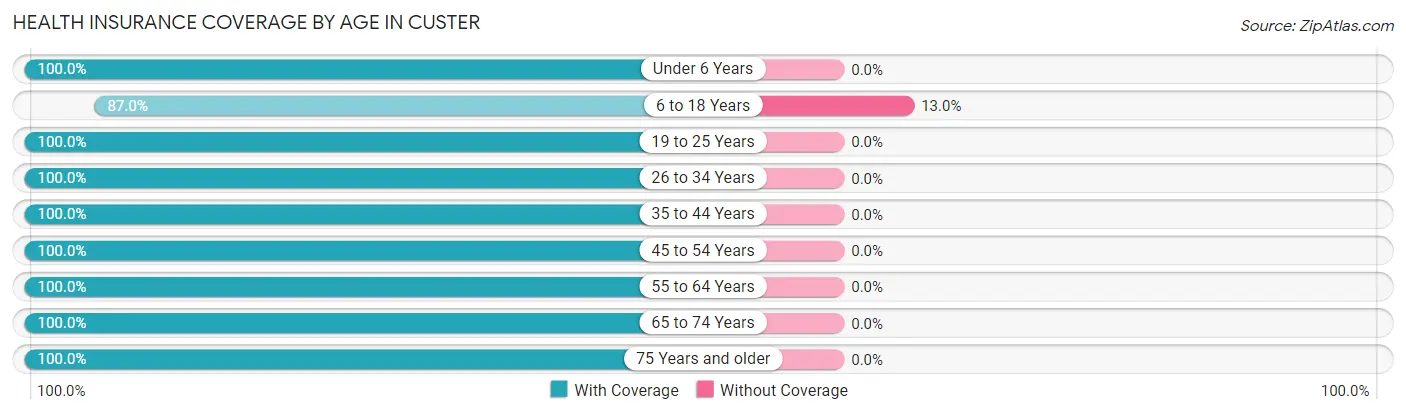
| Age Bracket | With Coverage | Without Coverage |
| Under 6 Years | 4 (100.0%) | 0 (0.0%) |
| 6 to 18 Years | 20 (87.0%) | 3 (13.0%) |
| 19 to 25 Years | 3 (100.0%) | 0 (0.0%) |
| 26 to 34 Years | 10 (100.0%) | 0 (0.0%) |
| 35 to 44 Years | 8 (100.0%) | 0 (0.0%) |
| 45 to 54 Years | 3 (100.0%) | 0 (0.0%) |
| 55 to 64 Years | 58 (100.0%) | 0 (0.0%) |
| 65 to 74 Years | 21 (100.0%) | 0 (0.0%) |
| 75 Years and older | 16 (100.0%) | 0 (0.0%) |
| Total | 143 (98.0%) | 3 (2.1%) |
Health Insurance Coverage by Citizenship Status in Custer
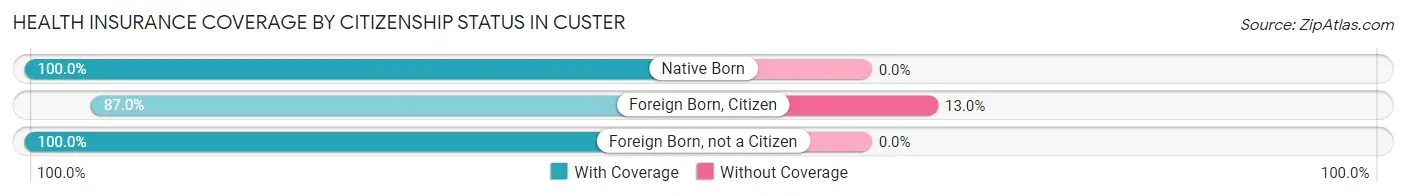
| Citizenship Status | With Coverage | Without Coverage |
| Native Born | 4 (100.0%) | 0 (0.0%) |
| Foreign Born, Citizen | 20 (87.0%) | 3 (13.0%) |
| Foreign Born, not a Citizen | 3 (100.0%) | 0 (0.0%) |
Health Insurance Coverage by Household Income in Custer
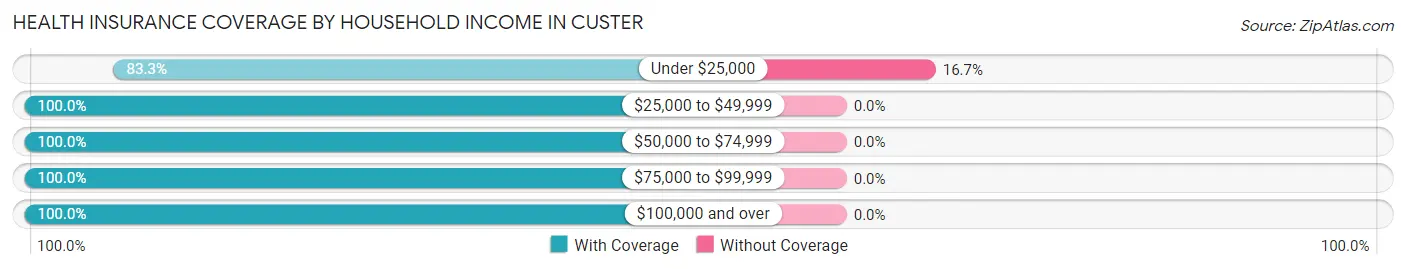
| Household Income | With Coverage | Without Coverage |
| Under $25,000 | 15 (83.3%) | 3 (16.7%) |
| $25,000 to $49,999 | 23 (100.0%) | 0 (0.0%) |
| $50,000 to $74,999 | 19 (100.0%) | 0 (0.0%) |
| $75,000 to $99,999 | 38 (100.0%) | 0 (0.0%) |
| $100,000 and over | 48 (100.0%) | 0 (0.0%) |
Public vs Private Health Insurance Coverage by Age in Custer
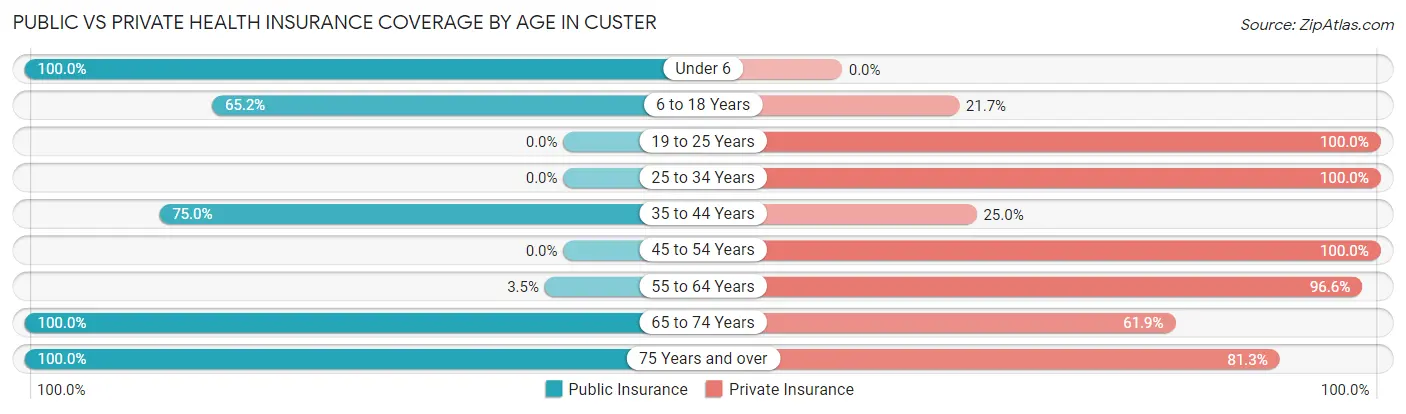
| Age Bracket | Public Insurance | Private Insurance |
| Under 6 | 4 (100.0%) | 0 (0.0%) |
| 6 to 18 Years | 15 (65.2%) | 5 (21.7%) |
| 19 to 25 Years | 0 (0.0%) | 3 (100.0%) |
| 25 to 34 Years | 0 (0.0%) | 10 (100.0%) |
| 35 to 44 Years | 6 (75.0%) | 2 (25.0%) |
| 45 to 54 Years | 0 (0.0%) | 3 (100.0%) |
| 55 to 64 Years | 2 (3.5%) | 56 (96.6%) |
| 65 to 74 Years | 21 (100.0%) | 13 (61.9%) |
| 75 Years and over | 16 (100.0%) | 13 (81.2%) |
| Total | 64 (43.8%) | 105 (71.9%) |
Disability Status by Sex by Age in Custer
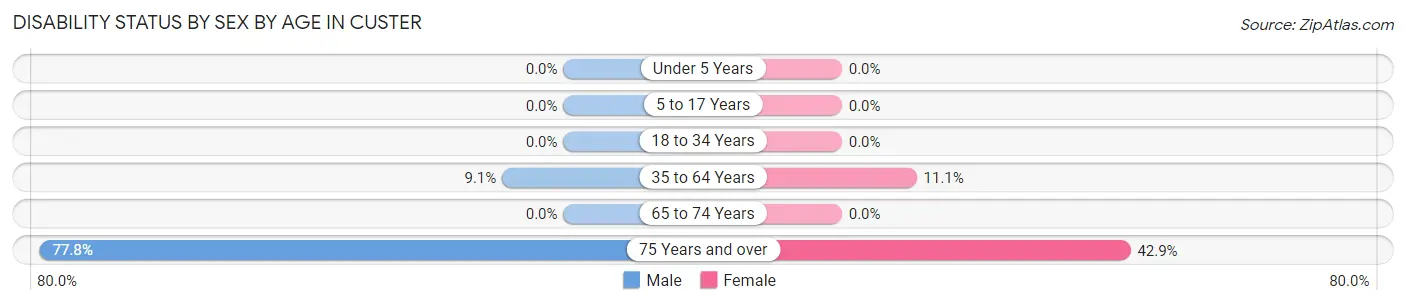
| Age Bracket | Male | Female |
| Under 5 Years | 0 (0.0%) | 0 (0.0%) |
| 5 to 17 Years | 0 (0.0%) | 0 (0.0%) |
| 18 to 34 Years | 0 (0.0%) | 0 (0.0%) |
| 35 to 64 Years | 3 (9.1%) | 4 (11.1%) |
| 65 to 74 Years | 0 (0.0%) | 0 (0.0%) |
| 75 Years and over | 7 (77.8%) | 3 (42.9%) |
Disability Class by Sex by Age in Custer
Disability Class: Hearing Difficulty
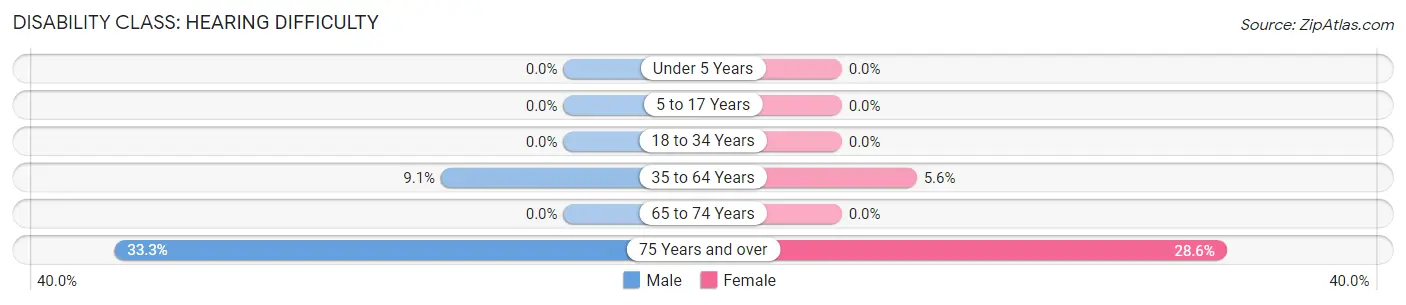
| Age Bracket | Male | Female |
| Under 5 Years | 0 (0.0%) | 0 (0.0%) |
| 5 to 17 Years | 0 (0.0%) | 0 (0.0%) |
| 18 to 34 Years | 0 (0.0%) | 0 (0.0%) |
| 35 to 64 Years | 3 (9.1%) | 2 (5.6%) |
| 65 to 74 Years | 0 (0.0%) | 0 (0.0%) |
| 75 Years and over | 3 (33.3%) | 2 (28.6%) |
Disability Class: Vision Difficulty
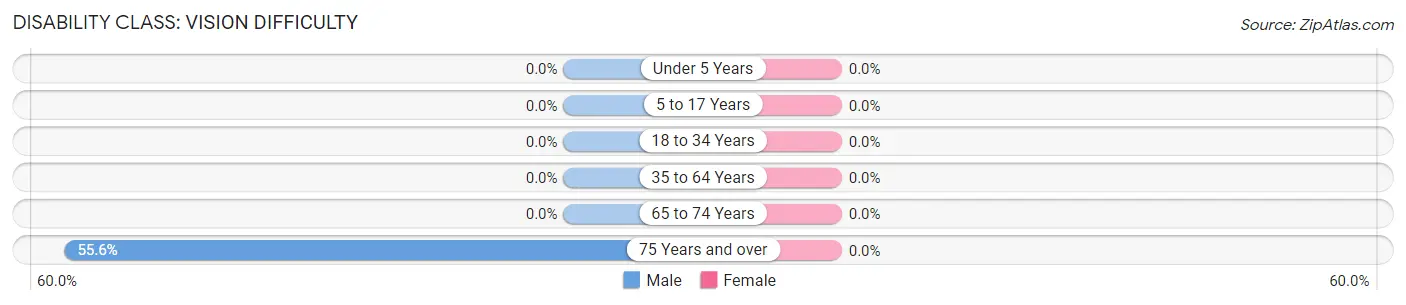
| Age Bracket | Male | Female |
| Under 5 Years | 0 (0.0%) | 0 (0.0%) |
| 5 to 17 Years | 0 (0.0%) | 0 (0.0%) |
| 18 to 34 Years | 0 (0.0%) | 0 (0.0%) |
| 35 to 64 Years | 0 (0.0%) | 0 (0.0%) |
| 65 to 74 Years | 0 (0.0%) | 0 (0.0%) |
| 75 Years and over | 5 (55.6%) | 0 (0.0%) |
Disability Class: Cognitive Difficulty
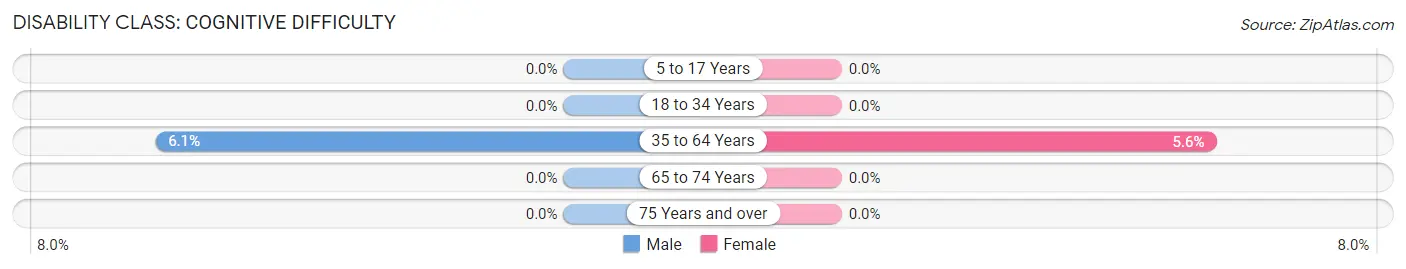
| Age Bracket | Male | Female |
| 5 to 17 Years | 0 (0.0%) | 0 (0.0%) |
| 18 to 34 Years | 0 (0.0%) | 0 (0.0%) |
| 35 to 64 Years | 2 (6.1%) | 2 (5.6%) |
| 65 to 74 Years | 0 (0.0%) | 0 (0.0%) |
| 75 Years and over | 0 (0.0%) | 0 (0.0%) |
Disability Class: Ambulatory Difficulty
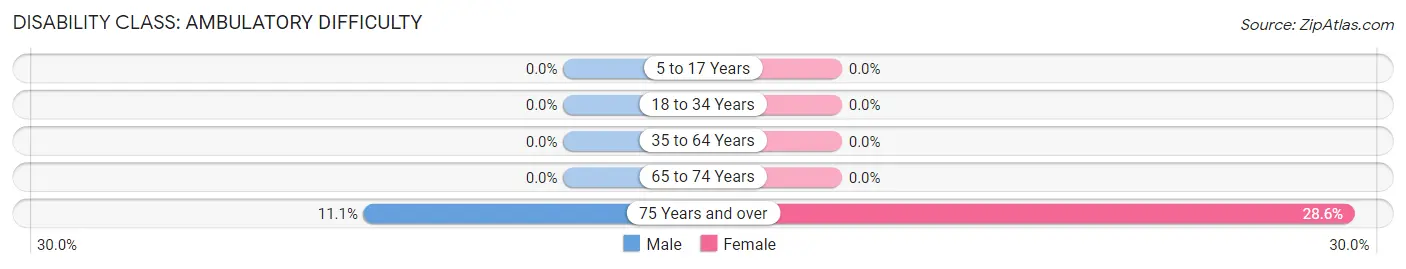
| Age Bracket | Male | Female |
| 5 to 17 Years | 0 (0.0%) | 0 (0.0%) |
| 18 to 34 Years | 0 (0.0%) | 0 (0.0%) |
| 35 to 64 Years | 0 (0.0%) | 0 (0.0%) |
| 65 to 74 Years | 0 (0.0%) | 0 (0.0%) |
| 75 Years and over | 1 (11.1%) | 2 (28.6%) |
Disability Class: Self-Care Difficulty
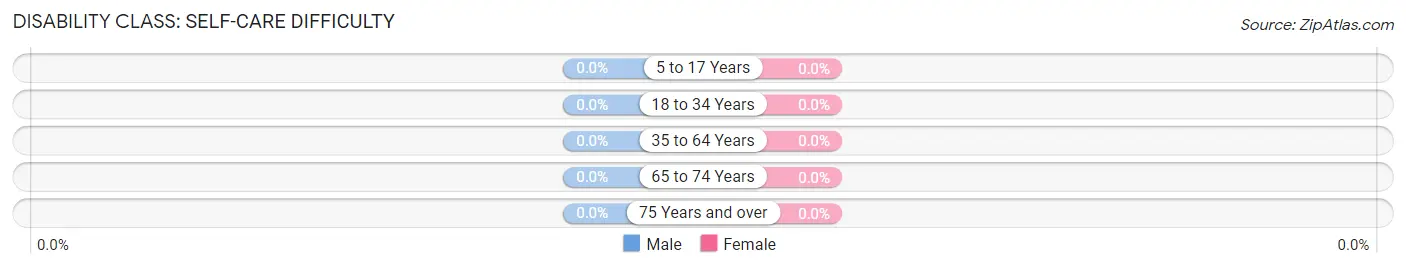
| Age Bracket | Male | Female |
| 5 to 17 Years | 0 (0.0%) | 0 (0.0%) |
| 18 to 34 Years | 0 (0.0%) | 0 (0.0%) |
| 35 to 64 Years | 0 (0.0%) | 0 (0.0%) |
| 65 to 74 Years | 0 (0.0%) | 0 (0.0%) |
| 75 Years and over | 0 (0.0%) | 0 (0.0%) |
Technology Access in Custer
Computing Device Access in Custer
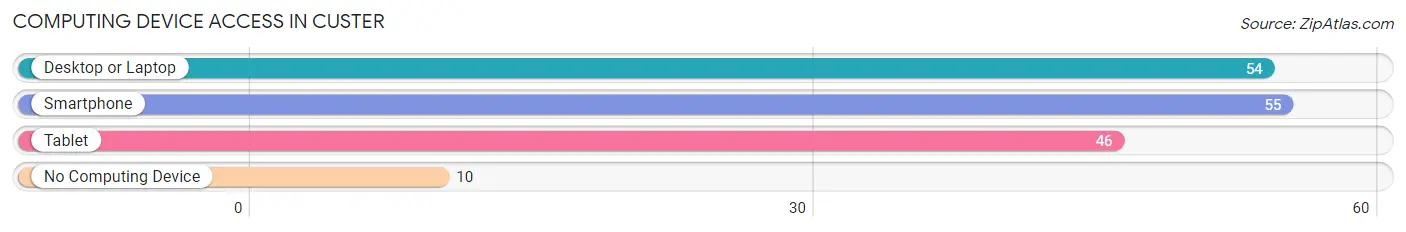
| Device Type | # Households | % Households |
| Desktop or Laptop | 54 | 72.0% |
| Smartphone | 55 | 73.3% |
| Tablet | 46 | 61.3% |
| No Computing Device | 10 | 13.3% |
| Total | 75 | 100.0% |
Internet Access in Custer
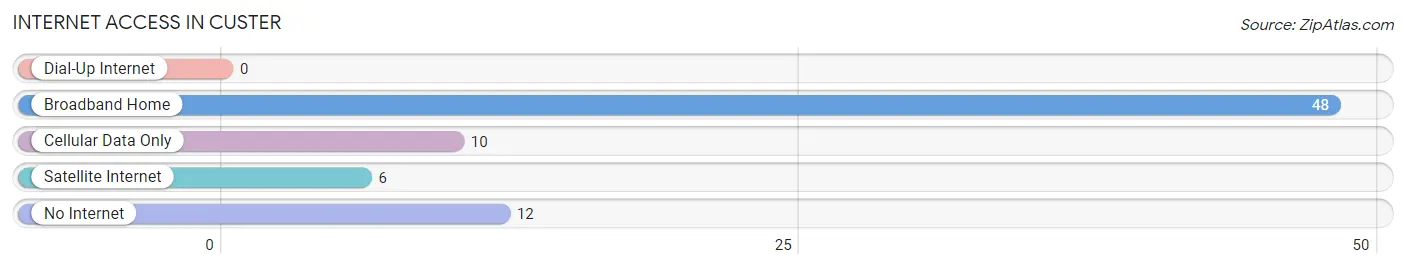
| Internet Type | # Households | % Households |
| Dial-Up Internet | 0 | 0.0% |
| Broadband Home | 48 | 64.0% |
| Cellular Data Only | 10 | 13.3% |
| Satellite Internet | 6 | 8.0% |
| No Internet | 12 | 16.0% |
| Total | 75 | 100.0% |
Custer Summary
Custer, Montana is a small town located in the south-central part of the state, in the foothills of the Rocky Mountains. It is situated in the heart of the Little Belt Mountains, and is surrounded by the Lewis and Clark National Forest. The town was founded in 1883 and named after General George Armstrong Custer, who was killed at the Battle of Little Big Horn in 1876.
Geography
Custer is located in Cascade County, Montana, and is situated in the foothills of the Rocky Mountains. The town is surrounded by the Lewis and Clark National Forest, and is located at an elevation of 4,890 feet. The town is located on the banks of the Missouri River, and is approximately 25 miles south of Great Falls. The town is located in a semi-arid climate, with hot summers and cold winters.
Economy
Custer’s economy is largely based on agriculture and tourism. The town is home to several small businesses, including a grocery store, a hardware store, and a few restaurants. The town is also home to a small airport, which serves as a hub for recreational and business travelers. The town is also home to a number of small farms, which produce a variety of crops, including wheat, barley, and hay.
Demographics
As of the 2010 census, Custer had a population of 1,072. The population is predominantly white, with a small percentage of Native Americans and African Americans. The median household income is $37,500, and the median age is 44. The town has a high rate of poverty, with nearly one-third of the population living below the poverty line.
History
Custer was founded in 1883 and named after General George Armstrong Custer, who was killed at the Battle of Little Big Horn in 1876. The town was originally a trading post for the Blackfeet Indians, and was later used as a supply point for miners and settlers. The town was incorporated in 1887, and the first post office was established in 1888. The town was a popular stop for travelers on the Great Northern Railway, and was also a popular destination for tourists. The town was also home to a number of saloons and gambling halls, which were popular with the miners and settlers.
In the early 1900s, the town began to decline, as the mining industry began to decline and the railroad began to bypass the town. The town was also hit hard by the Great Depression, and many of the businesses in the town closed. The town was revitalized in the 1950s, when the Lewis and Clark National Forest was established, and the town became a popular destination for tourists and outdoor enthusiasts.
Today, Custer is a small, quiet town, with a population of just over 1,000. The town is still a popular destination for tourists and outdoor enthusiasts, and is home to a number of small businesses. The town is also home to a number of small farms, which produce a variety of crops, including wheat, barley, and hay.
Common Questions
What is Per Capita Income in Custer?
Per Capita income in Custer is $35,805.
What is the Median Family Income in Custer?
Median Family Income in Custer is $96,250.
What is the Median Household income in Custer?
Median Household Income in Custer is $63,750.
What is Inequality or Gini Index in Custer?
Inequality or Gini Index in Custer is 0.37.
What is the Total Population of Custer?
Total Population of Custer is 146.
What is the Total Male Population of Custer?
Total Male Population of Custer is 68.
What is the Total Female Population of Custer?
Total Female Population of Custer is 78.
What is the Ratio of Males per 100 Females in Custer?
There are 87.18 Males per 100 Females in Custer.
What is the Ratio of Females per 100 Males in Custer?
There are 114.71 Females per 100 Males in Custer.
What is the Median Population Age in Custer?
Median Population Age in Custer is 59.4 Years.
What is the Average Family Size in Custer
Average Family Size in Custer is 3.1 People.
What is the Average Household Size in Custer
Average Household Size in Custer is 1.9 People.
How Large is the Labor Force in Custer?
There are 79 People in the Labor Forcein in Custer.
What is the Percentage of People in the Labor Force in Custer?
62.2% of People are in the Labor Force in Custer.
What is the Unemployment Rate in Custer?
Unemployment Rate in Custer is 2.5%.