Boulder, MT Map & Demographics
Boulder Map
Boulder Overview
$29,549
PER CAPITA INCOME
$54,609
AVG HOUSEHOLD INCOME
20.4%
WAGE / INCOME GAP [ % ]
79.6¢/ $1
WAGE / INCOME GAP [ $ ]
0.41
INEQUALITY / GINI INDEX
1,214
TOTAL POPULATION
664
MALE POPULATION
550
FEMALE POPULATION
120.73
MALES / 100 FEMALES
82.83
FEMALES / 100 MALES
41.3
MEDIAN AGE
3.2
AVG FAMILY SIZE
2.3
AVG HOUSEHOLD SIZE
566
LABOR FORCE [ PEOPLE ]
57.4%
PERCENT IN LABOR FORCE
6.0%
UNEMPLOYMENT RATE
Boulder Zip Codes
Boulder Area Codes
Income in Boulder
Income Overview in Boulder
| Characteristic | Number | Measure |
| Per Capita Income | 1,214 | $29,549 |
| Median Family Income | 256 | $0 |
| Mean Family Income | 256 | $94,082 |
| Median Household Income | 474 | $54,609 |
| Mean Household Income | 474 | $71,697 |
| Income Deficit | 256 | $0 |
| Wage / Income Gap (%) | 1,214 | 20.35% |
| Wage / Income Gap ($) | 1,214 | 79.65¢ per $1 |
| Gini / Inequality Index | 1,214 | 0.41 |
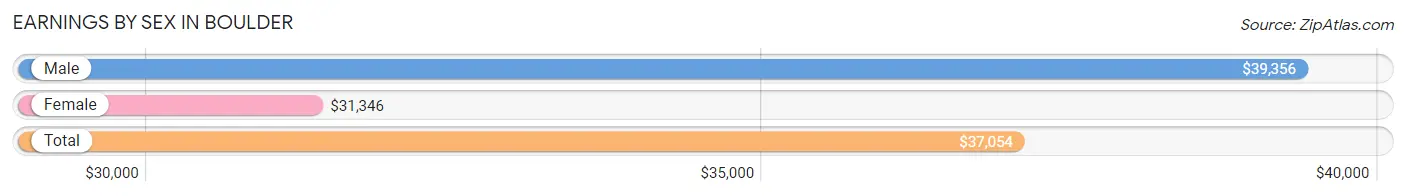
Earnings by Sex in Boulder
Average Earnings in Boulder are $37,054, $39,356 for men and $31,346 for women, a difference of 20.3%.
| Sex | Number | Average Earnings |
| Male | 369 (60.4%) | $39,356 |
| Female | 242 (39.6%) | $31,346 |
| Total | 611 (100.0%) | $37,054 |
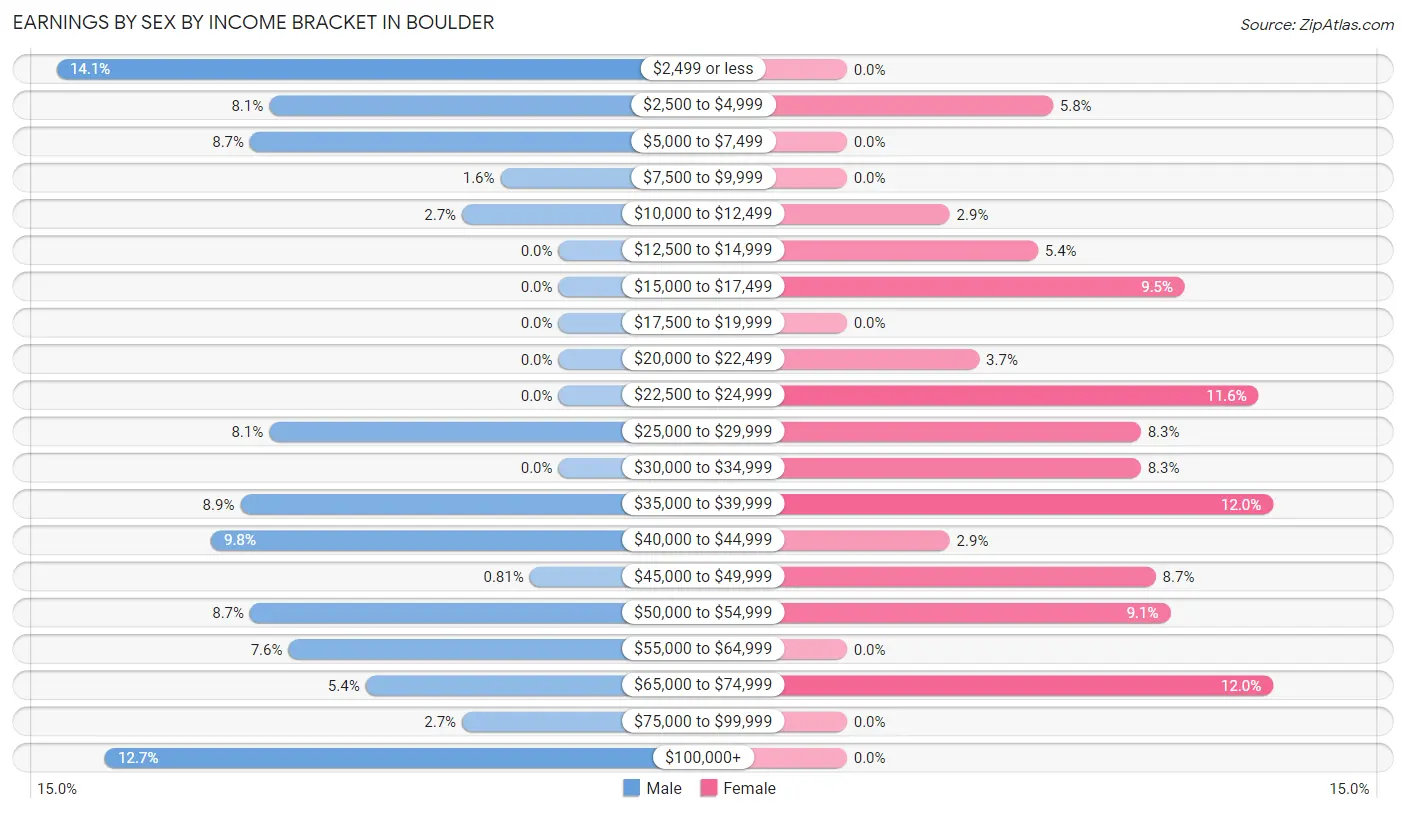
Earnings by Sex by Income Bracket in Boulder
The most common earnings brackets in Boulder are $2,499 or less for men (52 | 14.1%) and $35,000 to $39,999 for women (29 | 12.0%).
| Income | Male | Female |
| $2,499 or less | 52 (14.1%) | 0 (0.0%) |
| $2,500 to $4,999 | 30 (8.1%) | 14 (5.8%) |
| $5,000 to $7,499 | 32 (8.7%) | 0 (0.0%) |
| $7,500 to $9,999 | 6 (1.6%) | 0 (0.0%) |
| $10,000 to $12,499 | 10 (2.7%) | 7 (2.9%) |
| $12,500 to $14,999 | 0 (0.0%) | 13 (5.4%) |
| $15,000 to $17,499 | 0 (0.0%) | 23 (9.5%) |
| $17,500 to $19,999 | 0 (0.0%) | 0 (0.0%) |
| $20,000 to $22,499 | 0 (0.0%) | 9 (3.7%) |
| $22,500 to $24,999 | 0 (0.0%) | 28 (11.6%) |
| $25,000 to $29,999 | 30 (8.1%) | 20 (8.3%) |
| $30,000 to $34,999 | 0 (0.0%) | 20 (8.3%) |
| $35,000 to $39,999 | 33 (8.9%) | 29 (12.0%) |
| $40,000 to $44,999 | 36 (9.8%) | 7 (2.9%) |
| $45,000 to $49,999 | 3 (0.8%) | 21 (8.7%) |
| $50,000 to $54,999 | 32 (8.7%) | 22 (9.1%) |
| $55,000 to $64,999 | 28 (7.6%) | 0 (0.0%) |
| $65,000 to $74,999 | 20 (5.4%) | 29 (12.0%) |
| $75,000 to $99,999 | 10 (2.7%) | 0 (0.0%) |
| $100,000+ | 47 (12.7%) | 0 (0.0%) |
| Total | 369 (100.0%) | 242 (100.0%) |
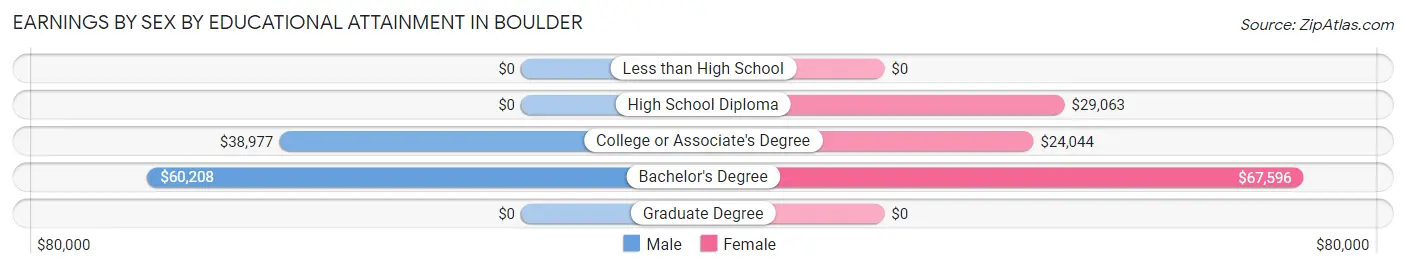
Earnings by Sex by Educational Attainment in Boulder
Average earnings in Boulder are $39,659 for men and $29,938 for women, a difference of 24.5%. Men with an educational attainment of bachelor's degree enjoy the highest average annual earnings of $60,208, while those with college or associate's degree education earn the least with $38,977. Women with an educational attainment of bachelor's degree earn the most with the average annual earnings of $67,596, while those with college or associate's degree education have the smallest earnings of $24,044.
| Educational Attainment | Male Income | Female Income |
| Less than High School | - | - |
| High School Diploma | - | - |
| College or Associate's Degree | $38,977 | $24,044 |
| Bachelor's Degree | $60,208 | $67,596 |
| Graduate Degree | - | - |
| Total | $39,659 | $29,938 |
Family Income in Boulder
Family Income Brackets in Boulder
According to the Boulder family income data, there are 59 families falling into the $50,000 to $74,999 income range, which is the most common income bracket and makes up 23.1% of all families.
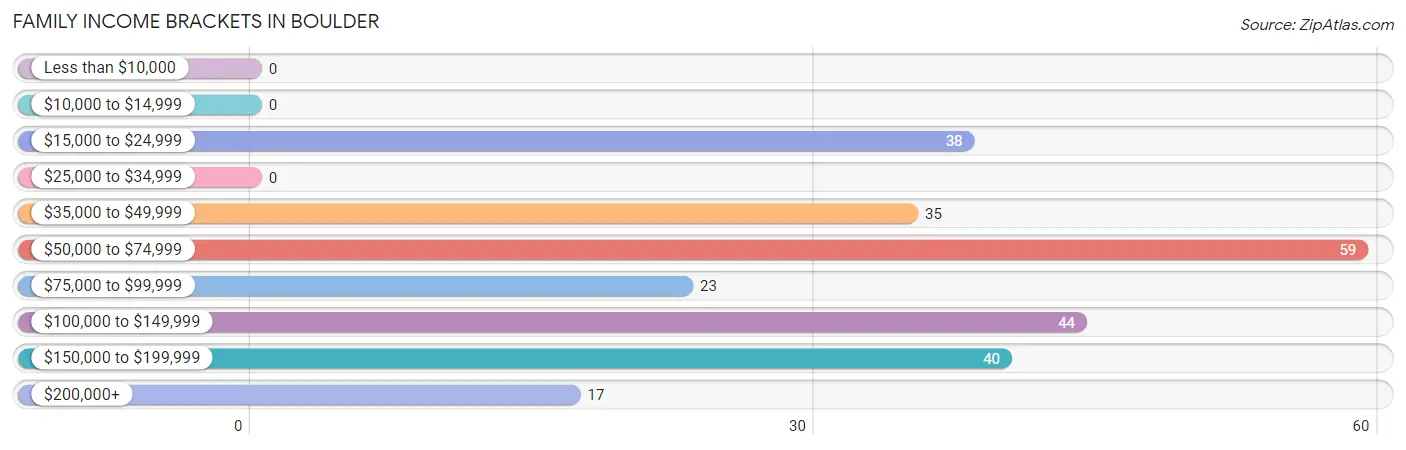
| Income Bracket | # Families | % Families |
| Less than $10,000 | 0 | 0.0% |
| $10,000 to $14,999 | 0 | 0.0% |
| $15,000 to $24,999 | 38 | 14.8% |
| $25,000 to $34,999 | 0 | 0.0% |
| $35,000 to $49,999 | 35 | 13.7% |
| $50,000 to $74,999 | 59 | 23.0% |
| $75,000 to $99,999 | 23 | 9.0% |
| $100,000 to $149,999 | 44 | 17.2% |
| $150,000 to $199,999 | 40 | 15.6% |
| $200,000+ | 17 | 6.6% |
Family Income by Famaliy Size in Boulder
3-person families (26 | 10.2%) account for the highest median family income in Boulder with $106,071 per family, while 3-person families (26 | 10.2%) have the highest median income of $35,357 per family member.
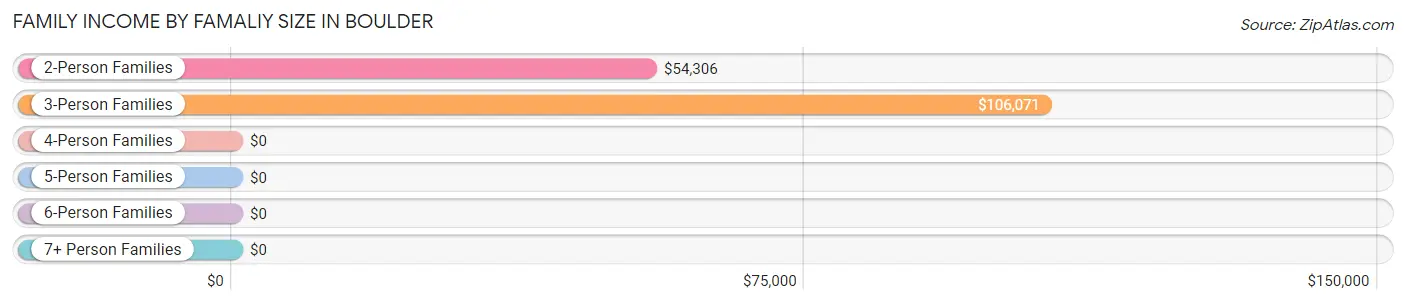
| Income Bracket | # Families | Median Income |
| 2-Person Families | 137 (53.5%) | $54,306 |
| 3-Person Families | 26 (10.2%) | $106,071 |
| 4-Person Families | 48 (18.8%) | $0 |
| 5-Person Families | 28 (10.9%) | $0 |
| 6-Person Families | 0 (0.0%) | $0 |
| 7+ Person Families | 17 (6.6%) | $0 |
| Total | 256 (100.0%) | $0 |
Family Income by Number of Earners in Boulder
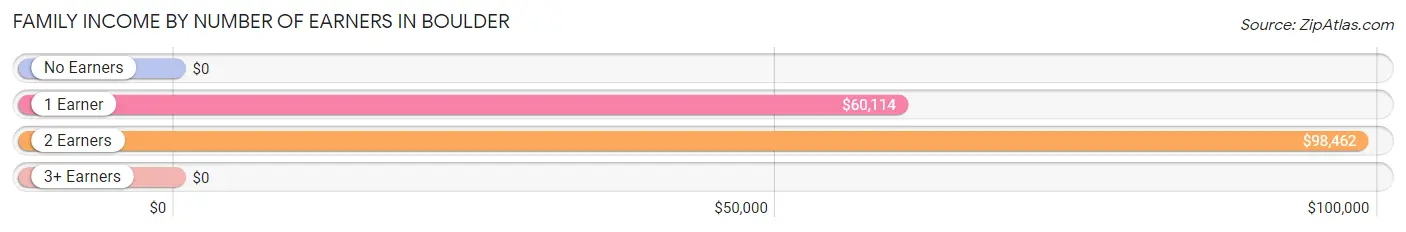
| Number of Earners | # Families | Median Income |
| No Earners | 39 (15.2%) | $0 |
| 1 Earner | 89 (34.8%) | $60,114 |
| 2 Earners | 106 (41.4%) | $98,462 |
| 3+ Earners | 22 (8.6%) | $0 |
| Total | 256 (100.0%) | $0 |
Household Income in Boulder
Household Income Brackets in Boulder
With 91 households falling in the category, the $50,000 to $74,999 income range is the most frequent in Boulder, accounting for 19.2% of all households.
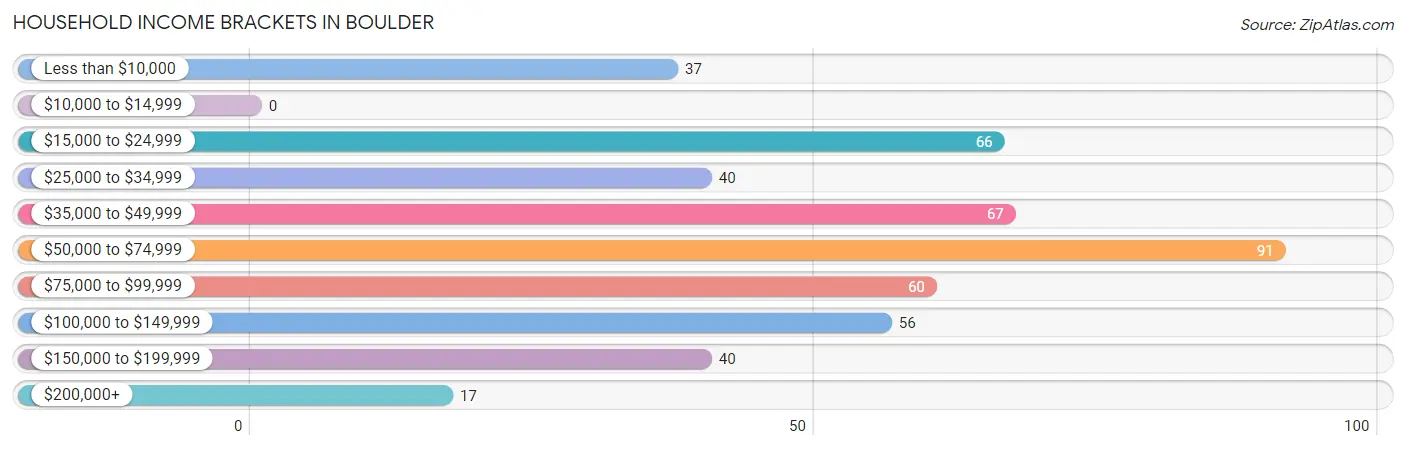
| Income Bracket | # Households | % Households |
| Less than $10,000 | 37 | 7.8% |
| $10,000 to $14,999 | 0 | 0.0% |
| $15,000 to $24,999 | 66 | 13.9% |
| $25,000 to $34,999 | 40 | 8.4% |
| $35,000 to $49,999 | 67 | 14.1% |
| $50,000 to $74,999 | 91 | 19.2% |
| $75,000 to $99,999 | 60 | 12.7% |
| $100,000 to $149,999 | 56 | 11.8% |
| $150,000 to $199,999 | 40 | 8.4% |
| $200,000+ | 17 | 3.6% |
Household Income by Householder Age in Boulder
The median household income in Boulder is $54,609, with the highest median household income of $90,357 found in the 25 to 44 years age bracket for the primary householder. A total of 174 households (36.7%) fall into this category.
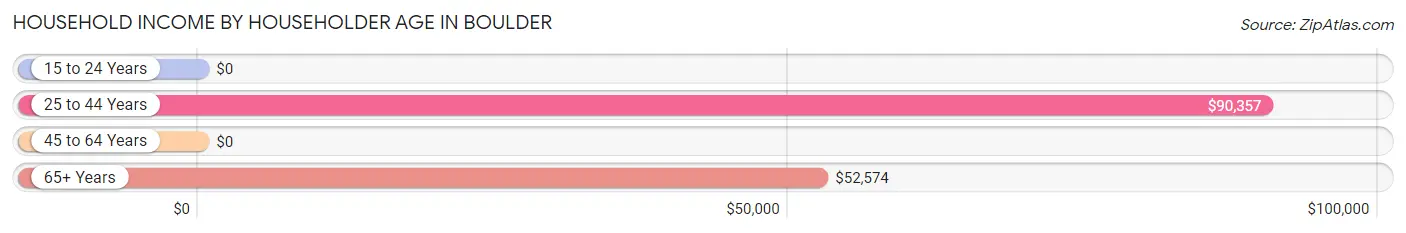
| Income Bracket | # Households | Median Income |
| 15 to 24 Years | 0 (0.0%) | $0 |
| 25 to 44 Years | 174 (36.7%) | $90,357 |
| 45 to 64 Years | 195 (41.1%) | $0 |
| 65+ Years | 105 (22.2%) | $52,574 |
| Total | 474 (100.0%) | $54,609 |
Poverty in Boulder
Income Below Poverty by Sex and Age in Boulder
With 19.6% poverty level for males and 2.2% for females among the residents of Boulder, 55 to 64 year old males and 35 to 44 year old females are the most vulnerable to poverty, with 82 males (63.6%) and 12 females (14.3%) in their respective age groups living below the poverty level.
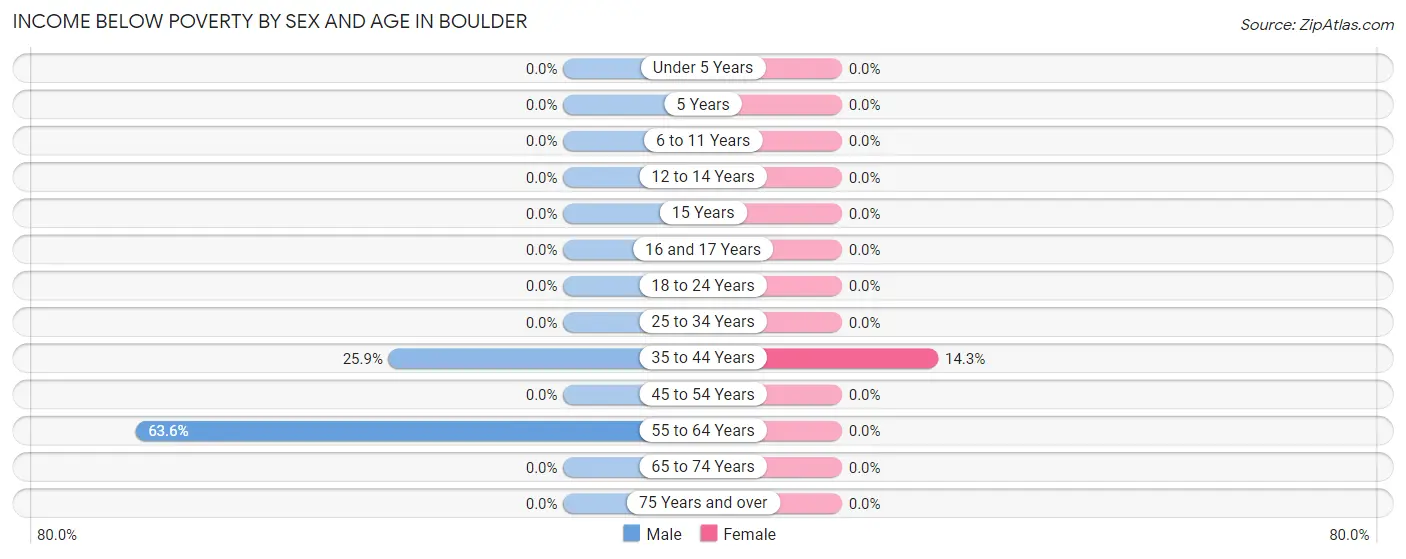
| Age Bracket | Male | Female |
| Under 5 Years | 0 (0.0%) | 0 (0.0%) |
| 5 Years | 0 (0.0%) | 0 (0.0%) |
| 6 to 11 Years | 0 (0.0%) | 0 (0.0%) |
| 12 to 14 Years | 0 (0.0%) | 0 (0.0%) |
| 15 Years | 0 (0.0%) | 0 (0.0%) |
| 16 and 17 Years | 0 (0.0%) | 0 (0.0%) |
| 18 to 24 Years | 0 (0.0%) | 0 (0.0%) |
| 25 to 34 Years | 0 (0.0%) | 0 (0.0%) |
| 35 to 44 Years | 42 (25.9%) | 12 (14.3%) |
| 45 to 54 Years | 0 (0.0%) | 0 (0.0%) |
| 55 to 64 Years | 82 (63.6%) | 0 (0.0%) |
| 65 to 74 Years | 0 (0.0%) | 0 (0.0%) |
| 75 Years and over | 0 (0.0%) | 0 (0.0%) |
| Total | 124 (19.6%) | 12 (2.2%) |
Income Above Poverty by Sex and Age in Boulder
According to the poverty statistics in Boulder, males aged under 5 years and females aged under 5 years are the age groups that are most secure financially, with 100.0% of males and 100.0% of females in these age groups living above the poverty line.
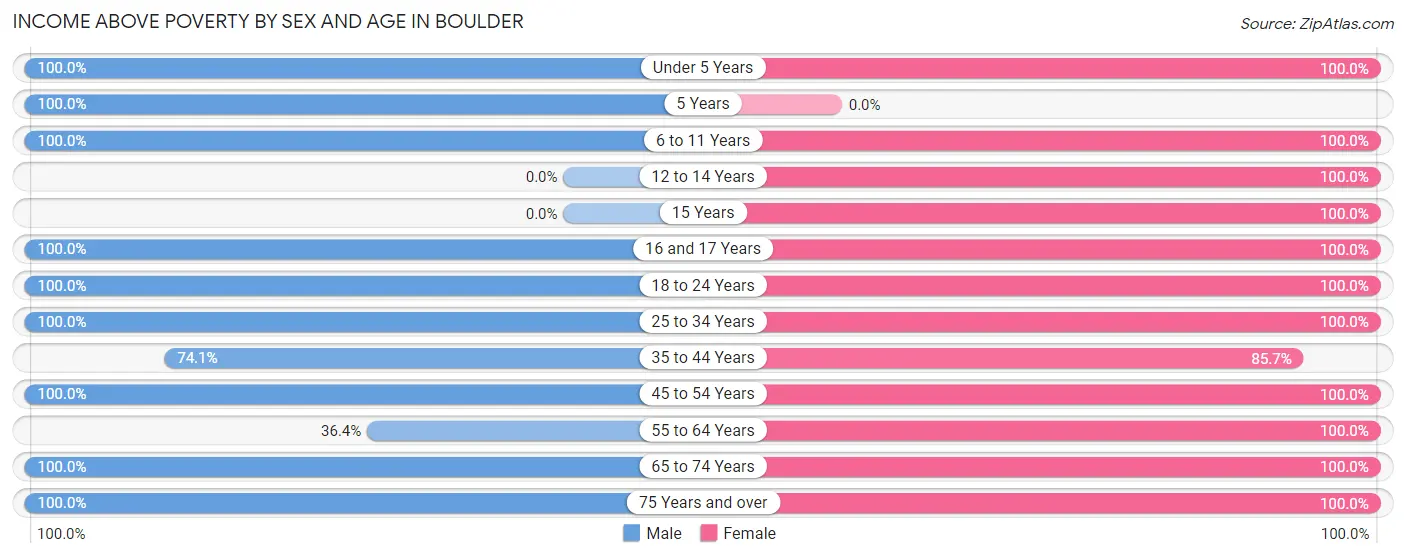
| Age Bracket | Male | Female |
| Under 5 Years | 17 (100.0%) | 66 (100.0%) |
| 5 Years | 13 (100.0%) | 0 (0.0%) |
| 6 to 11 Years | 21 (100.0%) | 59 (100.0%) |
| 12 to 14 Years | 0 (0.0%) | 40 (100.0%) |
| 15 Years | 0 (0.0%) | 12 (100.0%) |
| 16 and 17 Years | 18 (100.0%) | 18 (100.0%) |
| 18 to 24 Years | 77 (100.0%) | 25 (100.0%) |
| 25 to 34 Years | 64 (100.0%) | 34 (100.0%) |
| 35 to 44 Years | 120 (74.1%) | 72 (85.7%) |
| 45 to 54 Years | 58 (100.0%) | 67 (100.0%) |
| 55 to 64 Years | 47 (36.4%) | 73 (100.0%) |
| 65 to 74 Years | 35 (100.0%) | 44 (100.0%) |
| 75 Years and over | 38 (100.0%) | 28 (100.0%) |
| Total | 508 (80.4%) | 538 (97.8%) |
Income Below Poverty Among Married-Couple Families in Boulder
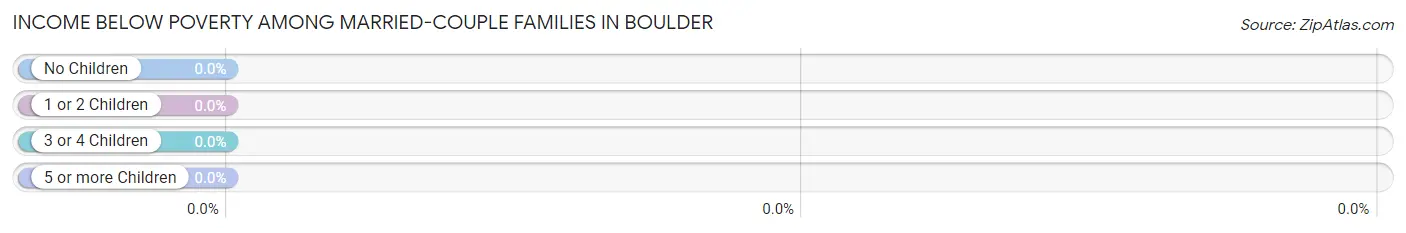
| Children | Above Poverty | Below Poverty |
| No Children | 125 (100.0%) | 0 (0.0%) |
| 1 or 2 Children | 42 (100.0%) | 0 (0.0%) |
| 3 or 4 Children | 28 (100.0%) | 0 (0.0%) |
| 5 or more Children | 17 (100.0%) | 0 (0.0%) |
| Total | 212 (100.0%) | 0 (0.0%) |
Income Below Poverty Among Single-Parent Households in Boulder
| Children | Single Father | Single Mother |
| No Children | 0 (0.0%) | 0 (0.0%) |
| 1 or 2 Children | 0 (0.0%) | 0 (0.0%) |
| 3 or 4 Children | 0 (0.0%) | 0 (0.0%) |
| 5 or more Children | 0 (0.0%) | 0 (0.0%) |
| Total | 0 (0.0%) | 0 (0.0%) |
Income Below Poverty Among Married-Couple vs Single-Parent Households in Boulder
| Children | Married-Couple Families | Single-Parent Households |
| No Children | 0 (0.0%) | 0 (0.0%) |
| 1 or 2 Children | 0 (0.0%) | 0 (0.0%) |
| 3 or 4 Children | 0 (0.0%) | 0 (0.0%) |
| 5 or more Children | 0 (0.0%) | 0 (0.0%) |
| Total | 0 (0.0%) | 0 (0.0%) |
Race in Boulder
The most populous races in Boulder are White / Caucasian (1,124 | 92.6%), Native / Alaskan (48 | 4.0%), and Hispanic or Latino (40 | 3.3%).
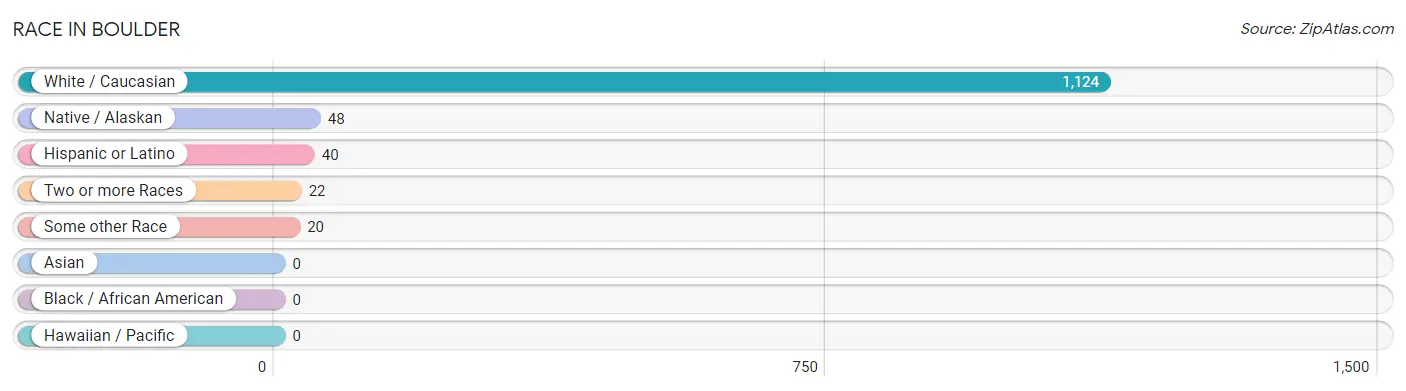
| Race | # Population | % Population |
| Asian | 0 | 0.0% |
| Black / African American | 0 | 0.0% |
| Hawaiian / Pacific | 0 | 0.0% |
| Hispanic or Latino | 40 | 3.3% |
| Native / Alaskan | 48 | 4.0% |
| White / Caucasian | 1,124 | 92.6% |
| Two or more Races | 22 | 1.8% |
| Some other Race | 20 | 1.7% |
| Total | 1,214 | 100.0% |
Ancestry in Boulder
The most populous ancestries reported in Boulder are German (317 | 26.1%), Irish (278 | 22.9%), English (130 | 10.7%), Norwegian (102 | 8.4%), and Italian (71 | 5.9%), together accounting for 74.0% of all Boulder residents.
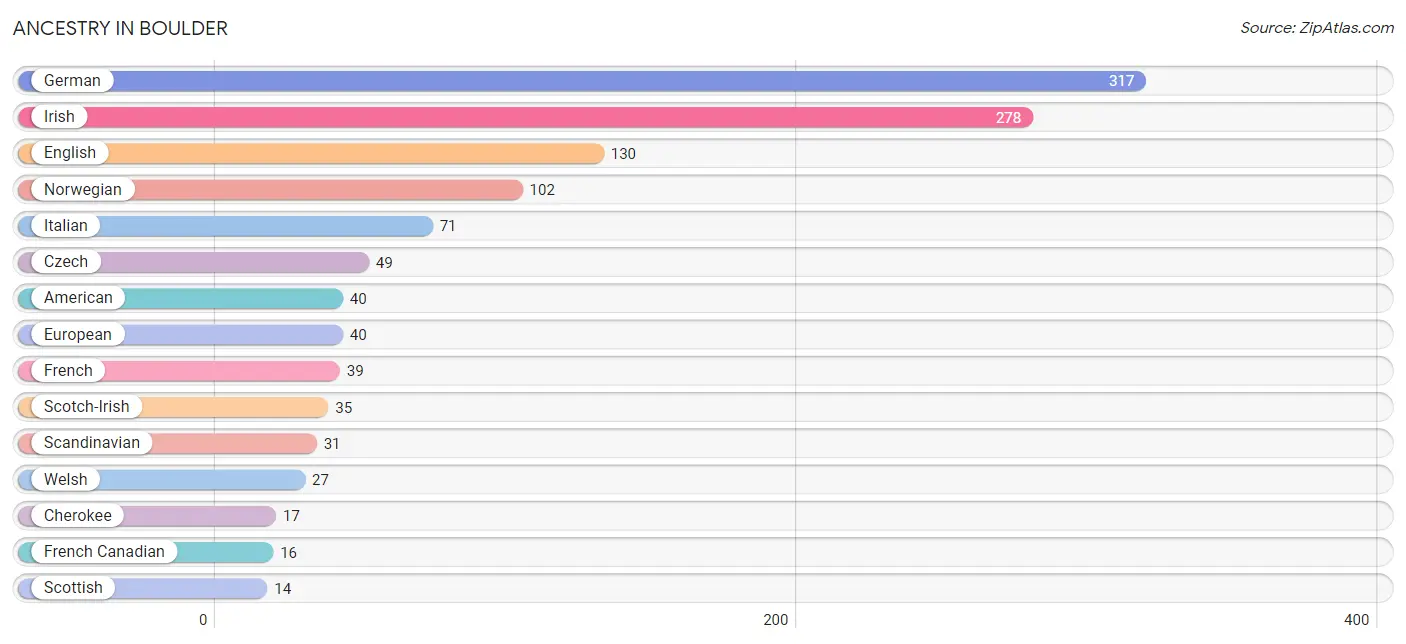
| Ancestry | # Population | % Population |
| American | 40 | 3.3% |
| Austrian | 3 | 0.3% |
| Bulgarian | 7 | 0.6% |
| Canadian | 11 | 0.9% |
| Cherokee | 17 | 1.4% |
| Crow | 5 | 0.4% |
| Czech | 49 | 4.0% |
| English | 130 | 10.7% |
| European | 40 | 3.3% |
| Finnish | 4 | 0.3% |
| French | 39 | 3.2% |
| French Canadian | 16 | 1.3% |
| German | 317 | 26.1% |
| Hungarian | 13 | 1.1% |
| Irish | 278 | 22.9% |
| Italian | 71 | 5.9% |
| Norwegian | 102 | 8.4% |
| Scandinavian | 31 | 2.5% |
| Scotch-Irish | 35 | 2.9% |
| Scottish | 14 | 1.1% |
| Spaniard | 9 | 0.7% |
| Swedish | 11 | 0.9% |
| Swiss | 4 | 0.3% |
| Welsh | 27 | 2.2% | View All 24 Rows |
Immigrants in Boulder

| Immigration Origin | # Population | % Population | View All 0 Rows |
Sex and Age in Boulder
Sex and Age in Boulder
The most populous age groups in Boulder are 40 to 44 Years (118 | 17.8%) for men and Under 5 Years (66 | 12.0%) for women.
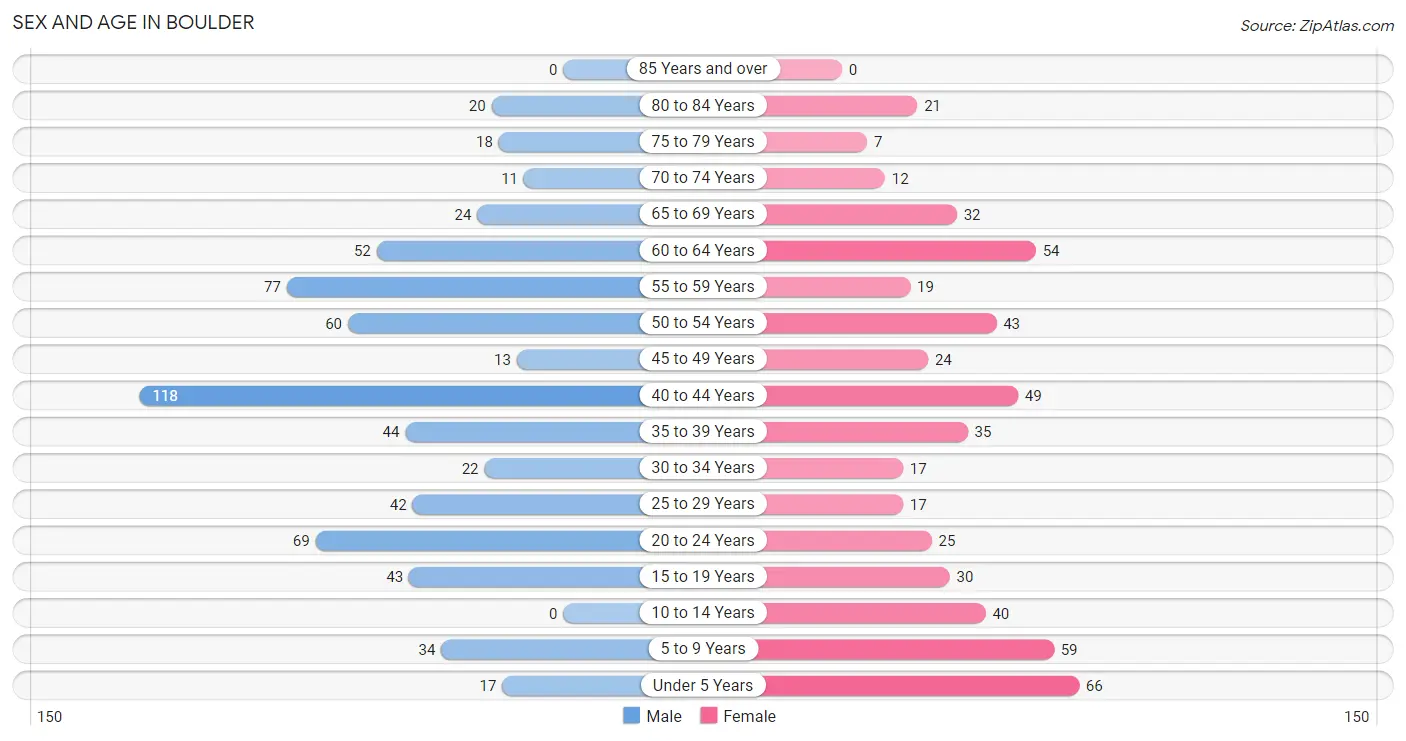
| Age Bracket | Male | Female |
| Under 5 Years | 17 (2.6%) | 66 (12.0%) |
| 5 to 9 Years | 34 (5.1%) | 59 (10.7%) |
| 10 to 14 Years | 0 (0.0%) | 40 (7.3%) |
| 15 to 19 Years | 43 (6.5%) | 30 (5.4%) |
| 20 to 24 Years | 69 (10.4%) | 25 (4.5%) |
| 25 to 29 Years | 42 (6.3%) | 17 (3.1%) |
| 30 to 34 Years | 22 (3.3%) | 17 (3.1%) |
| 35 to 39 Years | 44 (6.6%) | 35 (6.4%) |
| 40 to 44 Years | 118 (17.8%) | 49 (8.9%) |
| 45 to 49 Years | 13 (2.0%) | 24 (4.4%) |
| 50 to 54 Years | 60 (9.0%) | 43 (7.8%) |
| 55 to 59 Years | 77 (11.6%) | 19 (3.5%) |
| 60 to 64 Years | 52 (7.8%) | 54 (9.8%) |
| 65 to 69 Years | 24 (3.6%) | 32 (5.8%) |
| 70 to 74 Years | 11 (1.7%) | 12 (2.2%) |
| 75 to 79 Years | 18 (2.7%) | 7 (1.3%) |
| 80 to 84 Years | 20 (3.0%) | 21 (3.8%) |
| 85 Years and over | 0 (0.0%) | 0 (0.0%) |
| Total | 664 (100.0%) | 550 (100.0%) |
Families and Households in Boulder
Median Family Size in Boulder
The median family size in Boulder is 3.17 persons per family, with single male/father families (10 | 3.9%) accounting for the largest median family size of 3.7 persons per family. On the other hand, single female/mother families (34 | 13.3%) represent the smallest median family size with 2.21 persons per family.
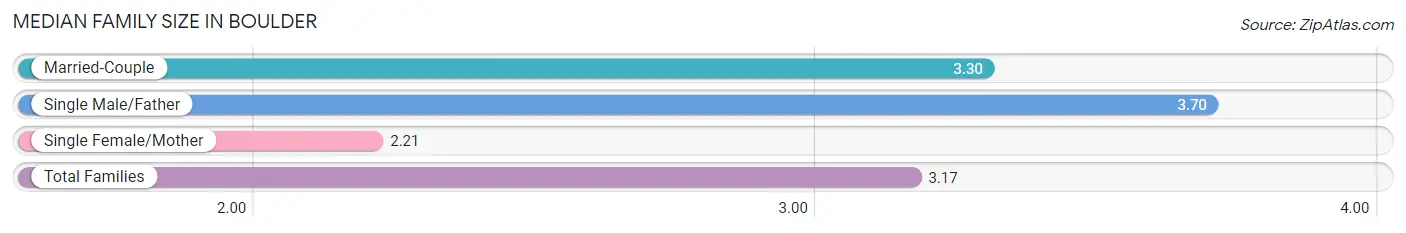
| Family Type | # Families | Family Size |
| Married-Couple | 212 (82.8%) | 3.30 |
| Single Male/Father | 10 (3.9%) | 3.70 |
| Single Female/Mother | 34 (13.3%) | 2.21 |
| Total Families | 256 (100.0%) | 3.17 |
Median Household Size in Boulder
The median household size in Boulder is 2.31 persons per household, with single male/father households (10 | 2.1%) accounting for the largest median household size of 3.7 persons per household. non-family households (218 | 46.0%) represent the smallest median household size with 1.20 persons per household.
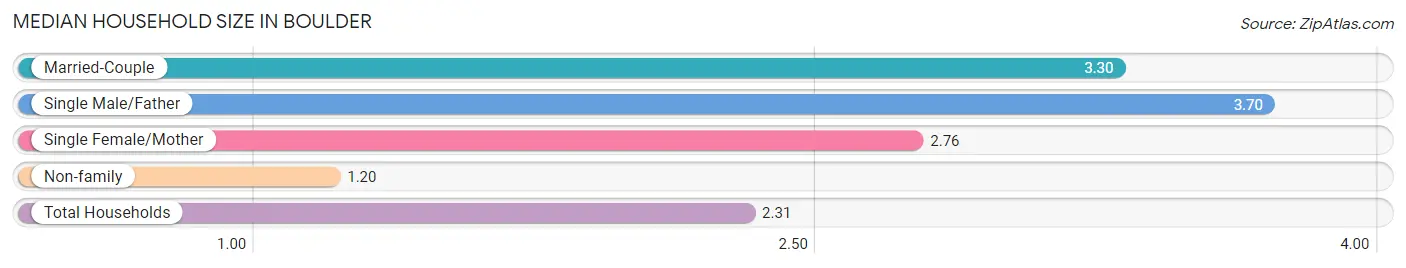
| Household Type | # Households | Household Size |
| Married-Couple | 212 (44.7%) | 3.30 |
| Single Male/Father | 10 (2.1%) | 3.70 |
| Single Female/Mother | 34 (7.2%) | 2.76 |
| Non-family | 218 (46.0%) | 1.20 |
| Total Households | 474 (100.0%) | 2.31 |
Household Size by Marriage Status in Boulder
Out of a total of 474 households in Boulder, 256 (54.0%) are family households, while 218 (46.0%) are nonfamily households. The most numerous type of family households are 2-person households, comprising 110, and the most common type of nonfamily households are 1-person households, comprising 189.
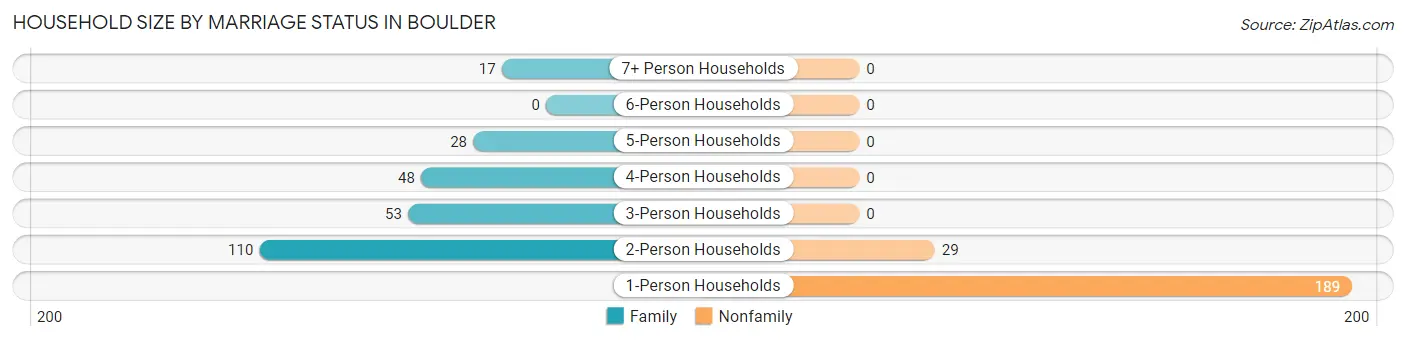
| Household Size | Family Households | Nonfamily Households |
| 1-Person Households | - | 189 (39.9%) |
| 2-Person Households | 110 (23.2%) | 29 (6.1%) |
| 3-Person Households | 53 (11.2%) | 0 (0.0%) |
| 4-Person Households | 48 (10.1%) | 0 (0.0%) |
| 5-Person Households | 28 (5.9%) | 0 (0.0%) |
| 6-Person Households | 0 (0.0%) | 0 (0.0%) |
| 7+ Person Households | 17 (3.6%) | 0 (0.0%) |
| Total | 256 (54.0%) | 218 (46.0%) |
Female Fertility in Boulder
Fertility by Age in Boulder
| Age Bracket | Women with Births | Births / 1,000 Women |
| 15 to 19 years | 0 (0.0%) | 0.0 |
| 20 to 34 years | 0 (0.0%) | 0.0 |
| 35 to 50 years | 0 (0.0%) | 0.0 |
| Total | 0 (0.0%) | 0.0 |
Fertility by Age by Marriage Status in Boulder
| Age Bracket | Married | Unmarried |
| 15 to 19 years | 0 (0.0%) | 0 (0.0%) |
| 20 to 34 years | 0 (0.0%) | 0 (0.0%) |
| 35 to 50 years | 0 (0.0%) | 0 (0.0%) |
| Total | 0 (0.0%) | 0 (0.0%) |
Fertility by Education in Boulder
| Educational Attainment | Women with Births | Births / 1,000 Women |
| Less than High School | 0 (0.0%) | 0.0 |
| High School Diploma | 0 (0.0%) | 0.0 |
| College or Associate's Degree | 0 (0.0%) | 0.0 |
| Bachelor's Degree | 0 (0.0%) | 0.0 |
| Graduate Degree | 0 (0.0%) | 0.0 |
| Total | 0 (0.0%) | 0.0 |
Fertility by Education by Marriage Status in Boulder
| Educational Attainment | Married | Unmarried |
| Less than High School | 0 (0.0%) | 0 (0.0%) |
| High School Diploma | 0 (0.0%) | 0 (0.0%) |
| College or Associate's Degree | 0 (0.0%) | 0 (0.0%) |
| Bachelor's Degree | 0 (0.0%) | 0 (0.0%) |
| Graduate Degree | 0 (0.0%) | 0 (0.0%) |
| Total | 0 (0.0%) | 0 (0.0%) |
Employment Characteristics in Boulder
Employment by Class of Employer in Boulder
Among the 517 employed individuals in Boulder, private company employees (290 | 56.1%), state government employees (87 | 16.8%), and not-for-profit organizations (75 | 14.5%) make up the most common classes of employment.
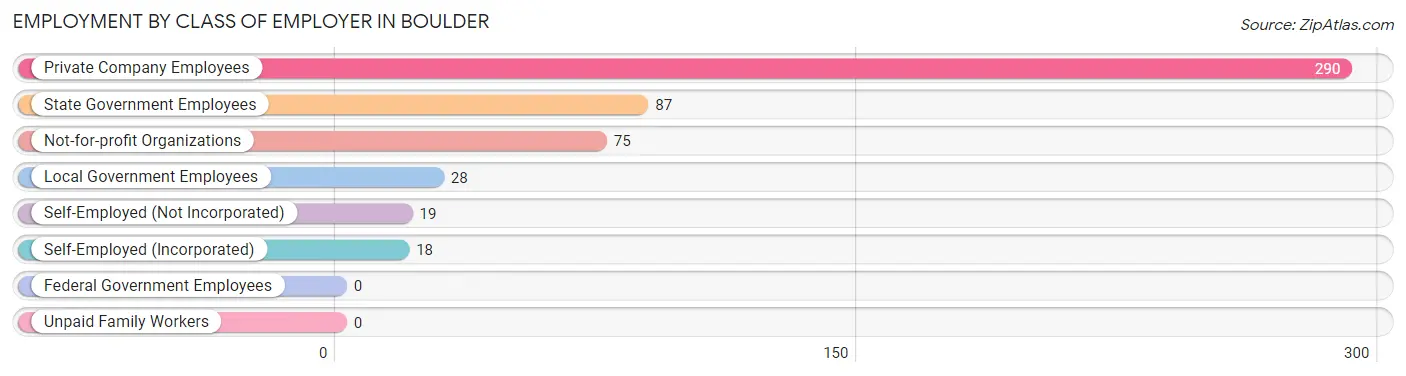
| Employer Class | # Employees | % Employees |
| Private Company Employees | 290 | 56.1% |
| Self-Employed (Incorporated) | 18 | 3.5% |
| Self-Employed (Not Incorporated) | 19 | 3.7% |
| Not-for-profit Organizations | 75 | 14.5% |
| Local Government Employees | 28 | 5.4% |
| State Government Employees | 87 | 16.8% |
| Federal Government Employees | 0 | 0.0% |
| Unpaid Family Workers | 0 | 0.0% |
| Total | 517 | 100.0% |
Employment Status by Age in Boulder
According to the labor force statistics for Boulder, out of the total population over 16 years of age (986), 57.4% or 566 individuals are in the labor force, with 6.0% or 34 of them unemployed. The age group with the highest labor force participation rate is 25 to 29 years, with 100.0% or 59 individuals in the labor force. Within the labor force, the 25 to 29 years age range has the highest percentage of unemployed individuals, with 40.7% or 24 of them being unemployed.
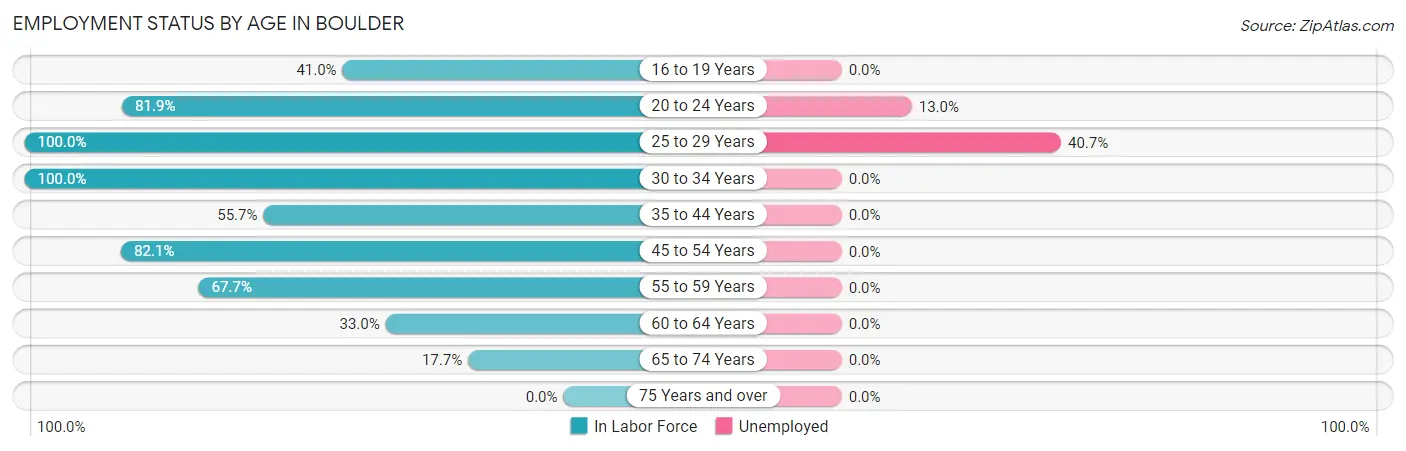
| Age Bracket | In Labor Force | Unemployed |
| 16 to 19 Years | 25 (41.0%) | 0 (0.0%) |
| 20 to 24 Years | 77 (81.9%) | 10 (13.0%) |
| 25 to 29 Years | 59 (100.0%) | 24 (40.7%) |
| 30 to 34 Years | 39 (100.0%) | 0 (0.0%) |
| 35 to 44 Years | 137 (55.7%) | 0 (0.0%) |
| 45 to 54 Years | 115 (82.1%) | 0 (0.0%) |
| 55 to 59 Years | 65 (67.7%) | 0 (0.0%) |
| 60 to 64 Years | 35 (33.0%) | 0 (0.0%) |
| 65 to 74 Years | 14 (17.7%) | 0 (0.0%) |
| 75 Years and over | 0 (0.0%) | 0 (0.0%) |
| Total | 566 (57.4%) | 34 (6.0%) |
Employment Status by Educational Attainment in Boulder
According to labor force statistics for Boulder, 65.6% of individuals (450) out of the total population between 25 and 64 years of age (686) are in the labor force, with 5.3% or 24 of them being unemployed. The group with the highest labor force participation rate are those with the educational attainment of high school diploma, with 83.7% or 190 individuals in the labor force. Within the labor force, individuals with less than high school education have the highest percentage of unemployment, with 65.4% or 17 of them being unemployed.
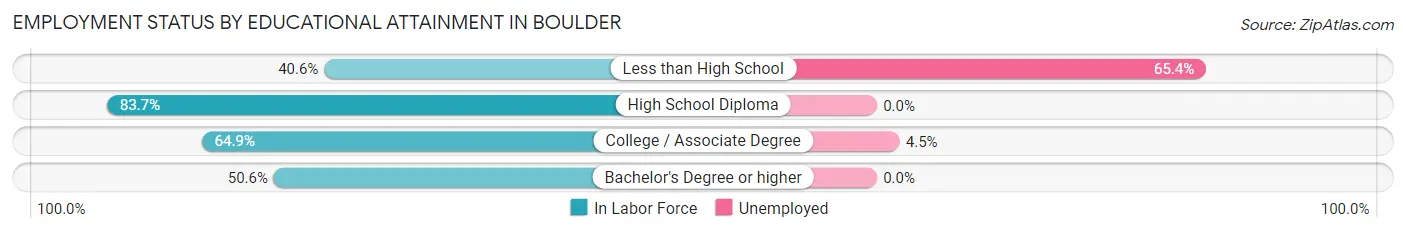
| Educational Attainment | In Labor Force | Unemployed |
| Less than High School | 26 (40.6%) | 42 (65.4%) |
| High School Diploma | 190 (83.7%) | 0 (0.0%) |
| College / Associate Degree | 155 (64.9%) | 11 (4.5%) |
| Bachelor's Degree or higher | 79 (50.6%) | 0 (0.0%) |
| Total | 450 (65.6%) | 36 (5.3%) |
Employment Occupations by Sex in Boulder
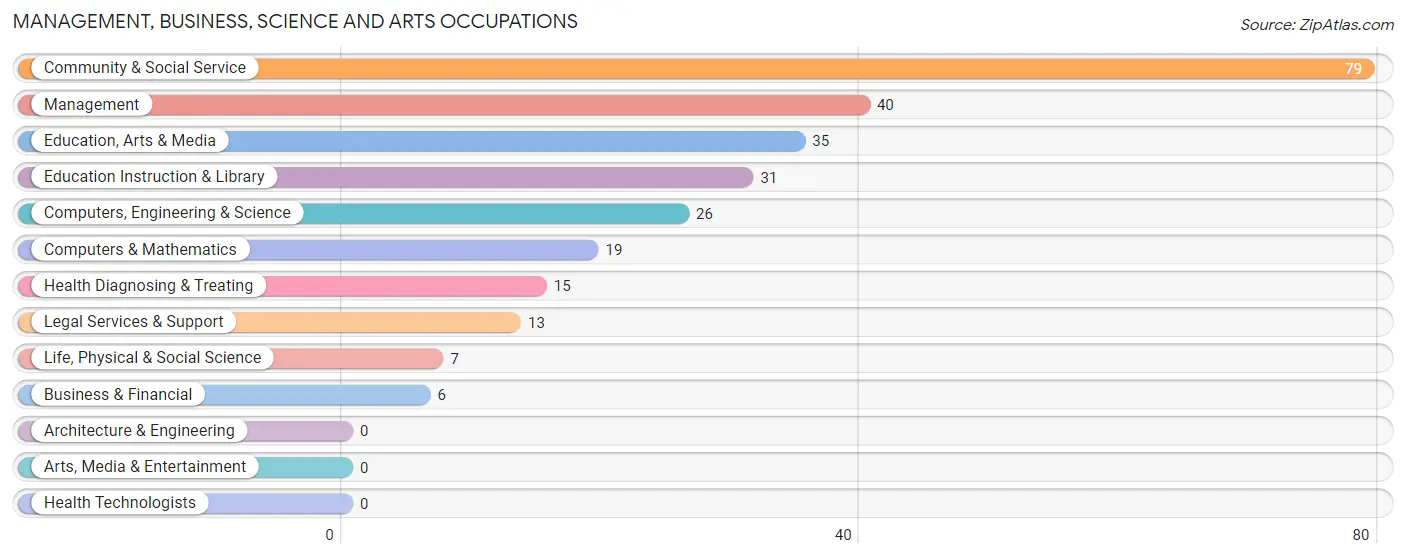
Management, Business, Science and Arts Occupations
The most common Management, Business, Science and Arts occupations in Boulder are Community & Social Service (79 | 14.8%), Management (40 | 7.5%), Education, Arts & Media (35 | 6.6%), Education Instruction & Library (31 | 5.8%), and Computers, Engineering & Science (26 | 4.9%).
Management, Business, Science and Arts Occupations by Sex
Within the Management, Business, Science and Arts occupations in Boulder, the most male-oriented occupations are Business & Financial (100.0%), Computers & Mathematics (100.0%), and Legal Services & Support (100.0%), while the most female-oriented occupations are Management (100.0%), Life, Physical & Social Science (100.0%), and Education Instruction & Library (100.0%).
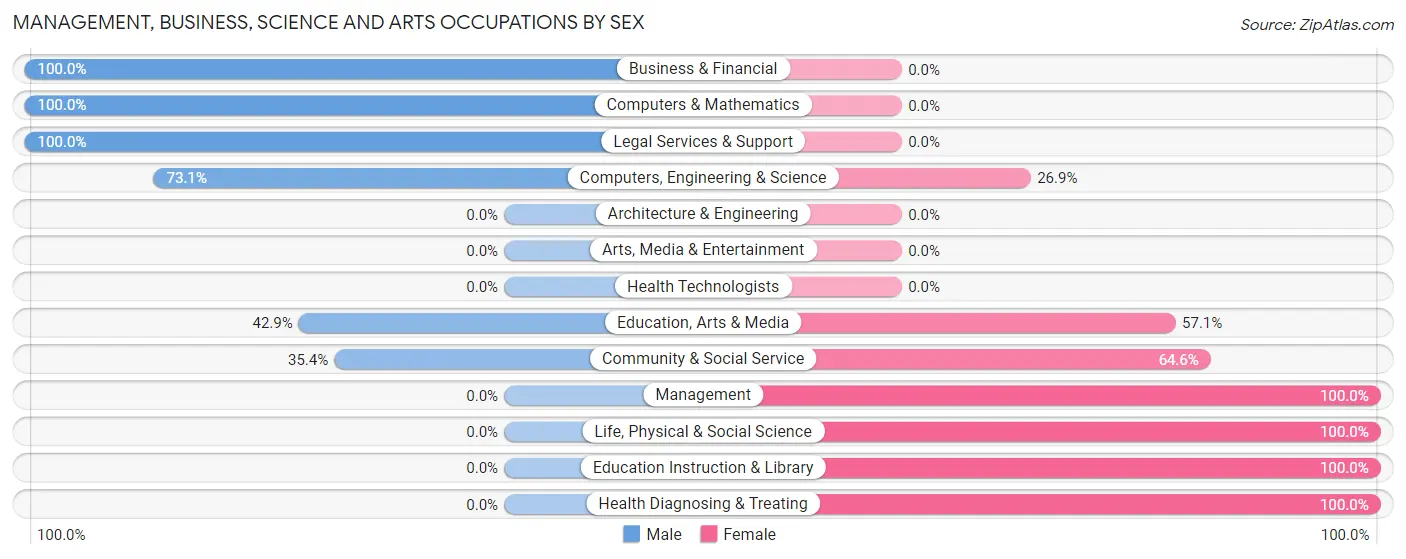
| Occupation | Male | Female |
| Management | 0 (0.0%) | 40 (100.0%) |
| Business & Financial | 6 (100.0%) | 0 (0.0%) |
| Computers, Engineering & Science | 19 (73.1%) | 7 (26.9%) |
| Computers & Mathematics | 19 (100.0%) | 0 (0.0%) |
| Architecture & Engineering | 0 (0.0%) | 0 (0.0%) |
| Life, Physical & Social Science | 0 (0.0%) | 7 (100.0%) |
| Community & Social Service | 28 (35.4%) | 51 (64.6%) |
| Education, Arts & Media | 15 (42.9%) | 20 (57.1%) |
| Legal Services & Support | 13 (100.0%) | 0 (0.0%) |
| Education Instruction & Library | 0 (0.0%) | 31 (100.0%) |
| Arts, Media & Entertainment | 0 (0.0%) | 0 (0.0%) |
| Health Diagnosing & Treating | 0 (0.0%) | 15 (100.0%) |
| Health Technologists | 0 (0.0%) | 0 (0.0%) |
| Total (Category) | 53 (31.9%) | 113 (68.1%) |
| Total (Overall) | 300 (56.4%) | 232 (43.6%) |
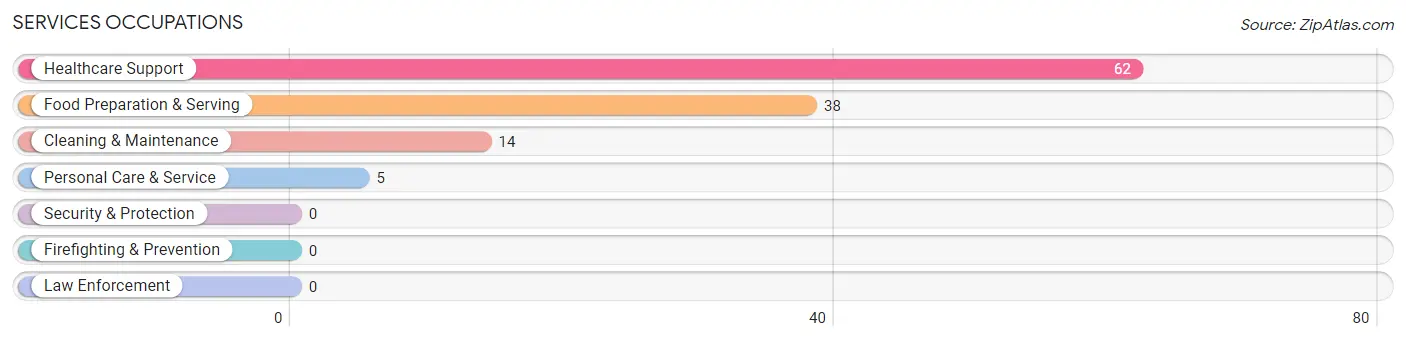
Services Occupations
The most common Services occupations in Boulder are Healthcare Support (62 | 11.7%), Food Preparation & Serving (38 | 7.1%), Cleaning & Maintenance (14 | 2.6%), and Personal Care & Service (5 | 0.9%).
Services Occupations by Sex
Within the Services occupations in Boulder, the most male-oriented occupations are Food Preparation & Serving (73.7%), and Healthcare Support (54.8%), while the most female-oriented occupations are Cleaning & Maintenance (100.0%), Personal Care & Service (100.0%), and Healthcare Support (45.2%).
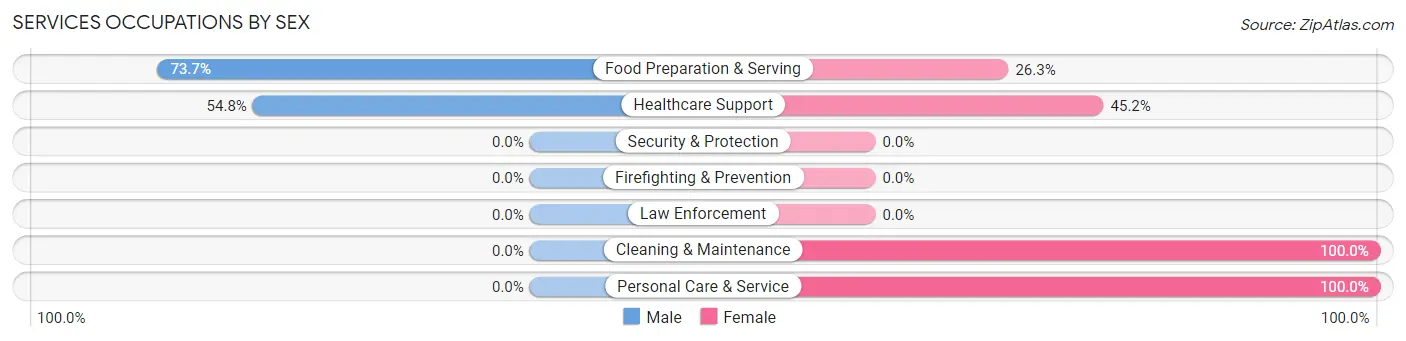
| Occupation | Male | Female |
| Healthcare Support | 34 (54.8%) | 28 (45.2%) |
| Security & Protection | 0 (0.0%) | 0 (0.0%) |
| Firefighting & Prevention | 0 (0.0%) | 0 (0.0%) |
| Law Enforcement | 0 (0.0%) | 0 (0.0%) |
| Food Preparation & Serving | 28 (73.7%) | 10 (26.3%) |
| Cleaning & Maintenance | 0 (0.0%) | 14 (100.0%) |
| Personal Care & Service | 0 (0.0%) | 5 (100.0%) |
| Total (Category) | 62 (52.1%) | 57 (47.9%) |
| Total (Overall) | 300 (56.4%) | 232 (43.6%) |
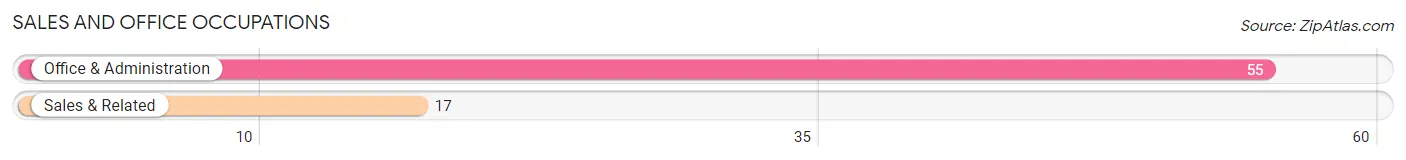
Sales and Office Occupations
The most common Sales and Office occupations in Boulder are Office & Administration (55 | 10.3%), and Sales & Related (17 | 3.2%).
Sales and Office Occupations by Sex
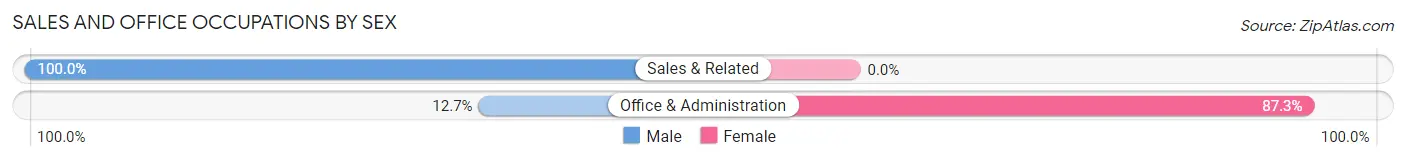
| Occupation | Male | Female |
| Sales & Related | 17 (100.0%) | 0 (0.0%) |
| Office & Administration | 7 (12.7%) | 48 (87.3%) |
| Total (Category) | 24 (33.3%) | 48 (66.7%) |
| Total (Overall) | 300 (56.4%) | 232 (43.6%) |
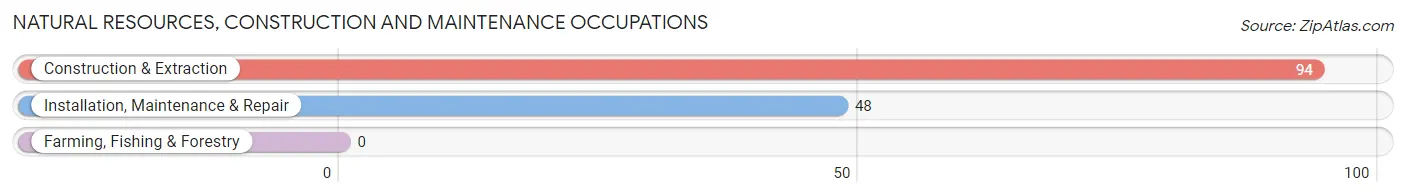
Natural Resources, Construction and Maintenance Occupations
The most common Natural Resources, Construction and Maintenance occupations in Boulder are Construction & Extraction (94 | 17.7%), and Installation, Maintenance & Repair (48 | 9.0%).
Natural Resources, Construction and Maintenance Occupations by Sex
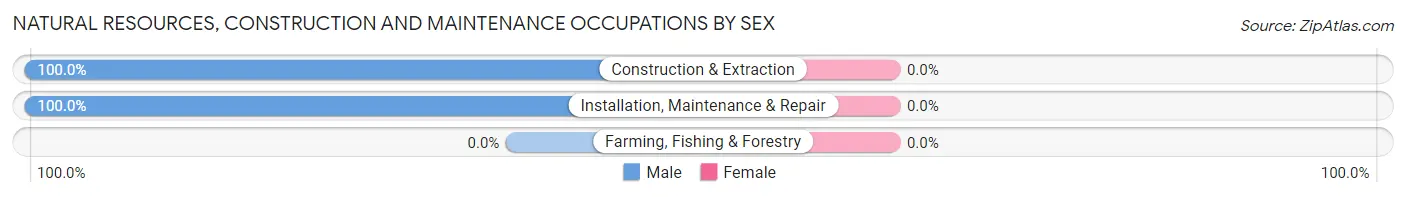
| Occupation | Male | Female |
| Farming, Fishing & Forestry | 0 (0.0%) | 0 (0.0%) |
| Construction & Extraction | 94 (100.0%) | 0 (0.0%) |
| Installation, Maintenance & Repair | 48 (100.0%) | 0 (0.0%) |
| Total (Category) | 142 (100.0%) | 0 (0.0%) |
| Total (Overall) | 300 (56.4%) | 232 (43.6%) |
Production, Transportation and Moving Occupations
The most common Production, Transportation and Moving occupations in Boulder are Production (17 | 3.2%), and Material Moving (16 | 3.0%).
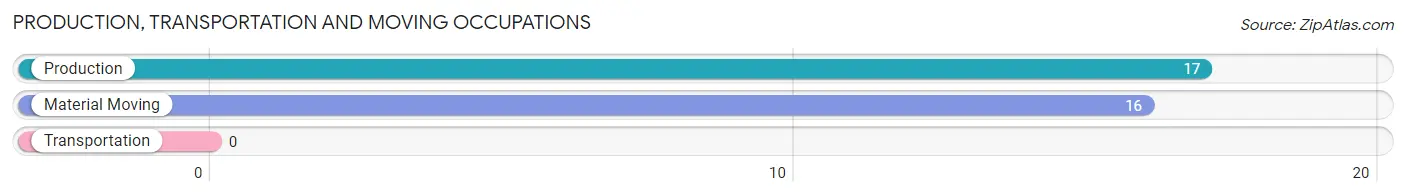
Production, Transportation and Moving Occupations by Sex
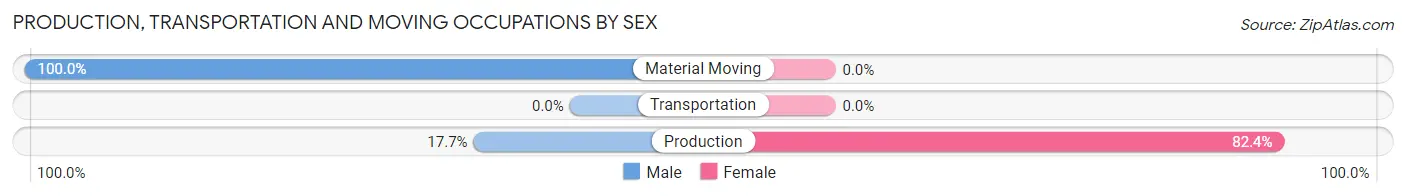
| Occupation | Male | Female |
| Production | 3 (17.6%) | 14 (82.4%) |
| Transportation | 0 (0.0%) | 0 (0.0%) |
| Material Moving | 16 (100.0%) | 0 (0.0%) |
| Total (Category) | 19 (57.6%) | 14 (42.4%) |
| Total (Overall) | 300 (56.4%) | 232 (43.6%) |
Employment Industries by Sex in Boulder
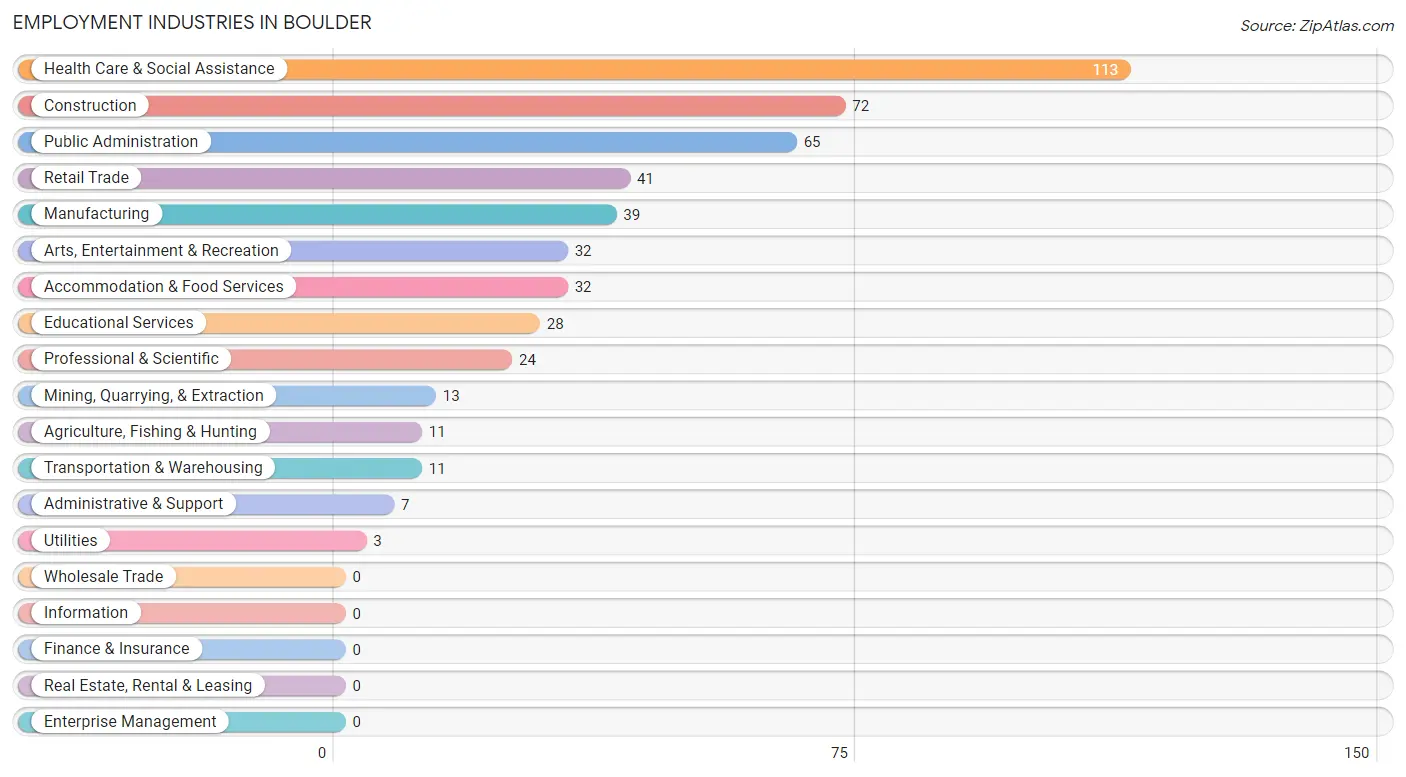
Employment Industries in Boulder
The major employment industries in Boulder include Health Care & Social Assistance (113 | 21.2%), Construction (72 | 13.5%), Public Administration (65 | 12.2%), Retail Trade (41 | 7.7%), and Manufacturing (39 | 7.3%).
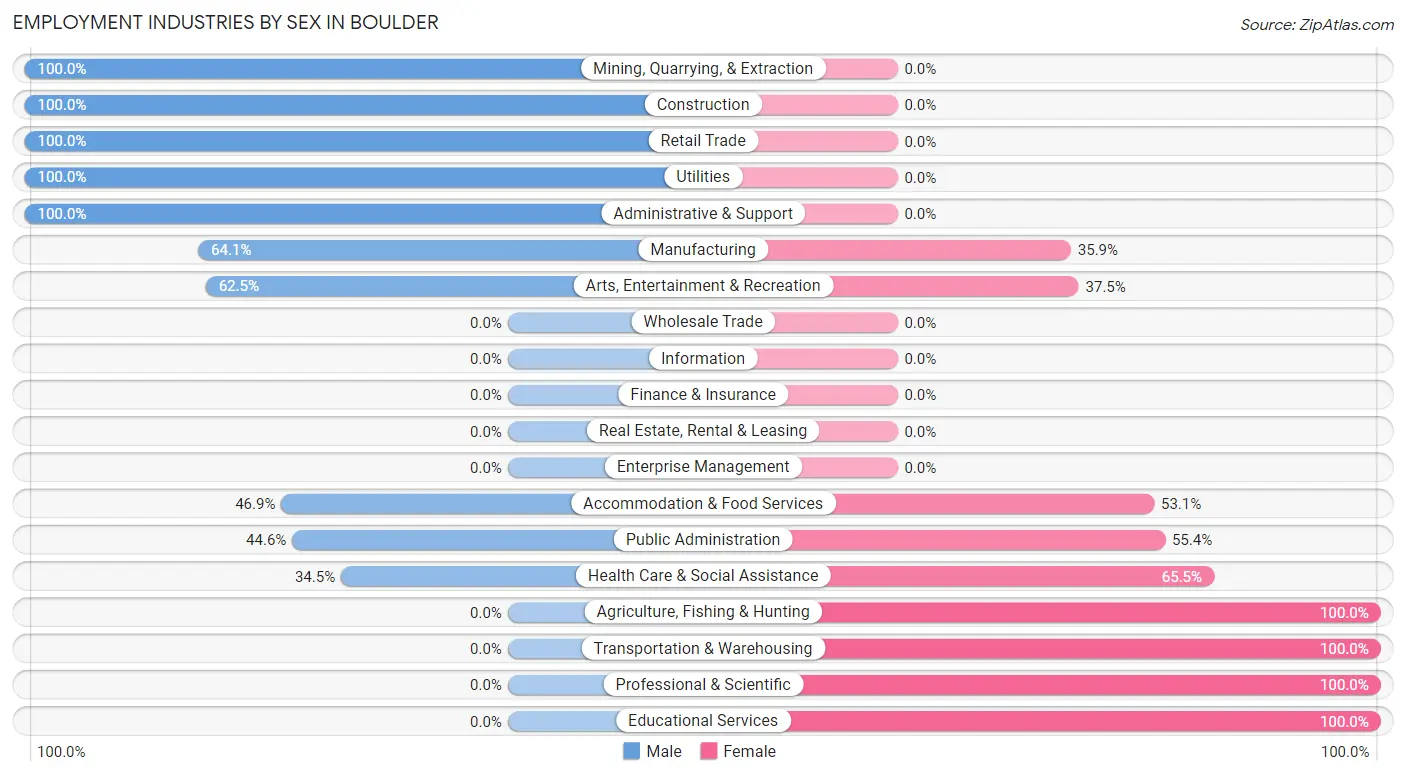
Employment Industries by Sex in Boulder
The Boulder industries that see more men than women are Mining, Quarrying, & Extraction (100.0%), Construction (100.0%), and Retail Trade (100.0%), whereas the industries that tend to have a higher number of women are Agriculture, Fishing & Hunting (100.0%), Transportation & Warehousing (100.0%), and Professional & Scientific (100.0%).
| Industry | Male | Female |
| Agriculture, Fishing & Hunting | 0 (0.0%) | 11 (100.0%) |
| Mining, Quarrying, & Extraction | 13 (100.0%) | 0 (0.0%) |
| Construction | 72 (100.0%) | 0 (0.0%) |
| Manufacturing | 25 (64.1%) | 14 (35.9%) |
| Wholesale Trade | 0 (0.0%) | 0 (0.0%) |
| Retail Trade | 41 (100.0%) | 0 (0.0%) |
| Transportation & Warehousing | 0 (0.0%) | 11 (100.0%) |
| Utilities | 3 (100.0%) | 0 (0.0%) |
| Information | 0 (0.0%) | 0 (0.0%) |
| Finance & Insurance | 0 (0.0%) | 0 (0.0%) |
| Real Estate, Rental & Leasing | 0 (0.0%) | 0 (0.0%) |
| Professional & Scientific | 0 (0.0%) | 24 (100.0%) |
| Enterprise Management | 0 (0.0%) | 0 (0.0%) |
| Administrative & Support | 7 (100.0%) | 0 (0.0%) |
| Educational Services | 0 (0.0%) | 28 (100.0%) |
| Health Care & Social Assistance | 39 (34.5%) | 74 (65.5%) |
| Arts, Entertainment & Recreation | 20 (62.5%) | 12 (37.5%) |
| Accommodation & Food Services | 15 (46.9%) | 17 (53.1%) |
| Public Administration | 29 (44.6%) | 36 (55.4%) |
| Total | 300 (56.4%) | 232 (43.6%) |
Education in Boulder
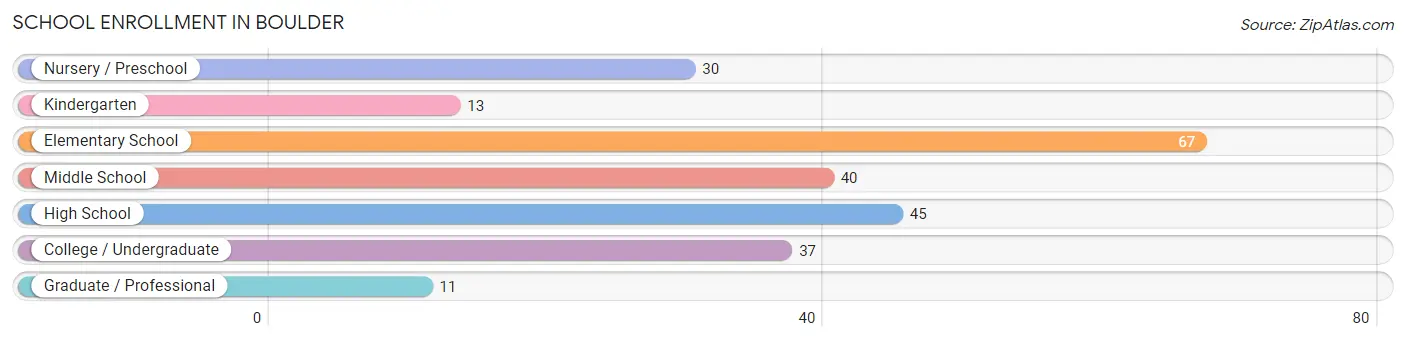
School Enrollment in Boulder
The most common levels of schooling among the 243 students in Boulder are elementary school (67 | 27.6%), high school (45 | 18.5%), and middle school (40 | 16.5%).
| School Level | # Students | % Students |
| Nursery / Preschool | 30 | 12.3% |
| Kindergarten | 13 | 5.3% |
| Elementary School | 67 | 27.6% |
| Middle School | 40 | 16.5% |
| High School | 45 | 18.5% |
| College / Undergraduate | 37 | 15.2% |
| Graduate / Professional | 11 | 4.5% |
| Total | 243 | 100.0% |
School Enrollment by Age by Funding Source in Boulder
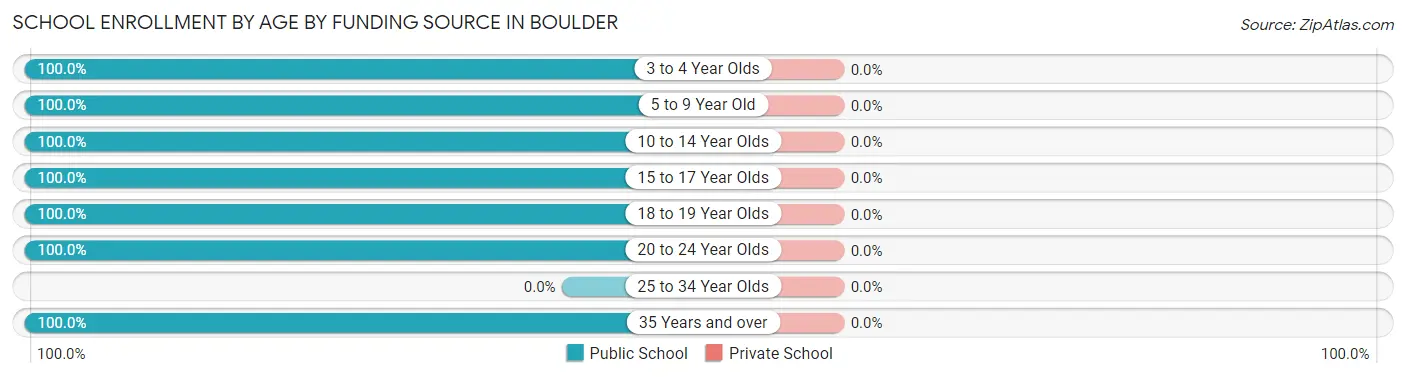
| Age Bracket | Public School | Private School |
| 3 to 4 Year Olds | 17 (100.0%) | 0 (0.0%) |
| 5 to 9 Year Old | 93 (100.0%) | 0 (0.0%) |
| 10 to 14 Year Olds | 40 (100.0%) | 0 (0.0%) |
| 15 to 17 Year Olds | 30 (100.0%) | 0 (0.0%) |
| 18 to 19 Year Olds | 15 (100.0%) | 0 (0.0%) |
| 20 to 24 Year Olds | 25 (100.0%) | 0 (0.0%) |
| 25 to 34 Year Olds | 0 (0.0%) | 0 (0.0%) |
| 35 Years and over | 23 (100.0%) | 0 (0.0%) |
| Total | 243 (100.0%) | 0 (0.0%) |
Educational Attainment by Field of Study in Boulder
Education (50 | 24.0%), science & technology (38 | 18.3%), liberal arts & history (30 | 14.4%), computers & mathematics (19 | 9.1%), and literature & languages (14 | 6.7%) are the most common fields of study among 208 individuals in Boulder who have obtained a bachelor's degree or higher.
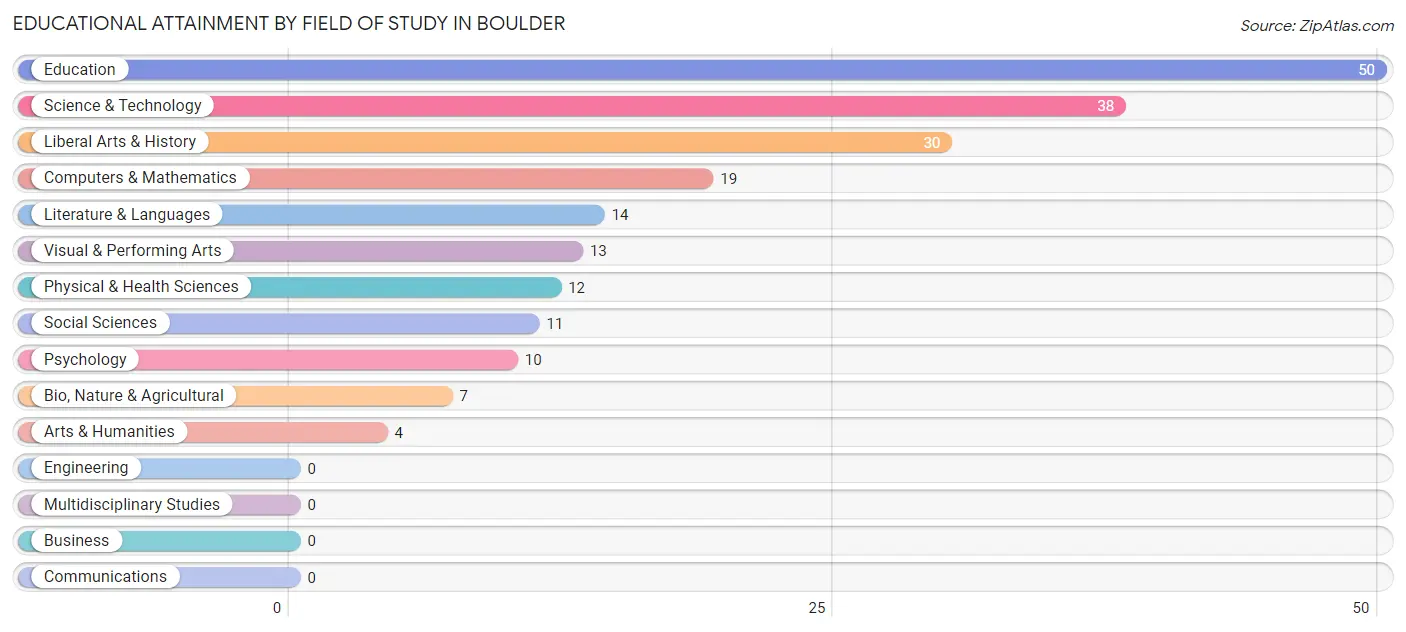
| Field of Study | # Graduates | % Graduates |
| Computers & Mathematics | 19 | 9.1% |
| Bio, Nature & Agricultural | 7 | 3.4% |
| Physical & Health Sciences | 12 | 5.8% |
| Psychology | 10 | 4.8% |
| Social Sciences | 11 | 5.3% |
| Engineering | 0 | 0.0% |
| Multidisciplinary Studies | 0 | 0.0% |
| Science & Technology | 38 | 18.3% |
| Business | 0 | 0.0% |
| Education | 50 | 24.0% |
| Literature & Languages | 14 | 6.7% |
| Liberal Arts & History | 30 | 14.4% |
| Visual & Performing Arts | 13 | 6.2% |
| Communications | 0 | 0.0% |
| Arts & Humanities | 4 | 1.9% |
| Total | 208 | 100.0% |
Transportation & Commute in Boulder
Vehicle Availability by Sex in Boulder
The most prevalent vehicle ownership categories in Boulder are males with 2 vehicles (117, accounting for 41.0%) and females with 2 vehicles (76, making up 50.4%).
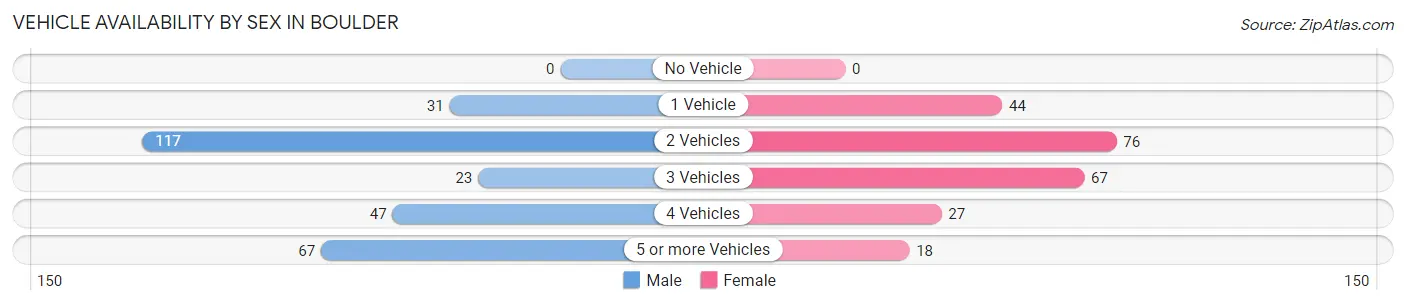
| Vehicles Available | Male | Female |
| No Vehicle | 0 (0.0%) | 0 (0.0%) |
| 1 Vehicle | 31 (10.9%) | 44 (19.0%) |
| 2 Vehicles | 117 (41.0%) | 76 (32.8%) |
| 3 Vehicles | 23 (8.1%) | 67 (28.9%) |
| 4 Vehicles | 47 (16.5%) | 27 (11.6%) |
| 5 or more Vehicles | 67 (23.5%) | 18 (7.8%) |
| Total | 285 (100.0%) | 232 (100.0%) |
Commute Time in Boulder
The most frequently occuring commute durations in Boulder are 30 to 34 minutes (142 commuters, 31.1%), 45 to 59 minutes (102 commuters, 22.4%), and 5 to 9 minutes (82 commuters, 18.0%).
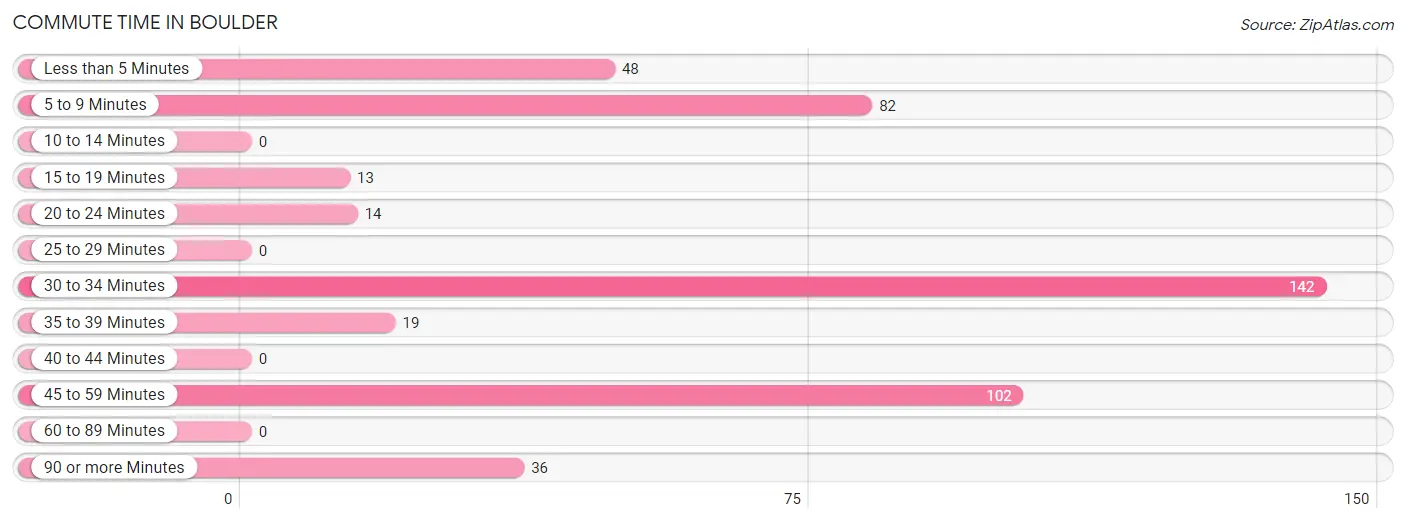
| Commute Time | # Commuters | % Commuters |
| Less than 5 Minutes | 48 | 10.5% |
| 5 to 9 Minutes | 82 | 18.0% |
| 10 to 14 Minutes | 0 | 0.0% |
| 15 to 19 Minutes | 13 | 2.9% |
| 20 to 24 Minutes | 14 | 3.1% |
| 25 to 29 Minutes | 0 | 0.0% |
| 30 to 34 Minutes | 142 | 31.1% |
| 35 to 39 Minutes | 19 | 4.2% |
| 40 to 44 Minutes | 0 | 0.0% |
| 45 to 59 Minutes | 102 | 22.4% |
| 60 to 89 Minutes | 0 | 0.0% |
| 90 or more Minutes | 36 | 7.9% |
Commute Time by Sex in Boulder
The most common commute times in Boulder are 30 to 34 minutes (98 commuters, 37.6%) for males and less than 5 minutes (48 commuters, 24.6%) for females.
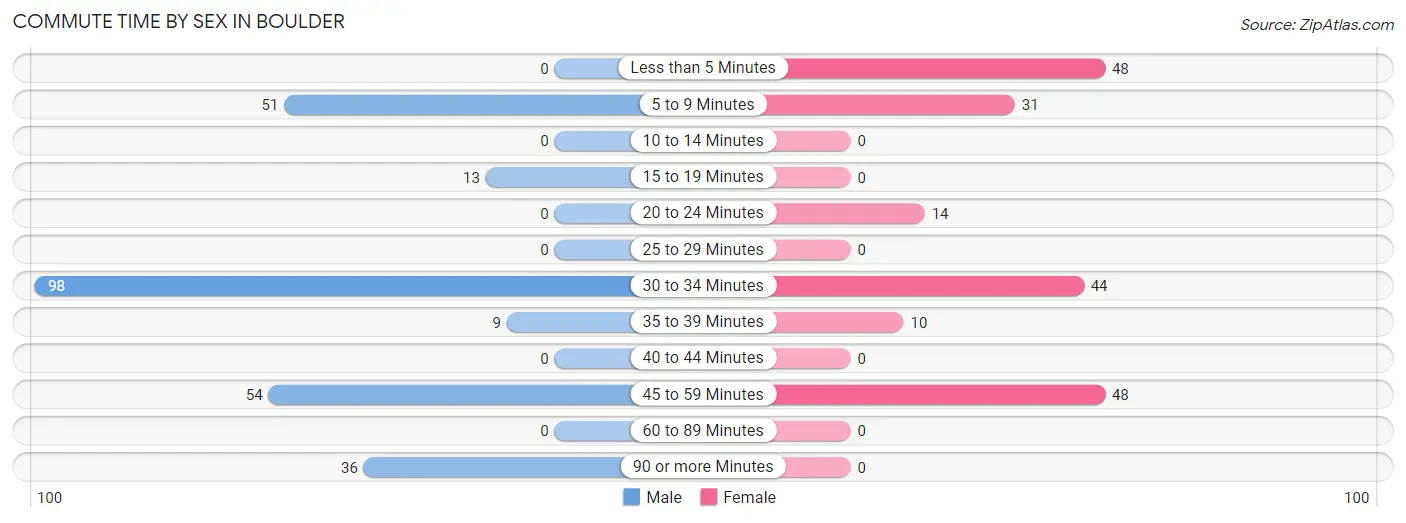
| Commute Time | Male | Female |
| Less than 5 Minutes | 0 (0.0%) | 48 (24.6%) |
| 5 to 9 Minutes | 51 (19.5%) | 31 (15.9%) |
| 10 to 14 Minutes | 0 (0.0%) | 0 (0.0%) |
| 15 to 19 Minutes | 13 (5.0%) | 0 (0.0%) |
| 20 to 24 Minutes | 0 (0.0%) | 14 (7.2%) |
| 25 to 29 Minutes | 0 (0.0%) | 0 (0.0%) |
| 30 to 34 Minutes | 98 (37.6%) | 44 (22.6%) |
| 35 to 39 Minutes | 9 (3.5%) | 10 (5.1%) |
| 40 to 44 Minutes | 0 (0.0%) | 0 (0.0%) |
| 45 to 59 Minutes | 54 (20.7%) | 48 (24.6%) |
| 60 to 89 Minutes | 0 (0.0%) | 0 (0.0%) |
| 90 or more Minutes | 36 (13.8%) | 0 (0.0%) |
Time of Departure to Work by Sex in Boulder
The most frequent times of departure to work in Boulder are 7:30 AM to 7:59 AM (69, 26.4%) for males and 7:00 AM to 7:29 AM (51, 26.2%) for females.
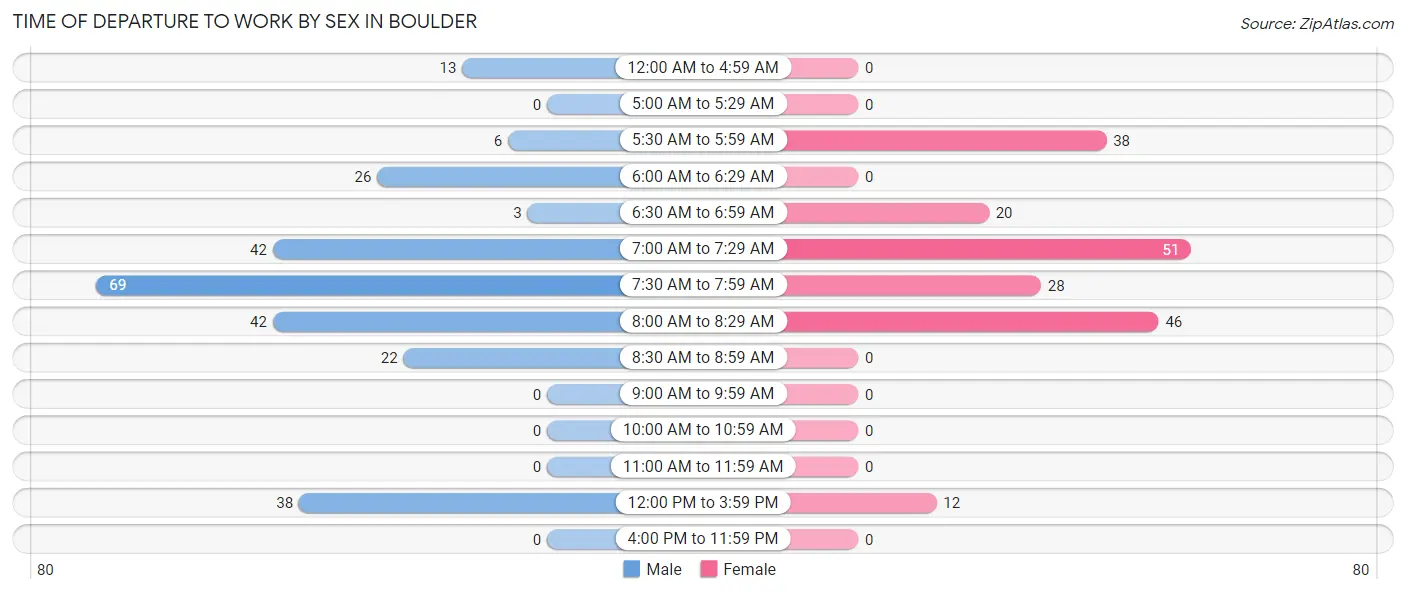
| Time of Departure | Male | Female |
| 12:00 AM to 4:59 AM | 13 (5.0%) | 0 (0.0%) |
| 5:00 AM to 5:29 AM | 0 (0.0%) | 0 (0.0%) |
| 5:30 AM to 5:59 AM | 6 (2.3%) | 38 (19.5%) |
| 6:00 AM to 6:29 AM | 26 (10.0%) | 0 (0.0%) |
| 6:30 AM to 6:59 AM | 3 (1.1%) | 20 (10.3%) |
| 7:00 AM to 7:29 AM | 42 (16.1%) | 51 (26.2%) |
| 7:30 AM to 7:59 AM | 69 (26.4%) | 28 (14.4%) |
| 8:00 AM to 8:29 AM | 42 (16.1%) | 46 (23.6%) |
| 8:30 AM to 8:59 AM | 22 (8.4%) | 0 (0.0%) |
| 9:00 AM to 9:59 AM | 0 (0.0%) | 0 (0.0%) |
| 10:00 AM to 10:59 AM | 0 (0.0%) | 0 (0.0%) |
| 11:00 AM to 11:59 AM | 0 (0.0%) | 0 (0.0%) |
| 12:00 PM to 3:59 PM | 38 (14.6%) | 12 (6.1%) |
| 4:00 PM to 11:59 PM | 0 (0.0%) | 0 (0.0%) |
| Total | 261 (100.0%) | 195 (100.0%) |
Housing Occupancy in Boulder
Occupancy by Ownership in Boulder
Of the total 474 dwellings in Boulder, owner-occupied units account for 329 (69.4%), while renter-occupied units make up 145 (30.6%).
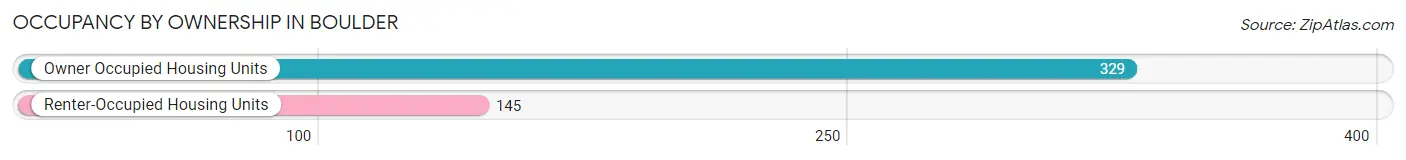
| Occupancy | # Housing Units | % Housing Units |
| Owner Occupied Housing Units | 329 | 69.4% |
| Renter-Occupied Housing Units | 145 | 30.6% |
| Total Occupied Housing Units | 474 | 100.0% |
Occupancy by Household Size in Boulder
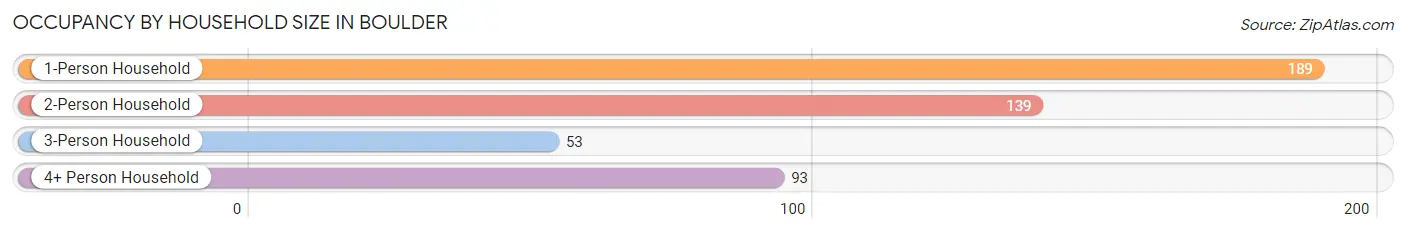
| Household Size | # Housing Units | % Housing Units |
| 1-Person Household | 189 | 39.9% |
| 2-Person Household | 139 | 29.3% |
| 3-Person Household | 53 | 11.2% |
| 4+ Person Household | 93 | 19.6% |
| Total Housing Units | 474 | 100.0% |
Occupancy by Ownership by Household Size in Boulder
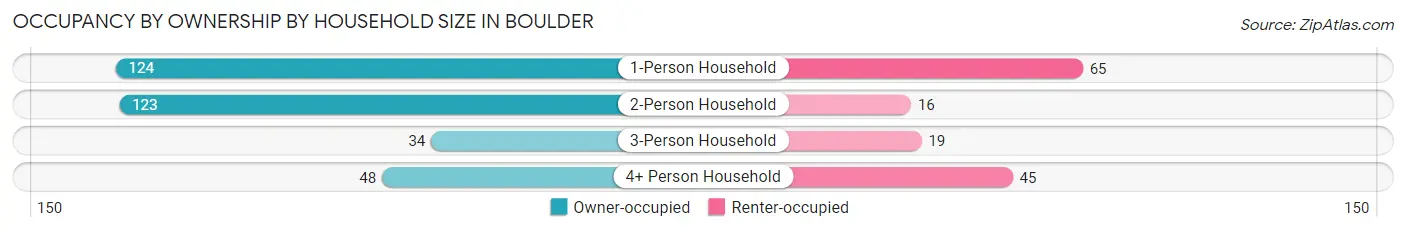
| Household Size | Owner-occupied | Renter-occupied |
| 1-Person Household | 124 (65.6%) | 65 (34.4%) |
| 2-Person Household | 123 (88.5%) | 16 (11.5%) |
| 3-Person Household | 34 (64.1%) | 19 (35.8%) |
| 4+ Person Household | 48 (51.6%) | 45 (48.4%) |
| Total Housing Units | 329 (69.4%) | 145 (30.6%) |
Occupancy by Educational Attainment in Boulder
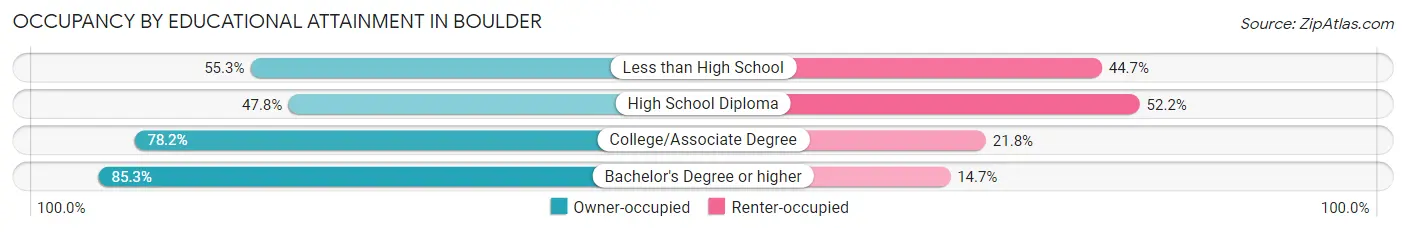
| Household Size | Owner-occupied | Renter-occupied |
| Less than High School | 21 (55.3%) | 17 (44.7%) |
| High School Diploma | 64 (47.8%) | 70 (52.2%) |
| College/Associate Degree | 151 (78.2%) | 42 (21.8%) |
| Bachelor's Degree or higher | 93 (85.3%) | 16 (14.7%) |
Occupancy by Age of Householder in Boulder
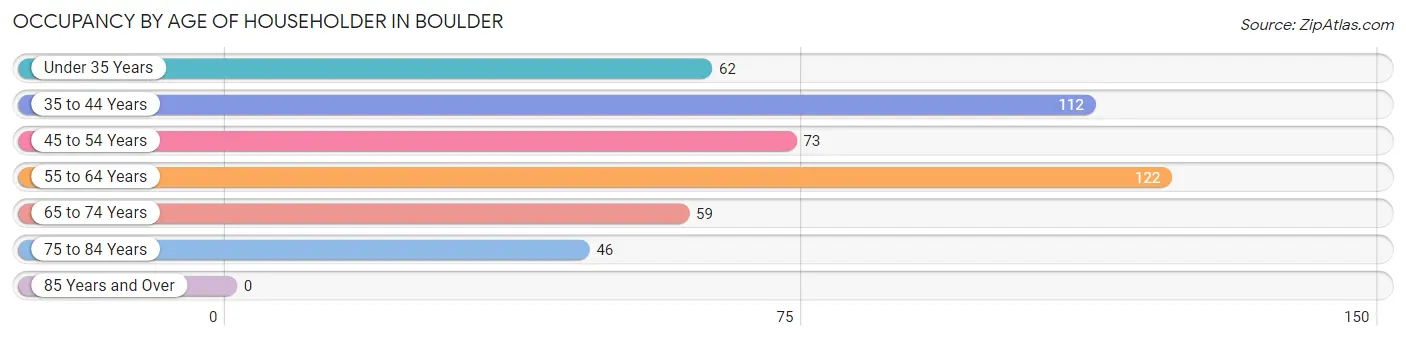
| Age Bracket | # Households | % Households |
| Under 35 Years | 62 | 13.1% |
| 35 to 44 Years | 112 | 23.6% |
| 45 to 54 Years | 73 | 15.4% |
| 55 to 64 Years | 122 | 25.7% |
| 65 to 74 Years | 59 | 12.4% |
| 75 to 84 Years | 46 | 9.7% |
| 85 Years and Over | 0 | 0.0% |
| Total | 474 | 100.0% |
Housing Finances in Boulder
Median Income by Occupancy in Boulder
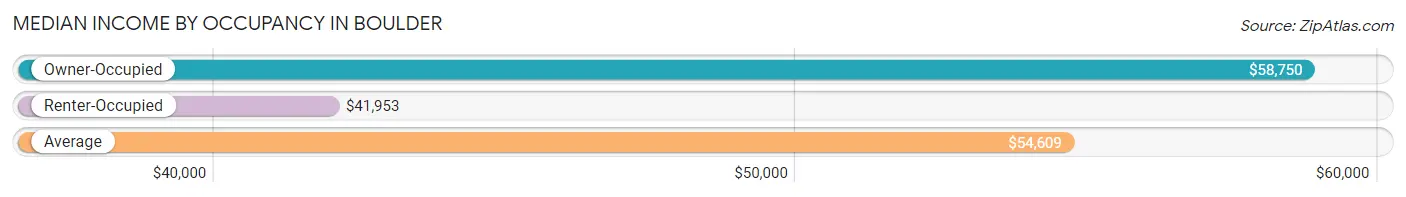
| Occupancy Type | # Households | Median Income |
| Owner-Occupied | 329 (69.4%) | $58,750 |
| Renter-Occupied | 145 (30.6%) | $41,953 |
| Average | 474 (100.0%) | $54,609 |
Occupancy by Householder Income Bracket in Boulder
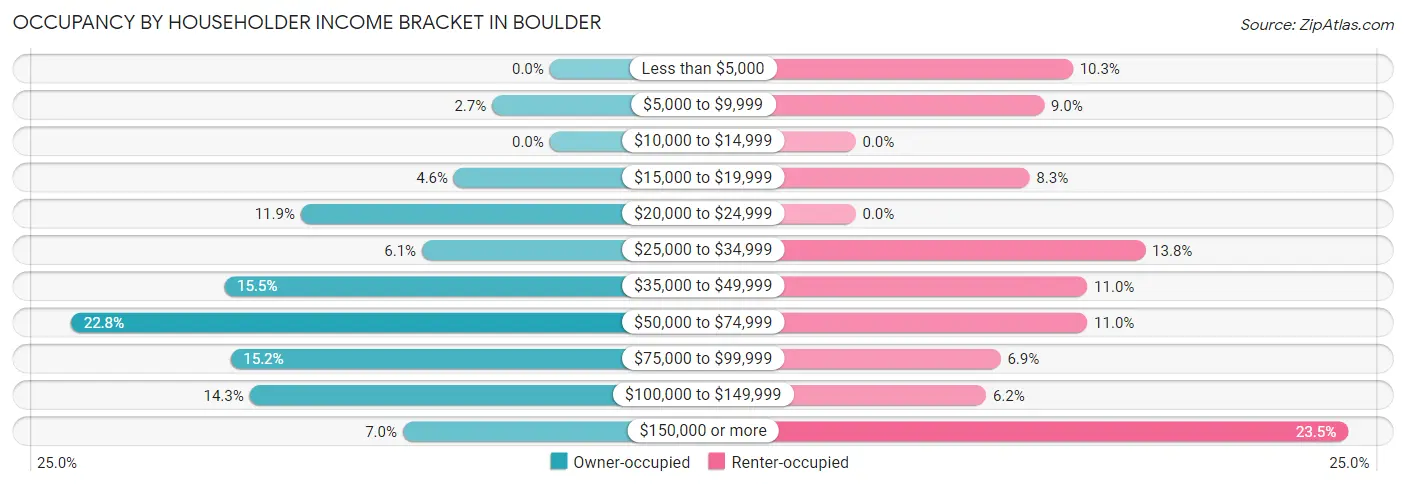
| Income Bracket | Owner-occupied | Renter-occupied |
| Less than $5,000 | 0 (0.0%) | 15 (10.3%) |
| $5,000 to $9,999 | 9 (2.7%) | 13 (9.0%) |
| $10,000 to $14,999 | 0 (0.0%) | 0 (0.0%) |
| $15,000 to $19,999 | 15 (4.6%) | 12 (8.3%) |
| $20,000 to $24,999 | 39 (11.8%) | 0 (0.0%) |
| $25,000 to $34,999 | 20 (6.1%) | 20 (13.8%) |
| $35,000 to $49,999 | 51 (15.5%) | 16 (11.0%) |
| $50,000 to $74,999 | 75 (22.8%) | 16 (11.0%) |
| $75,000 to $99,999 | 50 (15.2%) | 10 (6.9%) |
| $100,000 to $149,999 | 47 (14.3%) | 9 (6.2%) |
| $150,000 or more | 23 (7.0%) | 34 (23.4%) |
| Total | 329 (100.0%) | 145 (100.0%) |
Monthly Housing Cost Tiers in Boulder
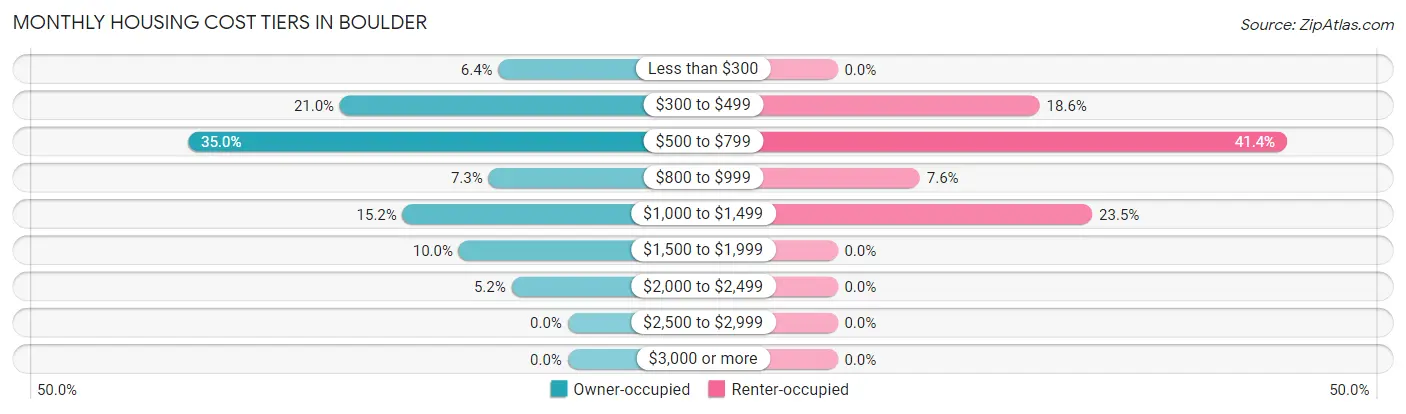
| Monthly Cost | Owner-occupied | Renter-occupied |
| Less than $300 | 21 (6.4%) | 0 (0.0%) |
| $300 to $499 | 69 (21.0%) | 27 (18.6%) |
| $500 to $799 | 115 (34.9%) | 60 (41.4%) |
| $800 to $999 | 24 (7.3%) | 11 (7.6%) |
| $1,000 to $1,499 | 50 (15.2%) | 34 (23.4%) |
| $1,500 to $1,999 | 33 (10.0%) | 0 (0.0%) |
| $2,000 to $2,499 | 17 (5.2%) | 0 (0.0%) |
| $2,500 to $2,999 | 0 (0.0%) | 0 (0.0%) |
| $3,000 or more | 0 (0.0%) | 0 (0.0%) |
| Total | 329 (100.0%) | 145 (100.0%) |
Physical Housing Characteristics in Boulder
Housing Structures in Boulder
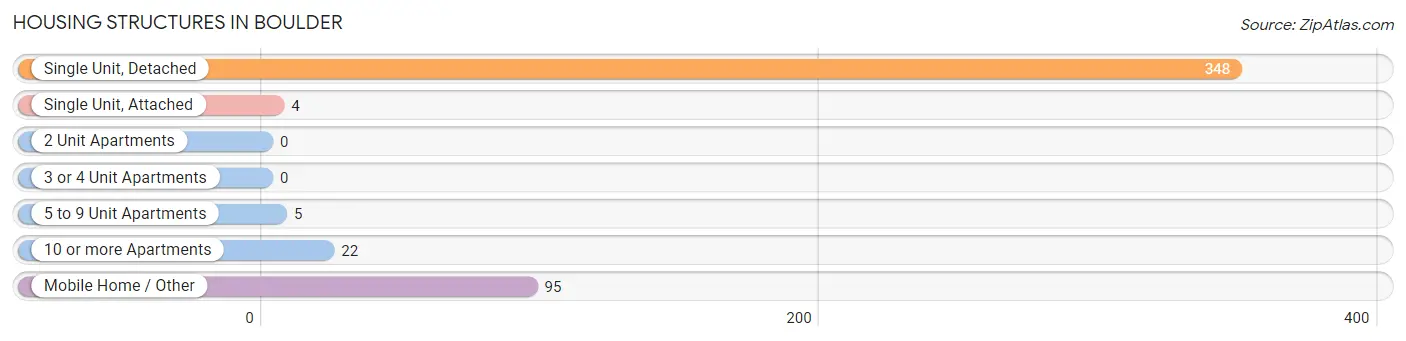
| Structure Type | # Housing Units | % Housing Units |
| Single Unit, Detached | 348 | 73.4% |
| Single Unit, Attached | 4 | 0.8% |
| 2 Unit Apartments | 0 | 0.0% |
| 3 or 4 Unit Apartments | 0 | 0.0% |
| 5 to 9 Unit Apartments | 5 | 1.1% |
| 10 or more Apartments | 22 | 4.6% |
| Mobile Home / Other | 95 | 20.0% |
| Total | 474 | 100.0% |
Housing Structures by Occupancy in Boulder
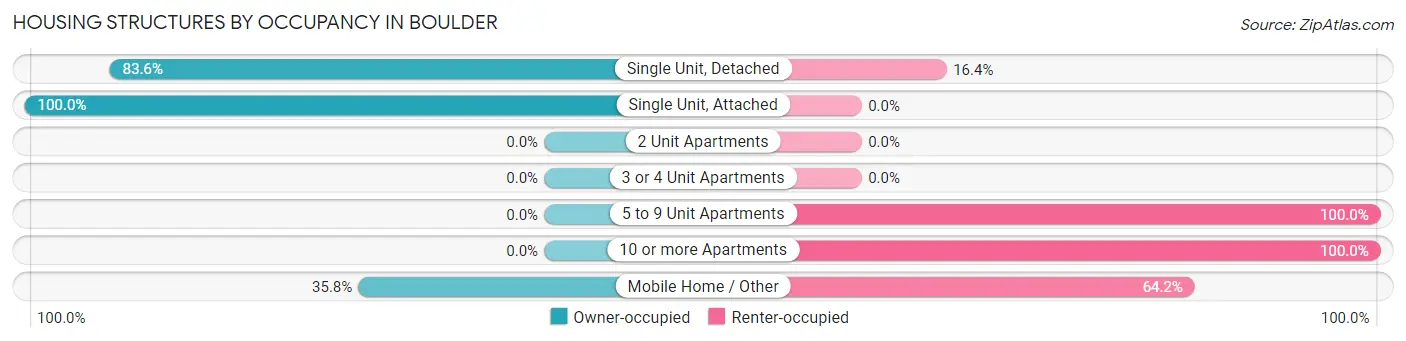
| Structure Type | Owner-occupied | Renter-occupied |
| Single Unit, Detached | 291 (83.6%) | 57 (16.4%) |
| Single Unit, Attached | 4 (100.0%) | 0 (0.0%) |
| 2 Unit Apartments | 0 (0.0%) | 0 (0.0%) |
| 3 or 4 Unit Apartments | 0 (0.0%) | 0 (0.0%) |
| 5 to 9 Unit Apartments | 0 (0.0%) | 5 (100.0%) |
| 10 or more Apartments | 0 (0.0%) | 22 (100.0%) |
| Mobile Home / Other | 34 (35.8%) | 61 (64.2%) |
| Total | 329 (69.4%) | 145 (30.6%) |
Housing Structures by Number of Rooms in Boulder
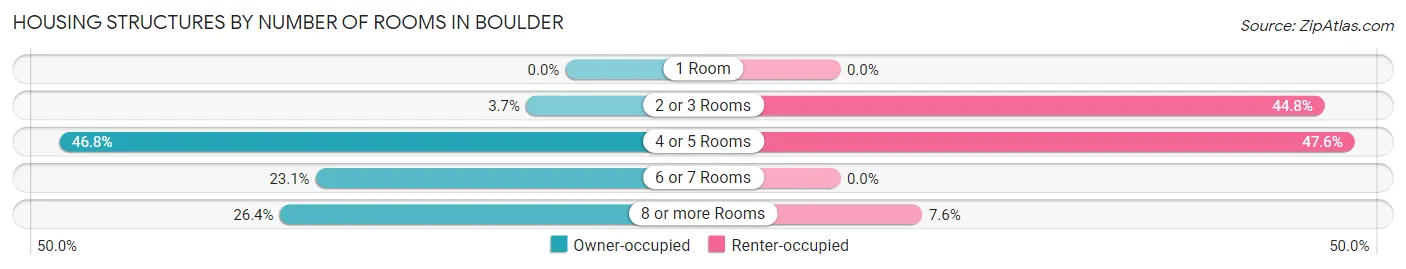
| Number of Rooms | Owner-occupied | Renter-occupied |
| 1 Room | 0 (0.0%) | 0 (0.0%) |
| 2 or 3 Rooms | 12 (3.6%) | 65 (44.8%) |
| 4 or 5 Rooms | 154 (46.8%) | 69 (47.6%) |
| 6 or 7 Rooms | 76 (23.1%) | 0 (0.0%) |
| 8 or more Rooms | 87 (26.4%) | 11 (7.6%) |
| Total | 329 (100.0%) | 145 (100.0%) |
Housing Structure by Heating Type in Boulder
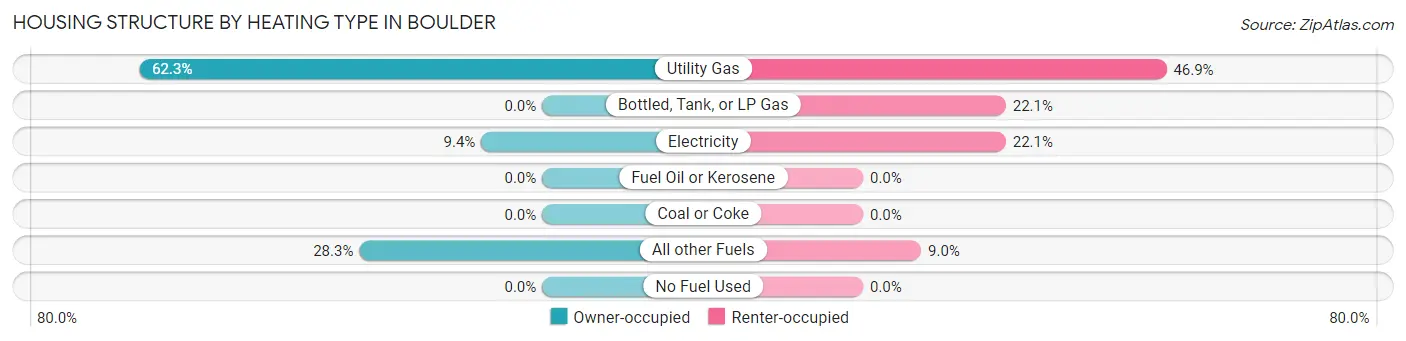
| Heating Type | Owner-occupied | Renter-occupied |
| Utility Gas | 205 (62.3%) | 68 (46.9%) |
| Bottled, Tank, or LP Gas | 0 (0.0%) | 32 (22.1%) |
| Electricity | 31 (9.4%) | 32 (22.1%) |
| Fuel Oil or Kerosene | 0 (0.0%) | 0 (0.0%) |
| Coal or Coke | 0 (0.0%) | 0 (0.0%) |
| All other Fuels | 93 (28.3%) | 13 (9.0%) |
| No Fuel Used | 0 (0.0%) | 0 (0.0%) |
| Total | 329 (100.0%) | 145 (100.0%) |
Household Vehicle Usage in Boulder
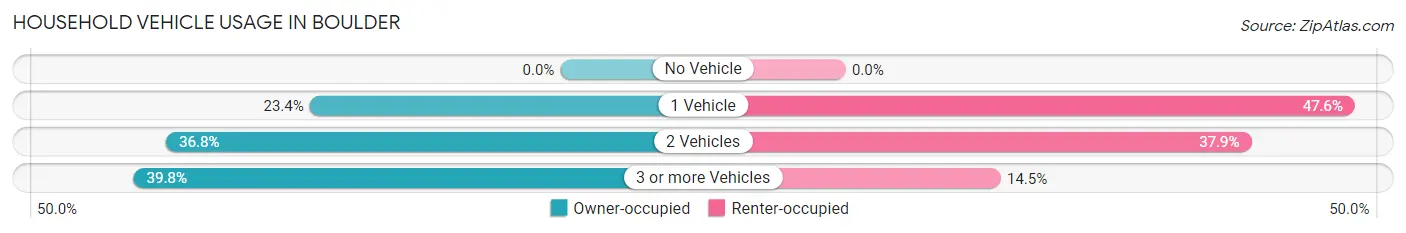
| Vehicles per Household | Owner-occupied | Renter-occupied |
| No Vehicle | 0 (0.0%) | 0 (0.0%) |
| 1 Vehicle | 77 (23.4%) | 69 (47.6%) |
| 2 Vehicles | 121 (36.8%) | 55 (37.9%) |
| 3 or more Vehicles | 131 (39.8%) | 21 (14.5%) |
| Total | 329 (100.0%) | 145 (100.0%) |
Real Estate & Mortgages in Boulder
Real Estate and Mortgage Overview in Boulder
| Characteristic | Without Mortgage | With Mortgage |
| Housing Units | 181 | 148 |
| Median Property Value | $188,500 | $198,500 |
| Median Household Income | $49,450 | $13 |
| Monthly Housing Costs | $511 | $0 |
| Real Estate Taxes | $1,910 | $0 |
Property Value by Mortgage Status in Boulder
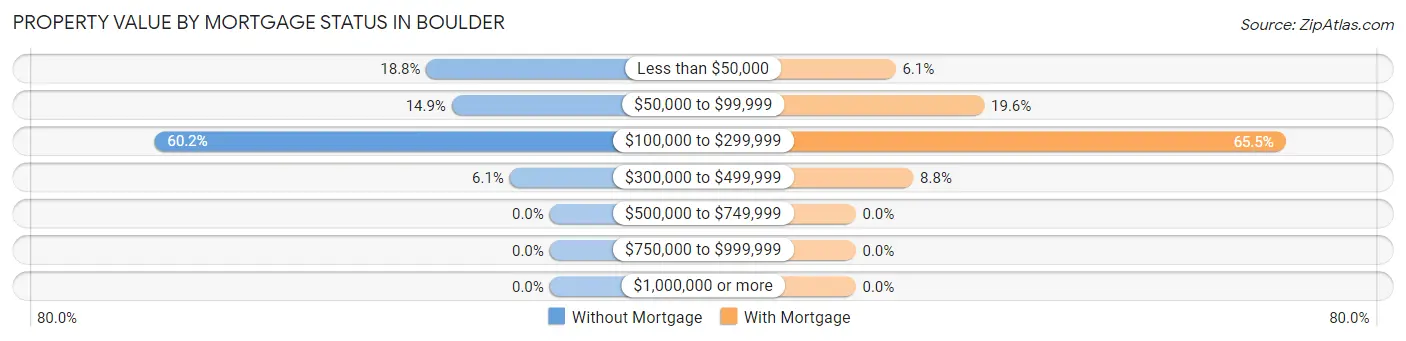
| Property Value | Without Mortgage | With Mortgage |
| Less than $50,000 | 34 (18.8%) | 9 (6.1%) |
| $50,000 to $99,999 | 27 (14.9%) | 29 (19.6%) |
| $100,000 to $299,999 | 109 (60.2%) | 97 (65.5%) |
| $300,000 to $499,999 | 11 (6.1%) | 13 (8.8%) |
| $500,000 to $749,999 | 0 (0.0%) | 0 (0.0%) |
| $750,000 to $999,999 | 0 (0.0%) | 0 (0.0%) |
| $1,000,000 or more | 0 (0.0%) | 0 (0.0%) |
| Total | 181 (100.0%) | 148 (100.0%) |
Household Income by Mortgage Status in Boulder
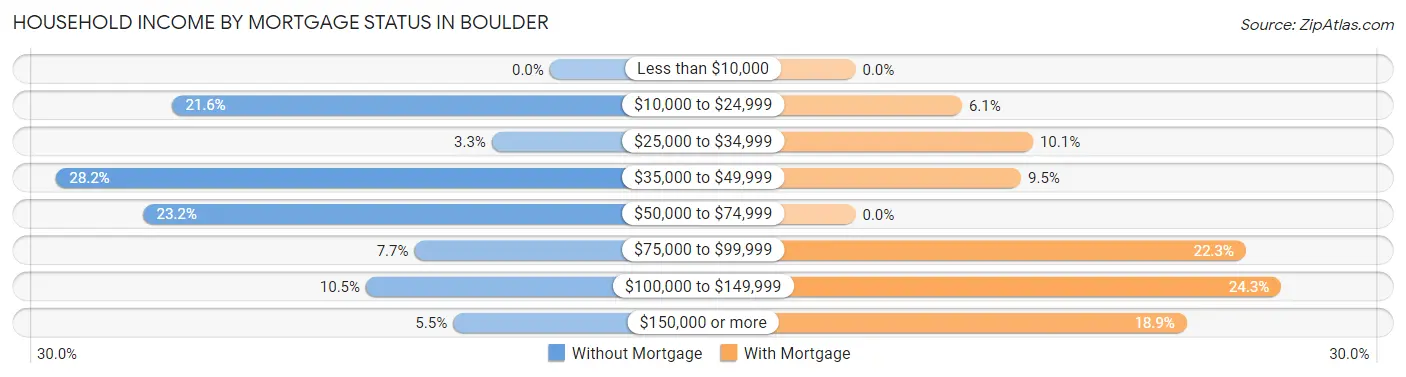
| Household Income | Without Mortgage | With Mortgage |
| Less than $10,000 | 0 (0.0%) | 0 (0.0%) |
| $10,000 to $24,999 | 39 (21.5%) | 9 (6.1%) |
| $25,000 to $34,999 | 6 (3.3%) | 15 (10.1%) |
| $35,000 to $49,999 | 51 (28.2%) | 14 (9.5%) |
| $50,000 to $74,999 | 42 (23.2%) | 0 (0.0%) |
| $75,000 to $99,999 | 14 (7.7%) | 33 (22.3%) |
| $100,000 to $149,999 | 19 (10.5%) | 36 (24.3%) |
| $150,000 or more | 10 (5.5%) | 28 (18.9%) |
| Total | 181 (100.0%) | 148 (100.0%) |
Property Value to Household Income Ratio in Boulder
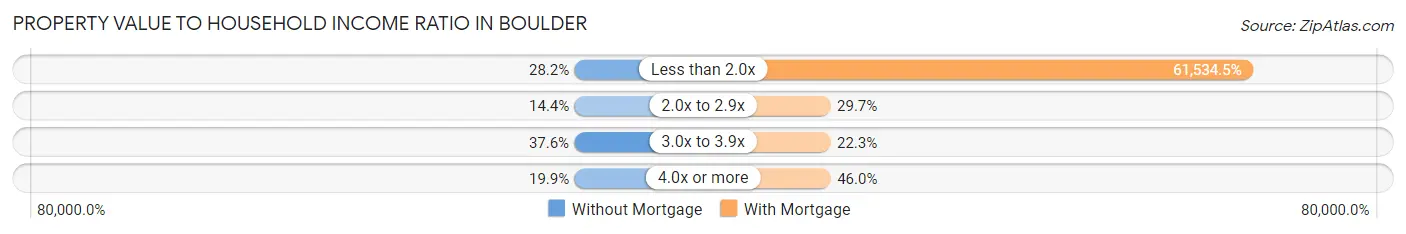
| Value-to-Income Ratio | Without Mortgage | With Mortgage |
| Less than 2.0x | 51 (28.2%) | 91,071 (61,534.5%) |
| 2.0x to 2.9x | 26 (14.4%) | 44 (29.7%) |
| 3.0x to 3.9x | 68 (37.6%) | 33 (22.3%) |
| 4.0x or more | 36 (19.9%) | 68 (46.0%) |
| Total | 181 (100.0%) | 148 (100.0%) |
Real Estate Taxes by Mortgage Status in Boulder
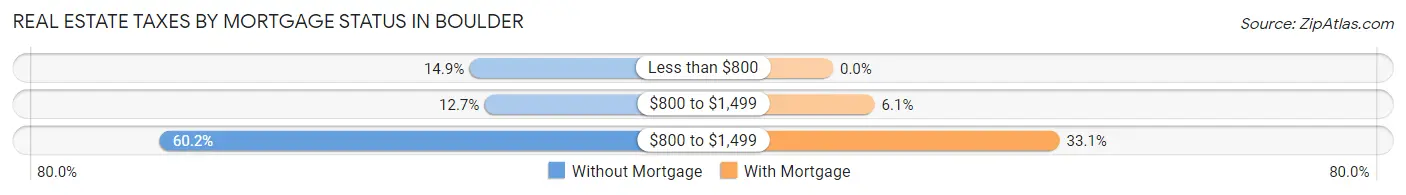
| Property Taxes | Without Mortgage | With Mortgage |
| Less than $800 | 27 (14.9%) | 0 (0.0%) |
| $800 to $1,499 | 23 (12.7%) | 9 (6.1%) |
| $800 to $1,499 | 109 (60.2%) | 49 (33.1%) |
| Total | 181 (100.0%) | 148 (100.0%) |
Health & Disability in Boulder
Health Insurance Coverage by Age in Boulder
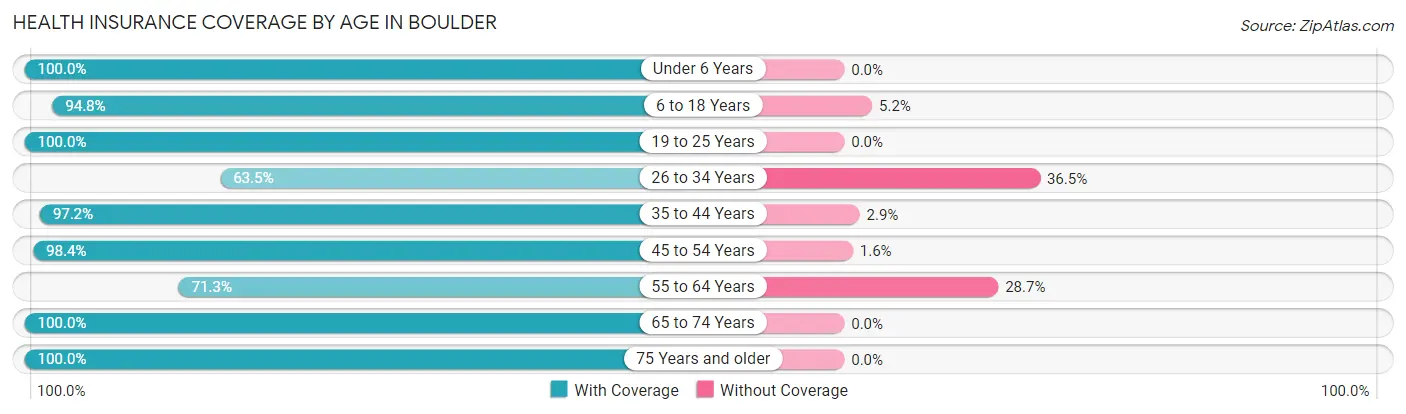
| Age Bracket | With Coverage | Without Coverage |
| Under 6 Years | 96 (100.0%) | 0 (0.0%) |
| 6 to 18 Years | 183 (94.8%) | 10 (5.2%) |
| 19 to 25 Years | 101 (100.0%) | 0 (0.0%) |
| 26 to 34 Years | 47 (63.5%) | 27 (36.5%) |
| 35 to 44 Years | 239 (97.2%) | 7 (2.9%) |
| 45 to 54 Years | 123 (98.4%) | 2 (1.6%) |
| 55 to 64 Years | 144 (71.3%) | 58 (28.7%) |
| 65 to 74 Years | 79 (100.0%) | 0 (0.0%) |
| 75 Years and older | 66 (100.0%) | 0 (0.0%) |
| Total | 1,078 (91.2%) | 104 (8.8%) |
Health Insurance Coverage by Citizenship Status in Boulder
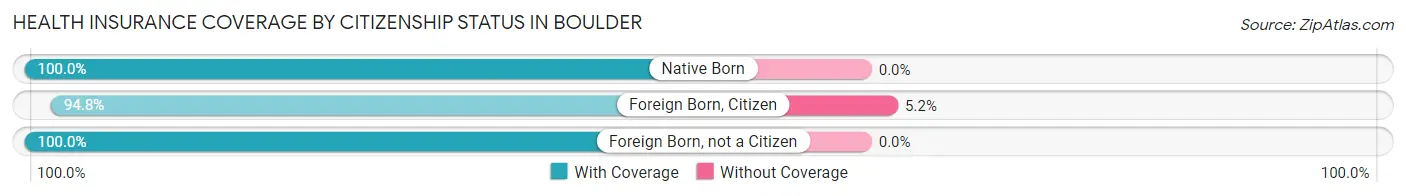
| Citizenship Status | With Coverage | Without Coverage |
| Native Born | 96 (100.0%) | 0 (0.0%) |
| Foreign Born, Citizen | 183 (94.8%) | 10 (5.2%) |
| Foreign Born, not a Citizen | 101 (100.0%) | 0 (0.0%) |
Health Insurance Coverage by Household Income in Boulder
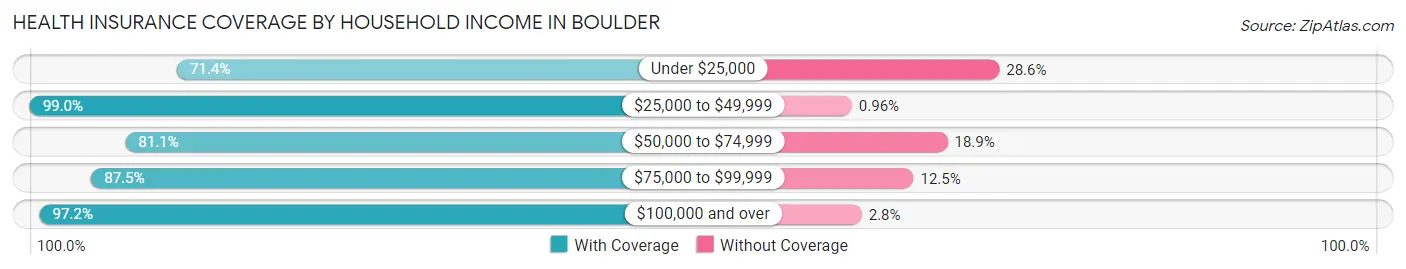
| Household Income | With Coverage | Without Coverage |
| Under $25,000 | 90 (71.4%) | 36 (28.6%) |
| $25,000 to $49,999 | 206 (99.0%) | 2 (1.0%) |
| $50,000 to $74,999 | 159 (81.1%) | 37 (18.9%) |
| $75,000 to $99,999 | 119 (87.5%) | 17 (12.5%) |
| $100,000 and over | 415 (97.2%) | 12 (2.8%) |
Public vs Private Health Insurance Coverage by Age in Boulder
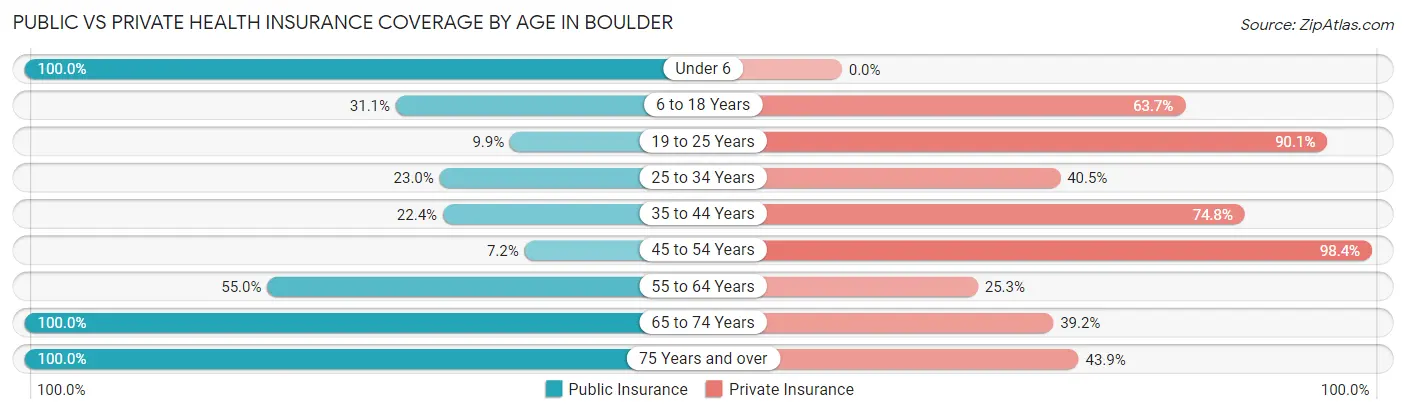
| Age Bracket | Public Insurance | Private Insurance |
| Under 6 | 96 (100.0%) | 0 (0.0%) |
| 6 to 18 Years | 60 (31.1%) | 123 (63.7%) |
| 19 to 25 Years | 10 (9.9%) | 91 (90.1%) |
| 25 to 34 Years | 17 (23.0%) | 30 (40.5%) |
| 35 to 44 Years | 55 (22.4%) | 184 (74.8%) |
| 45 to 54 Years | 9 (7.2%) | 123 (98.4%) |
| 55 to 64 Years | 111 (54.9%) | 51 (25.3%) |
| 65 to 74 Years | 79 (100.0%) | 31 (39.2%) |
| 75 Years and over | 66 (100.0%) | 29 (43.9%) |
| Total | 503 (42.5%) | 662 (56.0%) |
Disability Status by Sex by Age in Boulder
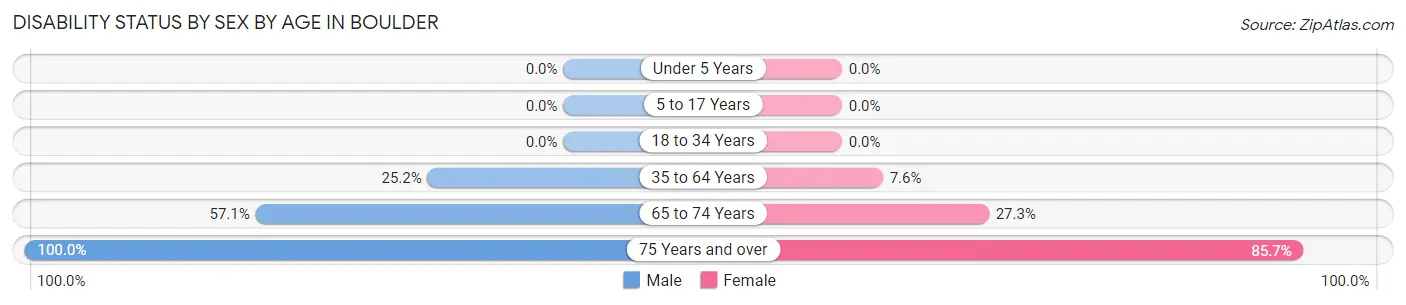
| Age Bracket | Male | Female |
| Under 5 Years | 0 (0.0%) | 0 (0.0%) |
| 5 to 17 Years | 0 (0.0%) | 0 (0.0%) |
| 18 to 34 Years | 0 (0.0%) | 0 (0.0%) |
| 35 to 64 Years | 88 (25.2%) | 17 (7.6%) |
| 65 to 74 Years | 20 (57.1%) | 12 (27.3%) |
| 75 Years and over | 38 (100.0%) | 24 (85.7%) |
Disability Class by Sex by Age in Boulder
Disability Class: Hearing Difficulty
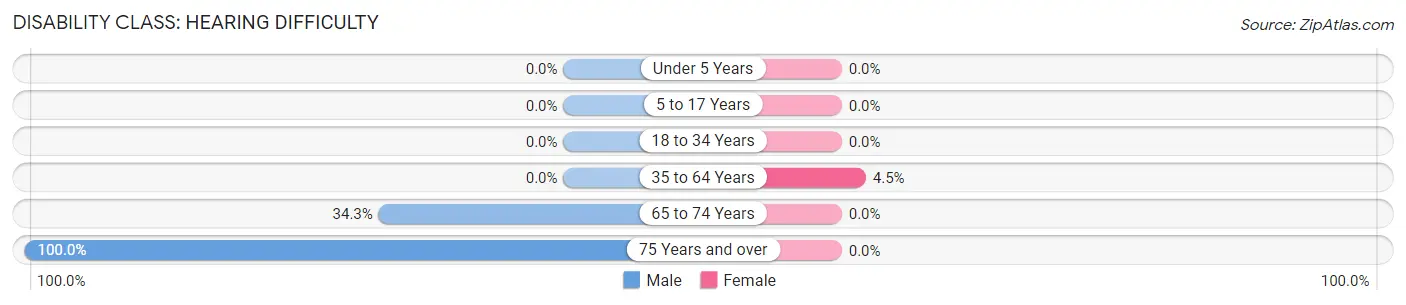
| Age Bracket | Male | Female |
| Under 5 Years | 0 (0.0%) | 0 (0.0%) |
| 5 to 17 Years | 0 (0.0%) | 0 (0.0%) |
| 18 to 34 Years | 0 (0.0%) | 0 (0.0%) |
| 35 to 64 Years | 0 (0.0%) | 10 (4.5%) |
| 65 to 74 Years | 12 (34.3%) | 0 (0.0%) |
| 75 Years and over | 38 (100.0%) | 0 (0.0%) |
Disability Class: Vision Difficulty
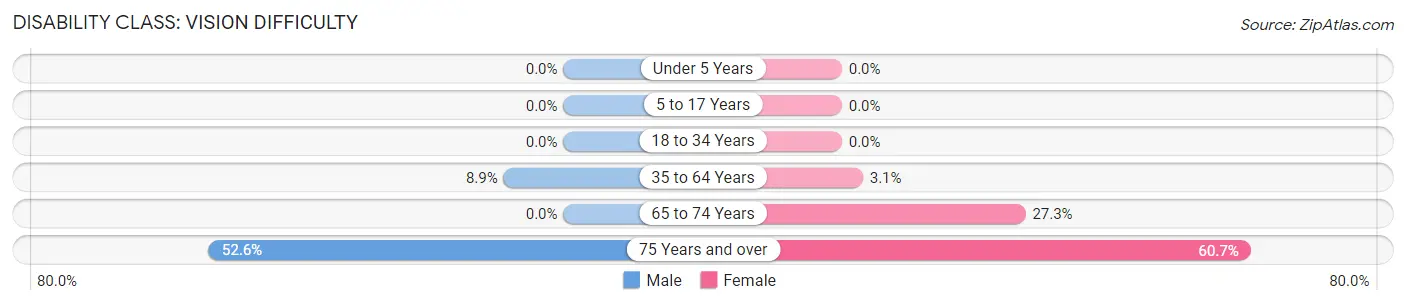
| Age Bracket | Male | Female |
| Under 5 Years | 0 (0.0%) | 0 (0.0%) |
| 5 to 17 Years | 0 (0.0%) | 0 (0.0%) |
| 18 to 34 Years | 0 (0.0%) | 0 (0.0%) |
| 35 to 64 Years | 31 (8.9%) | 7 (3.1%) |
| 65 to 74 Years | 0 (0.0%) | 12 (27.3%) |
| 75 Years and over | 20 (52.6%) | 17 (60.7%) |
Disability Class: Cognitive Difficulty
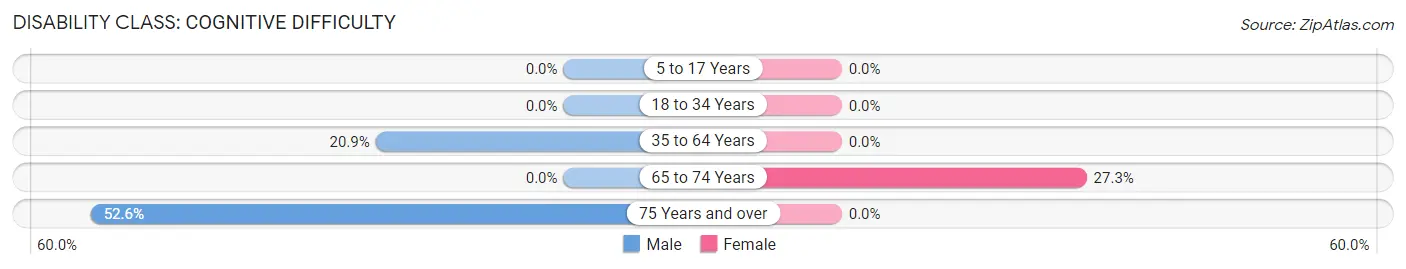
| Age Bracket | Male | Female |
| 5 to 17 Years | 0 (0.0%) | 0 (0.0%) |
| 18 to 34 Years | 0 (0.0%) | 0 (0.0%) |
| 35 to 64 Years | 73 (20.9%) | 0 (0.0%) |
| 65 to 74 Years | 0 (0.0%) | 12 (27.3%) |
| 75 Years and over | 20 (52.6%) | 0 (0.0%) |
Disability Class: Ambulatory Difficulty
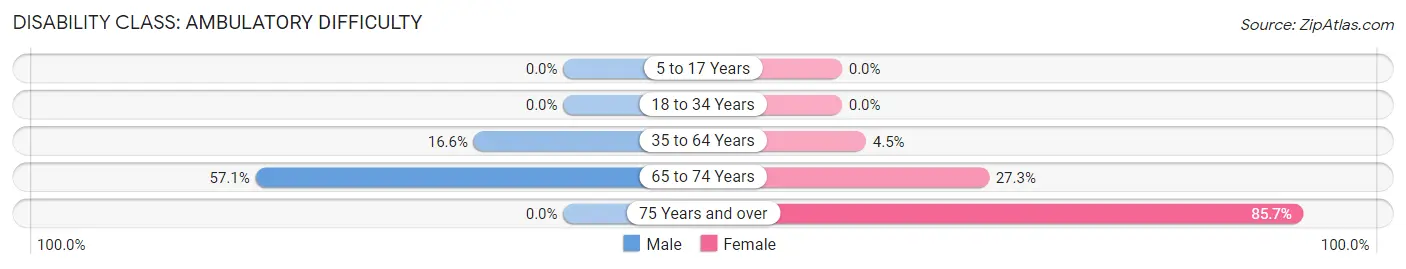
| Age Bracket | Male | Female |
| 5 to 17 Years | 0 (0.0%) | 0 (0.0%) |
| 18 to 34 Years | 0 (0.0%) | 0 (0.0%) |
| 35 to 64 Years | 58 (16.6%) | 10 (4.5%) |
| 65 to 74 Years | 20 (57.1%) | 12 (27.3%) |
| 75 Years and over | 0 (0.0%) | 24 (85.7%) |
Disability Class: Self-Care Difficulty
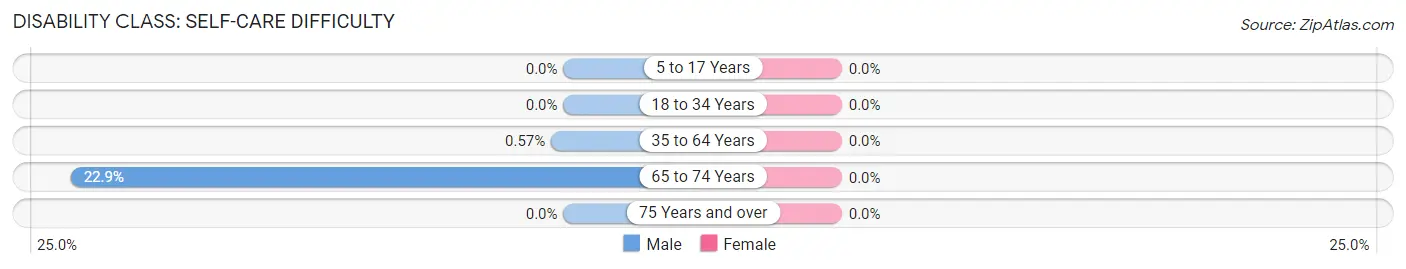
| Age Bracket | Male | Female |
| 5 to 17 Years | 0 (0.0%) | 0 (0.0%) |
| 18 to 34 Years | 0 (0.0%) | 0 (0.0%) |
| 35 to 64 Years | 2 (0.6%) | 0 (0.0%) |
| 65 to 74 Years | 8 (22.9%) | 0 (0.0%) |
| 75 Years and over | 0 (0.0%) | 0 (0.0%) |
Technology Access in Boulder
Computing Device Access in Boulder
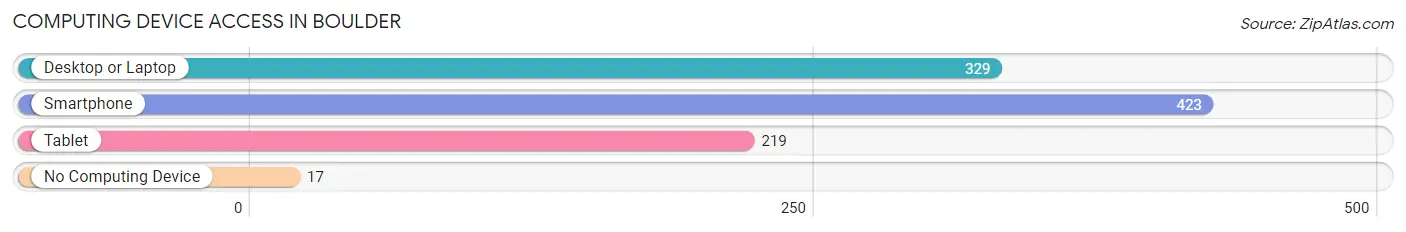
| Device Type | # Households | % Households |
| Desktop or Laptop | 329 | 69.4% |
| Smartphone | 423 | 89.2% |
| Tablet | 219 | 46.2% |
| No Computing Device | 17 | 3.6% |
| Total | 474 | 100.0% |
Internet Access in Boulder
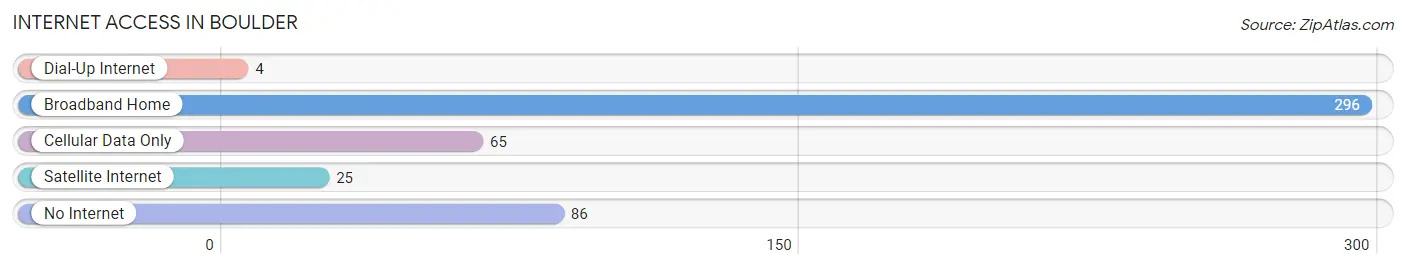
| Internet Type | # Households | % Households |
| Dial-Up Internet | 4 | 0.8% |
| Broadband Home | 296 | 62.5% |
| Cellular Data Only | 65 | 13.7% |
| Satellite Internet | 25 | 5.3% |
| No Internet | 86 | 18.1% |
| Total | 474 | 100.0% |
Boulder Summary
Boulder, Montana is a small town located in the southwestern part of the state, in Jefferson County. It is situated at the base of the Tobacco Root Mountains, and is surrounded by the beautiful scenery of the Rocky Mountains. The town has a population of just over 1,000 people, and is known for its small-town charm and friendly atmosphere.
History
Boulder was founded in 1864 by a group of miners who were searching for gold in the Tobacco Root Mountains. The town was originally called “Gold Hill”, but was later changed to Boulder. The town was officially incorporated in 1887, and has been a part of Montana ever since.
The town has a rich history, and was once a bustling mining town. The town was home to several saloons, hotels, and other businesses that catered to the miners. The town also had a school, a post office, and a newspaper.
Geography
Boulder is located in the southwestern part of Montana, in Jefferson County. The town is situated at the base of the Tobacco Root Mountains, and is surrounded by the beautiful scenery of the Rocky Mountains. The town is located at an elevation of 4,890 feet, and has a total area of 1.2 square miles.
The town is located near several rivers, including the Boulder River, the Jefferson River, and the Madison River. The town is also located near several lakes, including the Boulder Lake, the Madison Lake, and the Jefferson Lake.
Economy
The economy of Boulder is largely based on tourism. The town is a popular destination for outdoor enthusiasts, and is home to several ski resorts, hiking trails, and other recreational activities. The town is also home to several restaurants, bars, and other businesses that cater to tourists.
The town is also home to several small businesses, including a grocery store, a hardware store, and a gas station. The town is also home to several small manufacturing companies, including a furniture factory and a woodworking shop.
Demographics
As of the 2010 census, the population of Boulder was 1,037. The town has a population density of 845 people per square mile. The median age of the population is 44.7 years, and the median household income is $41,944.
The town is predominantly white, with 92.3% of the population identifying as white. The town also has a small Hispanic population, with 4.2% of the population identifying as Hispanic or Latino. The town also has a small Native American population, with 1.2% of the population identifying as Native American.
Conclusion
Boulder, Montana is a small town located in the southwestern part of the state, in Jefferson County. The town has a population of just over 1,000 people, and is known for its small-town charm and friendly atmosphere. The town has a rich history, and was once a bustling mining town. The economy of Boulder is largely based on tourism, and the town is home to several small businesses. The town is predominantly white, with 92.3% of the population identifying as white.
Common Questions
What is Per Capita Income in Boulder?
Per Capita income in Boulder is $29,549.
What is the Median Household income in Boulder?
Median Household Income in Boulder is $54,609.
What is Income or Wage Gap in Boulder?
Income or Wage Gap in Boulder is 20.4%.
Women in Boulder earn 79.6 cents for every dollar earned by a man.
What is Inequality or Gini Index in Boulder?
Inequality or Gini Index in Boulder is 0.41.
What is the Total Population of Boulder?
Total Population of Boulder is 1,214.
What is the Total Male Population of Boulder?
Total Male Population of Boulder is 664.
What is the Total Female Population of Boulder?
Total Female Population of Boulder is 550.
What is the Ratio of Males per 100 Females in Boulder?
There are 120.73 Males per 100 Females in Boulder.
What is the Ratio of Females per 100 Males in Boulder?
There are 82.83 Females per 100 Males in Boulder.
What is the Median Population Age in Boulder?
Median Population Age in Boulder is 41.3 Years.
What is the Average Family Size in Boulder
Average Family Size in Boulder is 3.2 People.
What is the Average Household Size in Boulder
Average Household Size in Boulder is 2.3 People.
How Large is the Labor Force in Boulder?
There are 566 People in the Labor Forcein in Boulder.
What is the Percentage of People in the Labor Force in Boulder?
57.4% of People are in the Labor Force in Boulder.
What is the Unemployment Rate in Boulder?
Unemployment Rate in Boulder is 6.0%.