Zip Codes with the Highest Percentage of Population Employed in Manufacturing in Billings, MT
RELATED REPORTS & OPTIONS
Manufacturing
Billings
Compare Zip Codes
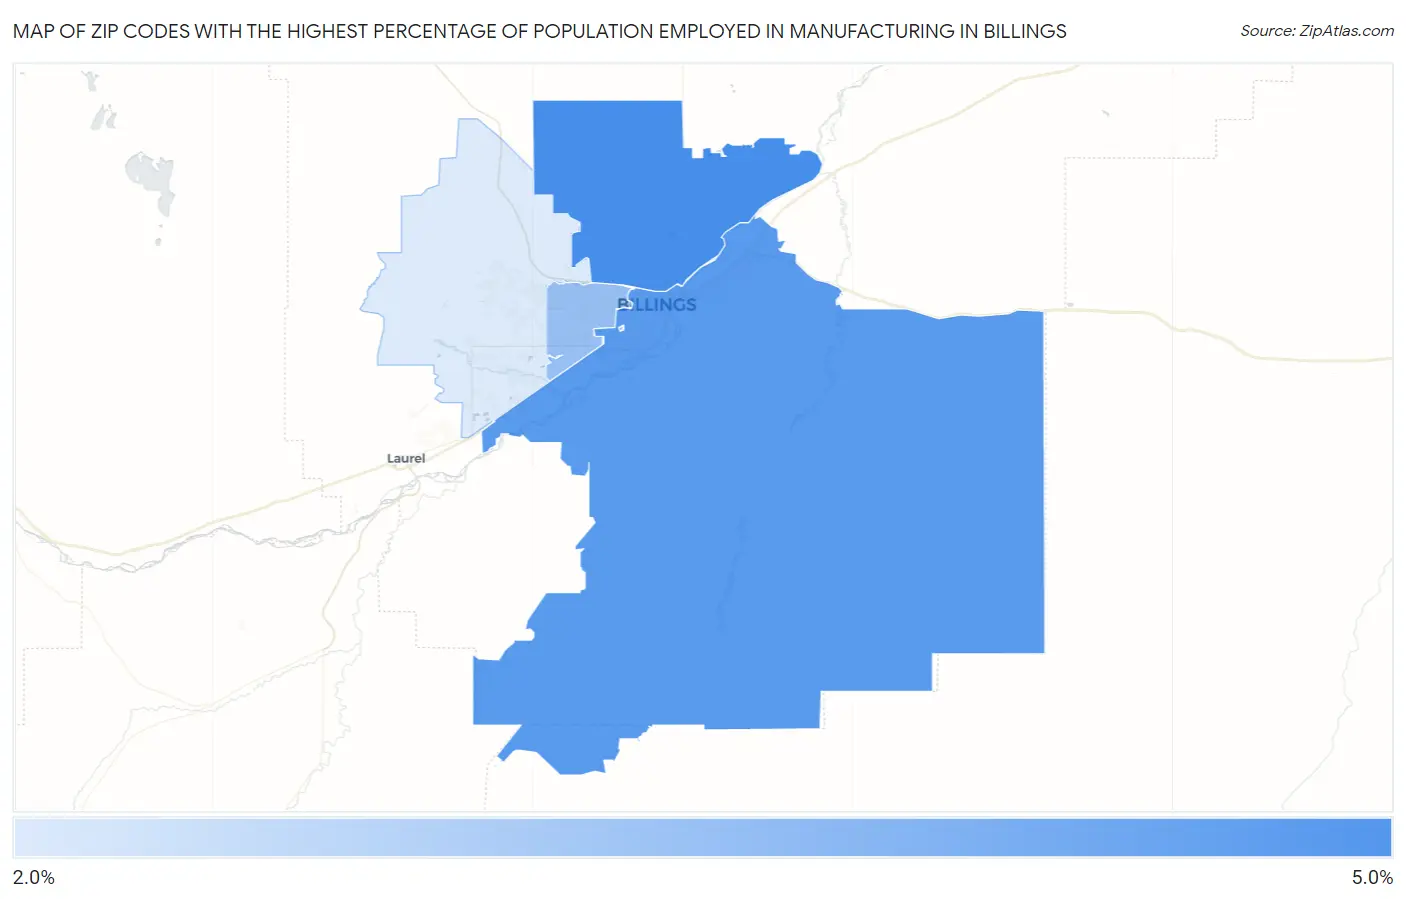
Map of Zip Codes with the Highest Percentage of Population Employed in Manufacturing in Billings
0.0%
5.0%
Zip Codes with the Highest Percentage of Population Employed in Manufacturing in Billings, MT
| Zip Code | % Employed | vs State | vs National | |
| 1. | 59105 | 4.9% | 4.8%(+0.074)#108 | 10.0%(-5.13)#24,669 |
| 2. | 59101 | 4.7% | 4.8%(-0.122)#114 | 10.0%(-5.33)#24,978 |
| 3. | 59102 | 3.9% | 4.8%(-0.929)#126 | 10.0%(-6.14)#26,274 |
| 4. | 59106 | 3.0% | 4.8%(-1.80)#149 | 10.0%(-7.00)#27,430 |
1
Common Questions
What are the Top 3 Zip Codes with the Highest Percentage of Population Employed in Manufacturing in Billings, MT?
Top 3 Zip Codes with the Highest Percentage of Population Employed in Manufacturing in Billings, MT are:
What zip code has the Highest Percentage of Population Employed in Manufacturing in Billings, MT?
59105 has the Highest Percentage of Population Employed in Manufacturing in Billings, MT with 4.9%.
What is the Percentage of Population Employed in Manufacturing in Billings, MT?
Percentage of Population Employed in Manufacturing in Billings is 3.9%.
What is the Percentage of Population Employed in Manufacturing in Montana?
Percentage of Population Employed in Manufacturing in Montana is 4.8%.
What is the Percentage of Population Employed in Manufacturing in the United States?
Percentage of Population Employed in Manufacturing in the United States is 10.0%.