Zip Codes with the Highest Percentage of Population Employed in Agriculture, Fishing & Hunting in Billings, MT
RELATED REPORTS & OPTIONS
Agriculture, Fishing & Hunting
Billings
Compare Zip Codes
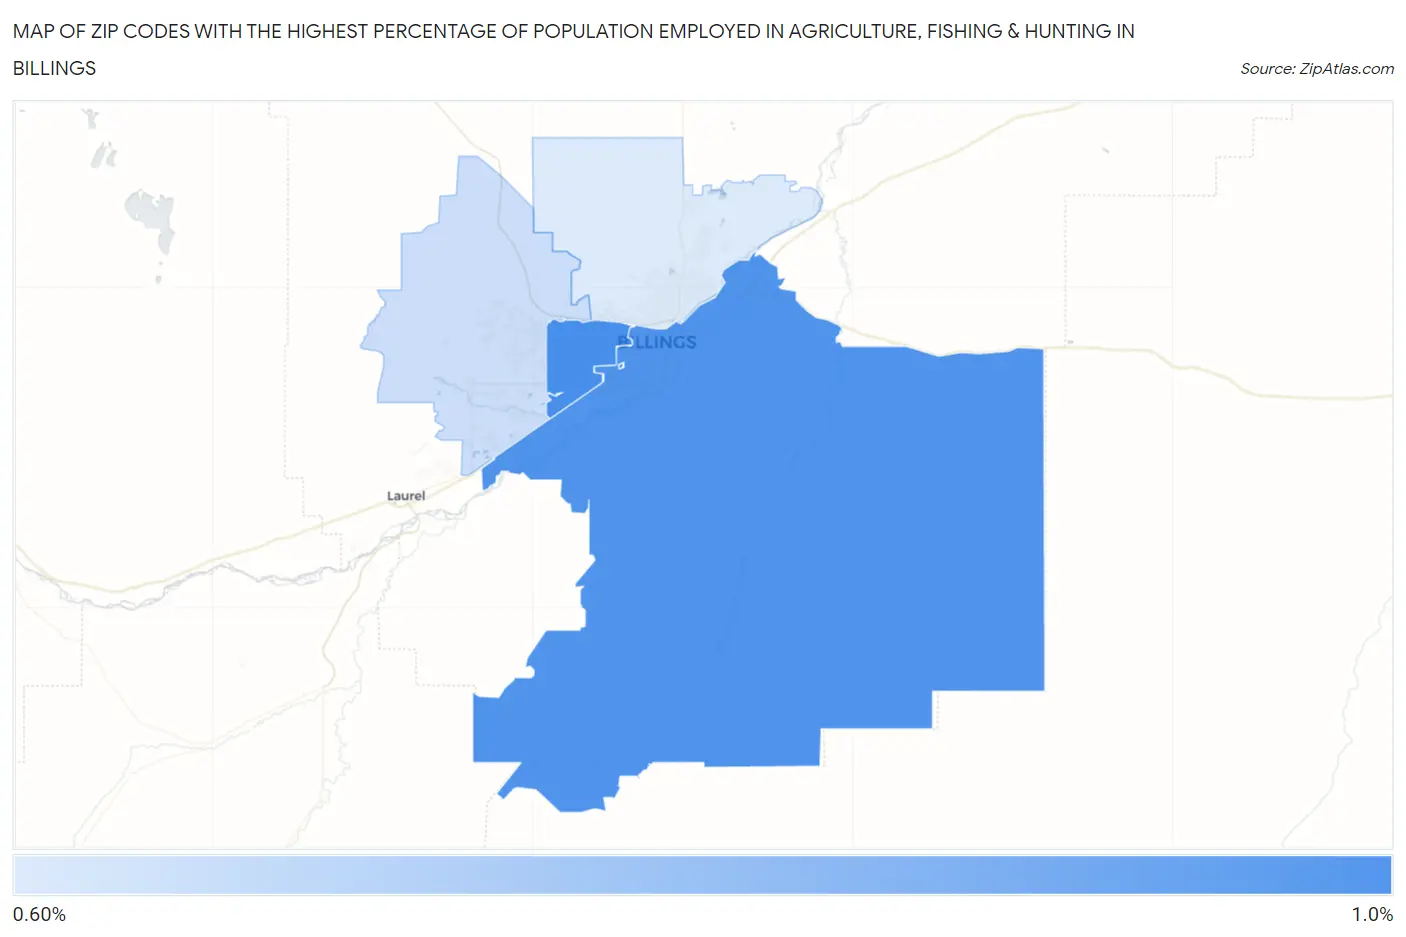
Map of Zip Codes with the Highest Percentage of Population Employed in Agriculture, Fishing & Hunting in Billings
0.0%
1.0%
Zip Codes with the Highest Percentage of Population Employed in Agriculture, Fishing & Hunting in Billings, MT
| Zip Code | % Employed | vs State | vs National | |
| 1. | 59102 | 0.97% | 4.9%(-3.97)#322 | 1.2%(-0.234)#16,379 |
| 2. | 59101 | 0.95% | 4.9%(-3.98)#323 | 1.2%(-0.249)#16,452 |
| 3. | 59106 | 0.72% | 4.9%(-4.21)#326 | 1.2%(-0.477)#17,716 |
| 4. | 59105 | 0.69% | 4.9%(-4.25)#327 | 1.2%(-0.513)#17,922 |
1
Common Questions
What are the Top 3 Zip Codes with the Highest Percentage of Population Employed in Agriculture, Fishing & Hunting in Billings, MT?
Top 3 Zip Codes with the Highest Percentage of Population Employed in Agriculture, Fishing & Hunting in Billings, MT are:
What zip code has the Highest Percentage of Population Employed in Agriculture, Fishing & Hunting in Billings, MT?
59102 has the Highest Percentage of Population Employed in Agriculture, Fishing & Hunting in Billings, MT with 0.97%.
What is the Percentage of Population Employed in Agriculture, Fishing & Hunting in Billings, MT?
Percentage of Population Employed in Agriculture, Fishing & Hunting in Billings is 0.76%.
What is the Percentage of Population Employed in Agriculture, Fishing & Hunting in Montana?
Percentage of Population Employed in Agriculture, Fishing & Hunting in Montana is 4.9%.
What is the Percentage of Population Employed in Agriculture, Fishing & Hunting in the United States?
Percentage of Population Employed in Agriculture, Fishing & Hunting in the United States is 1.2%.