Zip Codes with the Highest Percentage of Population Employed in Farming, Fishing & Forestry in Billings, MT
RELATED REPORTS & OPTIONS
Farming, Fishing & Forestry
Billings
Compare Zip Codes
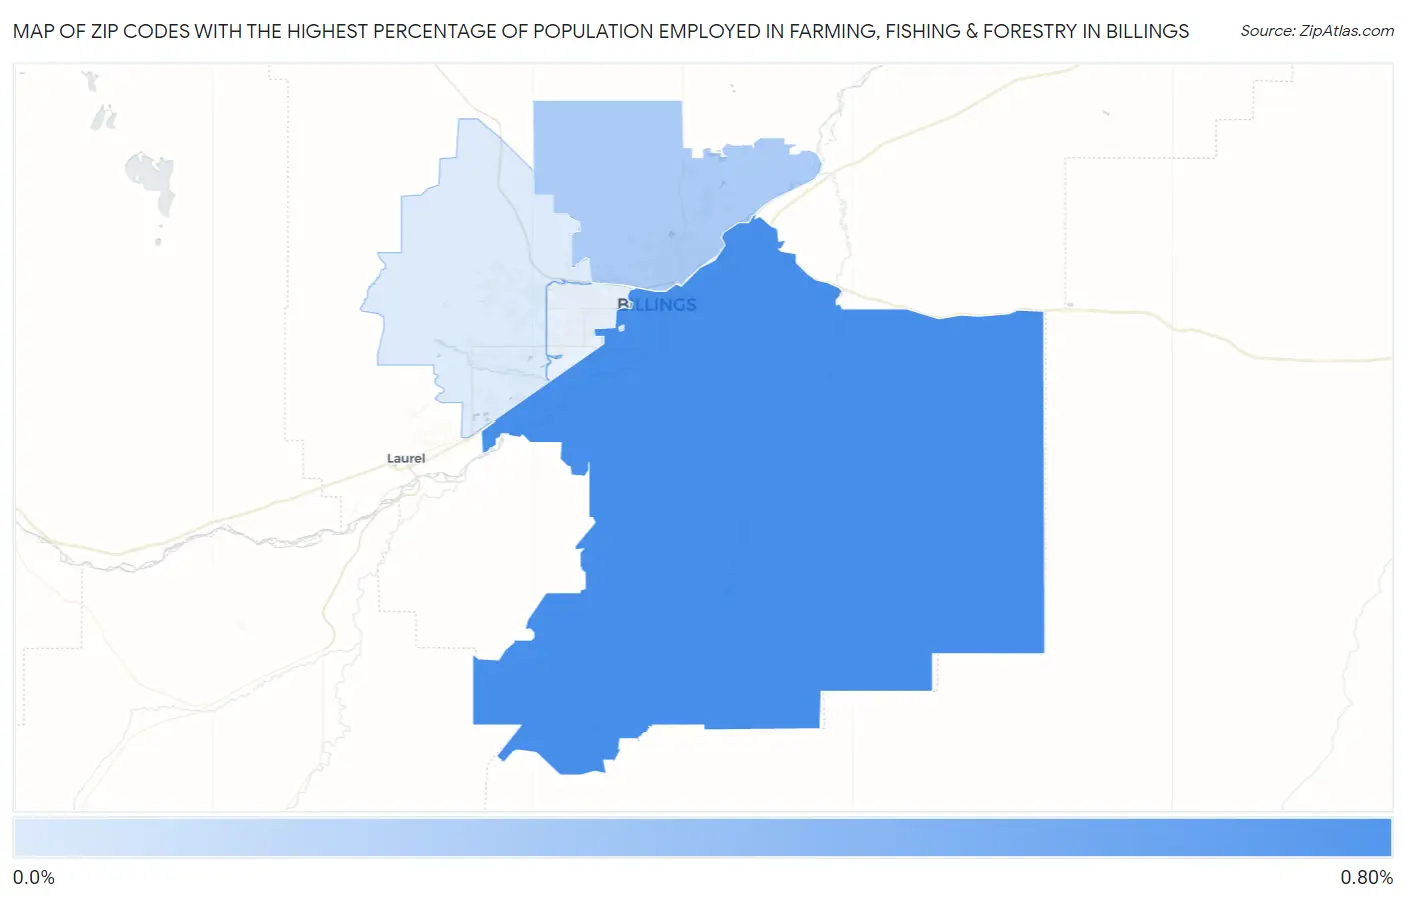
Map of Zip Codes with the Highest Percentage of Population Employed in Farming, Fishing & Forestry in Billings
0.0%
0.80%
Zip Codes with the Highest Percentage of Population Employed in Farming, Fishing & Forestry in Billings, MT
| Zip Code | % Employed | vs State | vs National | |
| 1. | 59101 | 0.76% | 1.7%(-0.903)#240 | 0.61%(+0.154)#11,028 |
| 2. | 59105 | 0.33% | 1.7%(-1.33)#260 | 0.61%(-0.271)#14,435 |
| 3. | 59106 | 0.12% | 1.7%(-1.55)#264 | 0.61%(-0.489)#17,484 |
1
Common Questions
What are the Top 3 Zip Codes with the Highest Percentage of Population Employed in Farming, Fishing & Forestry in Billings, MT?
Top 3 Zip Codes with the Highest Percentage of Population Employed in Farming, Fishing & Forestry in Billings, MT are:
What zip code has the Highest Percentage of Population Employed in Farming, Fishing & Forestry in Billings, MT?
59101 has the Highest Percentage of Population Employed in Farming, Fishing & Forestry in Billings, MT with 0.76%.
What is the Percentage of Population Employed in Farming, Fishing & Forestry in Billings, MT?
Percentage of Population Employed in Farming, Fishing & Forestry in Billings is 0.21%.
What is the Percentage of Population Employed in Farming, Fishing & Forestry in Montana?
Percentage of Population Employed in Farming, Fishing & Forestry in Montana is 1.7%.
What is the Percentage of Population Employed in Farming, Fishing & Forestry in the United States?
Percentage of Population Employed in Farming, Fishing & Forestry in the United States is 0.61%.