Ashland, MT Map & Demographics
Ashland Map
Ashland Overview
$23,990
PER CAPITA INCOME
$76,667
AVG FAMILY INCOME
$39,000
AVG HOUSEHOLD INCOME
3.5%
WAGE / INCOME GAP [ % ]
96.5¢/ $1
WAGE / INCOME GAP [ $ ]
0.45
INEQUALITY / GINI INDEX
783
TOTAL POPULATION
393
MALE POPULATION
390
FEMALE POPULATION
100.77
MALES / 100 FEMALES
99.24
FEMALES / 100 MALES
37.6
MEDIAN AGE
3.1
AVG FAMILY SIZE
2.1
AVG HOUSEHOLD SIZE
414
LABOR FORCE [ PEOPLE ]
67.3%
PERCENT IN LABOR FORCE
15.7%
UNEMPLOYMENT RATE
Ashland Zip Codes
Ashland Area Codes
Income in Ashland
Income Overview in Ashland
Per Capita Income in Ashland is $23,990, while median incomes of families and households are $76,667 and $39,000 respectively.
| Characteristic | Number | Measure |
| Per Capita Income | 783 | $23,990 |
| Median Family Income | 166 | $76,667 |
| Mean Family Income | 166 | $73,765 |
| Median Household Income | 362 | $39,000 |
| Mean Household Income | 362 | $51,305 |
| Income Deficit | 166 | $0 |
| Wage / Income Gap (%) | 783 | 3.53% |
| Wage / Income Gap ($) | 783 | 96.47¢ per $1 |
| Gini / Inequality Index | 783 | 0.45 |
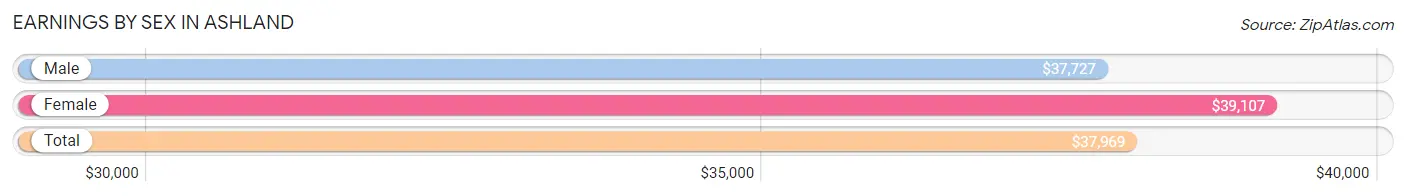
Earnings by Sex in Ashland
Average Earnings in Ashland are $37,969, $37,727 for men and $39,107 for women, a difference of 3.5%.
| Sex | Number | Average Earnings |
| Male | 180 (45.1%) | $37,727 |
| Female | 219 (54.9%) | $39,107 |
| Total | 399 (100.0%) | $37,969 |
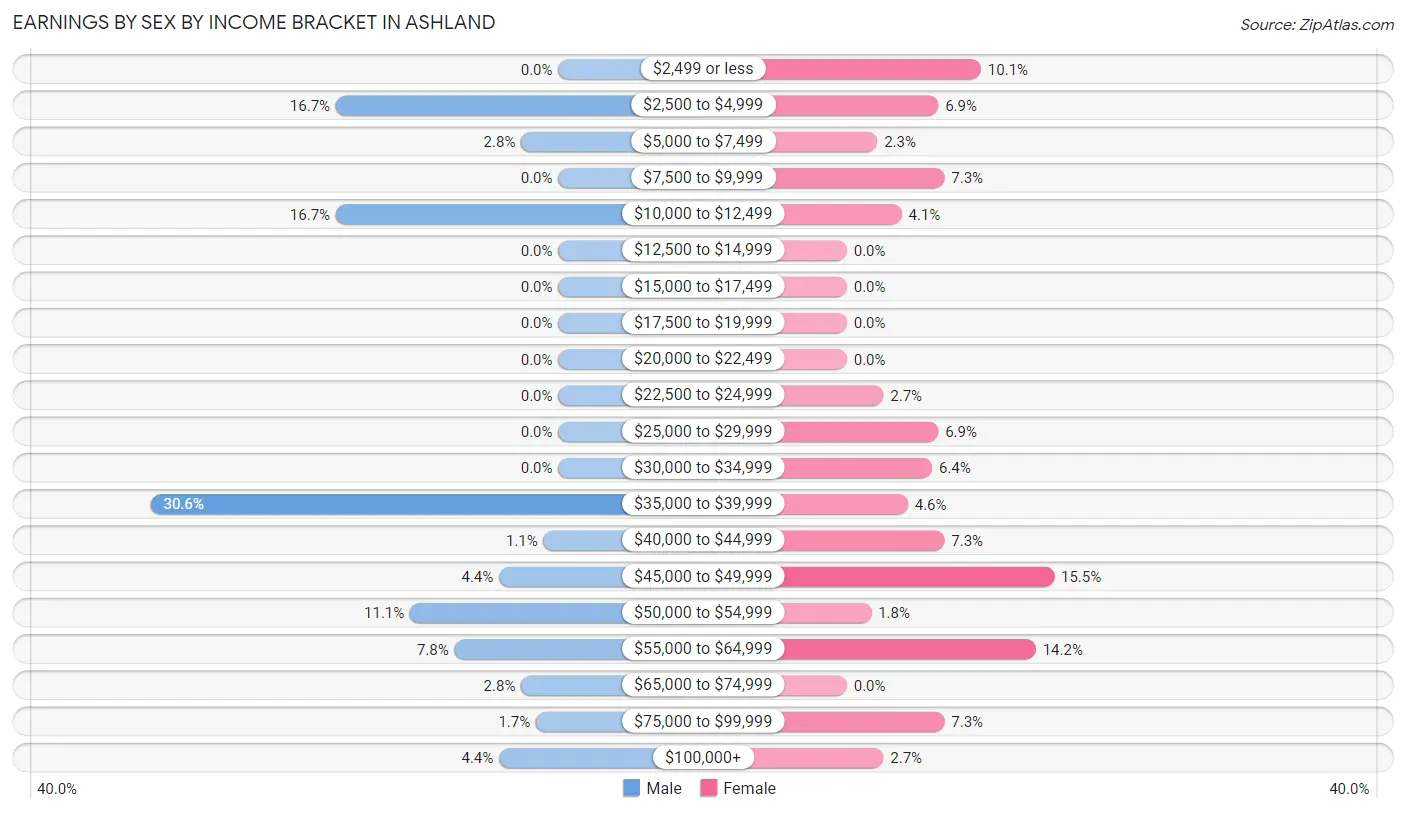
Earnings by Sex by Income Bracket in Ashland
The most common earnings brackets in Ashland are $35,000 to $39,999 for men (55 | 30.6%) and $45,000 to $49,999 for women (34 | 15.5%).
| Income | Male | Female |
| $2,499 or less | 0 (0.0%) | 22 (10.1%) |
| $2,500 to $4,999 | 30 (16.7%) | 15 (6.9%) |
| $5,000 to $7,499 | 5 (2.8%) | 5 (2.3%) |
| $7,500 to $9,999 | 0 (0.0%) | 16 (7.3%) |
| $10,000 to $12,499 | 30 (16.7%) | 9 (4.1%) |
| $12,500 to $14,999 | 0 (0.0%) | 0 (0.0%) |
| $15,000 to $17,499 | 0 (0.0%) | 0 (0.0%) |
| $17,500 to $19,999 | 0 (0.0%) | 0 (0.0%) |
| $20,000 to $22,499 | 0 (0.0%) | 0 (0.0%) |
| $22,500 to $24,999 | 0 (0.0%) | 6 (2.7%) |
| $25,000 to $29,999 | 0 (0.0%) | 15 (6.9%) |
| $30,000 to $34,999 | 0 (0.0%) | 14 (6.4%) |
| $35,000 to $39,999 | 55 (30.6%) | 10 (4.6%) |
| $40,000 to $44,999 | 2 (1.1%) | 16 (7.3%) |
| $45,000 to $49,999 | 8 (4.4%) | 34 (15.5%) |
| $50,000 to $54,999 | 20 (11.1%) | 4 (1.8%) |
| $55,000 to $64,999 | 14 (7.8%) | 31 (14.2%) |
| $65,000 to $74,999 | 5 (2.8%) | 0 (0.0%) |
| $75,000 to $99,999 | 3 (1.7%) | 16 (7.3%) |
| $100,000+ | 8 (4.4%) | 6 (2.7%) |
| Total | 180 (100.0%) | 219 (100.0%) |
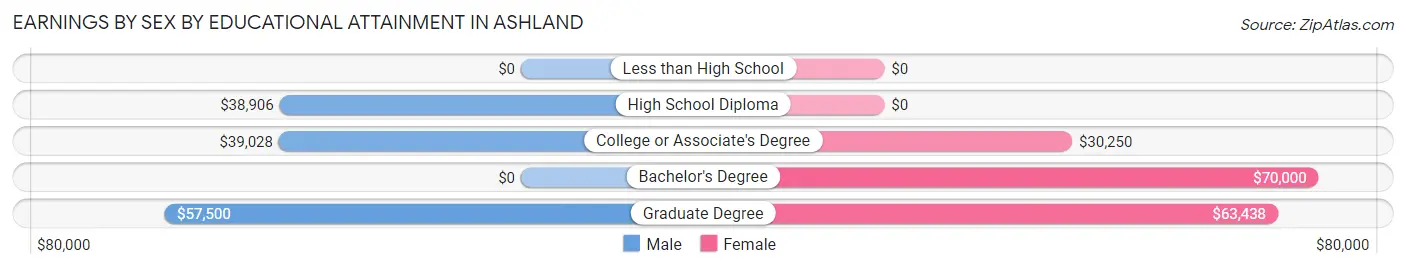
Earnings by Sex by Educational Attainment in Ashland
Average earnings in Ashland are $39,356 for men and $45,000 for women, a difference of 12.5%. Men with an educational attainment of graduate degree enjoy the highest average annual earnings of $57,500, while those with high school diploma education earn the least with $38,906. Women with an educational attainment of bachelor's degree earn the most with the average annual earnings of $70,000, while those with college or associate's degree education have the smallest earnings of $30,250.
| Educational Attainment | Male Income | Female Income |
| Less than High School | - | - |
| High School Diploma | $38,906 | $0 |
| College or Associate's Degree | $39,028 | $30,250 |
| Bachelor's Degree | - | - |
| Graduate Degree | $57,500 | $63,438 |
| Total | $39,356 | $45,000 |
Family Income in Ashland
Family Income Brackets in Ashland
According to the Ashland family income data, there are 54 families falling into the $35,000 to $49,999 income range, which is the most common income bracket and makes up 32.5% of all families.
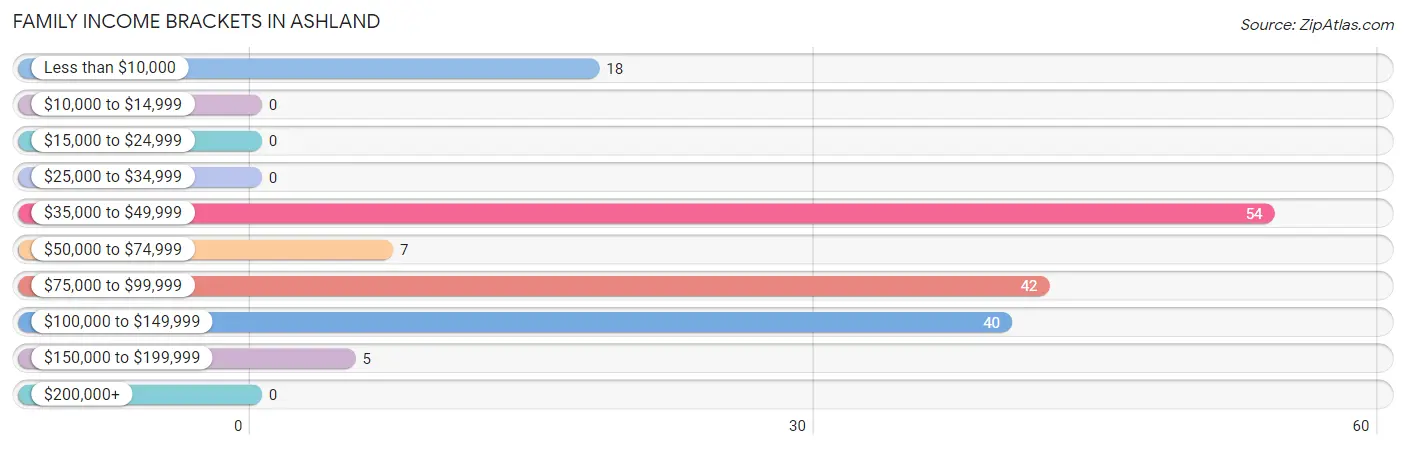
| Income Bracket | # Families | % Families |
| Less than $10,000 | 18 | 10.8% |
| $10,000 to $14,999 | 0 | 0.0% |
| $15,000 to $24,999 | 0 | 0.0% |
| $25,000 to $34,999 | 0 | 0.0% |
| $35,000 to $49,999 | 54 | 32.5% |
| $50,000 to $74,999 | 7 | 4.2% |
| $75,000 to $99,999 | 42 | 25.3% |
| $100,000 to $149,999 | 40 | 24.1% |
| $150,000 to $199,999 | 5 | 3.0% |
| $200,000+ | 0 | 0.0% |
Family Income by Famaliy Size in Ashland
4-person families (29 | 17.5%) account for the highest median family income in Ashland with $94,250 per family, while 4-person families (29 | 17.5%) have the highest median income of $23,562 per family member.
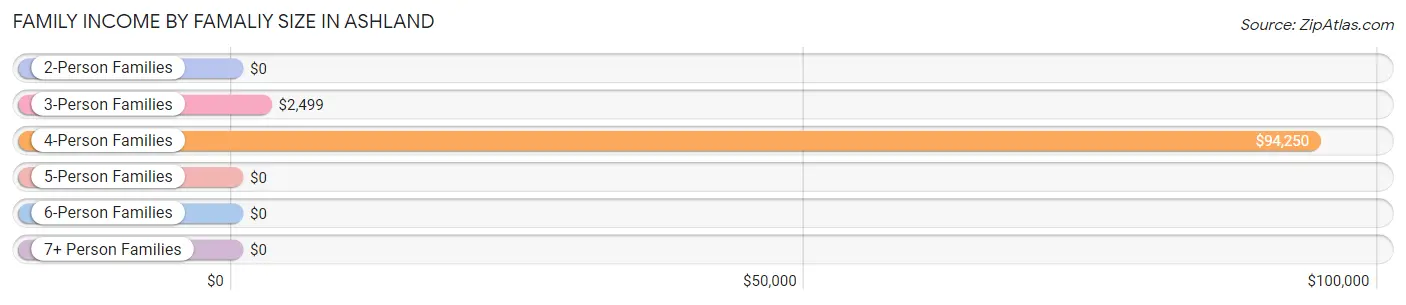
| Income Bracket | # Families | Median Income |
| 2-Person Families | 87 (52.4%) | $0 |
| 3-Person Families | 20 (12.0%) | $2,499 |
| 4-Person Families | 29 (17.5%) | $94,250 |
| 5-Person Families | 21 (12.7%) | $0 |
| 6-Person Families | 0 (0.0%) | $0 |
| 7+ Person Families | 9 (5.4%) | $0 |
| Total | 166 (100.0%) | $76,667 |
Family Income by Number of Earners in Ashland
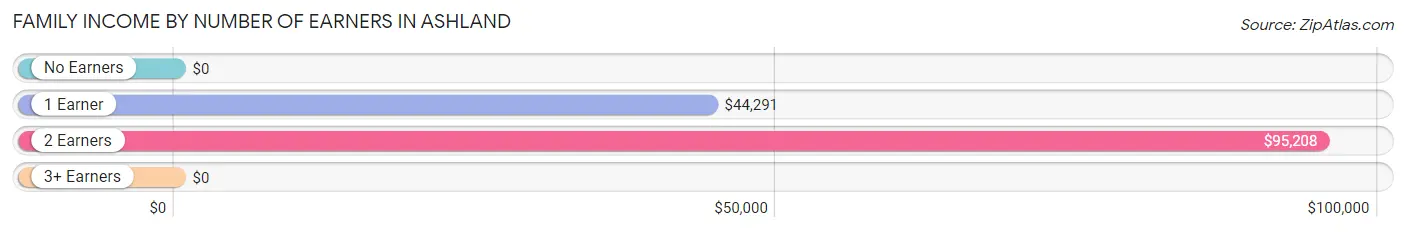
| Number of Earners | # Families | Median Income |
| No Earners | 0 (0.0%) | $0 |
| 1 Earner | 105 (63.2%) | $44,291 |
| 2 Earners | 53 (31.9%) | $95,208 |
| 3+ Earners | 8 (4.8%) | $0 |
| Total | 166 (100.0%) | $76,667 |
Household Income in Ashland
Household Income Brackets in Ashland
With 74 households falling in the category, the $10,000 to $14,999 income range is the most frequent in Ashland, accounting for 20.4% of all households.
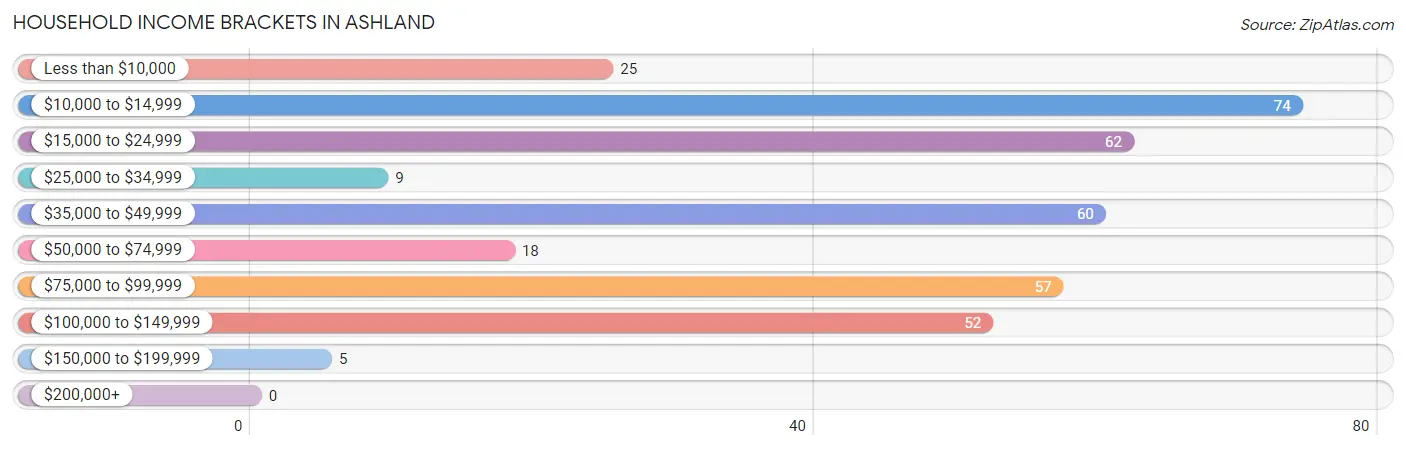
| Income Bracket | # Households | % Households |
| Less than $10,000 | 25 | 6.9% |
| $10,000 to $14,999 | 74 | 20.4% |
| $15,000 to $24,999 | 62 | 17.1% |
| $25,000 to $34,999 | 9 | 2.5% |
| $35,000 to $49,999 | 60 | 16.6% |
| $50,000 to $74,999 | 18 | 5.0% |
| $75,000 to $99,999 | 57 | 15.7% |
| $100,000 to $149,999 | 52 | 14.4% |
| $150,000 to $199,999 | 5 | 1.4% |
| $200,000+ | 0 | 0.0% |
Household Income by Householder Age in Ashland
The median household income in Ashland is $39,000, with the highest median household income of $76,458 found in the 45 to 64 years age bracket for the primary householder. A total of 109 households (30.1%) fall into this category. Meanwhile, the 15 to 24 years age bracket for the primary householder has the lowest median household income of $0, with 38 households (10.5%) in this group.
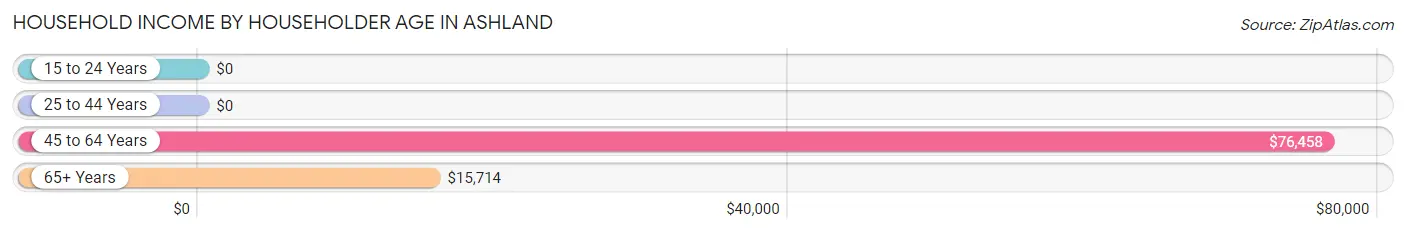
| Income Bracket | # Households | Median Income |
| 15 to 24 Years | 38 (10.5%) | $0 |
| 25 to 44 Years | 63 (17.4%) | $0 |
| 45 to 64 Years | 109 (30.1%) | $76,458 |
| 65+ Years | 152 (42.0%) | $15,714 |
| Total | 362 (100.0%) | $39,000 |
Poverty in Ashland
Income Below Poverty by Sex and Age in Ashland
With 29.8% poverty level for males and 26.2% for females among the residents of Ashland, 18 to 24 year old males and 75 year old and over females are the most vulnerable to poverty, with 43 males (100.0%) and 61 females (85.9%) in their respective age groups living below the poverty level.
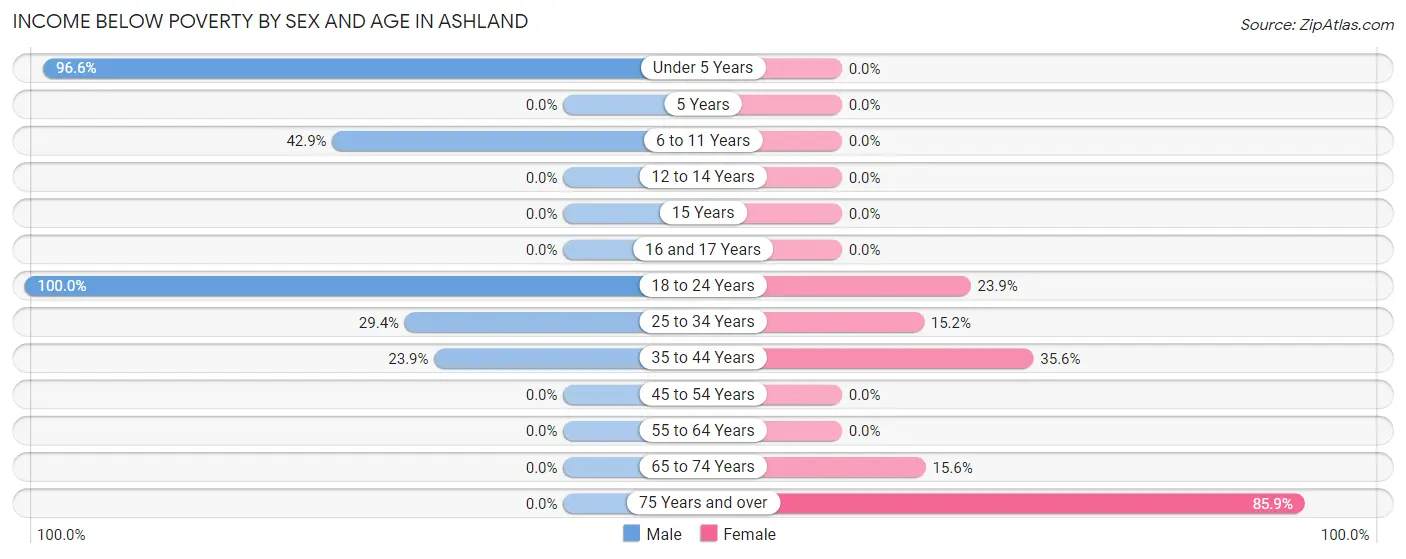
| Age Bracket | Male | Female |
| Under 5 Years | 28 (96.6%) | 0 (0.0%) |
| 5 Years | 0 (0.0%) | 0 (0.0%) |
| 6 to 11 Years | 18 (42.9%) | 0 (0.0%) |
| 12 to 14 Years | 0 (0.0%) | 0 (0.0%) |
| 15 Years | 0 (0.0%) | 0 (0.0%) |
| 16 and 17 Years | 0 (0.0%) | 0 (0.0%) |
| 18 to 24 Years | 43 (100.0%) | 11 (23.9%) |
| 25 to 34 Years | 10 (29.4%) | 7 (15.2%) |
| 35 to 44 Years | 17 (23.9%) | 16 (35.6%) |
| 45 to 54 Years | 0 (0.0%) | 0 (0.0%) |
| 55 to 64 Years | 0 (0.0%) | 0 (0.0%) |
| 65 to 74 Years | 0 (0.0%) | 7 (15.6%) |
| 75 Years and over | 0 (0.0%) | 61 (85.9%) |
| Total | 116 (29.8%) | 102 (26.2%) |
Income Above Poverty by Sex and Age in Ashland
According to the poverty statistics in Ashland, males aged 5 years and females aged under 5 years are the age groups that are most secure financially, with 100.0% of males and 100.0% of females in these age groups living above the poverty line.
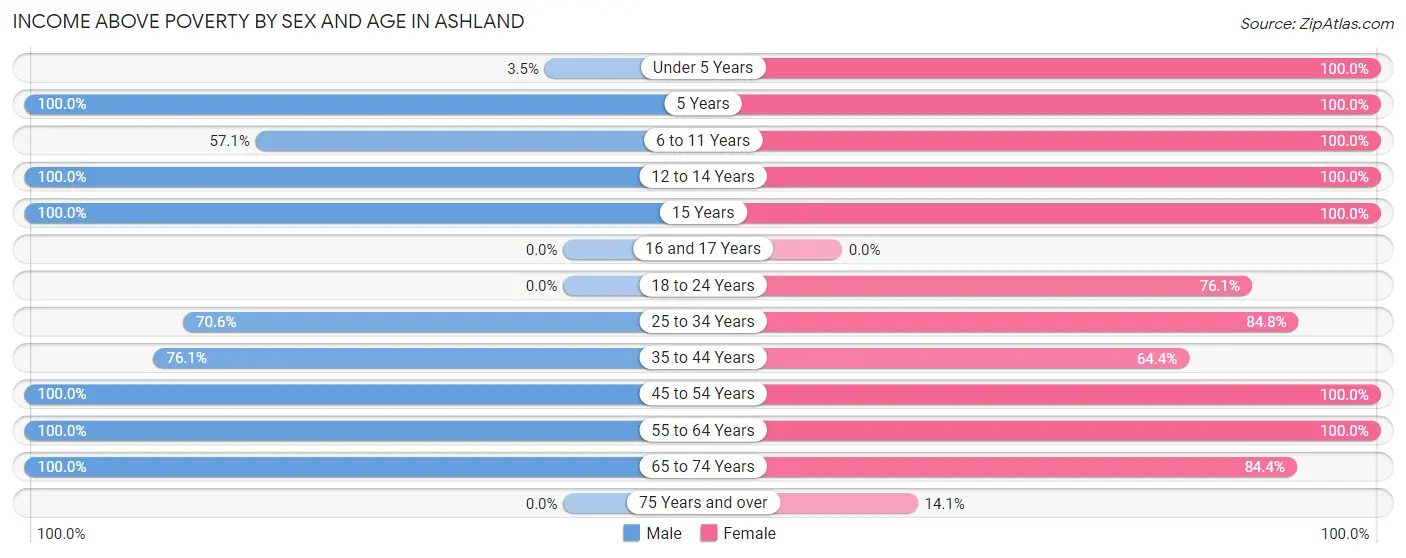
| Age Bracket | Male | Female |
| Under 5 Years | 1 (3.5%) | 15 (100.0%) |
| 5 Years | 13 (100.0%) | 11 (100.0%) |
| 6 to 11 Years | 24 (57.1%) | 11 (100.0%) |
| 12 to 14 Years | 18 (100.0%) | 12 (100.0%) |
| 15 Years | 11 (100.0%) | 2 (100.0%) |
| 16 and 17 Years | 0 (0.0%) | 0 (0.0%) |
| 18 to 24 Years | 0 (0.0%) | 35 (76.1%) |
| 25 to 34 Years | 24 (70.6%) | 39 (84.8%) |
| 35 to 44 Years | 54 (76.1%) | 29 (64.4%) |
| 45 to 54 Years | 50 (100.0%) | 13 (100.0%) |
| 55 to 64 Years | 31 (100.0%) | 72 (100.0%) |
| 65 to 74 Years | 47 (100.0%) | 38 (84.4%) |
| 75 Years and over | 0 (0.0%) | 10 (14.1%) |
| Total | 273 (70.2%) | 287 (73.8%) |
Income Below Poverty Among Married-Couple Families in Ashland
The poverty statistics for married-couple families in Ashland show that 10.4% or 11 of the total 106 families live below the poverty line. Families with 1 or 2 children have the highest poverty rate of 31.4%, comprising of 11 families. On the other hand, families with no children have the lowest poverty rate of 0.0%, which includes 0 families.
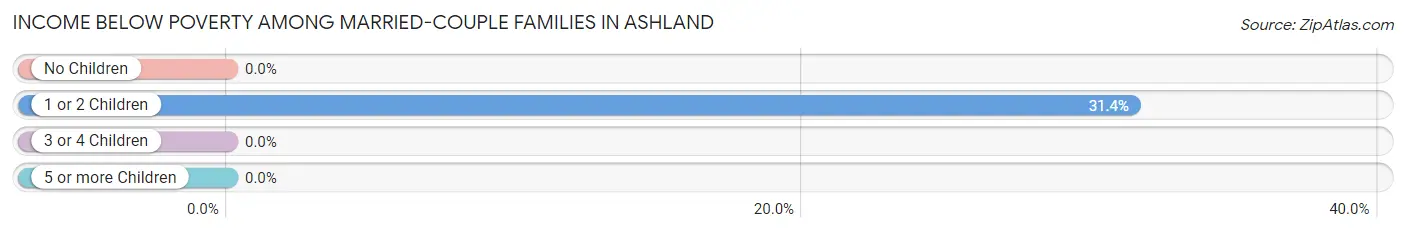
| Children | Above Poverty | Below Poverty |
| No Children | 53 (100.0%) | 0 (0.0%) |
| 1 or 2 Children | 24 (68.6%) | 11 (31.4%) |
| 3 or 4 Children | 9 (100.0%) | 0 (0.0%) |
| 5 or more Children | 9 (100.0%) | 0 (0.0%) |
| Total | 95 (89.6%) | 11 (10.4%) |
Income Below Poverty Among Single-Parent Households in Ashland
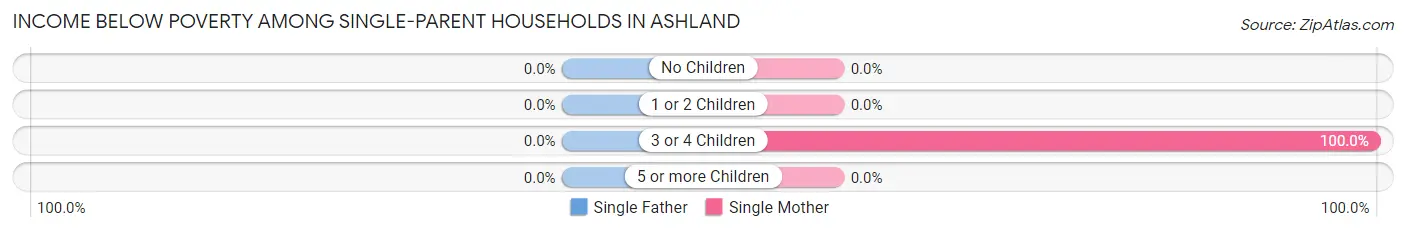
| Children | Single Father | Single Mother |
| No Children | 0 (0.0%) | 0 (0.0%) |
| 1 or 2 Children | 0 (0.0%) | 0 (0.0%) |
| 3 or 4 Children | 0 (0.0%) | 7 (100.0%) |
| 5 or more Children | 0 (0.0%) | 0 (0.0%) |
| Total | 0 (0.0%) | 7 (21.2%) |
Income Below Poverty Among Married-Couple vs Single-Parent Households in Ashland
The poverty data for Ashland shows that 11 of the married-couple family households (10.4%) and 7 of the single-parent households (11.7%) are living below the poverty level. Within the married-couple family households, those with 1 or 2 children have the highest poverty rate, with 11 households (31.4%) falling below the poverty line. Among the single-parent households, those with 3 or 4 children have the highest poverty rate, with 7 household (100.0%) living below poverty.
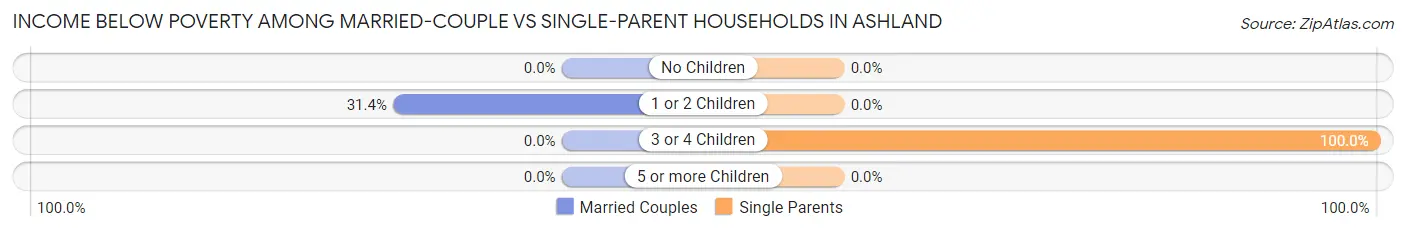
| Children | Married-Couple Families | Single-Parent Households |
| No Children | 0 (0.0%) | 0 (0.0%) |
| 1 or 2 Children | 11 (31.4%) | 0 (0.0%) |
| 3 or 4 Children | 0 (0.0%) | 7 (100.0%) |
| 5 or more Children | 0 (0.0%) | 0 (0.0%) |
| Total | 11 (10.4%) | 7 (11.7%) |
Race in Ashland
The most populous races in Ashland are Native / Alaskan (511 | 65.3%), White / Caucasian (227 | 29.0%), and Two or more Races (44 | 5.6%).
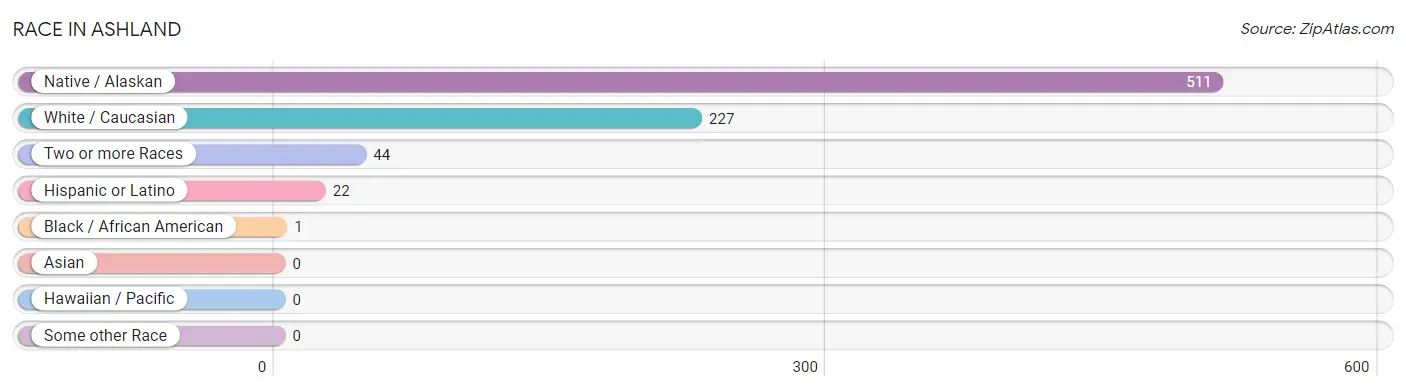
| Race | # Population | % Population |
| Asian | 0 | 0.0% |
| Black / African American | 1 | 0.1% |
| Hawaiian / Pacific | 0 | 0.0% |
| Hispanic or Latino | 22 | 2.8% |
| Native / Alaskan | 511 | 65.3% |
| White / Caucasian | 227 | 29.0% |
| Two or more Races | 44 | 5.6% |
| Some other Race | 0 | 0.0% |
| Total | 783 | 100.0% |
Ancestry in Ashland
The most populous ancestries reported in Ashland are Cheyenne (251 | 32.1%), Crow (175 | 22.4%), English (60 | 7.7%), Irish (57 | 7.3%), and German (51 | 6.5%), together accounting for 75.9% of all Ashland residents.
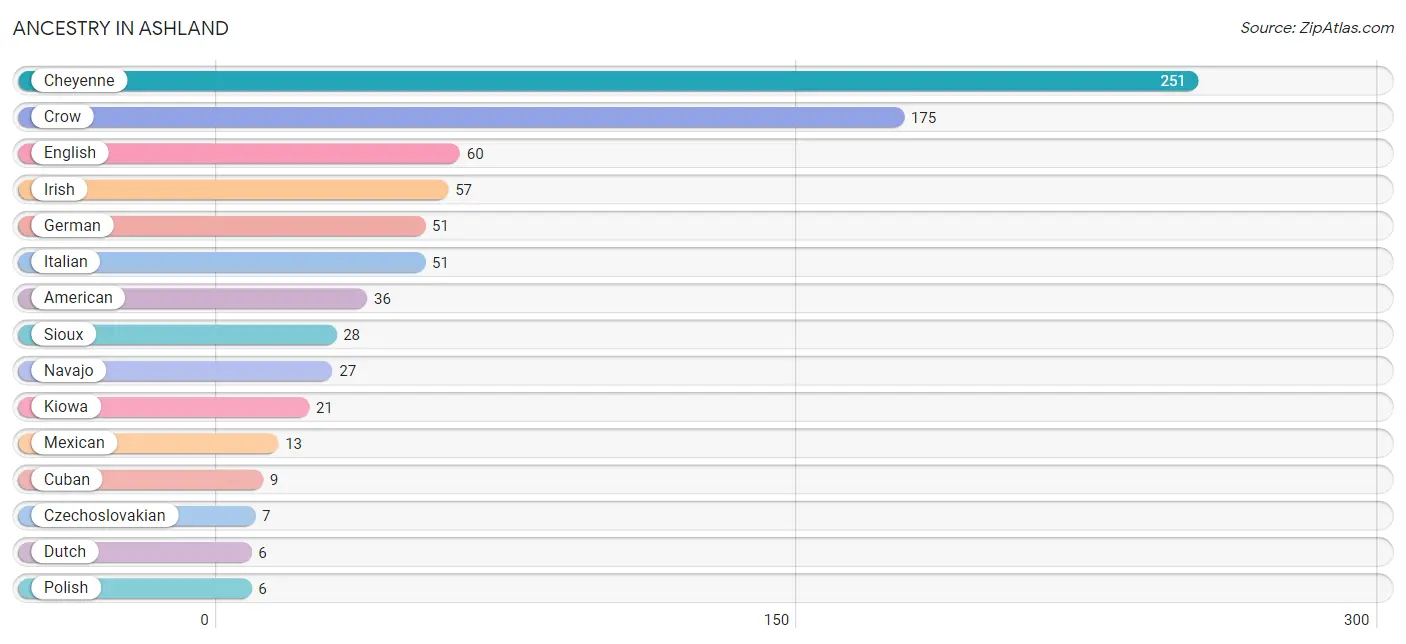
| Ancestry | # Population | % Population |
| American | 36 | 4.6% |
| Belgian | 5 | 0.6% |
| Cheyenne | 251 | 32.1% |
| Chippewa | 5 | 0.6% |
| Crow | 175 | 22.4% |
| Cuban | 9 | 1.1% |
| Czechoslovakian | 7 | 0.9% |
| Dutch | 6 | 0.8% |
| English | 60 | 7.7% |
| French | 5 | 0.6% |
| German | 51 | 6.5% |
| Irish | 57 | 7.3% |
| Italian | 51 | 6.5% |
| Kiowa | 21 | 2.7% |
| Mexican | 13 | 1.7% |
| Navajo | 27 | 3.5% |
| Polish | 6 | 0.8% |
| Scotch-Irish | 1 | 0.1% |
| Scottish | 5 | 0.6% |
| Sioux | 28 | 3.6% |
| Welsh | 3 | 0.4% | View All 21 Rows |
Immigrants in Ashland

| Immigration Origin | # Population | % Population | View All 0 Rows |
Sex and Age in Ashland
Sex and Age in Ashland
The most populous age groups in Ashland are 20 to 24 Years (43 | 10.9%) for men and 85 Years and over (61 | 15.6%) for women.
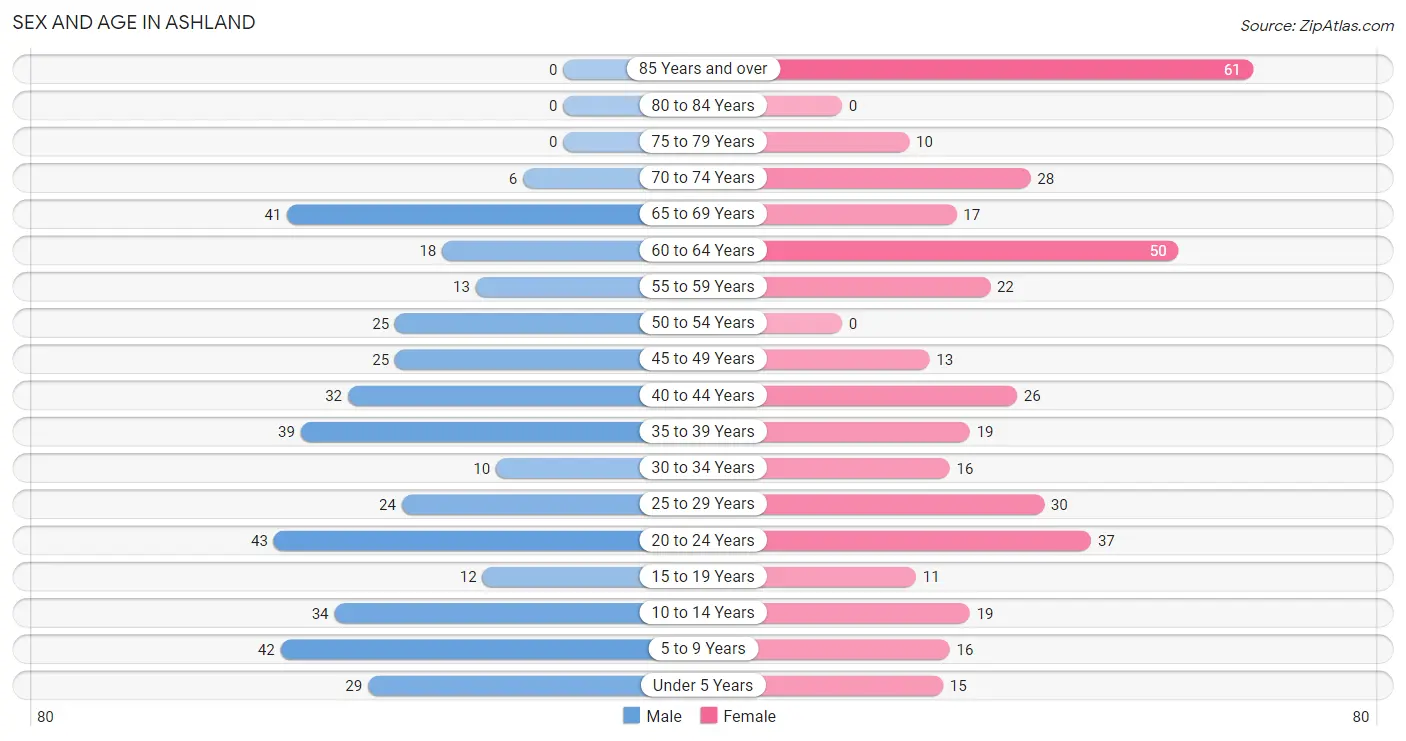
| Age Bracket | Male | Female |
| Under 5 Years | 29 (7.4%) | 15 (3.8%) |
| 5 to 9 Years | 42 (10.7%) | 16 (4.1%) |
| 10 to 14 Years | 34 (8.6%) | 19 (4.9%) |
| 15 to 19 Years | 12 (3.0%) | 11 (2.8%) |
| 20 to 24 Years | 43 (10.9%) | 37 (9.5%) |
| 25 to 29 Years | 24 (6.1%) | 30 (7.7%) |
| 30 to 34 Years | 10 (2.5%) | 16 (4.1%) |
| 35 to 39 Years | 39 (9.9%) | 19 (4.9%) |
| 40 to 44 Years | 32 (8.1%) | 26 (6.7%) |
| 45 to 49 Years | 25 (6.4%) | 13 (3.3%) |
| 50 to 54 Years | 25 (6.4%) | 0 (0.0%) |
| 55 to 59 Years | 13 (3.3%) | 22 (5.6%) |
| 60 to 64 Years | 18 (4.6%) | 50 (12.8%) |
| 65 to 69 Years | 41 (10.4%) | 17 (4.4%) |
| 70 to 74 Years | 6 (1.5%) | 28 (7.2%) |
| 75 to 79 Years | 0 (0.0%) | 10 (2.6%) |
| 80 to 84 Years | 0 (0.0%) | 0 (0.0%) |
| 85 Years and over | 0 (0.0%) | 61 (15.6%) |
| Total | 393 (100.0%) | 390 (100.0%) |
Families and Households in Ashland
Median Family Size in Ashland
The median family size in Ashland is 3.08 persons per family, with single male/father families (27 | 16.3%) accounting for the largest median family size of 3.56 persons per family. On the other hand, married-couple families (106 | 63.9%) represent the smallest median family size with 2.88 persons per family.
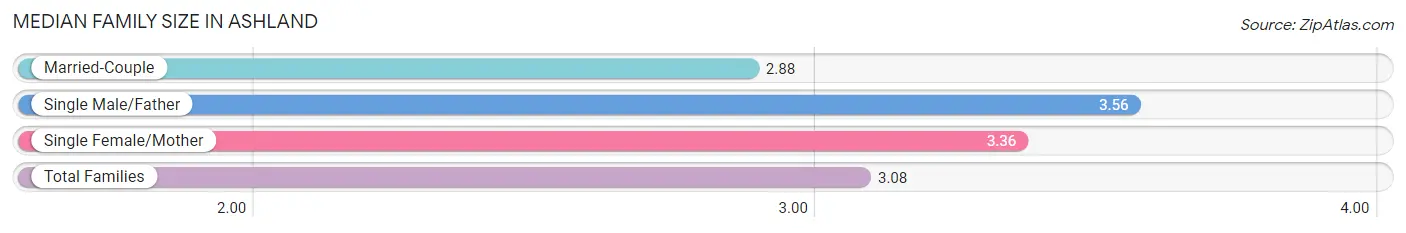
| Family Type | # Families | Family Size |
| Married-Couple | 106 (63.9%) | 2.88 |
| Single Male/Father | 27 (16.3%) | 3.56 |
| Single Female/Mother | 33 (19.9%) | 3.36 |
| Total Families | 166 (100.0%) | 3.08 |
Median Household Size in Ashland
The median household size in Ashland is 2.15 persons per household, with single male/father households (27 | 7.5%) accounting for the largest median household size of 4.41 persons per household. non-family households (196 | 54.1%) represent the smallest median household size with 1.24 persons per household.
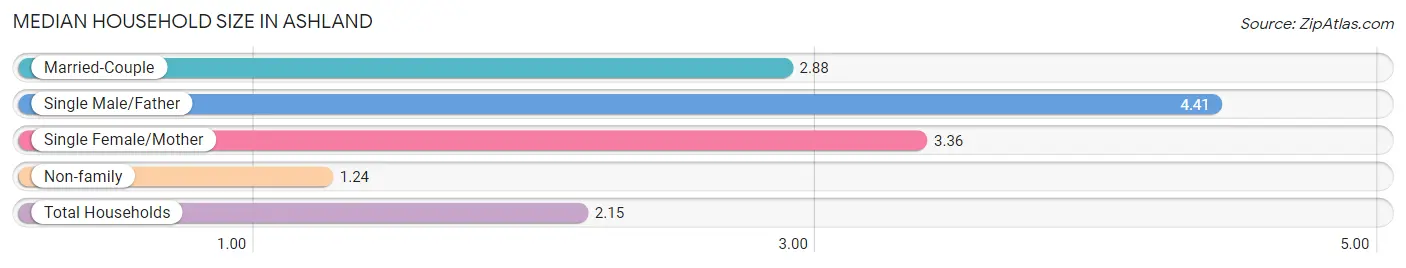
| Household Type | # Households | Household Size |
| Married-Couple | 106 (29.3%) | 2.88 |
| Single Male/Father | 27 (7.5%) | 4.41 |
| Single Female/Mother | 33 (9.1%) | 3.36 |
| Non-family | 196 (54.1%) | 1.24 |
| Total Households | 362 (100.0%) | 2.15 |
Household Size by Marriage Status in Ashland
Out of a total of 362 households in Ashland, 166 (45.9%) are family households, while 196 (54.1%) are nonfamily households. The most numerous type of family households are 2-person households, comprising 74, and the most common type of nonfamily households are 1-person households, comprising 167.
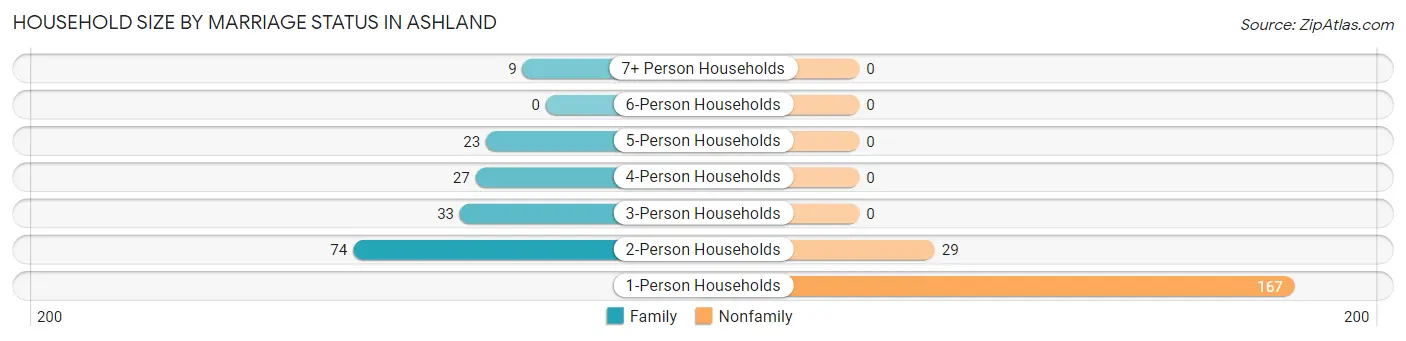
| Household Size | Family Households | Nonfamily Households |
| 1-Person Households | - | 167 (46.1%) |
| 2-Person Households | 74 (20.4%) | 29 (8.0%) |
| 3-Person Households | 33 (9.1%) | 0 (0.0%) |
| 4-Person Households | 27 (7.5%) | 0 (0.0%) |
| 5-Person Households | 23 (6.4%) | 0 (0.0%) |
| 6-Person Households | 0 (0.0%) | 0 (0.0%) |
| 7+ Person Households | 9 (2.5%) | 0 (0.0%) |
| Total | 166 (45.9%) | 196 (54.1%) |
Female Fertility in Ashland
Fertility by Age in Ashland
Average fertility rate in Ashland is 33.0 births per 1,000 women. Women in the age bracket of 20 to 34 years have the highest fertility rate with 60.0 births per 1,000 women. Women in the age bracket of 20 to 34 years acount for 100.0% of all women with births.

| Age Bracket | Women with Births | Births / 1,000 Women |
| 15 to 19 years | 0 (0.0%) | 0.0 |
| 20 to 34 years | 5 (100.0%) | 60.0 |
| 35 to 50 years | 0 (0.0%) | 0.0 |
| Total | 5 (100.0%) | 33.0 |
Fertility by Age by Marriage Status in Ashland
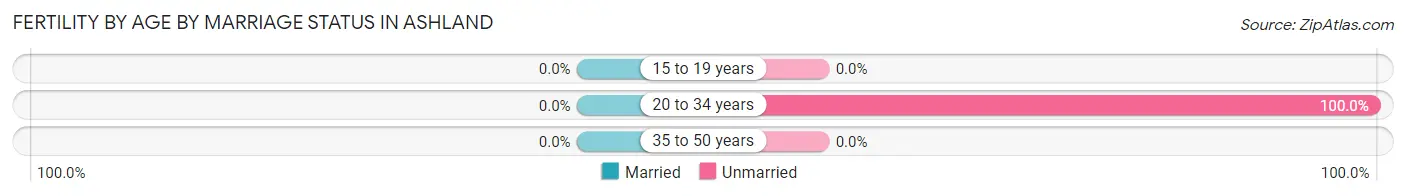
| Age Bracket | Married | Unmarried |
| 15 to 19 years | 0 (0.0%) | 0 (0.0%) |
| 20 to 34 years | 0 (0.0%) | 5 (100.0%) |
| 35 to 50 years | 0 (0.0%) | 0 (0.0%) |
| Total | 0 (0.0%) | 5 (100.0%) |
Fertility by Education in Ashland
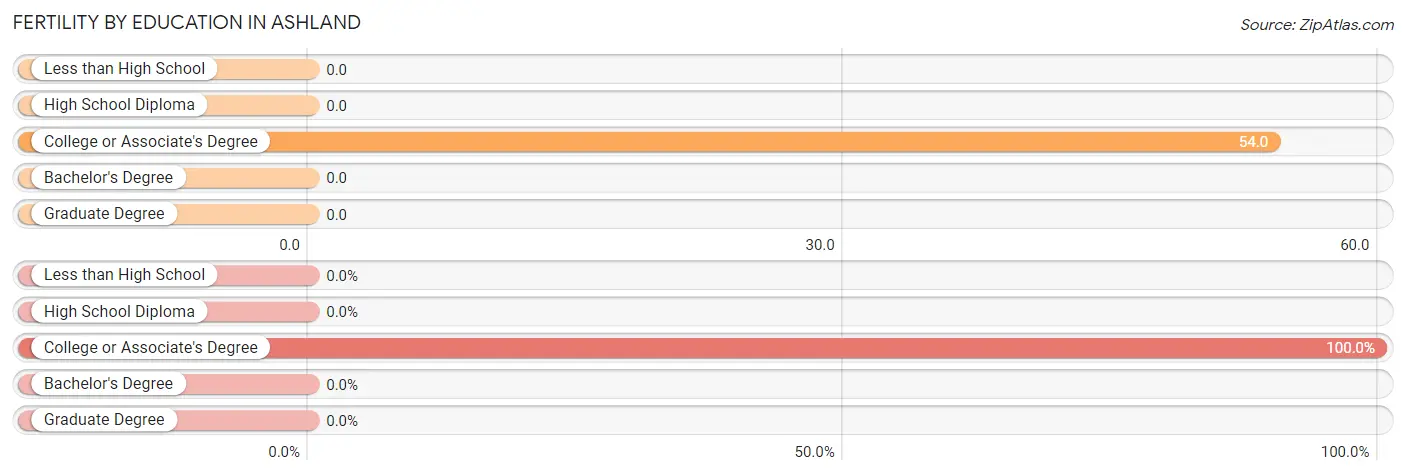
| Educational Attainment | Women with Births | Births / 1,000 Women |
| Less than High School | 0 (0.0%) | 0.0 |
| High School Diploma | 0 (0.0%) | 0.0 |
| College or Associate's Degree | 5 (100.0%) | 54.0 |
| Bachelor's Degree | 0 (0.0%) | 0.0 |
| Graduate Degree | 0 (0.0%) | 0.0 |
| Total | 5 (100.0%) | 33.0 |
Fertility by Education by Marriage Status in Ashland
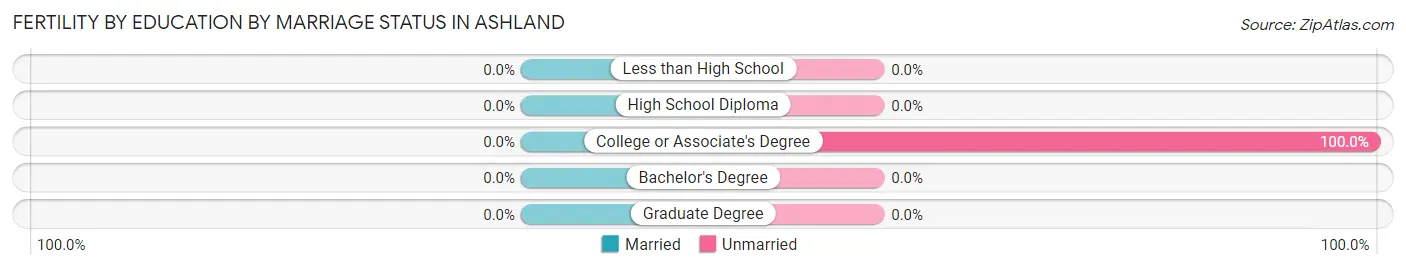
| Educational Attainment | Married | Unmarried |
| Less than High School | 0 (0.0%) | 0 (0.0%) |
| High School Diploma | 0 (0.0%) | 0 (0.0%) |
| College or Associate's Degree | 0 (0.0%) | 5 (100.0%) |
| Bachelor's Degree | 0 (0.0%) | 0 (0.0%) |
| Graduate Degree | 0 (0.0%) | 0 (0.0%) |
| Total | 0 (0.0%) | 5 (100.0%) |
Employment Characteristics in Ashland
Employment by Class of Employer in Ashland
Among the 348 employed individuals in Ashland, not-for-profit organizations (132 | 37.9%), private company employees (115 | 33.1%), and local government employees (50 | 14.4%) make up the most common classes of employment.
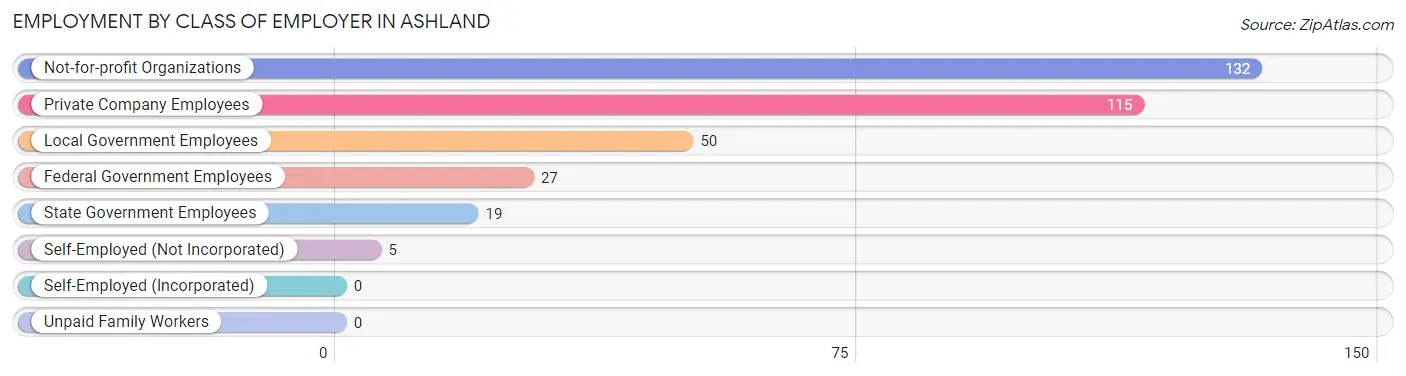
| Employer Class | # Employees | % Employees |
| Private Company Employees | 115 | 33.1% |
| Self-Employed (Incorporated) | 0 | 0.0% |
| Self-Employed (Not Incorporated) | 5 | 1.4% |
| Not-for-profit Organizations | 132 | 37.9% |
| Local Government Employees | 50 | 14.4% |
| State Government Employees | 19 | 5.5% |
| Federal Government Employees | 27 | 7.8% |
| Unpaid Family Workers | 0 | 0.0% |
| Total | 348 | 100.0% |
Employment Status by Age in Ashland
According to the labor force statistics for Ashland, out of the total population over 16 years of age (615), 67.3% or 414 individuals are in the labor force, with 15.7% or 65 of them unemployed. The age group with the highest labor force participation rate is 45 to 54 years, with 100.0% or 63 individuals in the labor force. Within the labor force, the 30 to 34 years age range has the highest percentage of unemployed individuals, with 62.5% or 10 of them being unemployed.
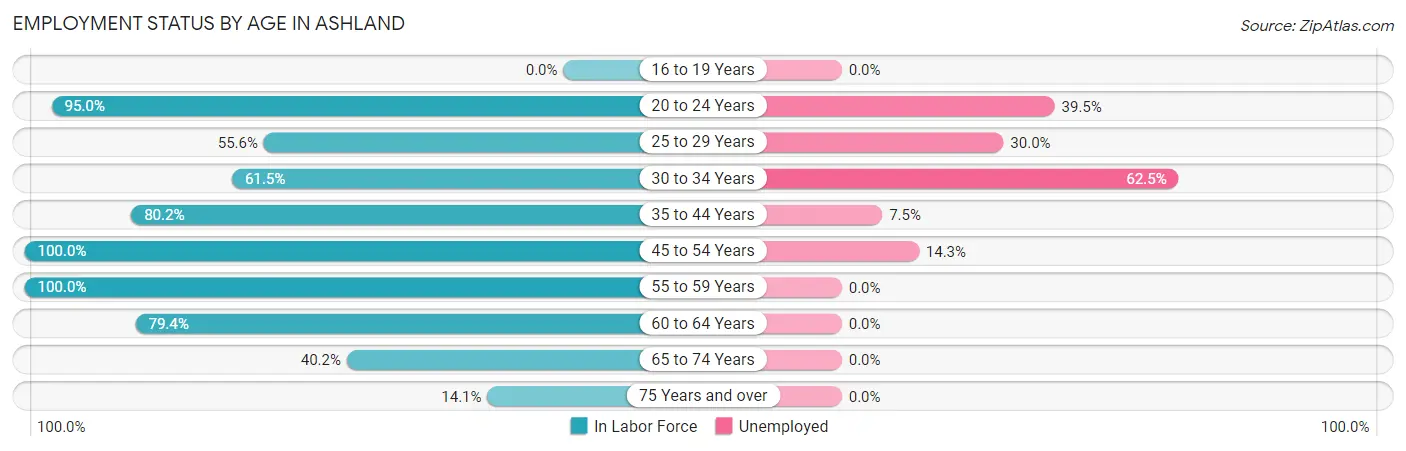
| Age Bracket | In Labor Force | Unemployed |
| 16 to 19 Years | 0 (0.0%) | 0 (0.0%) |
| 20 to 24 Years | 76 (95.0%) | 30 (39.5%) |
| 25 to 29 Years | 30 (55.6%) | 9 (30.0%) |
| 30 to 34 Years | 16 (61.5%) | 10 (62.5%) |
| 35 to 44 Years | 93 (80.2%) | 7 (7.5%) |
| 45 to 54 Years | 63 (100.0%) | 9 (14.3%) |
| 55 to 59 Years | 35 (100.0%) | 0 (0.0%) |
| 60 to 64 Years | 54 (79.4%) | 0 (0.0%) |
| 65 to 74 Years | 37 (40.2%) | 0 (0.0%) |
| 75 Years and over | 10 (14.1%) | 0 (0.0%) |
| Total | 414 (67.3%) | 65 (15.7%) |
Employment Status by Educational Attainment in Ashland
According to labor force statistics for Ashland, 80.4% of individuals (291) out of the total population between 25 and 64 years of age (362) are in the labor force, with 12.0% or 35 of them being unemployed. The group with the highest labor force participation rate are those with the educational attainment of bachelor's degree or higher, with 100.0% or 74 individuals in the labor force. Within the labor force, individuals with college / associate degree education have the highest percentage of unemployment, with 19.4% or 26 of them being unemployed.
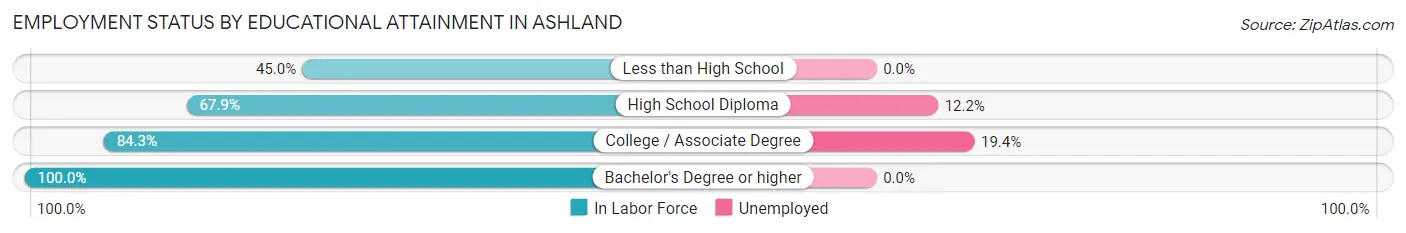
| Educational Attainment | In Labor Force | Unemployed |
| Less than High School | 9 (45.0%) | 0 (0.0%) |
| High School Diploma | 74 (67.9%) | 13 (12.2%) |
| College / Associate Degree | 134 (84.3%) | 31 (19.4%) |
| Bachelor's Degree or higher | 74 (100.0%) | 0 (0.0%) |
| Total | 291 (80.4%) | 43 (12.0%) |
Employment Occupations by Sex in Ashland
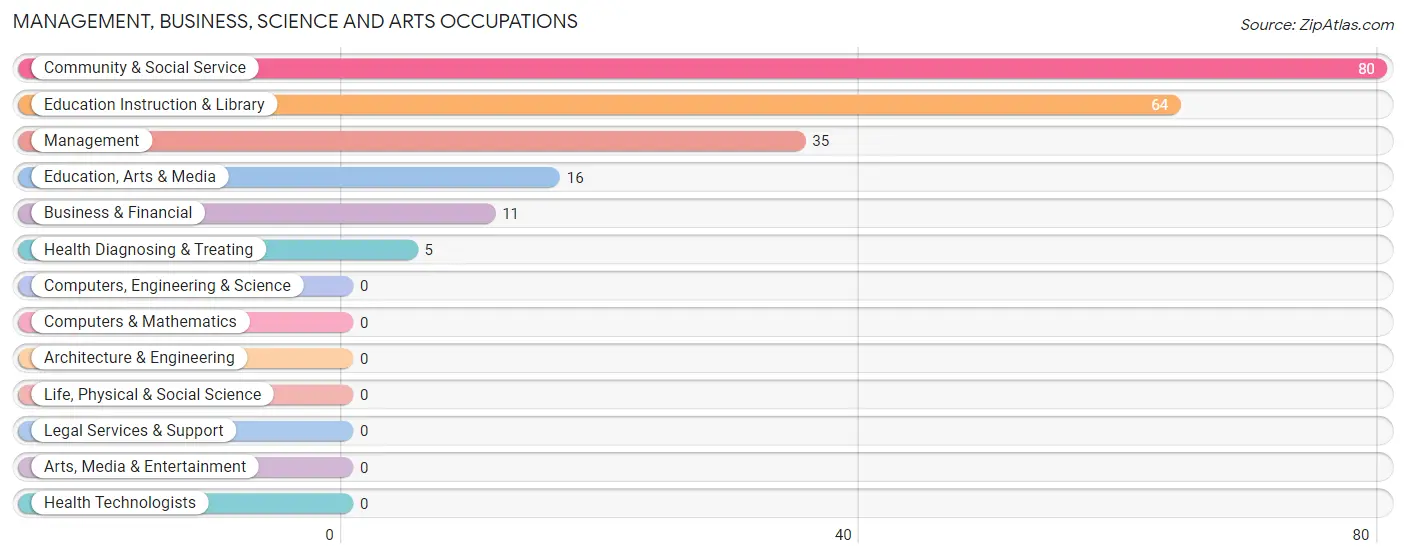
Management, Business, Science and Arts Occupations
The most common Management, Business, Science and Arts occupations in Ashland are Community & Social Service (80 | 22.9%), Education Instruction & Library (64 | 18.3%), Management (35 | 10.0%), Education, Arts & Media (16 | 4.6%), and Business & Financial (11 | 3.2%).
Management, Business, Science and Arts Occupations by Sex
Within the Management, Business, Science and Arts occupations in Ashland, the most male-oriented occupations are Education, Arts & Media (81.2%), Community & Social Service (41.2%), and Education Instruction & Library (31.2%), while the most female-oriented occupations are Business & Financial (100.0%), Health Diagnosing & Treating (100.0%), and Management (80.0%).
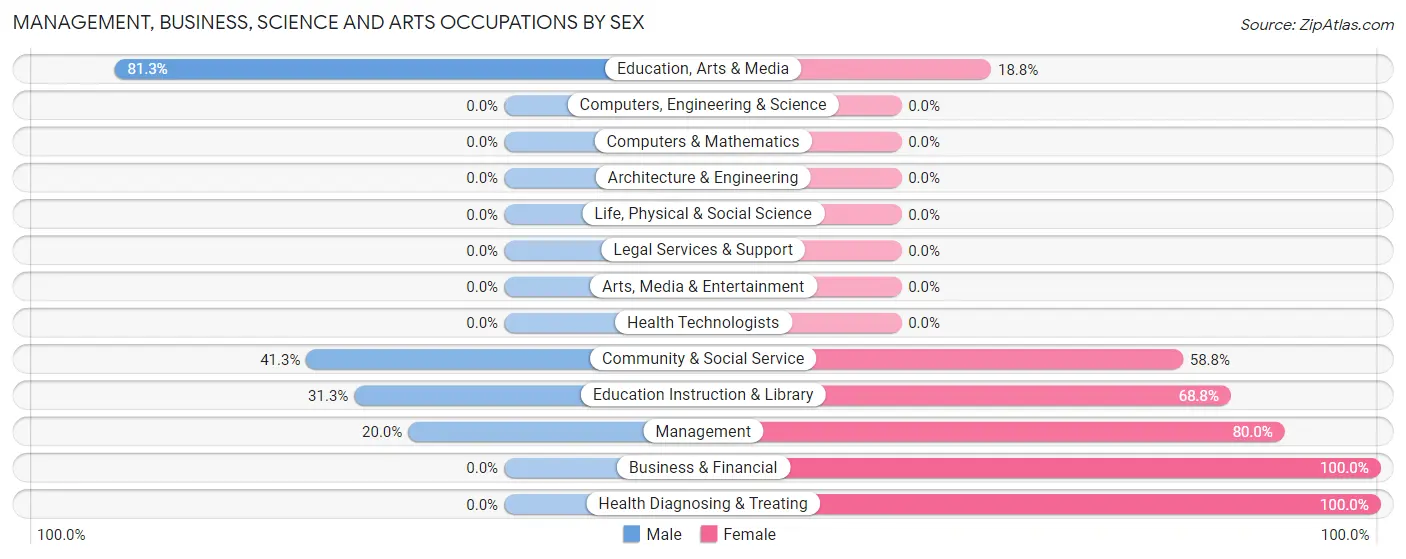
| Occupation | Male | Female |
| Management | 7 (20.0%) | 28 (80.0%) |
| Business & Financial | 0 (0.0%) | 11 (100.0%) |
| Computers, Engineering & Science | 0 (0.0%) | 0 (0.0%) |
| Computers & Mathematics | 0 (0.0%) | 0 (0.0%) |
| Architecture & Engineering | 0 (0.0%) | 0 (0.0%) |
| Life, Physical & Social Science | 0 (0.0%) | 0 (0.0%) |
| Community & Social Service | 33 (41.2%) | 47 (58.8%) |
| Education, Arts & Media | 13 (81.2%) | 3 (18.8%) |
| Legal Services & Support | 0 (0.0%) | 0 (0.0%) |
| Education Instruction & Library | 20 (31.2%) | 44 (68.8%) |
| Arts, Media & Entertainment | 0 (0.0%) | 0 (0.0%) |
| Health Diagnosing & Treating | 0 (0.0%) | 5 (100.0%) |
| Health Technologists | 0 (0.0%) | 0 (0.0%) |
| Total (Category) | 40 (30.5%) | 91 (69.5%) |
| Total (Overall) | 143 (41.0%) | 206 (59.0%) |
Services Occupations
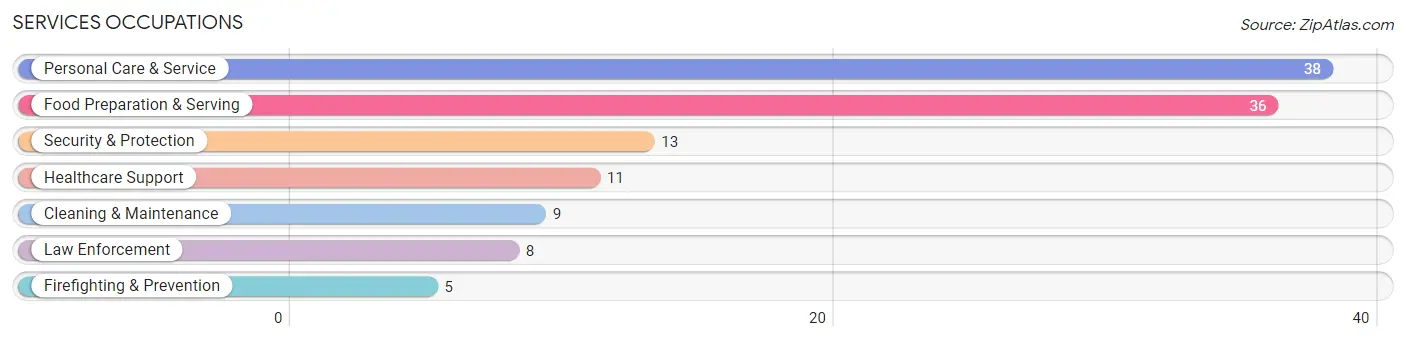
The most common Services occupations in Ashland are Personal Care & Service (38 | 10.9%), Food Preparation & Serving (36 | 10.3%), Security & Protection (13 | 3.7%), Healthcare Support (11 | 3.2%), and Cleaning & Maintenance (9 | 2.6%).
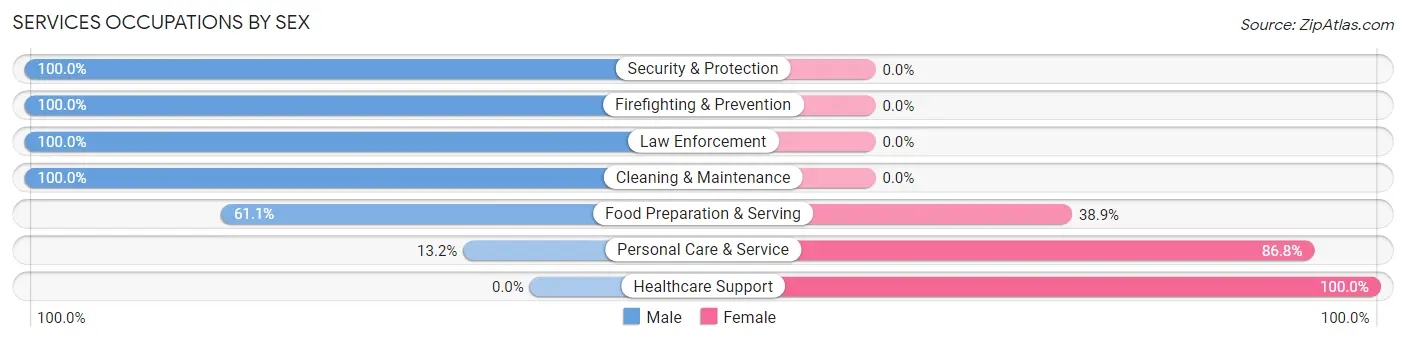
Services Occupations by Sex
Within the Services occupations in Ashland, the most male-oriented occupations are Security & Protection (100.0%), Firefighting & Prevention (100.0%), and Law Enforcement (100.0%), while the most female-oriented occupations are Healthcare Support (100.0%), Personal Care & Service (86.8%), and Food Preparation & Serving (38.9%).
| Occupation | Male | Female |
| Healthcare Support | 0 (0.0%) | 11 (100.0%) |
| Security & Protection | 13 (100.0%) | 0 (0.0%) |
| Firefighting & Prevention | 5 (100.0%) | 0 (0.0%) |
| Law Enforcement | 8 (100.0%) | 0 (0.0%) |
| Food Preparation & Serving | 22 (61.1%) | 14 (38.9%) |
| Cleaning & Maintenance | 9 (100.0%) | 0 (0.0%) |
| Personal Care & Service | 5 (13.2%) | 33 (86.8%) |
| Total (Category) | 49 (45.8%) | 58 (54.2%) |
| Total (Overall) | 143 (41.0%) | 206 (59.0%) |
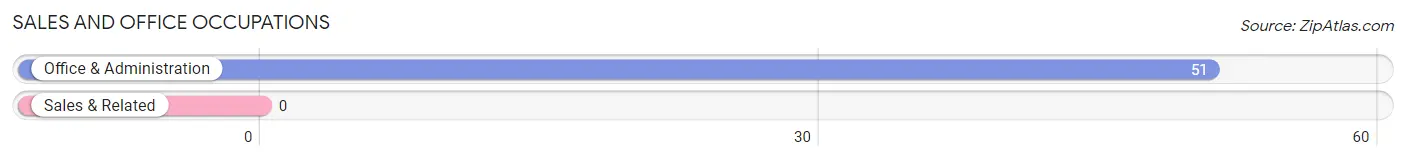
Sales and Office Occupations
The most common Sales and Office occupations in Ashland are , and Office & Administration (51 | 14.6%).
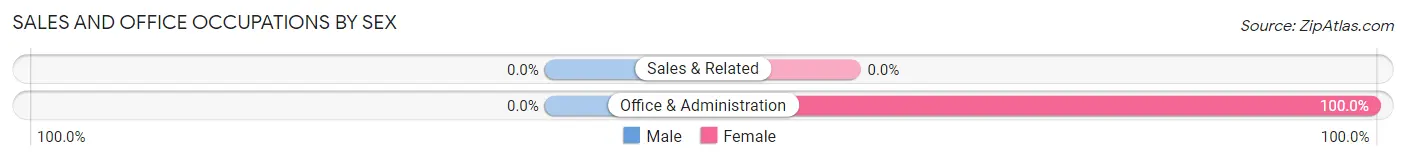
Sales and Office Occupations by Sex
| Occupation | Male | Female |
| Sales & Related | 0 (0.0%) | 0 (0.0%) |
| Office & Administration | 0 (0.0%) | 51 (100.0%) |
| Total (Category) | 0 (0.0%) | 51 (100.0%) |
| Total (Overall) | 143 (41.0%) | 206 (59.0%) |
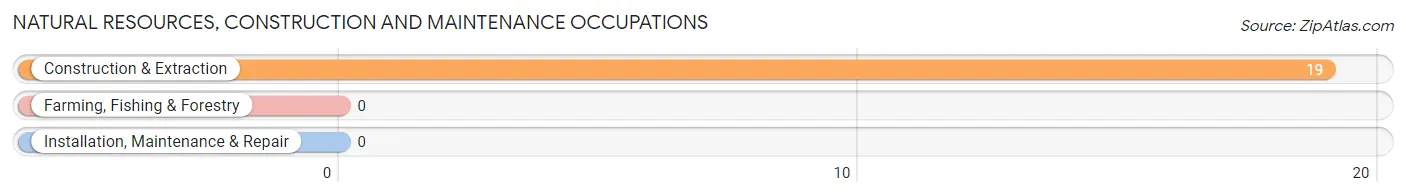
Natural Resources, Construction and Maintenance Occupations
The most common Natural Resources, Construction and Maintenance occupations in Ashland are , and Construction & Extraction (19 | 5.4%).
Natural Resources, Construction and Maintenance Occupations by Sex
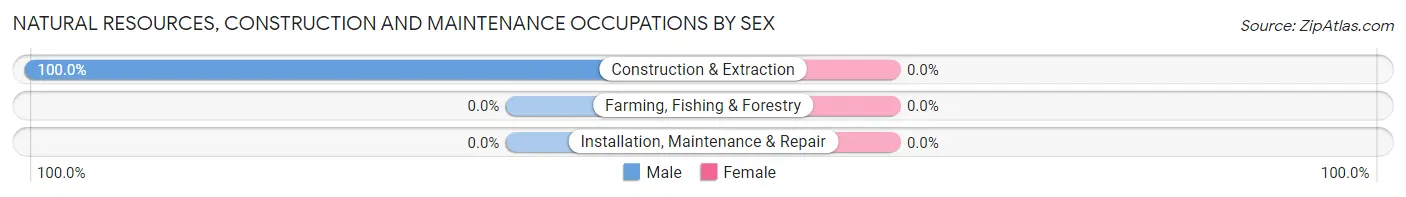
| Occupation | Male | Female |
| Farming, Fishing & Forestry | 0 (0.0%) | 0 (0.0%) |
| Construction & Extraction | 19 (100.0%) | 0 (0.0%) |
| Installation, Maintenance & Repair | 0 (0.0%) | 0 (0.0%) |
| Total (Category) | 19 (100.0%) | 0 (0.0%) |
| Total (Overall) | 143 (41.0%) | 206 (59.0%) |
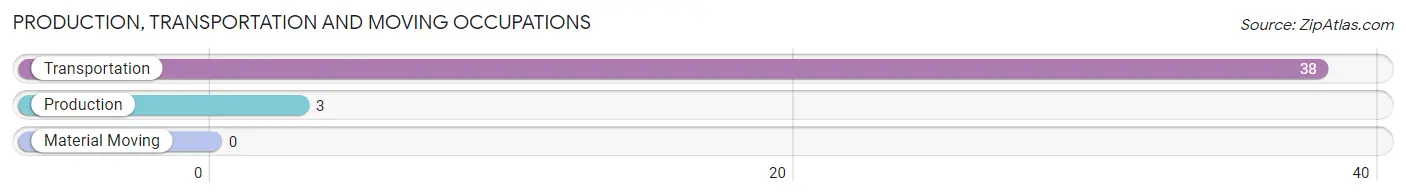
Production, Transportation and Moving Occupations
The most common Production, Transportation and Moving occupations in Ashland are Transportation (38 | 10.9%), and Production (3 | 0.9%).
Production, Transportation and Moving Occupations by Sex
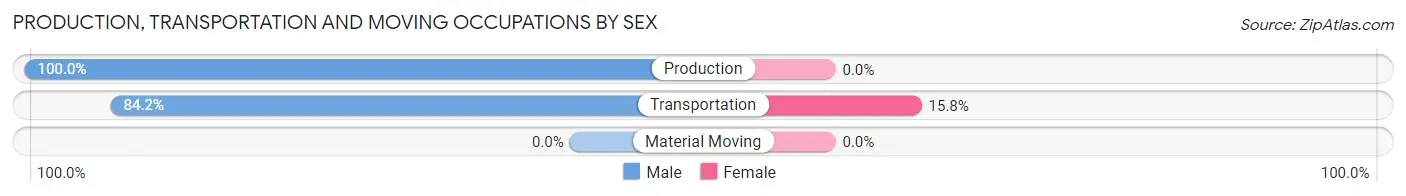
| Occupation | Male | Female |
| Production | 3 (100.0%) | 0 (0.0%) |
| Transportation | 32 (84.2%) | 6 (15.8%) |
| Material Moving | 0 (0.0%) | 0 (0.0%) |
| Total (Category) | 35 (85.4%) | 6 (14.6%) |
| Total (Overall) | 143 (41.0%) | 206 (59.0%) |
Employment Industries by Sex in Ashland
Employment Industries in Ashland
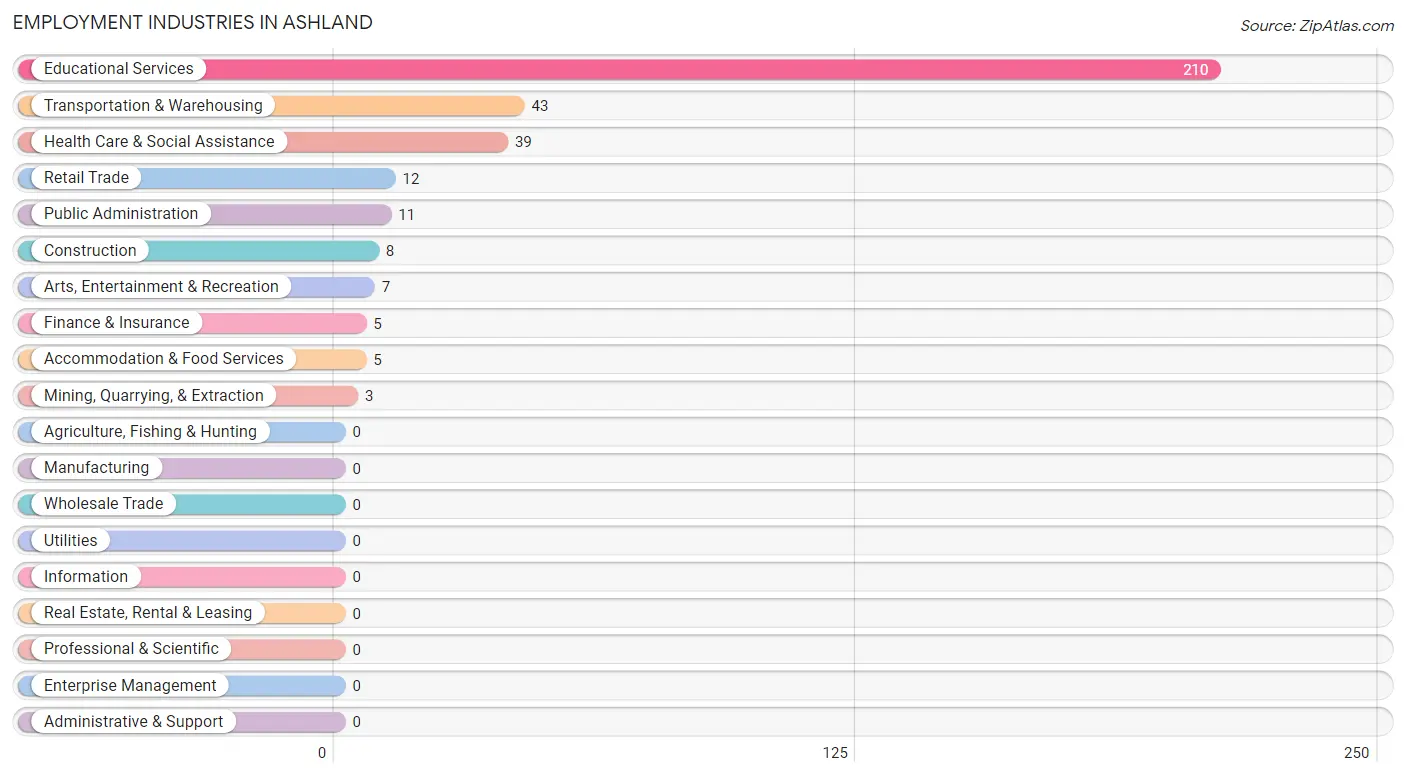
The major employment industries in Ashland include Educational Services (210 | 60.2%), Transportation & Warehousing (43 | 12.3%), Health Care & Social Assistance (39 | 11.2%), Retail Trade (12 | 3.4%), and Public Administration (11 | 3.2%).
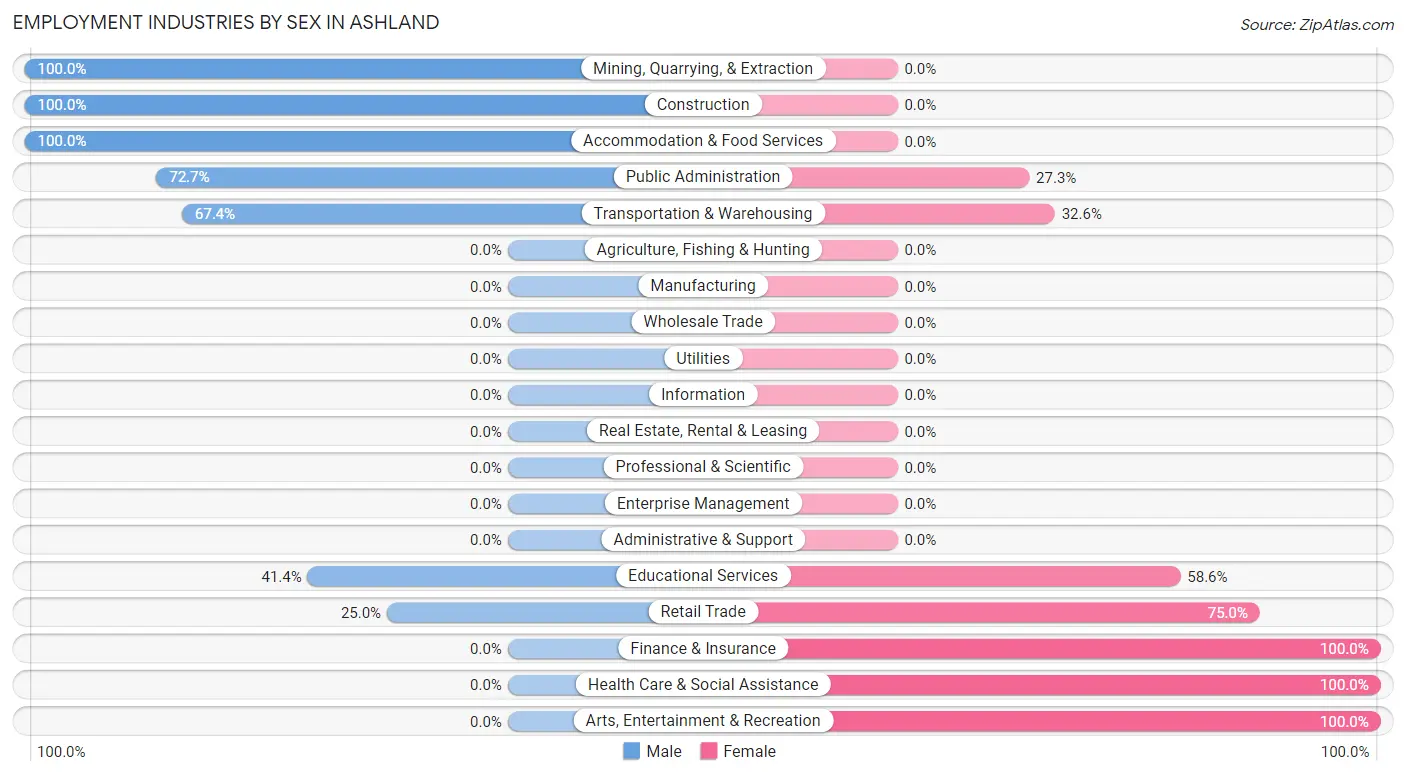
Employment Industries by Sex in Ashland
The Ashland industries that see more men than women are Mining, Quarrying, & Extraction (100.0%), Construction (100.0%), and Accommodation & Food Services (100.0%), whereas the industries that tend to have a higher number of women are Finance & Insurance (100.0%), Health Care & Social Assistance (100.0%), and Arts, Entertainment & Recreation (100.0%).
| Industry | Male | Female |
| Agriculture, Fishing & Hunting | 0 (0.0%) | 0 (0.0%) |
| Mining, Quarrying, & Extraction | 3 (100.0%) | 0 (0.0%) |
| Construction | 8 (100.0%) | 0 (0.0%) |
| Manufacturing | 0 (0.0%) | 0 (0.0%) |
| Wholesale Trade | 0 (0.0%) | 0 (0.0%) |
| Retail Trade | 3 (25.0%) | 9 (75.0%) |
| Transportation & Warehousing | 29 (67.4%) | 14 (32.6%) |
| Utilities | 0 (0.0%) | 0 (0.0%) |
| Information | 0 (0.0%) | 0 (0.0%) |
| Finance & Insurance | 0 (0.0%) | 5 (100.0%) |
| Real Estate, Rental & Leasing | 0 (0.0%) | 0 (0.0%) |
| Professional & Scientific | 0 (0.0%) | 0 (0.0%) |
| Enterprise Management | 0 (0.0%) | 0 (0.0%) |
| Administrative & Support | 0 (0.0%) | 0 (0.0%) |
| Educational Services | 87 (41.4%) | 123 (58.6%) |
| Health Care & Social Assistance | 0 (0.0%) | 39 (100.0%) |
| Arts, Entertainment & Recreation | 0 (0.0%) | 7 (100.0%) |
| Accommodation & Food Services | 5 (100.0%) | 0 (0.0%) |
| Public Administration | 8 (72.7%) | 3 (27.3%) |
| Total | 143 (41.0%) | 206 (59.0%) |
Education in Ashland
School Enrollment in Ashland
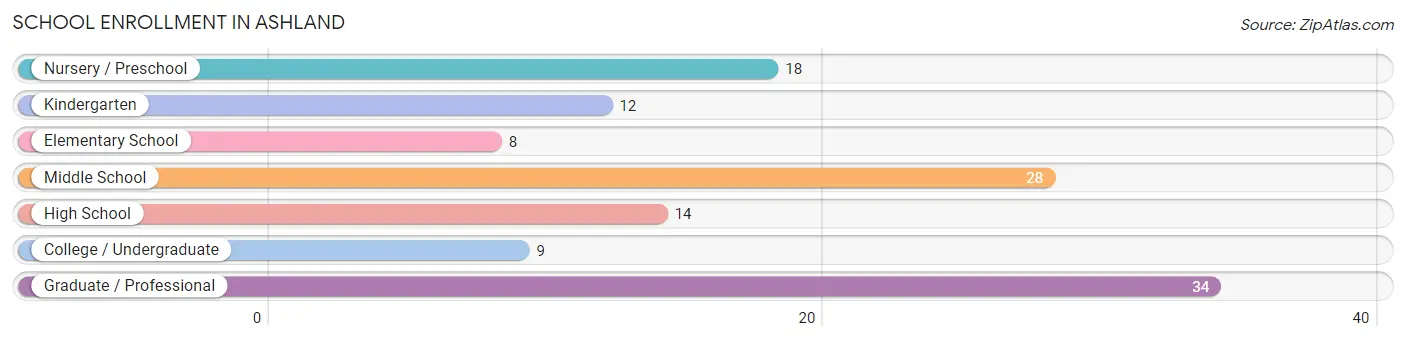
The most common levels of schooling among the 123 students in Ashland are graduate / professional (34 | 27.6%), middle school (28 | 22.8%), and nursery / preschool (18 | 14.6%).
| School Level | # Students | % Students |
| Nursery / Preschool | 18 | 14.6% |
| Kindergarten | 12 | 9.8% |
| Elementary School | 8 | 6.5% |
| Middle School | 28 | 22.8% |
| High School | 14 | 11.4% |
| College / Undergraduate | 9 | 7.3% |
| Graduate / Professional | 34 | 27.6% |
| Total | 123 | 100.0% |
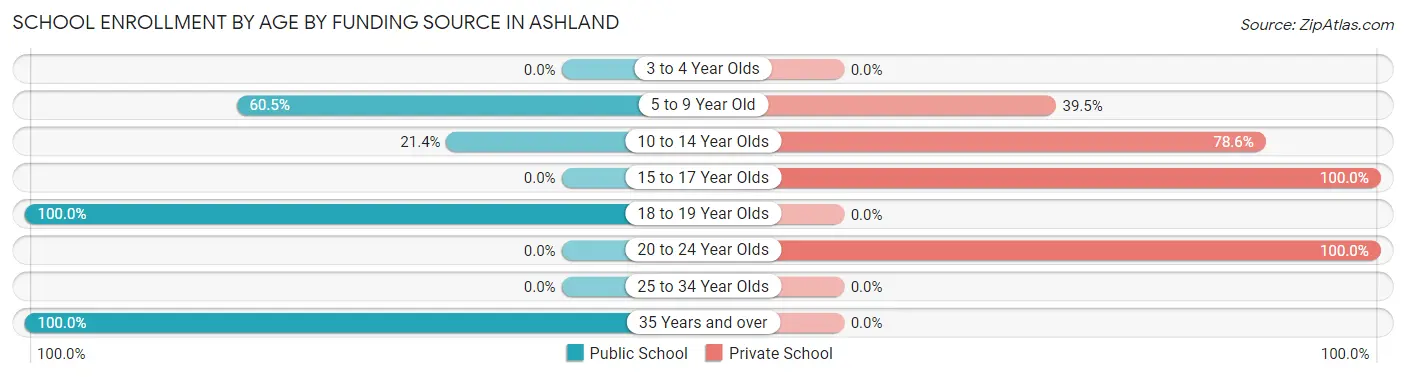
School Enrollment by Age by Funding Source in Ashland
Out of a total of 123 students who are enrolled in schools in Ashland, 81 (65.9%) attend a private institution, while the remaining 42 (34.1%) are enrolled in public schools. The age group of 15 to 17 year olds has the highest likelihood of being enrolled in private schools, with 14 (100.0% in the age bracket) enrolled. Conversely, the age group of 18 to 19 year olds has the lowest likelihood of being enrolled in a private school, with 9 (100.0% in the age bracket) attending a public institution.
| Age Bracket | Public School | Private School |
| 3 to 4 Year Olds | 0 (0.0%) | 0 (0.0%) |
| 5 to 9 Year Old | 23 (60.5%) | 15 (39.5%) |
| 10 to 14 Year Olds | 6 (21.4%) | 22 (78.6%) |
| 15 to 17 Year Olds | 0 (0.0%) | 14 (100.0%) |
| 18 to 19 Year Olds | 9 (100.0%) | 0 (0.0%) |
| 20 to 24 Year Olds | 0 (0.0%) | 30 (100.0%) |
| 25 to 34 Year Olds | 0 (0.0%) | 0 (0.0%) |
| 35 Years and over | 4 (100.0%) | 0 (0.0%) |
| Total | 42 (34.1%) | 81 (65.9%) |
Educational Attainment by Field of Study in Ashland
Education (42 | 39.6%), business (25 | 23.6%), arts & humanities (15 | 14.1%), science & technology (13 | 12.3%), and computers & mathematics (5 | 4.7%) are the most common fields of study among 106 individuals in Ashland who have obtained a bachelor's degree or higher.
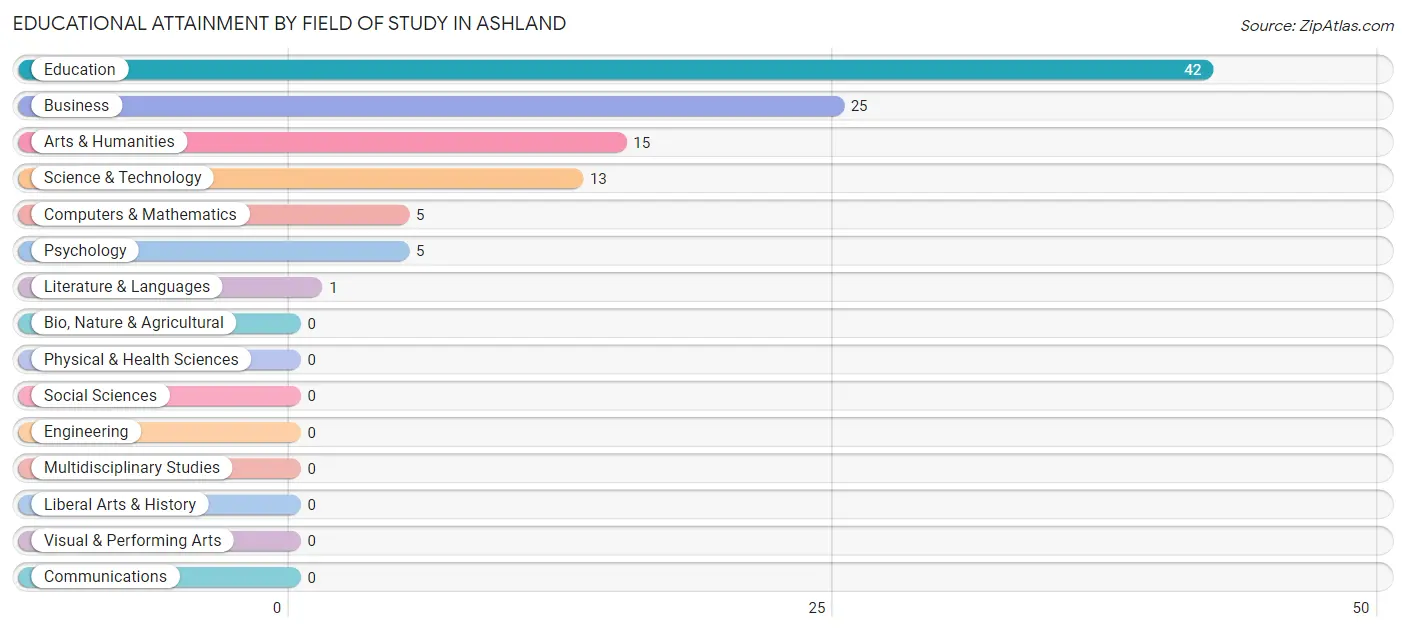
| Field of Study | # Graduates | % Graduates |
| Computers & Mathematics | 5 | 4.7% |
| Bio, Nature & Agricultural | 0 | 0.0% |
| Physical & Health Sciences | 0 | 0.0% |
| Psychology | 5 | 4.7% |
| Social Sciences | 0 | 0.0% |
| Engineering | 0 | 0.0% |
| Multidisciplinary Studies | 0 | 0.0% |
| Science & Technology | 13 | 12.3% |
| Business | 25 | 23.6% |
| Education | 42 | 39.6% |
| Literature & Languages | 1 | 0.9% |
| Liberal Arts & History | 0 | 0.0% |
| Visual & Performing Arts | 0 | 0.0% |
| Communications | 0 | 0.0% |
| Arts & Humanities | 15 | 14.1% |
| Total | 106 | 100.0% |
Transportation & Commute in Ashland
Vehicle Availability by Sex in Ashland
The most prevalent vehicle ownership categories in Ashland are males with 1 vehicle (61, accounting for 42.7%) and females with 1 vehicle (97, making up 29.8%).
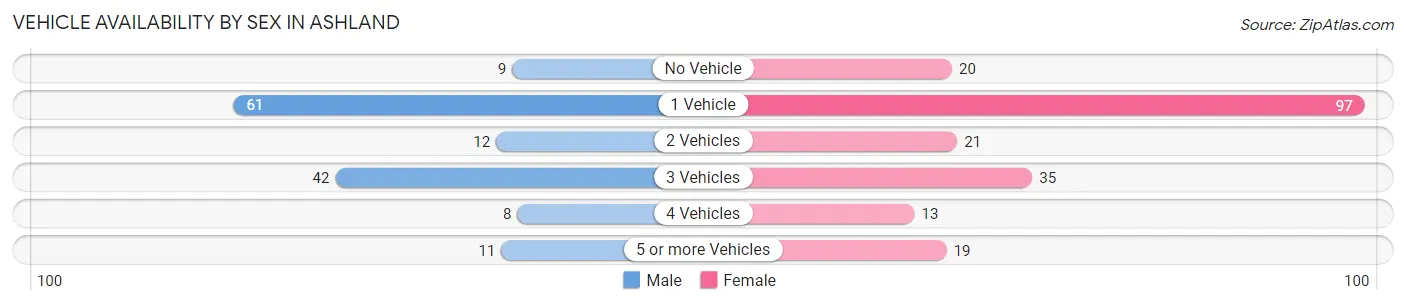
| Vehicles Available | Male | Female |
| No Vehicle | 9 (6.3%) | 20 (9.8%) |
| 1 Vehicle | 61 (42.7%) | 97 (47.3%) |
| 2 Vehicles | 12 (8.4%) | 21 (10.2%) |
| 3 Vehicles | 42 (29.4%) | 35 (17.1%) |
| 4 Vehicles | 8 (5.6%) | 13 (6.3%) |
| 5 or more Vehicles | 11 (7.7%) | 19 (9.3%) |
| Total | 143 (100.0%) | 205 (100.0%) |
Commute Time in Ashland
The most frequently occuring commute durations in Ashland are 5 to 9 minutes (119 commuters, 34.2%), less than 5 minutes (67 commuters, 19.3%), and 15 to 19 minutes (57 commuters, 16.4%).
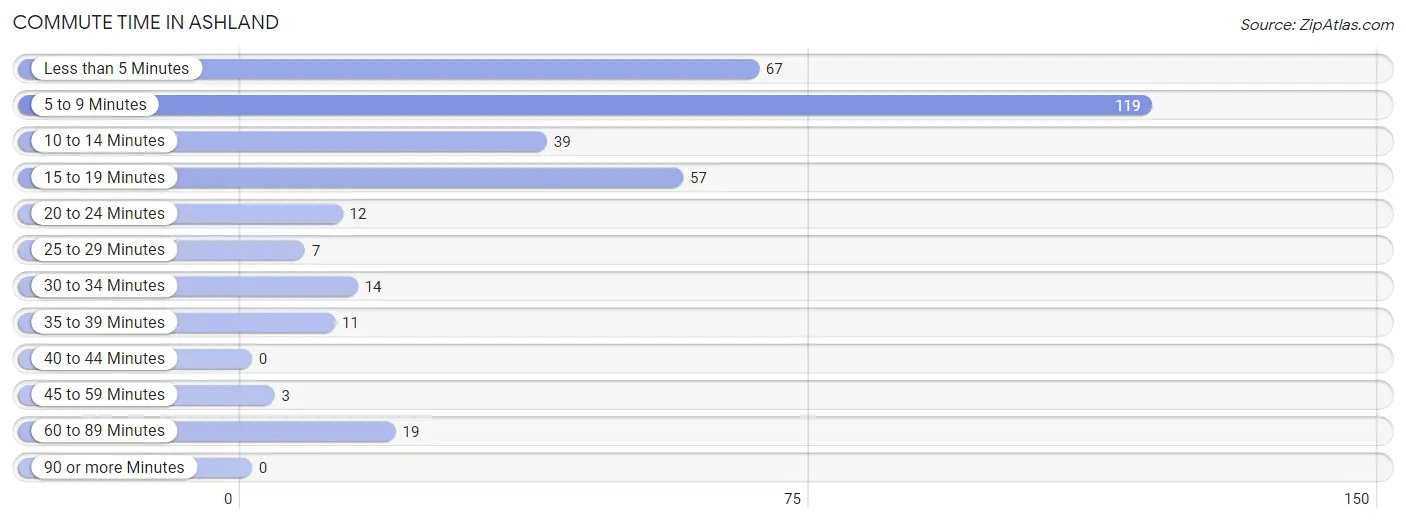
| Commute Time | # Commuters | % Commuters |
| Less than 5 Minutes | 67 | 19.3% |
| 5 to 9 Minutes | 119 | 34.2% |
| 10 to 14 Minutes | 39 | 11.2% |
| 15 to 19 Minutes | 57 | 16.4% |
| 20 to 24 Minutes | 12 | 3.5% |
| 25 to 29 Minutes | 7 | 2.0% |
| 30 to 34 Minutes | 14 | 4.0% |
| 35 to 39 Minutes | 11 | 3.2% |
| 40 to 44 Minutes | 0 | 0.0% |
| 45 to 59 Minutes | 3 | 0.9% |
| 60 to 89 Minutes | 19 | 5.5% |
| 90 or more Minutes | 0 | 0.0% |
Commute Time by Sex in Ashland
The most common commute times in Ashland are 5 to 9 minutes (51 commuters, 35.7%) for males and 5 to 9 minutes (68 commuters, 33.2%) for females.

| Commute Time | Male | Female |
| Less than 5 Minutes | 23 (16.1%) | 44 (21.5%) |
| 5 to 9 Minutes | 51 (35.7%) | 68 (33.2%) |
| 10 to 14 Minutes | 1 (0.7%) | 38 (18.5%) |
| 15 to 19 Minutes | 49 (34.3%) | 8 (3.9%) |
| 20 to 24 Minutes | 9 (6.3%) | 3 (1.5%) |
| 25 to 29 Minutes | 2 (1.4%) | 5 (2.4%) |
| 30 to 34 Minutes | 0 (0.0%) | 14 (6.8%) |
| 35 to 39 Minutes | 0 (0.0%) | 11 (5.4%) |
| 40 to 44 Minutes | 0 (0.0%) | 0 (0.0%) |
| 45 to 59 Minutes | 3 (2.1%) | 0 (0.0%) |
| 60 to 89 Minutes | 5 (3.5%) | 14 (6.8%) |
| 90 or more Minutes | 0 (0.0%) | 0 (0.0%) |
Time of Departure to Work by Sex in Ashland
The most frequent times of departure to work in Ashland are 7:00 AM to 7:29 AM (61, 42.7%) for males and 7:30 AM to 7:59 AM (95, 46.3%) for females.
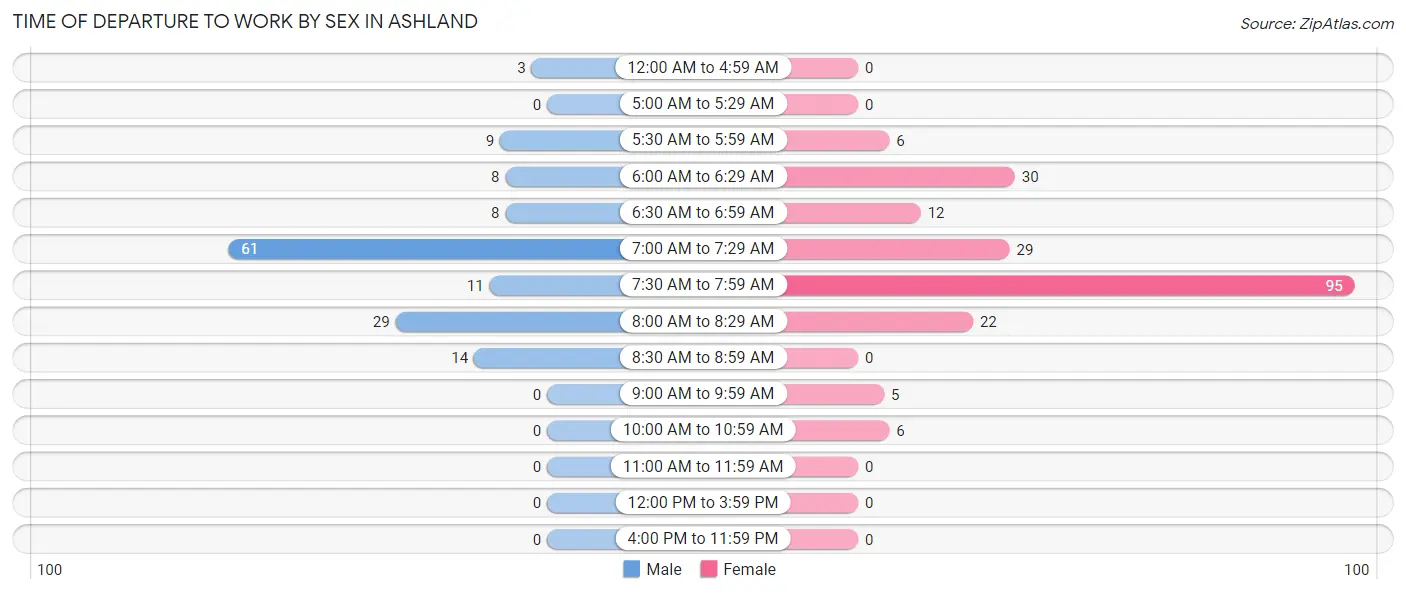
| Time of Departure | Male | Female |
| 12:00 AM to 4:59 AM | 3 (2.1%) | 0 (0.0%) |
| 5:00 AM to 5:29 AM | 0 (0.0%) | 0 (0.0%) |
| 5:30 AM to 5:59 AM | 9 (6.3%) | 6 (2.9%) |
| 6:00 AM to 6:29 AM | 8 (5.6%) | 30 (14.6%) |
| 6:30 AM to 6:59 AM | 8 (5.6%) | 12 (5.9%) |
| 7:00 AM to 7:29 AM | 61 (42.7%) | 29 (14.1%) |
| 7:30 AM to 7:59 AM | 11 (7.7%) | 95 (46.3%) |
| 8:00 AM to 8:29 AM | 29 (20.3%) | 22 (10.7%) |
| 8:30 AM to 8:59 AM | 14 (9.8%) | 0 (0.0%) |
| 9:00 AM to 9:59 AM | 0 (0.0%) | 5 (2.4%) |
| 10:00 AM to 10:59 AM | 0 (0.0%) | 6 (2.9%) |
| 11:00 AM to 11:59 AM | 0 (0.0%) | 0 (0.0%) |
| 12:00 PM to 3:59 PM | 0 (0.0%) | 0 (0.0%) |
| 4:00 PM to 11:59 PM | 0 (0.0%) | 0 (0.0%) |
| Total | 143 (100.0%) | 205 (100.0%) |
Housing Occupancy in Ashland
Occupancy by Ownership in Ashland
Of the total 362 dwellings in Ashland, owner-occupied units account for 77 (21.3%), while renter-occupied units make up 285 (78.7%).
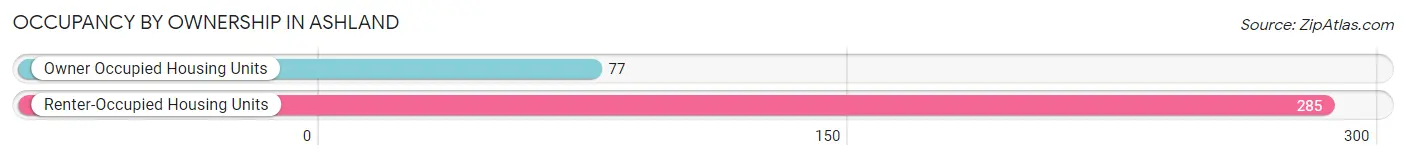
| Occupancy | # Housing Units | % Housing Units |
| Owner Occupied Housing Units | 77 | 21.3% |
| Renter-Occupied Housing Units | 285 | 78.7% |
| Total Occupied Housing Units | 362 | 100.0% |
Occupancy by Household Size in Ashland
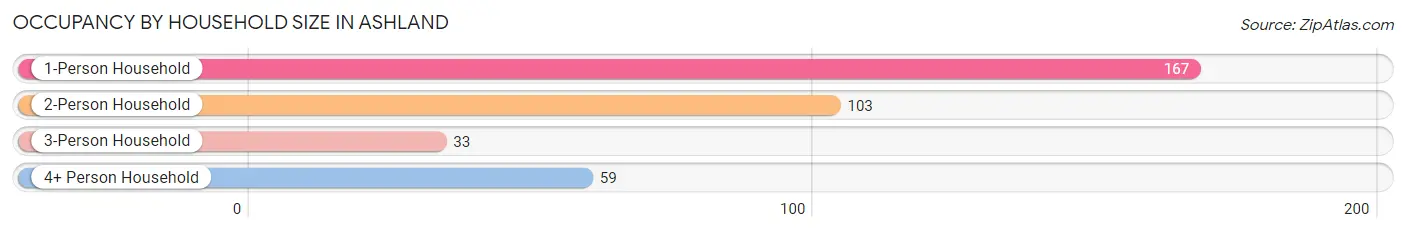
| Household Size | # Housing Units | % Housing Units |
| 1-Person Household | 167 | 46.1% |
| 2-Person Household | 103 | 28.4% |
| 3-Person Household | 33 | 9.1% |
| 4+ Person Household | 59 | 16.3% |
| Total Housing Units | 362 | 100.0% |
Occupancy by Ownership by Household Size in Ashland
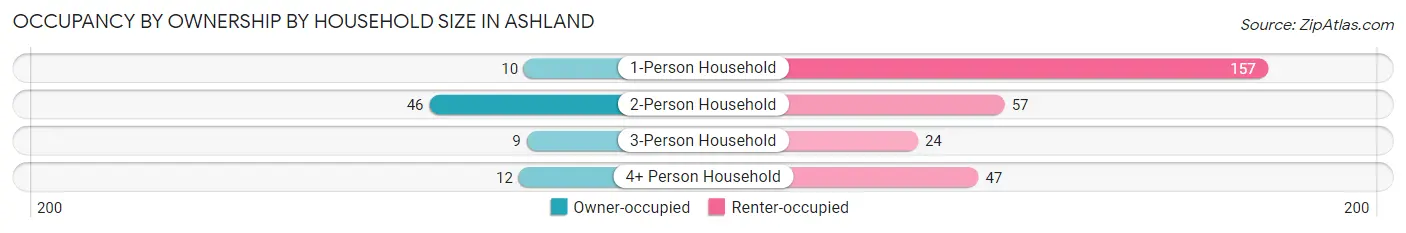
| Household Size | Owner-occupied | Renter-occupied |
| 1-Person Household | 10 (6.0%) | 157 (94.0%) |
| 2-Person Household | 46 (44.7%) | 57 (55.3%) |
| 3-Person Household | 9 (27.3%) | 24 (72.7%) |
| 4+ Person Household | 12 (20.3%) | 47 (79.7%) |
| Total Housing Units | 77 (21.3%) | 285 (78.7%) |
Occupancy by Educational Attainment in Ashland
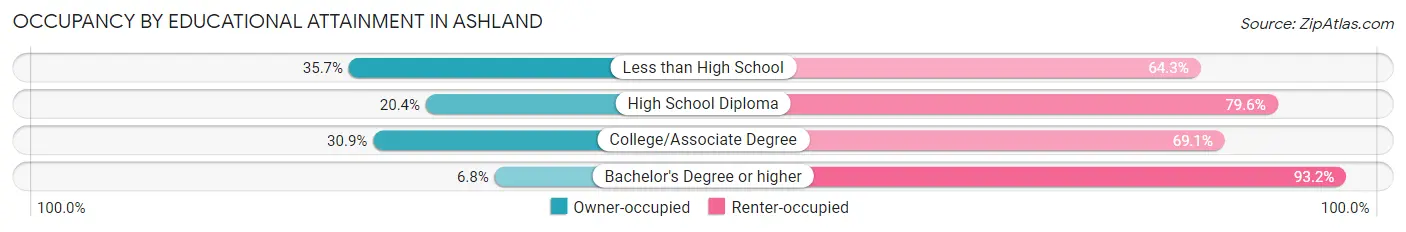
| Household Size | Owner-occupied | Renter-occupied |
| Less than High School | 5 (35.7%) | 9 (64.3%) |
| High School Diploma | 28 (20.4%) | 109 (79.6%) |
| College/Associate Degree | 38 (30.9%) | 85 (69.1%) |
| Bachelor's Degree or higher | 6 (6.8%) | 82 (93.2%) |
Occupancy by Age of Householder in Ashland
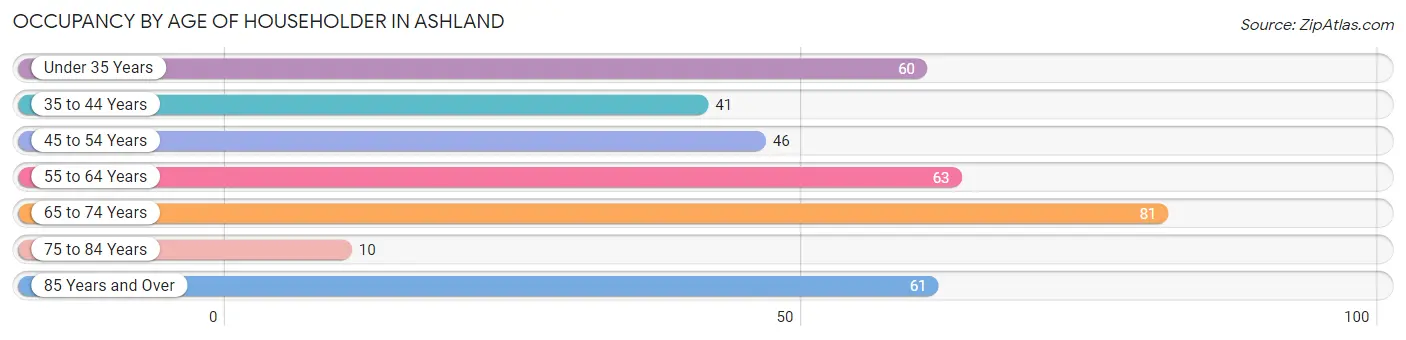
| Age Bracket | # Households | % Households |
| Under 35 Years | 60 | 16.6% |
| 35 to 44 Years | 41 | 11.3% |
| 45 to 54 Years | 46 | 12.7% |
| 55 to 64 Years | 63 | 17.4% |
| 65 to 74 Years | 81 | 22.4% |
| 75 to 84 Years | 10 | 2.8% |
| 85 Years and Over | 61 | 16.9% |
| Total | 362 | 100.0% |
Housing Finances in Ashland
Median Income by Occupancy in Ashland
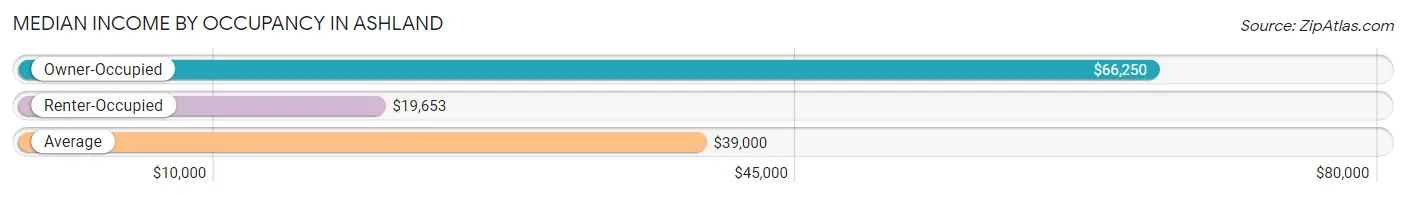
| Occupancy Type | # Households | Median Income |
| Owner-Occupied | 77 (21.3%) | $66,250 |
| Renter-Occupied | 285 (78.7%) | $19,653 |
| Average | 362 (100.0%) | $39,000 |
Occupancy by Householder Income Bracket in Ashland
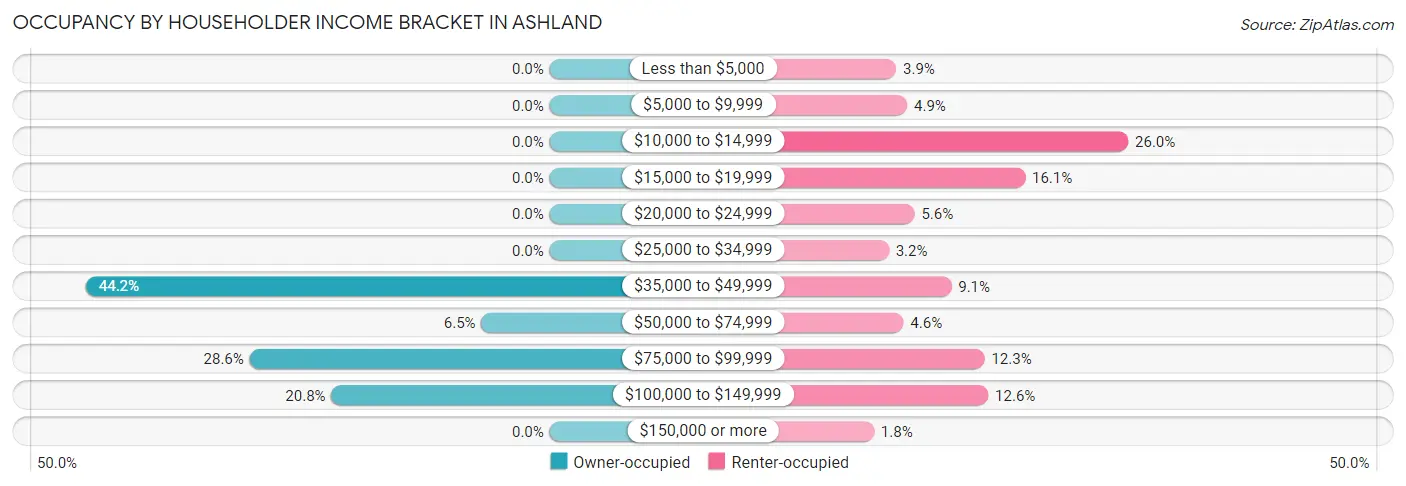
| Income Bracket | Owner-occupied | Renter-occupied |
| Less than $5,000 | 0 (0.0%) | 11 (3.9%) |
| $5,000 to $9,999 | 0 (0.0%) | 14 (4.9%) |
| $10,000 to $14,999 | 0 (0.0%) | 74 (26.0%) |
| $15,000 to $19,999 | 0 (0.0%) | 46 (16.1%) |
| $20,000 to $24,999 | 0 (0.0%) | 16 (5.6%) |
| $25,000 to $34,999 | 0 (0.0%) | 9 (3.2%) |
| $35,000 to $49,999 | 34 (44.2%) | 26 (9.1%) |
| $50,000 to $74,999 | 5 (6.5%) | 13 (4.6%) |
| $75,000 to $99,999 | 22 (28.6%) | 35 (12.3%) |
| $100,000 to $149,999 | 16 (20.8%) | 36 (12.6%) |
| $150,000 or more | 0 (0.0%) | 5 (1.8%) |
| Total | 77 (100.0%) | 285 (100.0%) |
Monthly Housing Cost Tiers in Ashland
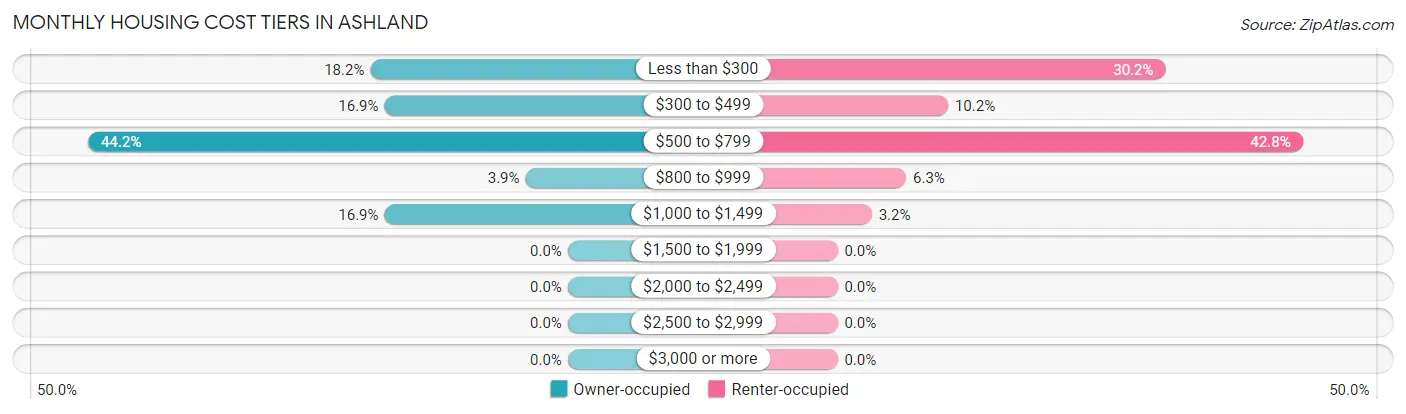
| Monthly Cost | Owner-occupied | Renter-occupied |
| Less than $300 | 14 (18.2%) | 86 (30.2%) |
| $300 to $499 | 13 (16.9%) | 29 (10.2%) |
| $500 to $799 | 34 (44.2%) | 122 (42.8%) |
| $800 to $999 | 3 (3.9%) | 18 (6.3%) |
| $1,000 to $1,499 | 13 (16.9%) | 9 (3.2%) |
| $1,500 to $1,999 | 0 (0.0%) | 0 (0.0%) |
| $2,000 to $2,499 | 0 (0.0%) | 0 (0.0%) |
| $2,500 to $2,999 | 0 (0.0%) | 0 (0.0%) |
| $3,000 or more | 0 (0.0%) | 0 (0.0%) |
| Total | 77 (100.0%) | 285 (100.0%) |
Physical Housing Characteristics in Ashland
Housing Structures in Ashland
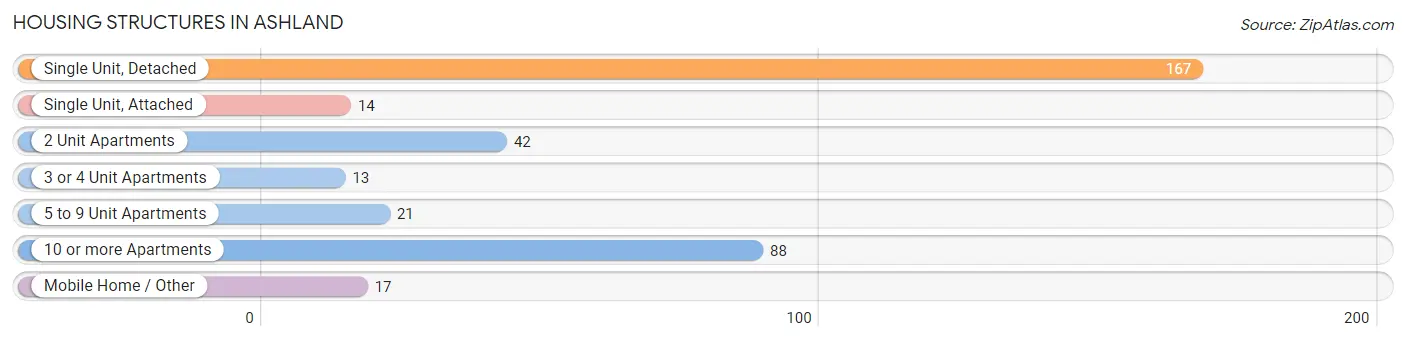
| Structure Type | # Housing Units | % Housing Units |
| Single Unit, Detached | 167 | 46.1% |
| Single Unit, Attached | 14 | 3.9% |
| 2 Unit Apartments | 42 | 11.6% |
| 3 or 4 Unit Apartments | 13 | 3.6% |
| 5 to 9 Unit Apartments | 21 | 5.8% |
| 10 or more Apartments | 88 | 24.3% |
| Mobile Home / Other | 17 | 4.7% |
| Total | 362 | 100.0% |
Housing Structures by Occupancy in Ashland
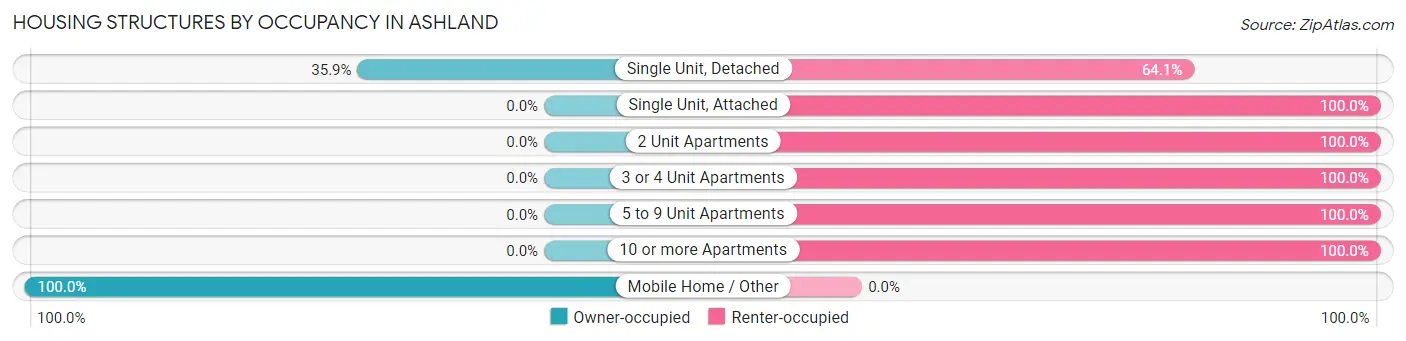
| Structure Type | Owner-occupied | Renter-occupied |
| Single Unit, Detached | 60 (35.9%) | 107 (64.1%) |
| Single Unit, Attached | 0 (0.0%) | 14 (100.0%) |
| 2 Unit Apartments | 0 (0.0%) | 42 (100.0%) |
| 3 or 4 Unit Apartments | 0 (0.0%) | 13 (100.0%) |
| 5 to 9 Unit Apartments | 0 (0.0%) | 21 (100.0%) |
| 10 or more Apartments | 0 (0.0%) | 88 (100.0%) |
| Mobile Home / Other | 17 (100.0%) | 0 (0.0%) |
| Total | 77 (21.3%) | 285 (78.7%) |
Housing Structures by Number of Rooms in Ashland
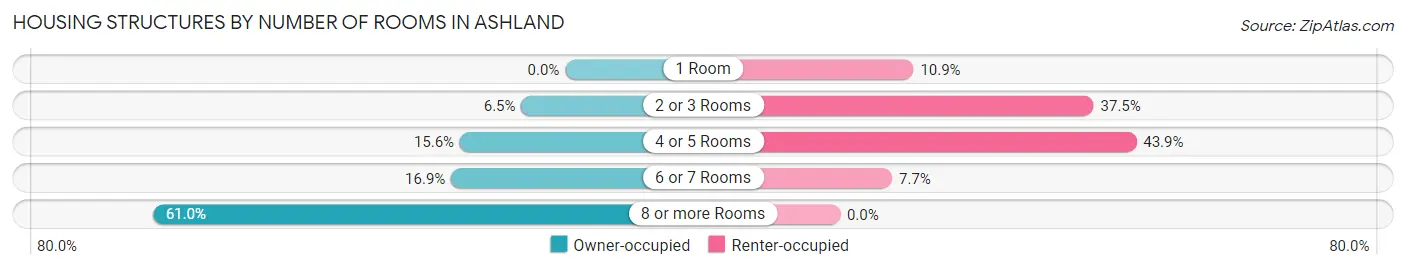
| Number of Rooms | Owner-occupied | Renter-occupied |
| 1 Room | 0 (0.0%) | 31 (10.9%) |
| 2 or 3 Rooms | 5 (6.5%) | 107 (37.5%) |
| 4 or 5 Rooms | 12 (15.6%) | 125 (43.9%) |
| 6 or 7 Rooms | 13 (16.9%) | 22 (7.7%) |
| 8 or more Rooms | 47 (61.0%) | 0 (0.0%) |
| Total | 77 (100.0%) | 285 (100.0%) |
Housing Structure by Heating Type in Ashland
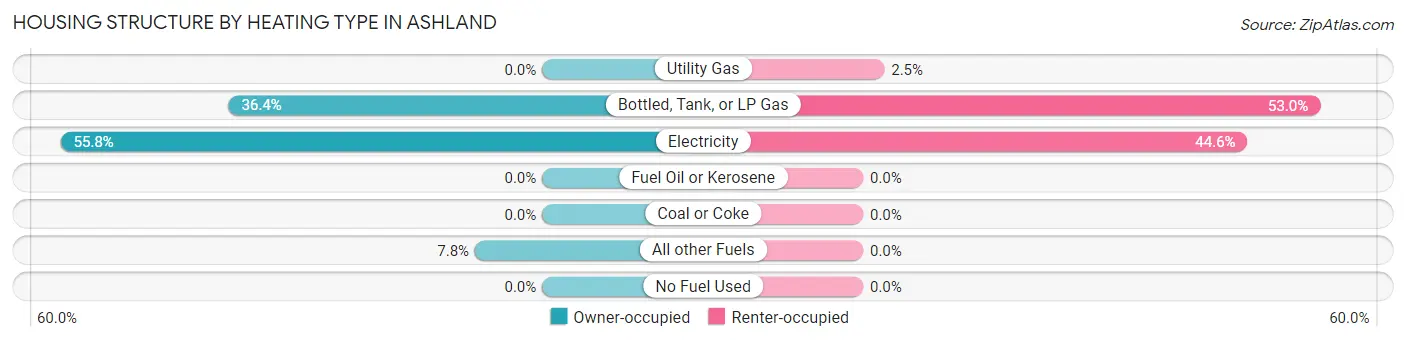
| Heating Type | Owner-occupied | Renter-occupied |
| Utility Gas | 0 (0.0%) | 7 (2.5%) |
| Bottled, Tank, or LP Gas | 28 (36.4%) | 151 (53.0%) |
| Electricity | 43 (55.8%) | 127 (44.6%) |
| Fuel Oil or Kerosene | 0 (0.0%) | 0 (0.0%) |
| Coal or Coke | 0 (0.0%) | 0 (0.0%) |
| All other Fuels | 6 (7.8%) | 0 (0.0%) |
| No Fuel Used | 0 (0.0%) | 0 (0.0%) |
| Total | 77 (100.0%) | 285 (100.0%) |
Household Vehicle Usage in Ashland
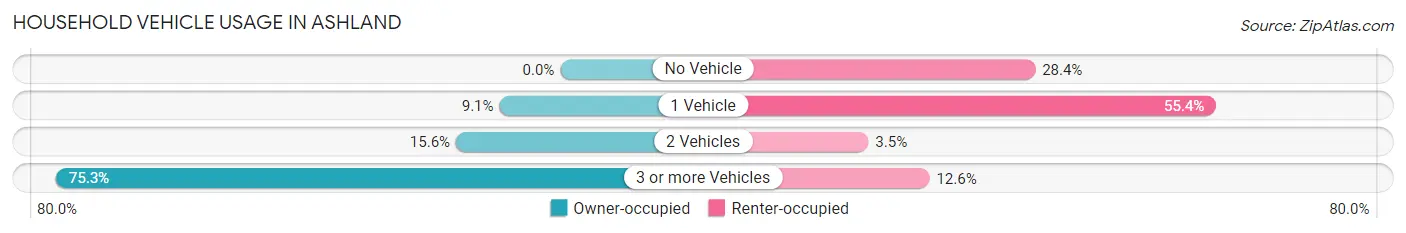
| Vehicles per Household | Owner-occupied | Renter-occupied |
| No Vehicle | 0 (0.0%) | 81 (28.4%) |
| 1 Vehicle | 7 (9.1%) | 158 (55.4%) |
| 2 Vehicles | 12 (15.6%) | 10 (3.5%) |
| 3 or more Vehicles | 58 (75.3%) | 36 (12.6%) |
| Total | 77 (100.0%) | 285 (100.0%) |
Real Estate & Mortgages in Ashland
Real Estate and Mortgage Overview in Ashland
| Characteristic | Without Mortgage | With Mortgage |
| Housing Units | 42 | 35 |
| Median Property Value | $184,400 | $47,300 |
| Median Household Income | $85,000 | $0 |
| Monthly Housing Costs | $425 | $0 |
| Real Estate Taxes | $753 | $0 |
Property Value by Mortgage Status in Ashland
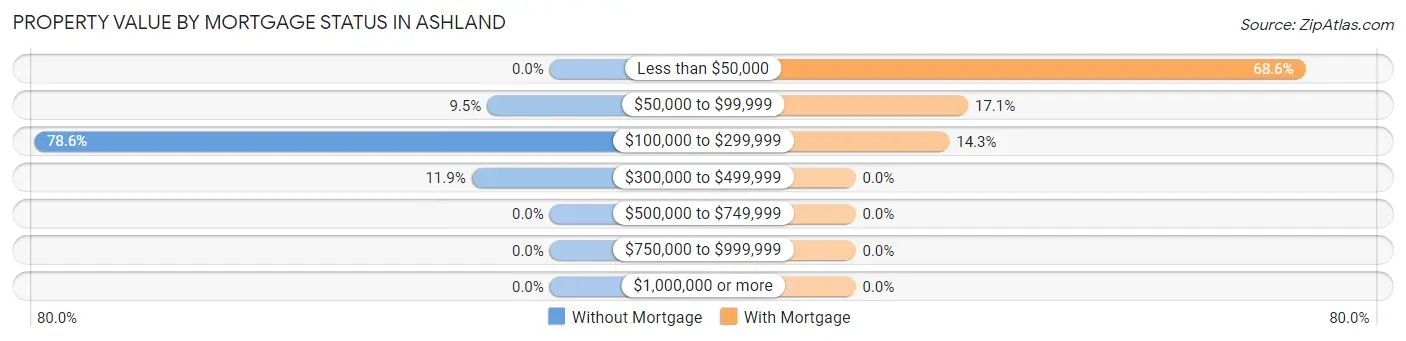
| Property Value | Without Mortgage | With Mortgage |
| Less than $50,000 | 0 (0.0%) | 24 (68.6%) |
| $50,000 to $99,999 | 4 (9.5%) | 6 (17.1%) |
| $100,000 to $299,999 | 33 (78.6%) | 5 (14.3%) |
| $300,000 to $499,999 | 5 (11.9%) | 0 (0.0%) |
| $500,000 to $749,999 | 0 (0.0%) | 0 (0.0%) |
| $750,000 to $999,999 | 0 (0.0%) | 0 (0.0%) |
| $1,000,000 or more | 0 (0.0%) | 0 (0.0%) |
| Total | 42 (100.0%) | 35 (100.0%) |
Household Income by Mortgage Status in Ashland
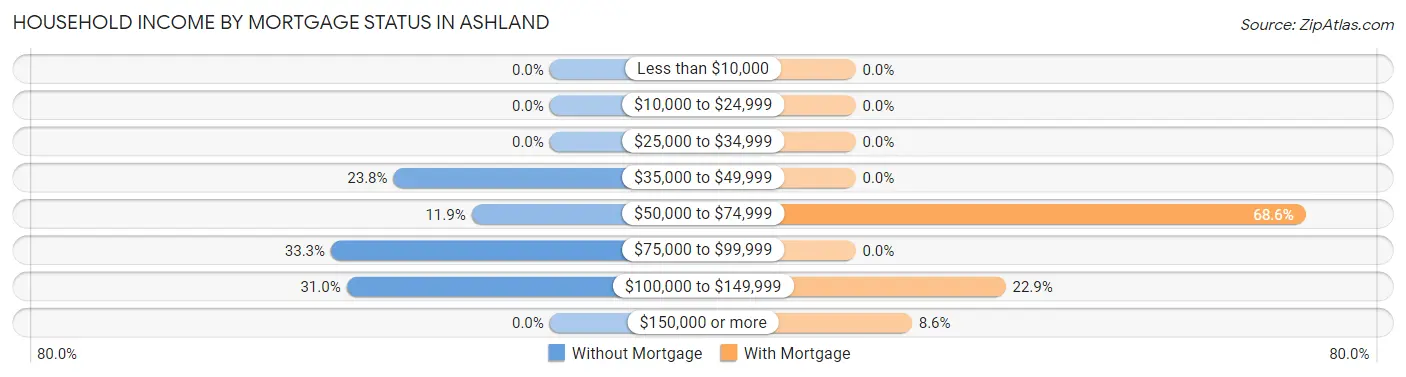
| Household Income | Without Mortgage | With Mortgage |
| Less than $10,000 | 0 (0.0%) | 0 (0.0%) |
| $10,000 to $24,999 | 0 (0.0%) | 0 (0.0%) |
| $25,000 to $34,999 | 0 (0.0%) | 0 (0.0%) |
| $35,000 to $49,999 | 10 (23.8%) | 0 (0.0%) |
| $50,000 to $74,999 | 5 (11.9%) | 24 (68.6%) |
| $75,000 to $99,999 | 14 (33.3%) | 0 (0.0%) |
| $100,000 to $149,999 | 13 (30.9%) | 8 (22.9%) |
| $150,000 or more | 0 (0.0%) | 3 (8.6%) |
| Total | 42 (100.0%) | 35 (100.0%) |
Property Value to Household Income Ratio in Ashland
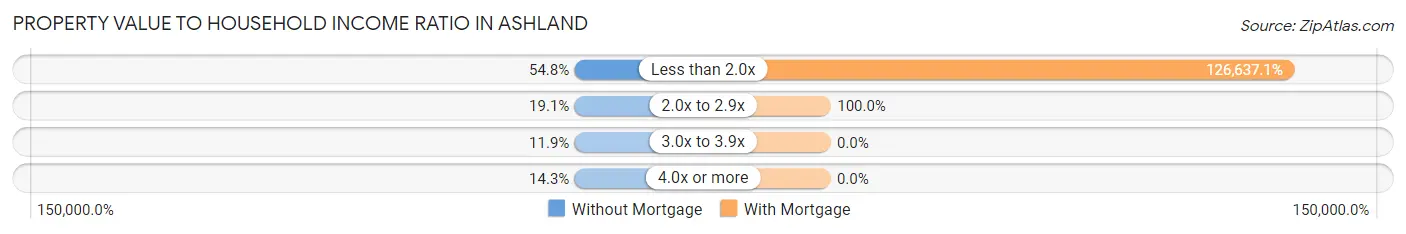
| Value-to-Income Ratio | Without Mortgage | With Mortgage |
| Less than 2.0x | 23 (54.8%) | 44,323 (126,637.1%) |
| 2.0x to 2.9x | 8 (19.1%) | 35 (100.0%) |
| 3.0x to 3.9x | 5 (11.9%) | 0 (0.0%) |
| 4.0x or more | 6 (14.3%) | 0 (0.0%) |
| Total | 42 (100.0%) | 35 (100.0%) |
Real Estate Taxes by Mortgage Status in Ashland
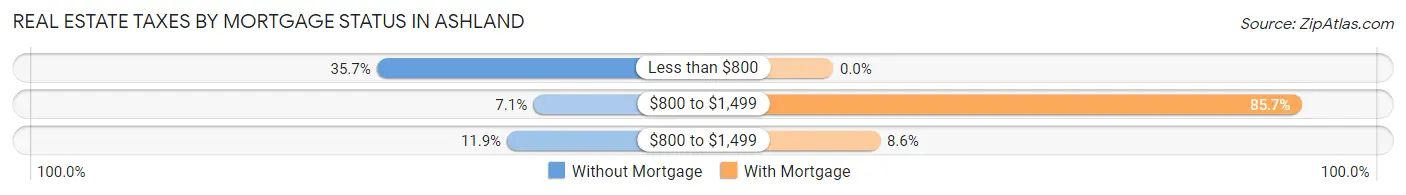
| Property Taxes | Without Mortgage | With Mortgage |
| Less than $800 | 15 (35.7%) | 0 (0.0%) |
| $800 to $1,499 | 3 (7.1%) | 30 (85.7%) |
| $800 to $1,499 | 5 (11.9%) | 3 (8.6%) |
| Total | 42 (100.0%) | 35 (100.0%) |
Health & Disability in Ashland
Health Insurance Coverage by Age in Ashland
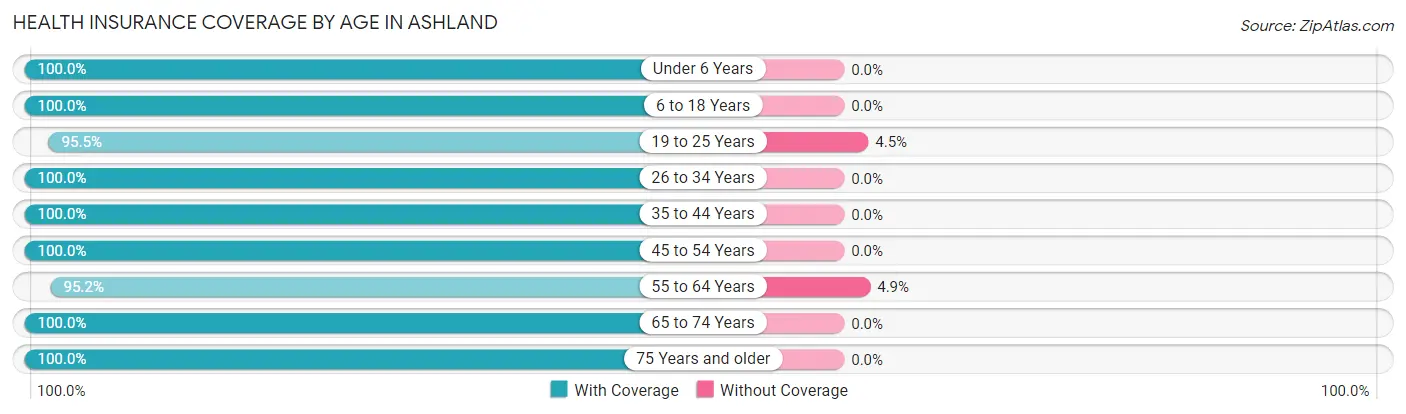
| Age Bracket | With Coverage | Without Coverage |
| Under 6 Years | 68 (100.0%) | 0 (0.0%) |
| 6 to 18 Years | 96 (100.0%) | 0 (0.0%) |
| 19 to 25 Years | 85 (95.5%) | 4 (4.5%) |
| 26 to 34 Years | 80 (100.0%) | 0 (0.0%) |
| 35 to 44 Years | 116 (100.0%) | 0 (0.0%) |
| 45 to 54 Years | 63 (100.0%) | 0 (0.0%) |
| 55 to 64 Years | 98 (95.2%) | 5 (4.9%) |
| 65 to 74 Years | 92 (100.0%) | 0 (0.0%) |
| 75 Years and older | 71 (100.0%) | 0 (0.0%) |
| Total | 769 (98.8%) | 9 (1.2%) |
Health Insurance Coverage by Citizenship Status in Ashland
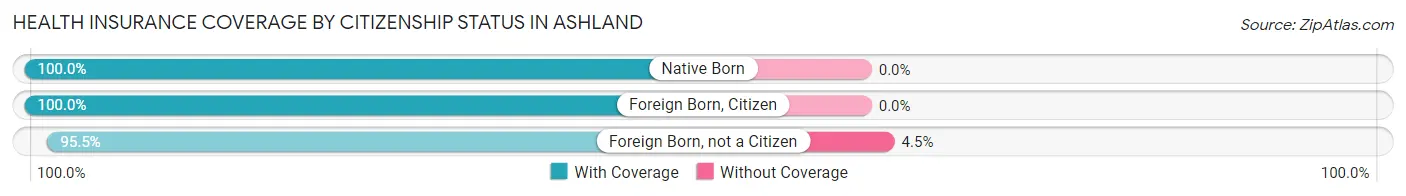
| Citizenship Status | With Coverage | Without Coverage |
| Native Born | 68 (100.0%) | 0 (0.0%) |
| Foreign Born, Citizen | 96 (100.0%) | 0 (0.0%) |
| Foreign Born, not a Citizen | 85 (95.5%) | 4 (4.5%) |
Health Insurance Coverage by Household Income in Ashland
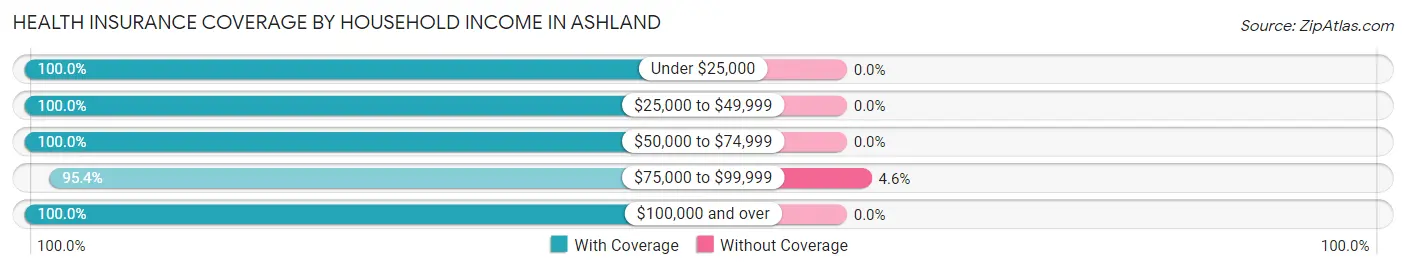
| Household Income | With Coverage | Without Coverage |
| Under $25,000 | 264 (100.0%) | 0 (0.0%) |
| $25,000 to $49,999 | 142 (100.0%) | 0 (0.0%) |
| $50,000 to $74,999 | 24 (100.0%) | 0 (0.0%) |
| $75,000 to $99,999 | 185 (95.4%) | 9 (4.6%) |
| $100,000 and over | 154 (100.0%) | 0 (0.0%) |
Public vs Private Health Insurance Coverage by Age in Ashland
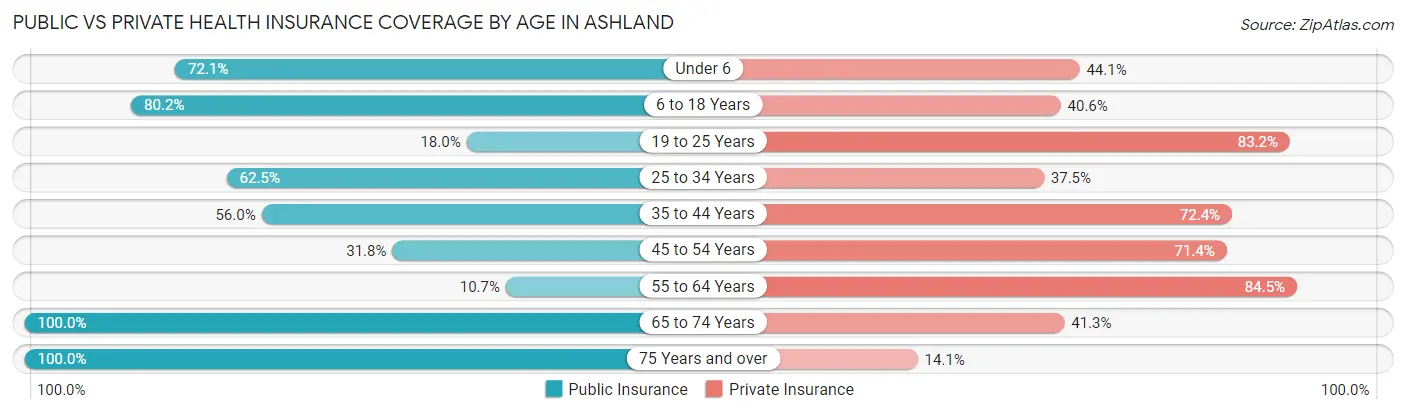
| Age Bracket | Public Insurance | Private Insurance |
| Under 6 | 49 (72.1%) | 30 (44.1%) |
| 6 to 18 Years | 77 (80.2%) | 39 (40.6%) |
| 19 to 25 Years | 16 (18.0%) | 74 (83.2%) |
| 25 to 34 Years | 50 (62.5%) | 30 (37.5%) |
| 35 to 44 Years | 65 (56.0%) | 84 (72.4%) |
| 45 to 54 Years | 20 (31.8%) | 45 (71.4%) |
| 55 to 64 Years | 11 (10.7%) | 87 (84.5%) |
| 65 to 74 Years | 92 (100.0%) | 38 (41.3%) |
| 75 Years and over | 71 (100.0%) | 10 (14.1%) |
| Total | 451 (58.0%) | 437 (56.2%) |
Disability Status by Sex by Age in Ashland
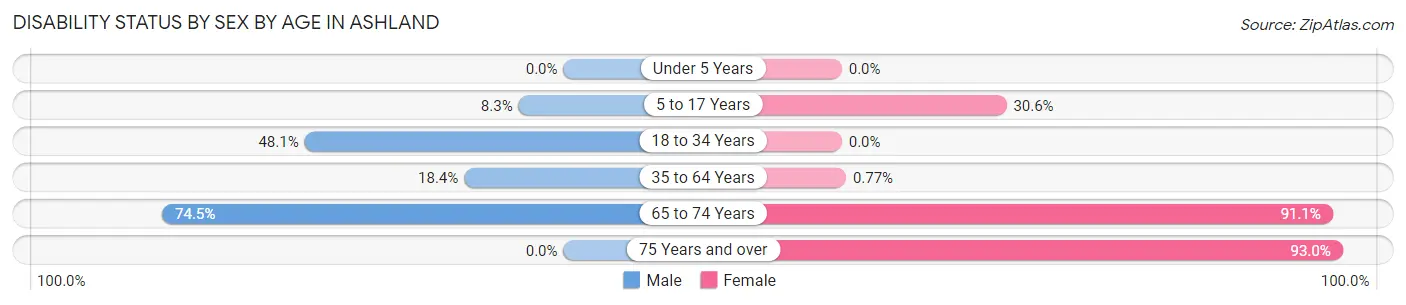
| Age Bracket | Male | Female |
| Under 5 Years | 0 (0.0%) | 0 (0.0%) |
| 5 to 17 Years | 7 (8.3%) | 11 (30.6%) |
| 18 to 34 Years | 37 (48.0%) | 0 (0.0%) |
| 35 to 64 Years | 28 (18.4%) | 1 (0.8%) |
| 65 to 74 Years | 35 (74.5%) | 41 (91.1%) |
| 75 Years and over | 0 (0.0%) | 66 (93.0%) |
Disability Class by Sex by Age in Ashland
Disability Class: Hearing Difficulty
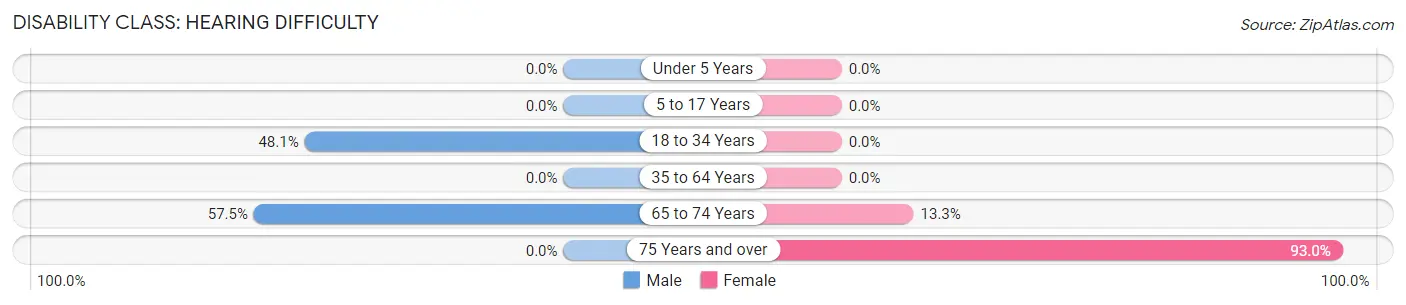
| Age Bracket | Male | Female |
| Under 5 Years | 0 (0.0%) | 0 (0.0%) |
| 5 to 17 Years | 0 (0.0%) | 0 (0.0%) |
| 18 to 34 Years | 37 (48.0%) | 0 (0.0%) |
| 35 to 64 Years | 0 (0.0%) | 0 (0.0%) |
| 65 to 74 Years | 27 (57.5%) | 6 (13.3%) |
| 75 Years and over | 0 (0.0%) | 66 (93.0%) |
Disability Class: Vision Difficulty
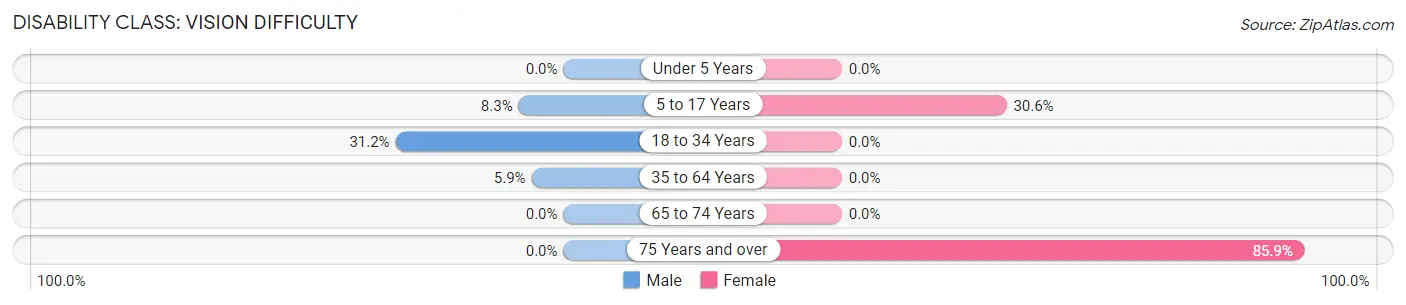
| Age Bracket | Male | Female |
| Under 5 Years | 0 (0.0%) | 0 (0.0%) |
| 5 to 17 Years | 7 (8.3%) | 11 (30.6%) |
| 18 to 34 Years | 24 (31.2%) | 0 (0.0%) |
| 35 to 64 Years | 9 (5.9%) | 0 (0.0%) |
| 65 to 74 Years | 0 (0.0%) | 0 (0.0%) |
| 75 Years and over | 0 (0.0%) | 61 (85.9%) |
Disability Class: Cognitive Difficulty
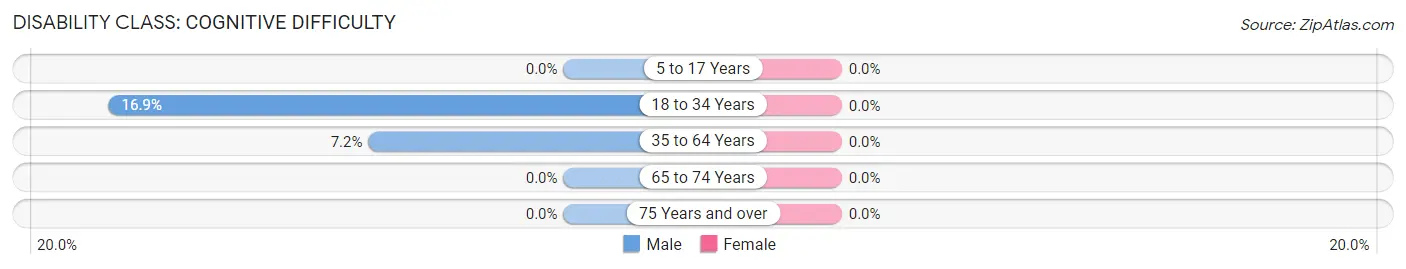
| Age Bracket | Male | Female |
| 5 to 17 Years | 0 (0.0%) | 0 (0.0%) |
| 18 to 34 Years | 13 (16.9%) | 0 (0.0%) |
| 35 to 64 Years | 11 (7.2%) | 0 (0.0%) |
| 65 to 74 Years | 0 (0.0%) | 0 (0.0%) |
| 75 Years and over | 0 (0.0%) | 0 (0.0%) |
Disability Class: Ambulatory Difficulty
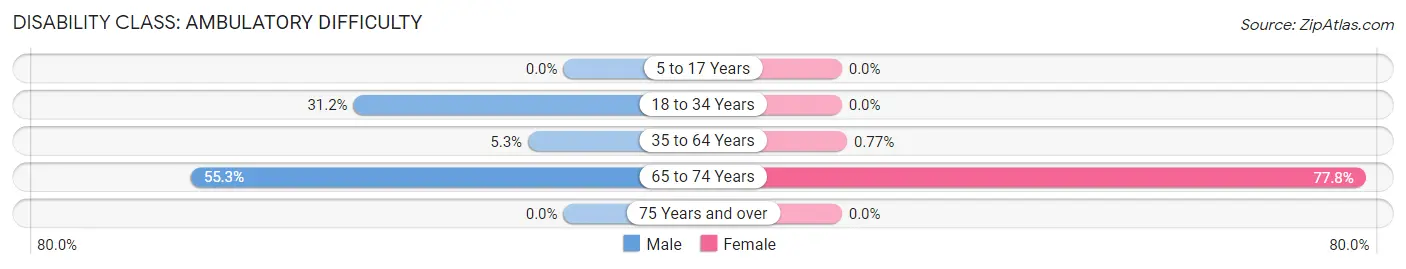
| Age Bracket | Male | Female |
| 5 to 17 Years | 0 (0.0%) | 0 (0.0%) |
| 18 to 34 Years | 24 (31.2%) | 0 (0.0%) |
| 35 to 64 Years | 8 (5.3%) | 1 (0.8%) |
| 65 to 74 Years | 26 (55.3%) | 35 (77.8%) |
| 75 Years and over | 0 (0.0%) | 0 (0.0%) |
Disability Class: Self-Care Difficulty
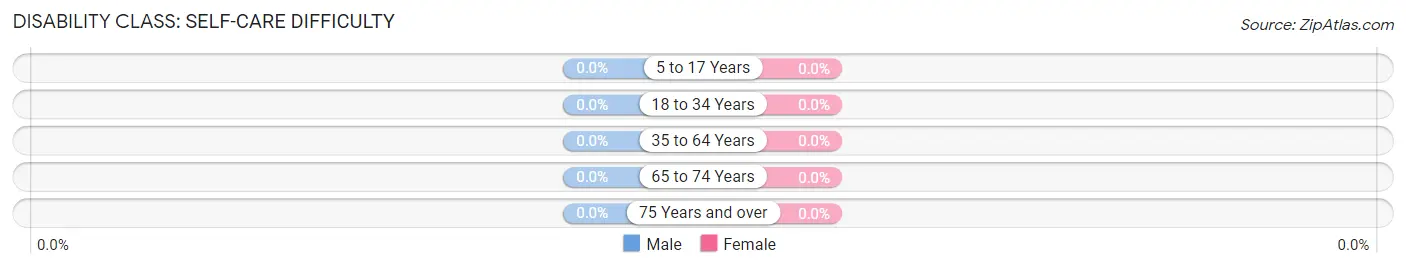
| Age Bracket | Male | Female |
| 5 to 17 Years | 0 (0.0%) | 0 (0.0%) |
| 18 to 34 Years | 0 (0.0%) | 0 (0.0%) |
| 35 to 64 Years | 0 (0.0%) | 0 (0.0%) |
| 65 to 74 Years | 0 (0.0%) | 0 (0.0%) |
| 75 Years and over | 0 (0.0%) | 0 (0.0%) |
Technology Access in Ashland
Computing Device Access in Ashland
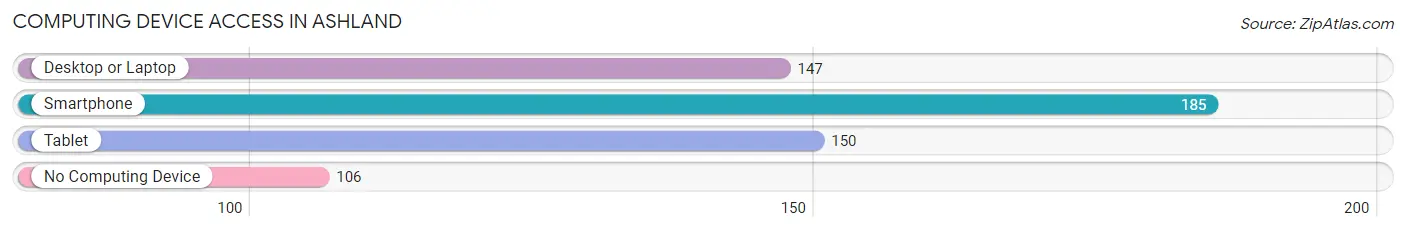
| Device Type | # Households | % Households |
| Desktop or Laptop | 147 | 40.6% |
| Smartphone | 185 | 51.1% |
| Tablet | 150 | 41.4% |
| No Computing Device | 106 | 29.3% |
| Total | 362 | 100.0% |
Internet Access in Ashland
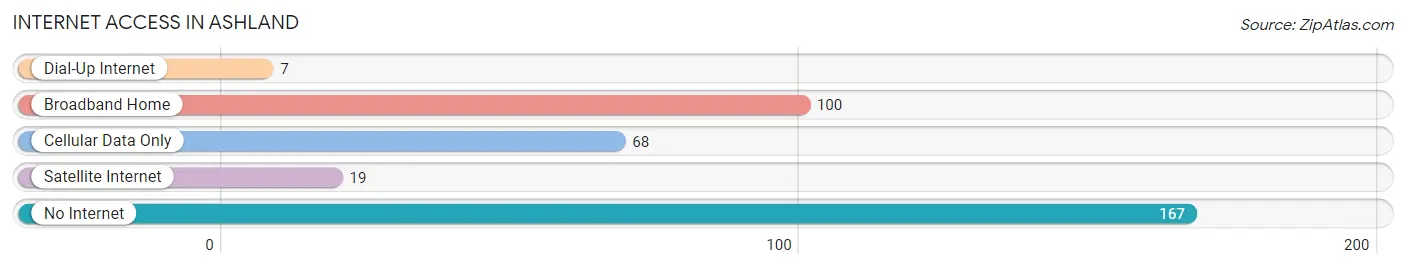
| Internet Type | # Households | % Households |
| Dial-Up Internet | 7 | 1.9% |
| Broadband Home | 100 | 27.6% |
| Cellular Data Only | 68 | 18.8% |
| Satellite Internet | 19 | 5.2% |
| No Internet | 167 | 46.1% |
| Total | 362 | 100.0% |
Ashland Summary
Ashland, Montana is a small town located in the southwestern corner of the state, near the Idaho border. It is situated in the heart of the Bitterroot Valley, a region known for its stunning natural beauty and abundant outdoor recreation opportunities. The town has a population of just over 1,000 people and is the county seat of Ravalli County.
History
The area that is now Ashland was first settled in the late 1800s by homesteaders and ranchers. The town was officially founded in 1891 and named after the nearby Ashland Creek. The town quickly grew and by the early 1900s, it had become a bustling center of commerce and industry. The town was home to several sawmills, a flour mill, a creamery, and a brickyard.
In the early 1900s, the town was also home to a large Chinese population. The Chinese immigrants had come to the area to work in the mines and on the railroads. The Chinese community was a vibrant part of the town until the early 1920s, when the Chinese Exclusion Act was passed, forcing many of the Chinese immigrants to leave the area.
Geography
Ashland is located in the Bitterroot Valley, a region of western Montana known for its stunning natural beauty. The town is situated at the base of the Bitterroot Mountains, which provide a stunning backdrop to the town. The Bitterroot River runs through the town, providing a source of recreation and beauty.
The town is located in a semi-arid climate, with hot summers and cold winters. The average annual temperature is around 50 degrees Fahrenheit. The area receives an average of 16 inches of precipitation per year, most of which falls in the form of snow.
Economy
The economy of Ashland is largely based on agriculture and tourism. The town is home to several farms and ranches, which produce a variety of crops and livestock. The town is also home to several tourist attractions, including the Bitterroot Valley Museum and the Bitterroot National Forest.
The town is also home to several small businesses, including restaurants, shops, and services. The town is also home to a small airport, which provides access to the surrounding area.
Demographics
As of the 2010 census, the population of Ashland was 1,072. The town is predominantly white, with a small Hispanic population. The median household income is $37,000, and the median home value is $150,000.
The town is home to several churches, including the First Presbyterian Church, the First Baptist Church, and the Church of Jesus Christ of Latter-day Saints. The town is also home to a public library and a community center.
Conclusion
Ashland, Montana is a small town located in the southwestern corner of the state, near the Idaho border. It is situated in the heart of the Bitterroot Valley, a region known for its stunning natural beauty and abundant outdoor recreation opportunities. The town has a population of just over 1,000 people and is the county seat of Ravalli County. The economy of Ashland is largely based on agriculture and tourism, and the town is home to several small businesses, churches, and tourist attractions. The town is predominantly white, with a small Hispanic population, and the median household income is $37,000. Ashland is a beautiful and vibrant town, and it is a great place to live and visit.
Common Questions
What is Per Capita Income in Ashland?
Per Capita income in Ashland is $23,990.
What is the Median Family Income in Ashland?
Median Family Income in Ashland is $76,667.
What is the Median Household income in Ashland?
Median Household Income in Ashland is $39,000.
What is Income or Wage Gap in Ashland?
Income or Wage Gap in Ashland is 3.5%.
Women in Ashland earn 96.5 cents for every dollar earned by a man.
What is Inequality or Gini Index in Ashland?
Inequality or Gini Index in Ashland is 0.45.
What is the Total Population of Ashland?
Total Population of Ashland is 783.
What is the Total Male Population of Ashland?
Total Male Population of Ashland is 393.
What is the Total Female Population of Ashland?
Total Female Population of Ashland is 390.
What is the Ratio of Males per 100 Females in Ashland?
There are 100.77 Males per 100 Females in Ashland.
What is the Ratio of Females per 100 Males in Ashland?
There are 99.24 Females per 100 Males in Ashland.
What is the Median Population Age in Ashland?
Median Population Age in Ashland is 37.6 Years.
What is the Average Family Size in Ashland
Average Family Size in Ashland is 3.1 People.
What is the Average Household Size in Ashland
Average Household Size in Ashland is 2.1 People.
How Large is the Labor Force in Ashland?
There are 414 People in the Labor Forcein in Ashland.
What is the Percentage of People in the Labor Force in Ashland?
67.3% of People are in the Labor Force in Ashland.
What is the Unemployment Rate in Ashland?
Unemployment Rate in Ashland is 15.7%.