Alder, MT
Alder Map
Alder Overview
108
TOTAL POPULATION
60
MALE POPULATION
48
FEMALE POPULATION
125.00
MALES / 100 FEMALES
80.00
FEMALES / 100 MALES
56.7
MEDIAN AGE
2.8
AVG FAMILY SIZE
2.1
AVG HOUSEHOLD SIZE
$26,358
PER CAPITA INCOME
$36,429
AVG HOUSEHOLD INCOME
0.43
INEQUALITY / GINI INDEX
57
LABOR FORCE [ PEOPLE ]
60.6%
PERCENT IN LABOR FORCE
Alder Zip Codes
Alder Area Codes
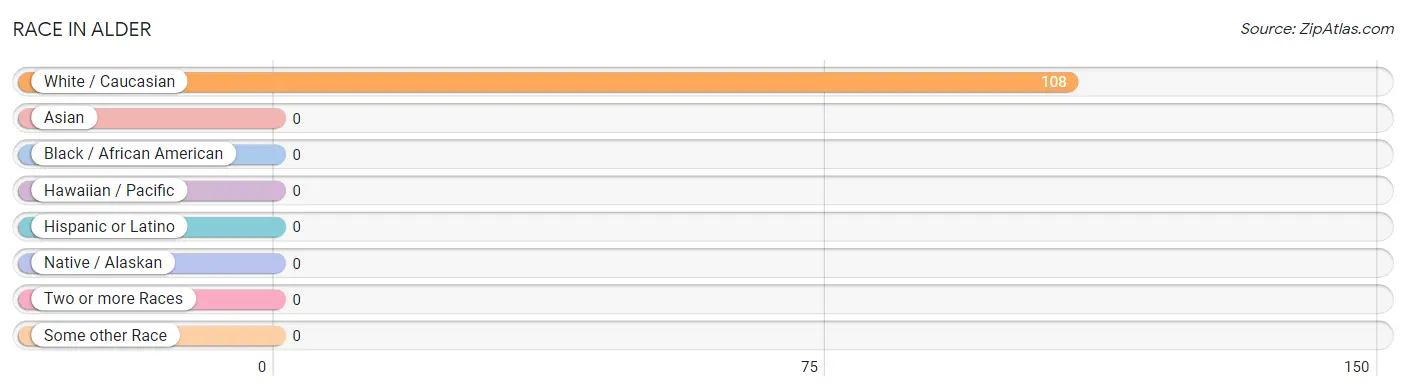
Race in Alder
The most populous races in Alder are , and White / Caucasian (108 | 100.0%).
| Race | # Population | % Population |
| Asian | 0 | 0.0% |
| Black / African American | 0 | 0.0% |
| Hawaiian / Pacific | 0 | 0.0% |
| Hispanic or Latino | 0 | 0.0% |
| Native / Alaskan | 0 | 0.0% |
| White / Caucasian | 108 | 100.0% |
| Two or more Races | 0 | 0.0% |
| Some other Race | 0 | 0.0% |
| Total | 108 | 100.0% |
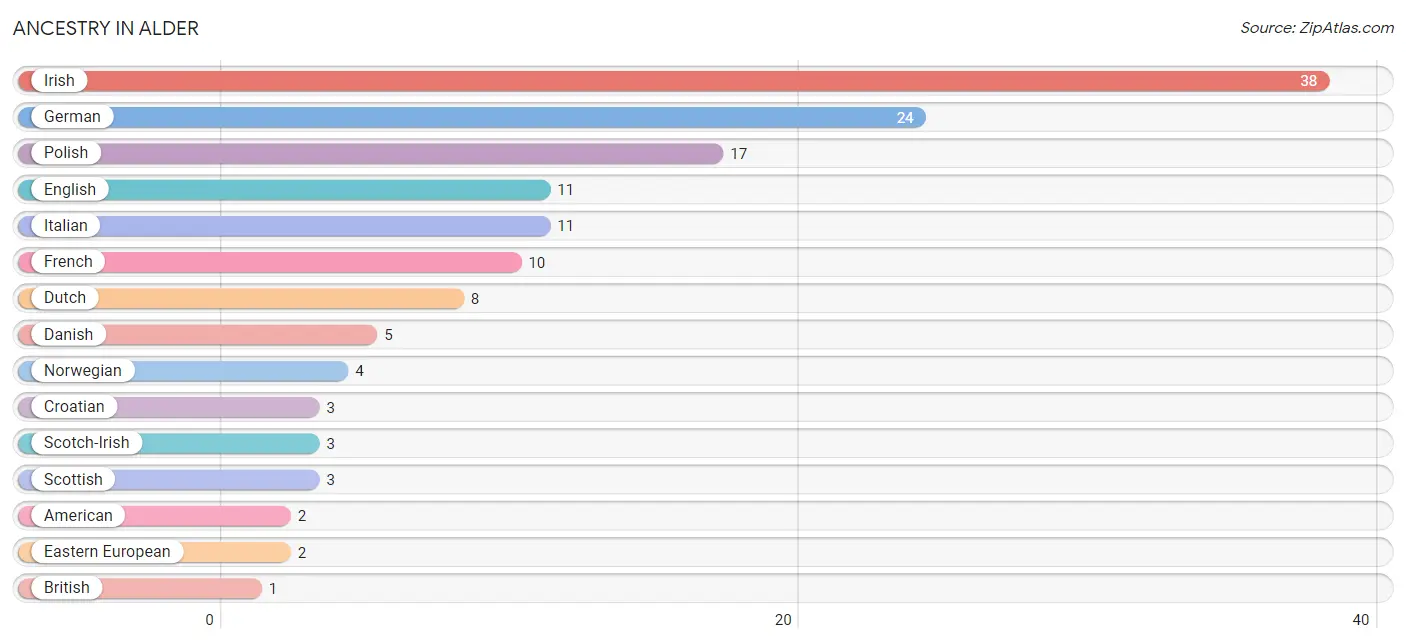
Ancestry in Alder
The most populous ancestries reported in Alder are Irish (38 | 35.2%), German (24 | 22.2%), Polish (17 | 15.7%), English (11 | 10.2%), and Italian (11 | 10.2%), together accounting for 93.5% of all Alder residents.
| Ancestry | # Population | % Population |
| American | 2 | 1.8% |
| British | 1 | 0.9% |
| Croatian | 3 | 2.8% |
| Danish | 5 | 4.6% |
| Dutch | 8 | 7.4% |
| Eastern European | 2 | 1.8% |
| English | 11 | 10.2% |
| French | 10 | 9.3% |
| German | 24 | 22.2% |
| Irish | 38 | 35.2% |
| Italian | 11 | 10.2% |
| Norwegian | 4 | 3.7% |
| Polish | 17 | 15.7% |
| Scotch-Irish | 3 | 2.8% |
| Scottish | 3 | 2.8% | View All 15 Rows |
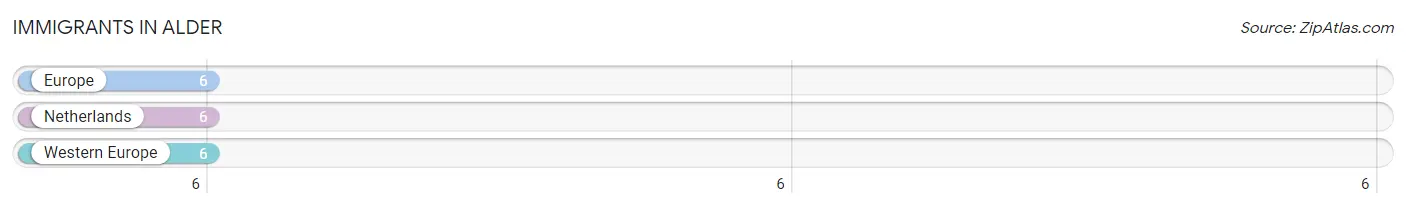
Immigrants in Alder
The most numerous immigrant groups reported in Alder came from Europe (6 | 5.6%), Netherlands (6 | 5.6%), and Western Europe (6 | 5.6%), together accounting for 16.7% of all Alder residents.
| Immigration Origin | # Population | % Population |
| Europe | 6 | 5.6% |
| Netherlands | 6 | 5.6% |
| Western Europe | 6 | 5.6% | View All 3 Rows |
Sex and Age in Alder
Sex and Age in Alder
The most populous age groups in Alder are 35 to 39 Years (14 | 23.3%) for men and 65 to 69 Years (12 | 25.0%) for women.
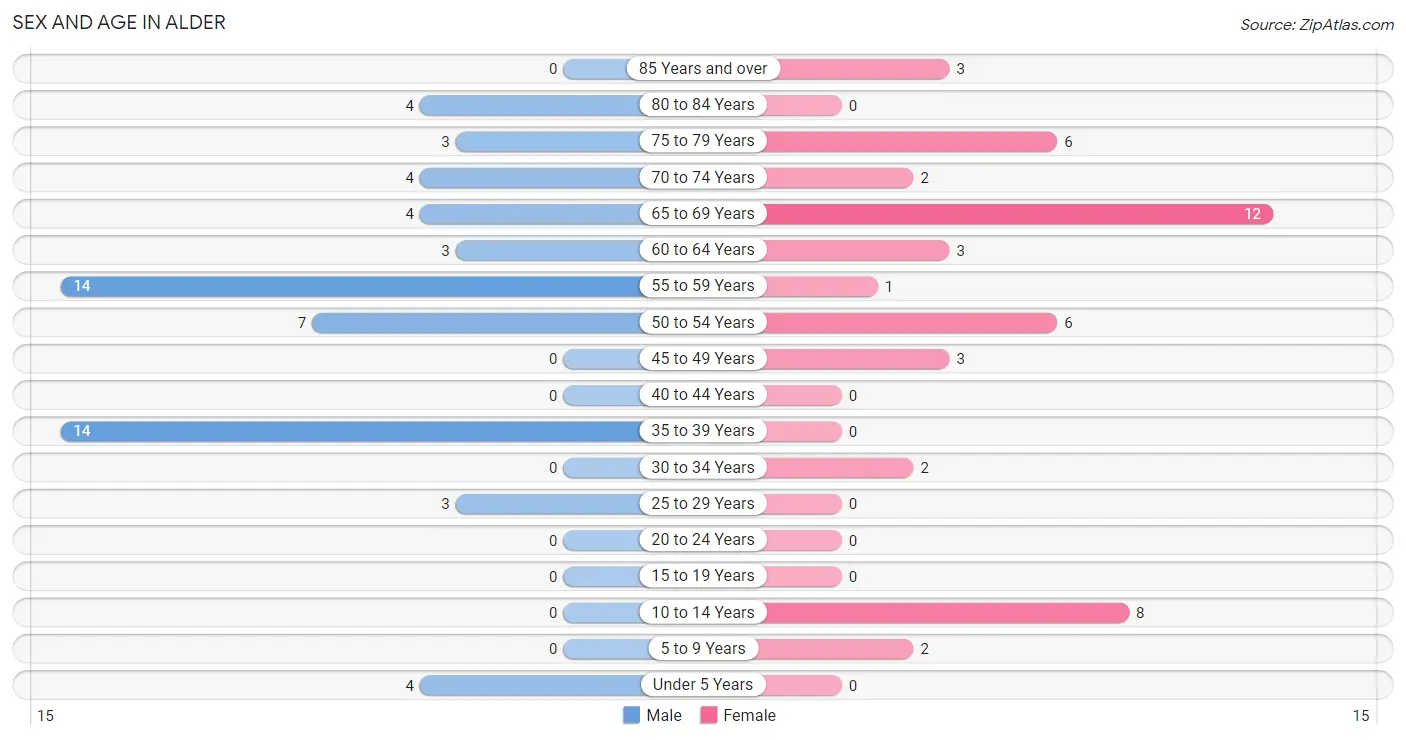
| Age Bracket | Male | Female |
| Under 5 Years | 4 (6.7%) | 0 (0.0%) |
| 5 to 9 Years | 0 (0.0%) | 2 (4.2%) |
| 10 to 14 Years | 0 (0.0%) | 8 (16.7%) |
| 15 to 19 Years | 0 (0.0%) | 0 (0.0%) |
| 20 to 24 Years | 0 (0.0%) | 0 (0.0%) |
| 25 to 29 Years | 3 (5.0%) | 0 (0.0%) |
| 30 to 34 Years | 0 (0.0%) | 2 (4.2%) |
| 35 to 39 Years | 14 (23.3%) | 0 (0.0%) |
| 40 to 44 Years | 0 (0.0%) | 0 (0.0%) |
| 45 to 49 Years | 0 (0.0%) | 3 (6.2%) |
| 50 to 54 Years | 7 (11.7%) | 6 (12.5%) |
| 55 to 59 Years | 14 (23.3%) | 1 (2.1%) |
| 60 to 64 Years | 3 (5.0%) | 3 (6.2%) |
| 65 to 69 Years | 4 (6.7%) | 12 (25.0%) |
| 70 to 74 Years | 4 (6.7%) | 2 (4.2%) |
| 75 to 79 Years | 3 (5.0%) | 6 (12.5%) |
| 80 to 84 Years | 4 (6.7%) | 0 (0.0%) |
| 85 Years and over | 0 (0.0%) | 3 (6.2%) |
| Total | 60 (100.0%) | 48 (100.0%) |
Families and Households in Alder
Median Family Size in Alder
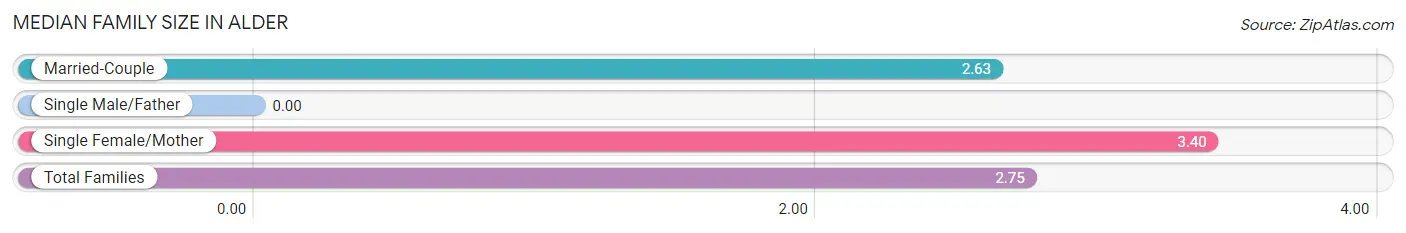
| Family Type | # Families | Family Size |
| Married-Couple | 27 (84.4%) | 2.63 |
| Single Male/Father | 0 (0.0%) | - |
| Single Female/Mother | 5 (15.6%) | 3.40 |
| Total Families | 32 (100.0%) | 2.75 |
Median Household Size in Alder
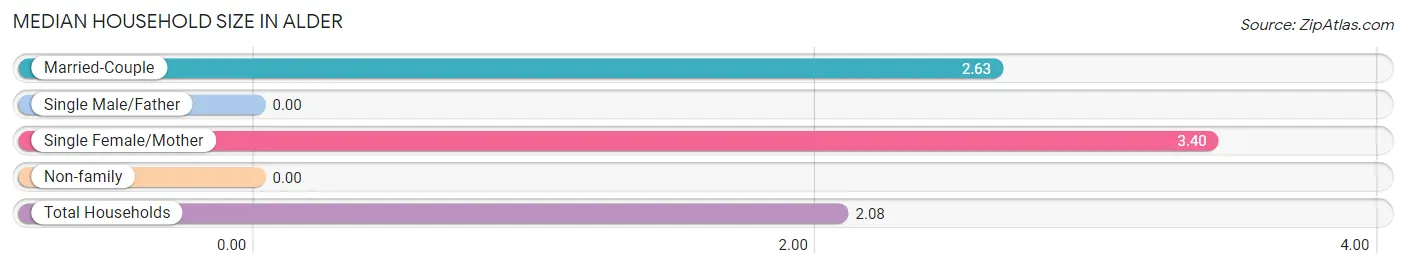
| Household Type | # Households | Household Size |
| Married-Couple | 27 (51.9%) | 2.63 |
| Single Male/Father | 0 (0.0%) | - |
| Single Female/Mother | 5 (9.6%) | 3.40 |
| Non-family | 20 (38.5%) | - |
| Total Households | 52 (100.0%) | 2.08 |
Household Size by Marriage Status in Alder
Out of a total of 52 households in Alder, 32 (61.5%) are family households, while 20 (38.5%) are nonfamily households. The most numerous type of family households are 2-person households, comprising 23, and the most common type of nonfamily households are 1-person households, comprising 20.
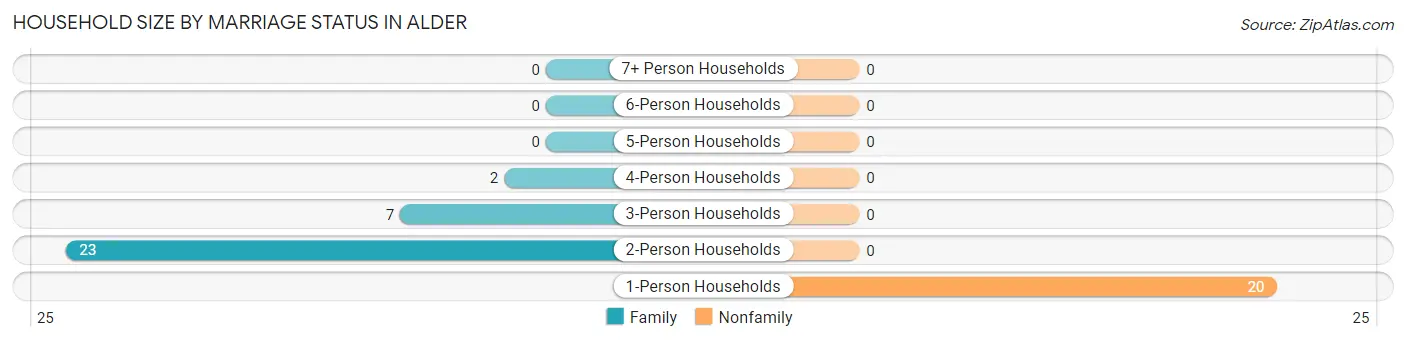
| Household Size | Family Households | Nonfamily Households |
| 1-Person Households | - | 20 (38.5%) |
| 2-Person Households | 23 (44.2%) | 0 (0.0%) |
| 3-Person Households | 7 (13.5%) | 0 (0.0%) |
| 4-Person Households | 2 (3.8%) | 0 (0.0%) |
| 5-Person Households | 0 (0.0%) | 0 (0.0%) |
| 6-Person Households | 0 (0.0%) | 0 (0.0%) |
| 7+ Person Households | 0 (0.0%) | 0 (0.0%) |
| Total | 32 (61.5%) | 20 (38.5%) |
Female Fertility in Alder
Fertility by Age in Alder
| Age Bracket | Women with Births | Births / 1,000 Women |
| 15 to 19 years | 0 (0.0%) | 0.0 |
| 20 to 34 years | 0 (0.0%) | 0.0 |
| 35 to 50 years | 0 (0.0%) | 0.0 |
| Total | 0 (0.0%) | 0.0 |
Fertility by Age by Marriage Status in Alder
| Age Bracket | Married | Unmarried |
| 15 to 19 years | 0 (0.0%) | 0 (0.0%) |
| 20 to 34 years | 0 (0.0%) | 0 (0.0%) |
| 35 to 50 years | 0 (0.0%) | 0 (0.0%) |
| Total | 0 (0.0%) | 0 (0.0%) |
Fertility by Education in Alder
| Educational Attainment | Women with Births | Births / 1,000 Women |
| Less than High School | 0 (0.0%) | 0.0 |
| High School Diploma | 0 (0.0%) | 0.0 |
| College or Associate's Degree | 0 (0.0%) | 0.0 |
| Bachelor's Degree | 0 (0.0%) | 0.0 |
| Graduate Degree | 0 (0.0%) | 0.0 |
| Total | 0 (0.0%) | 0.0 |
Fertility by Education by Marriage Status in Alder
| Educational Attainment | Married | Unmarried |
| Less than High School | 0 (0.0%) | 0 (0.0%) |
| High School Diploma | 0 (0.0%) | 0 (0.0%) |
| College or Associate's Degree | 0 (0.0%) | 0 (0.0%) |
| Bachelor's Degree | 0 (0.0%) | 0 (0.0%) |
| Graduate Degree | 0 (0.0%) | 0 (0.0%) |
| Total | 0 (0.0%) | 0 (0.0%) |
Income in Alder
Income Overview in Alder
| Characteristic | Number | Measure |
| Per Capita Income | 108 | $26,358 |
| Median Family Income | 32 | $0 |
| Mean Family Income | 32 | $58,528 |
| Median Household Income | 52 | $36,429 |
| Mean Household Income | 52 | $48,800 |
| Income Deficit | 32 | $0 |
| Wage / Income Gap (%) | 108 | 0.00% |
| Wage / Income Gap ($) | 108 | 100.00¢ per $1 |
| Gini / Inequality Index | 108 | 0.43 |
Earnings by Sex in Alder
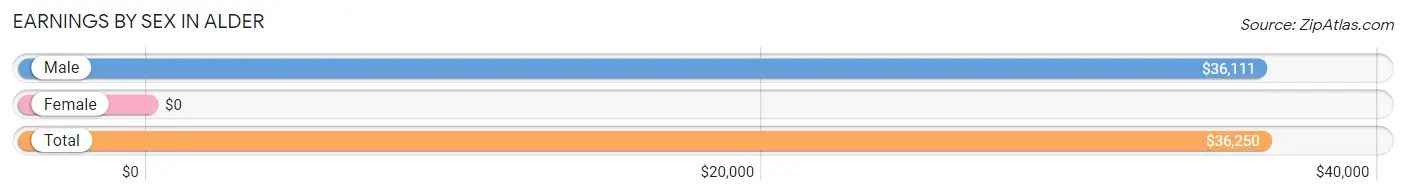
| Sex | Number | Average Earnings |
| Male | 42 (71.2%) | $36,111 |
| Female | 17 (28.8%) | $0 |
| Total | 59 (100.0%) | $36,250 |
Earnings by Sex by Income Bracket in Alder
The most common earnings brackets in Alder are $10,000 to $12,499 for men (12 | 28.6%) and $5,000 to $7,499 for women (7 | 41.2%).
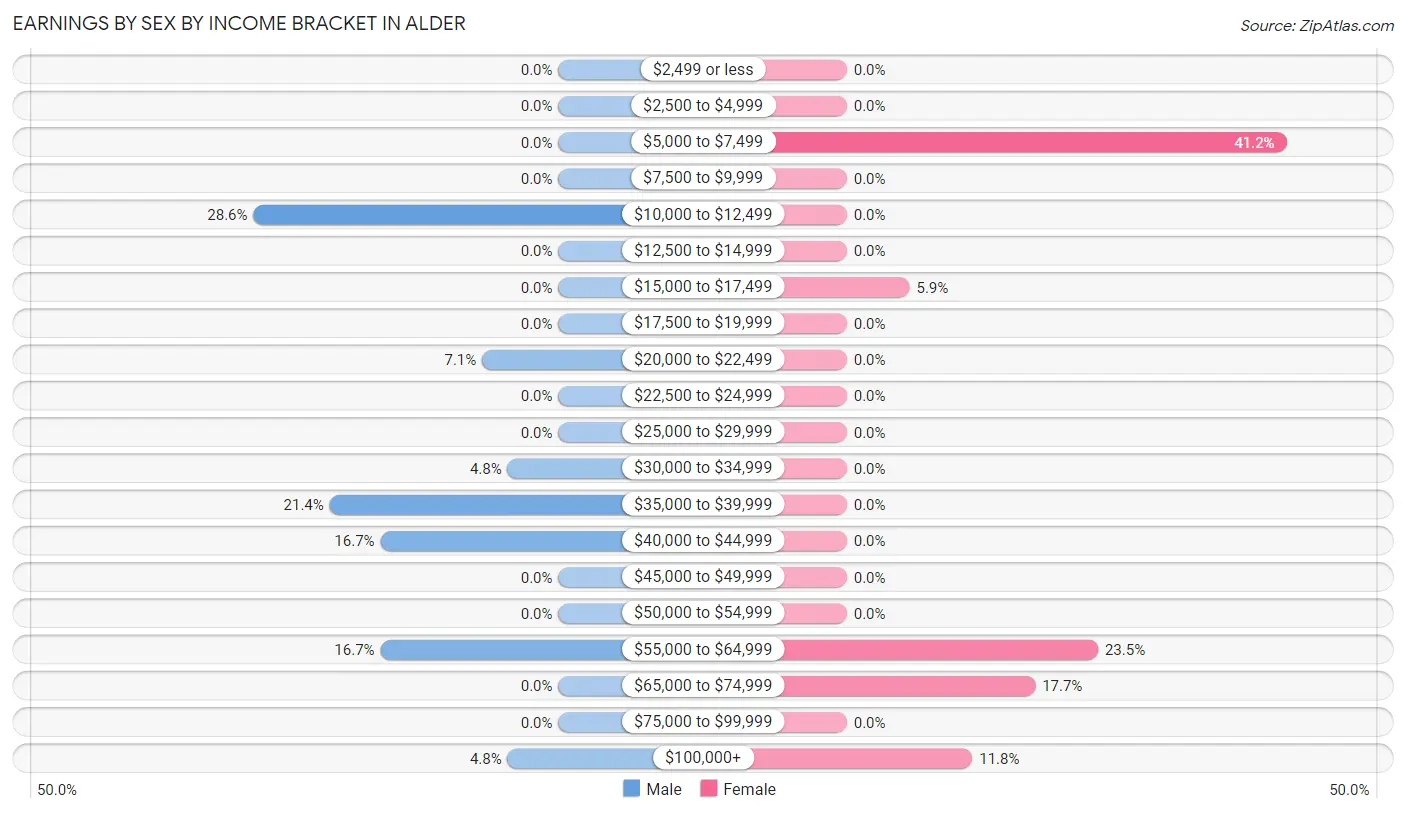
| Income | Male | Female |
| $2,499 or less | 0 (0.0%) | 0 (0.0%) |
| $2,500 to $4,999 | 0 (0.0%) | 0 (0.0%) |
| $5,000 to $7,499 | 0 (0.0%) | 7 (41.2%) |
| $7,500 to $9,999 | 0 (0.0%) | 0 (0.0%) |
| $10,000 to $12,499 | 12 (28.6%) | 0 (0.0%) |
| $12,500 to $14,999 | 0 (0.0%) | 0 (0.0%) |
| $15,000 to $17,499 | 0 (0.0%) | 1 (5.9%) |
| $17,500 to $19,999 | 0 (0.0%) | 0 (0.0%) |
| $20,000 to $22,499 | 3 (7.1%) | 0 (0.0%) |
| $22,500 to $24,999 | 0 (0.0%) | 0 (0.0%) |
| $25,000 to $29,999 | 0 (0.0%) | 0 (0.0%) |
| $30,000 to $34,999 | 2 (4.8%) | 0 (0.0%) |
| $35,000 to $39,999 | 9 (21.4%) | 0 (0.0%) |
| $40,000 to $44,999 | 7 (16.7%) | 0 (0.0%) |
| $45,000 to $49,999 | 0 (0.0%) | 0 (0.0%) |
| $50,000 to $54,999 | 0 (0.0%) | 0 (0.0%) |
| $55,000 to $64,999 | 7 (16.7%) | 4 (23.5%) |
| $65,000 to $74,999 | 0 (0.0%) | 3 (17.6%) |
| $75,000 to $99,999 | 0 (0.0%) | 0 (0.0%) |
| $100,000+ | 2 (4.8%) | 2 (11.8%) |
| Total | 42 (100.0%) | 17 (100.0%) |
Earnings by Sex by Educational Attainment in Alder
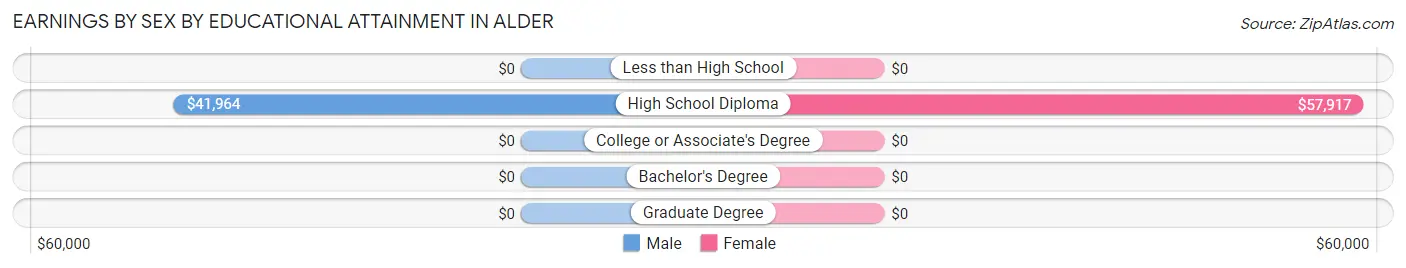
| Educational Attainment | Male Income | Female Income |
| Less than High School | - | - |
| High School Diploma | $41,964 | $57,917 |
| College or Associate's Degree | - | - |
| Bachelor's Degree | - | - |
| Graduate Degree | - | - |
| Total | $36,111 | $0 |
Family Income in Alder
Family Income Brackets in Alder
According to the Alder family income data, there are 8 families falling into the $15,000 to $24,999 income range, which is the most common income bracket and makes up 25.0% of all families.
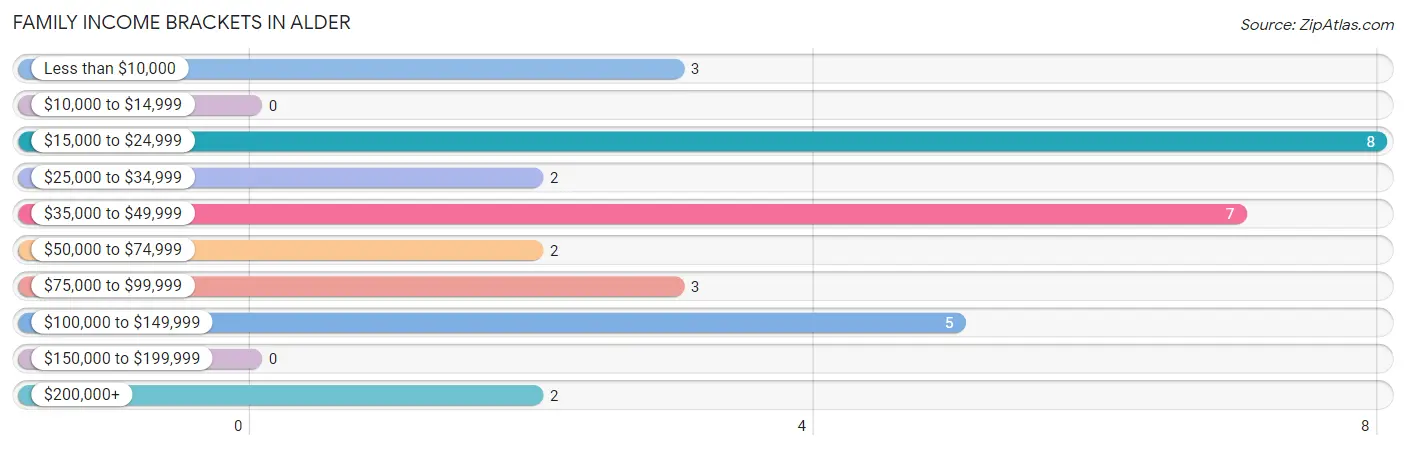
| Income Bracket | # Families | % Families |
| Less than $10,000 | 3 | 9.4% |
| $10,000 to $14,999 | 0 | 0.0% |
| $15,000 to $24,999 | 8 | 25.0% |
| $25,000 to $34,999 | 2 | 6.3% |
| $35,000 to $49,999 | 7 | 21.9% |
| $50,000 to $74,999 | 2 | 6.3% |
| $75,000 to $99,999 | 3 | 9.4% |
| $100,000 to $149,999 | 5 | 15.6% |
| $150,000 to $199,999 | 0 | 0.0% |
| $200,000+ | 2 | 6.3% |
Family Income by Famaliy Size in Alder
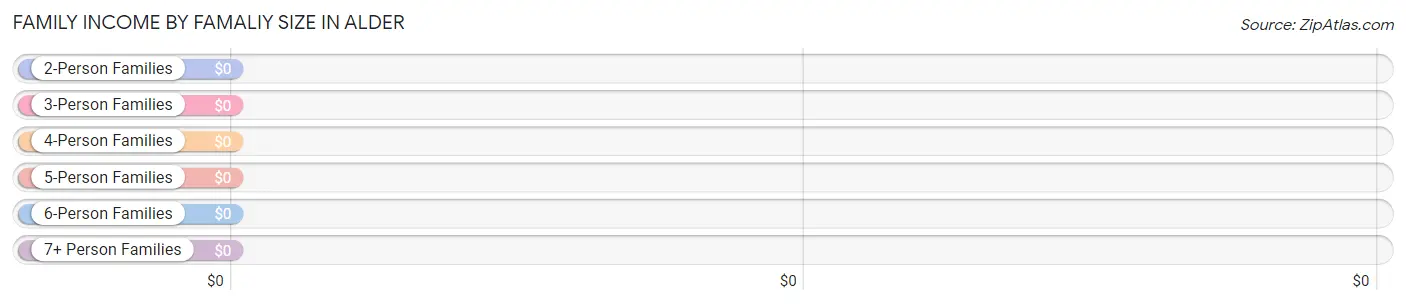
| Income Bracket | # Families | Median Income |
| 2-Person Families | 23 (71.9%) | $0 |
| 3-Person Families | 7 (21.9%) | $0 |
| 4-Person Families | 2 (6.2%) | $0 |
| 5-Person Families | 0 (0.0%) | $0 |
| 6-Person Families | 0 (0.0%) | $0 |
| 7+ Person Families | 0 (0.0%) | $0 |
| Total | 32 (100.0%) | $0 |
Family Income by Number of Earners in Alder
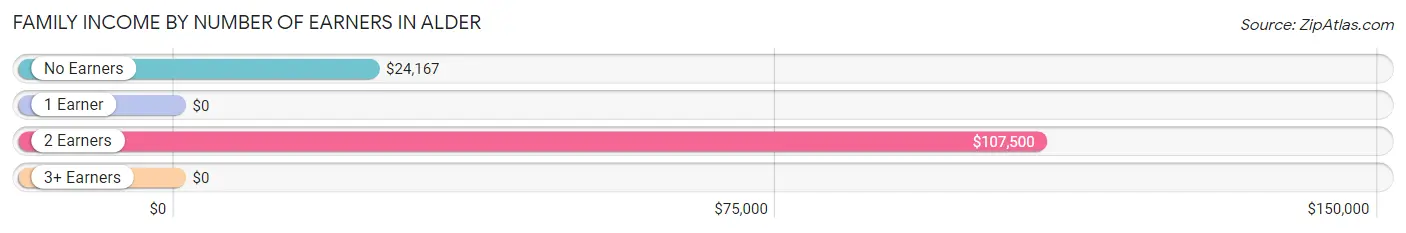
| Number of Earners | # Families | Median Income |
| No Earners | 10 (31.2%) | $24,167 |
| 1 Earner | 10 (31.2%) | $0 |
| 2 Earners | 12 (37.5%) | $107,500 |
| 3+ Earners | 0 (0.0%) | $0 |
| Total | 32 (100.0%) | $0 |
Household Income in Alder
Household Income Brackets in Alder
With 16 households falling in the category, the $35,000 to $49,999 income range is the most frequent in Alder, accounting for 30.8% of all households.
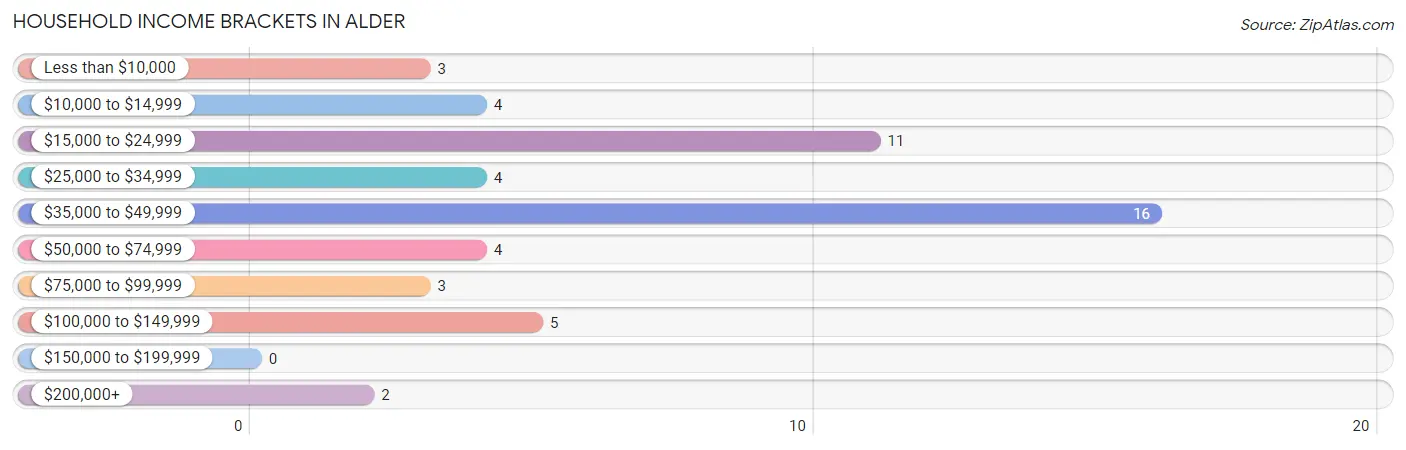
| Income Bracket | # Households | % Households |
| Less than $10,000 | 3 | 5.8% |
| $10,000 to $14,999 | 4 | 7.7% |
| $15,000 to $24,999 | 11 | 21.2% |
| $25,000 to $34,999 | 4 | 7.7% |
| $35,000 to $49,999 | 16 | 30.8% |
| $50,000 to $74,999 | 4 | 7.7% |
| $75,000 to $99,999 | 3 | 5.8% |
| $100,000 to $149,999 | 5 | 9.6% |
| $150,000 to $199,999 | 0 | 0.0% |
| $200,000+ | 2 | 3.8% |
Household Income by Householder Age in Alder
The median household income in Alder is $36,429, with the highest median household income of $23,333 found in the 65+ years age bracket for the primary householder. A total of 26 households (50.0%) fall into this category.
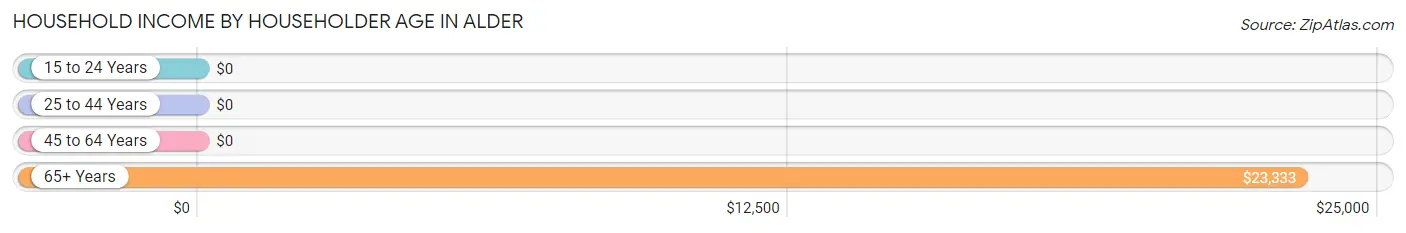
| Income Bracket | # Households | Median Income |
| 15 to 24 Years | 0 (0.0%) | $0 |
| 25 to 44 Years | 5 (9.6%) | $0 |
| 45 to 64 Years | 21 (40.4%) | $0 |
| 65+ Years | 26 (50.0%) | $23,333 |
| Total | 52 (100.0%) | $36,429 |
Poverty in Alder
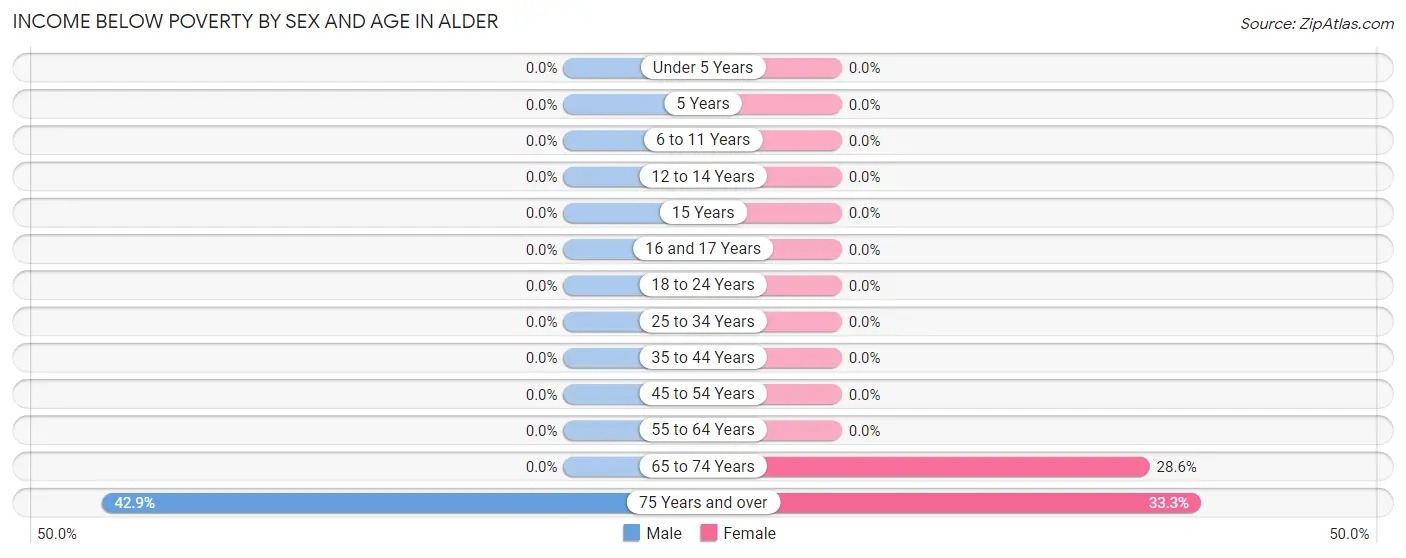
Income Below Poverty by Sex and Age in Alder
With 5.0% poverty level for males and 14.6% for females among the residents of Alder, 75 year old and over males and 75 year old and over females are the most vulnerable to poverty, with 3 males (42.9%) and 3 females (33.3%) in their respective age groups living below the poverty level.
| Age Bracket | Male | Female |
| Under 5 Years | 0 (0.0%) | 0 (0.0%) |
| 5 Years | 0 (0.0%) | 0 (0.0%) |
| 6 to 11 Years | 0 (0.0%) | 0 (0.0%) |
| 12 to 14 Years | 0 (0.0%) | 0 (0.0%) |
| 15 Years | 0 (0.0%) | 0 (0.0%) |
| 16 and 17 Years | 0 (0.0%) | 0 (0.0%) |
| 18 to 24 Years | 0 (0.0%) | 0 (0.0%) |
| 25 to 34 Years | 0 (0.0%) | 0 (0.0%) |
| 35 to 44 Years | 0 (0.0%) | 0 (0.0%) |
| 45 to 54 Years | 0 (0.0%) | 0 (0.0%) |
| 55 to 64 Years | 0 (0.0%) | 0 (0.0%) |
| 65 to 74 Years | 0 (0.0%) | 4 (28.6%) |
| 75 Years and over | 3 (42.9%) | 3 (33.3%) |
| Total | 3 (5.0%) | 7 (14.6%) |
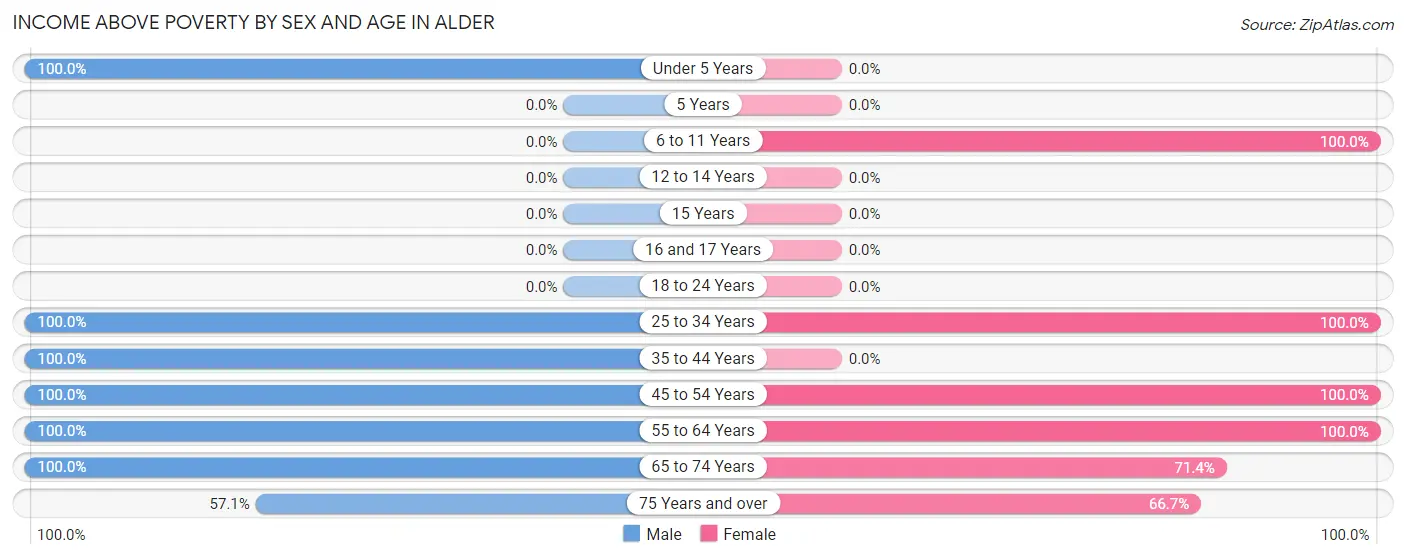
Income Above Poverty by Sex and Age in Alder
According to the poverty statistics in Alder, males aged under 5 years and females aged 6 to 11 years are the age groups that are most secure financially, with 100.0% of males and 100.0% of females in these age groups living above the poverty line.
| Age Bracket | Male | Female |
| Under 5 Years | 4 (100.0%) | 0 (0.0%) |
| 5 Years | 0 (0.0%) | 0 (0.0%) |
| 6 to 11 Years | 0 (0.0%) | 10 (100.0%) |
| 12 to 14 Years | 0 (0.0%) | 0 (0.0%) |
| 15 Years | 0 (0.0%) | 0 (0.0%) |
| 16 and 17 Years | 0 (0.0%) | 0 (0.0%) |
| 18 to 24 Years | 0 (0.0%) | 0 (0.0%) |
| 25 to 34 Years | 3 (100.0%) | 2 (100.0%) |
| 35 to 44 Years | 14 (100.0%) | 0 (0.0%) |
| 45 to 54 Years | 7 (100.0%) | 9 (100.0%) |
| 55 to 64 Years | 17 (100.0%) | 4 (100.0%) |
| 65 to 74 Years | 8 (100.0%) | 10 (71.4%) |
| 75 Years and over | 4 (57.1%) | 6 (66.7%) |
| Total | 57 (95.0%) | 41 (85.4%) |
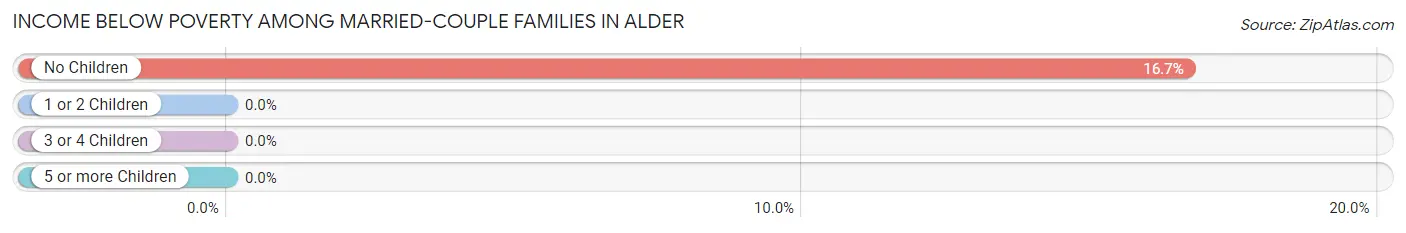
Income Below Poverty Among Married-Couple Families in Alder
The poverty statistics for married-couple families in Alder show that 11.1% or 3 of the total 27 families live below the poverty line. Families with no children have the highest poverty rate of 16.7%, comprising of 3 families. On the other hand, families with 1 or 2 children have the lowest poverty rate of 0.0%, which includes 0 families.
| Children | Above Poverty | Below Poverty |
| No Children | 15 (83.3%) | 3 (16.7%) |
| 1 or 2 Children | 9 (100.0%) | 0 (0.0%) |
| 3 or 4 Children | 0 (0.0%) | 0 (0.0%) |
| 5 or more Children | 0 (0.0%) | 0 (0.0%) |
| Total | 24 (88.9%) | 3 (11.1%) |
Income Below Poverty Among Single-Parent Households in Alder
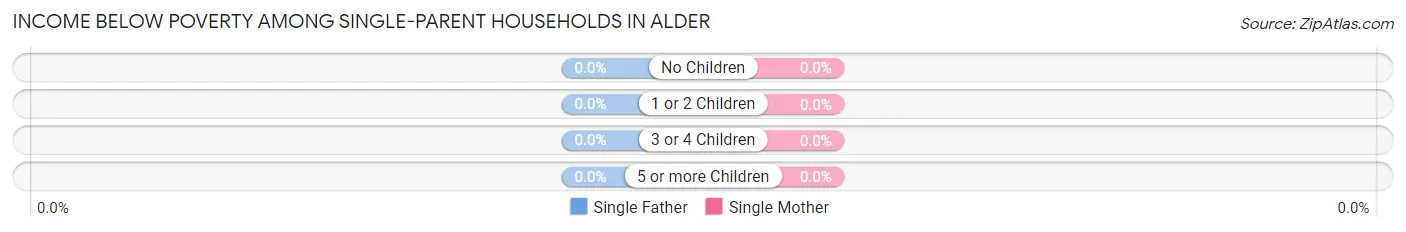
| Children | Single Father | Single Mother |
| No Children | 0 (0.0%) | 0 (0.0%) |
| 1 or 2 Children | 0 (0.0%) | 0 (0.0%) |
| 3 or 4 Children | 0 (0.0%) | 0 (0.0%) |
| 5 or more Children | 0 (0.0%) | 0 (0.0%) |
| Total | 0 (0.0%) | 0 (0.0%) |
Income Below Poverty Among Married-Couple vs Single-Parent Households in Alder
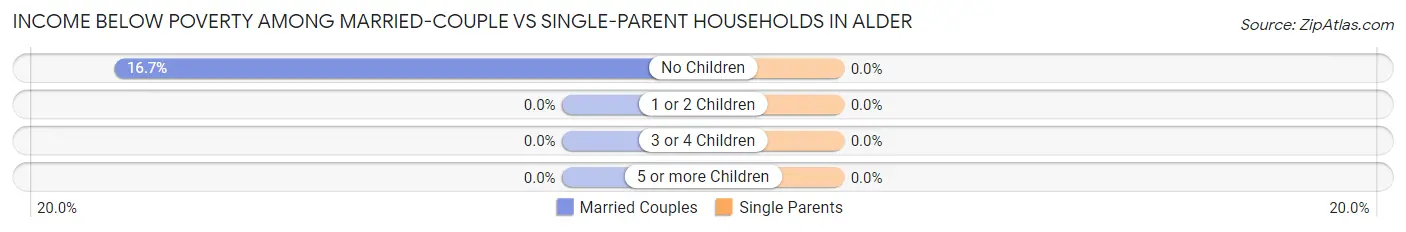
| Children | Married-Couple Families | Single-Parent Households |
| No Children | 3 (16.7%) | 0 (0.0%) |
| 1 or 2 Children | 0 (0.0%) | 0 (0.0%) |
| 3 or 4 Children | 0 (0.0%) | 0 (0.0%) |
| 5 or more Children | 0 (0.0%) | 0 (0.0%) |
| Total | 3 (11.1%) | 0 (0.0%) |
Employment Characteristics in Alder
Employment by Class of Employer in Alder
Among the 53 employed individuals in Alder, private company employees (26 | 49.1%), local government employees (11 | 20.7%), and self-employed (incorporated) (9 | 17.0%) make up the most common classes of employment.
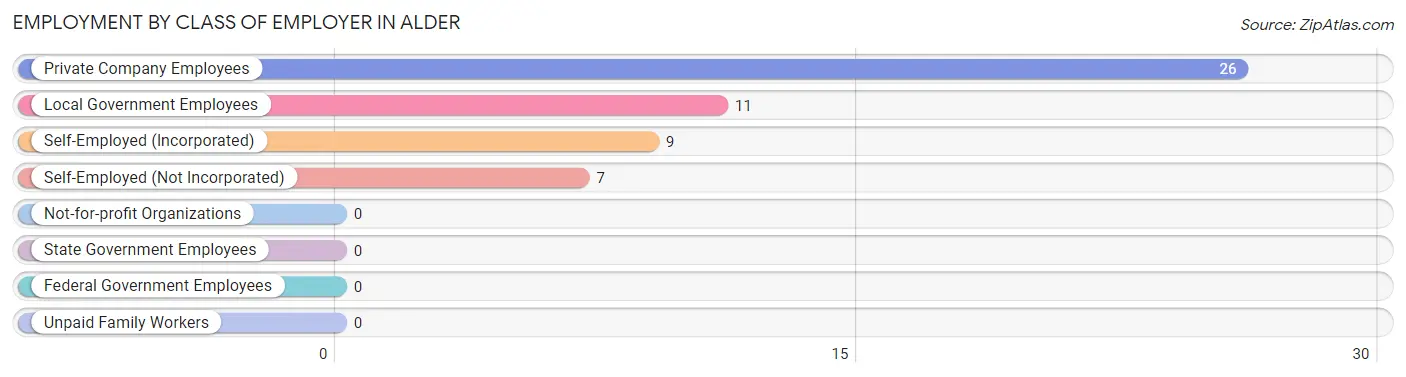
| Employer Class | # Employees | % Employees |
| Private Company Employees | 26 | 49.1% |
| Self-Employed (Incorporated) | 9 | 17.0% |
| Self-Employed (Not Incorporated) | 7 | 13.2% |
| Not-for-profit Organizations | 0 | 0.0% |
| Local Government Employees | 11 | 20.7% |
| State Government Employees | 0 | 0.0% |
| Federal Government Employees | 0 | 0.0% |
| Unpaid Family Workers | 0 | 0.0% |
| Total | 53 | 100.0% |
Employment Status by Age in Alder
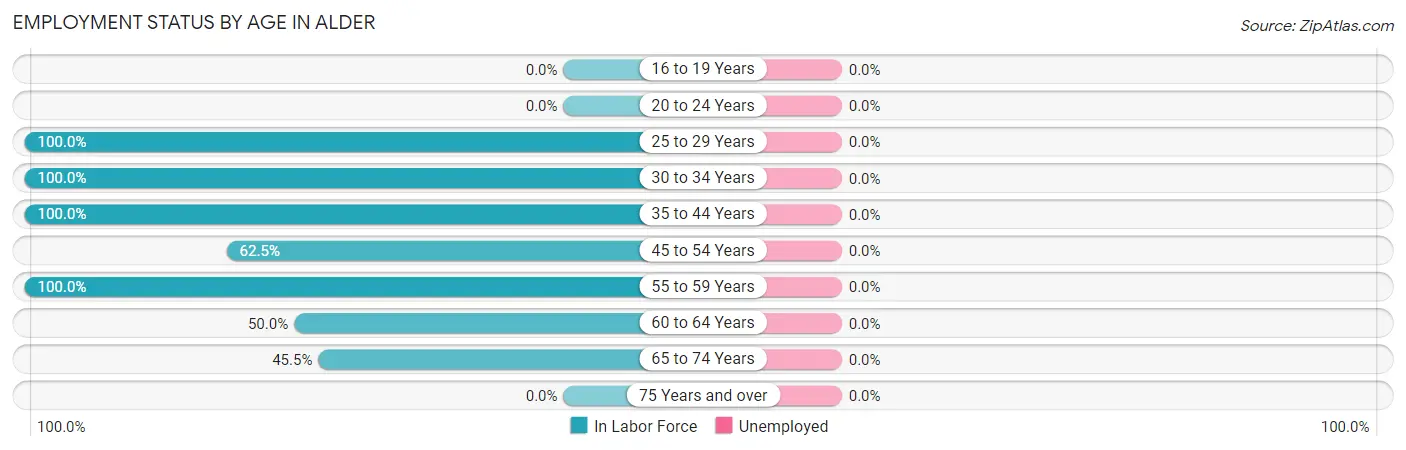
| Age Bracket | In Labor Force | Unemployed |
| 16 to 19 Years | 0 (0.0%) | 0 (0.0%) |
| 20 to 24 Years | 0 (0.0%) | 0 (0.0%) |
| 25 to 29 Years | 3 (100.0%) | 0 (0.0%) |
| 30 to 34 Years | 2 (100.0%) | 0 (0.0%) |
| 35 to 44 Years | 14 (100.0%) | 0 (0.0%) |
| 45 to 54 Years | 10 (62.5%) | 0 (0.0%) |
| 55 to 59 Years | 15 (100.0%) | 0 (0.0%) |
| 60 to 64 Years | 3 (50.0%) | 0 (0.0%) |
| 65 to 74 Years | 10 (45.5%) | 0 (0.0%) |
| 75 Years and over | 0 (0.0%) | 0 (0.0%) |
| Total | 57 (60.6%) | 0 (0.0%) |
Employment Status by Educational Attainment in Alder
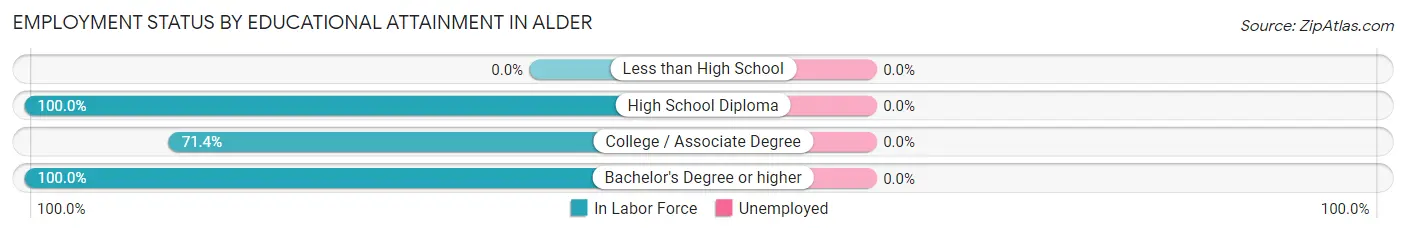
| Educational Attainment | In Labor Force | Unemployed |
| Less than High School | 0 (0.0%) | 0 (0.0%) |
| High School Diploma | 21 (100.0%) | 0 (0.0%) |
| College / Associate Degree | 15 (71.4%) | 0 (0.0%) |
| Bachelor's Degree or higher | 11 (100.0%) | 0 (0.0%) |
| Total | 47 (83.9%) | 0 (0.0%) |
Employment Occupations by Sex in Alder
Management, Business, Science and Arts Occupations
The most common Management, Business, Science and Arts occupations in Alder are , and Management (22 | 38.6%).
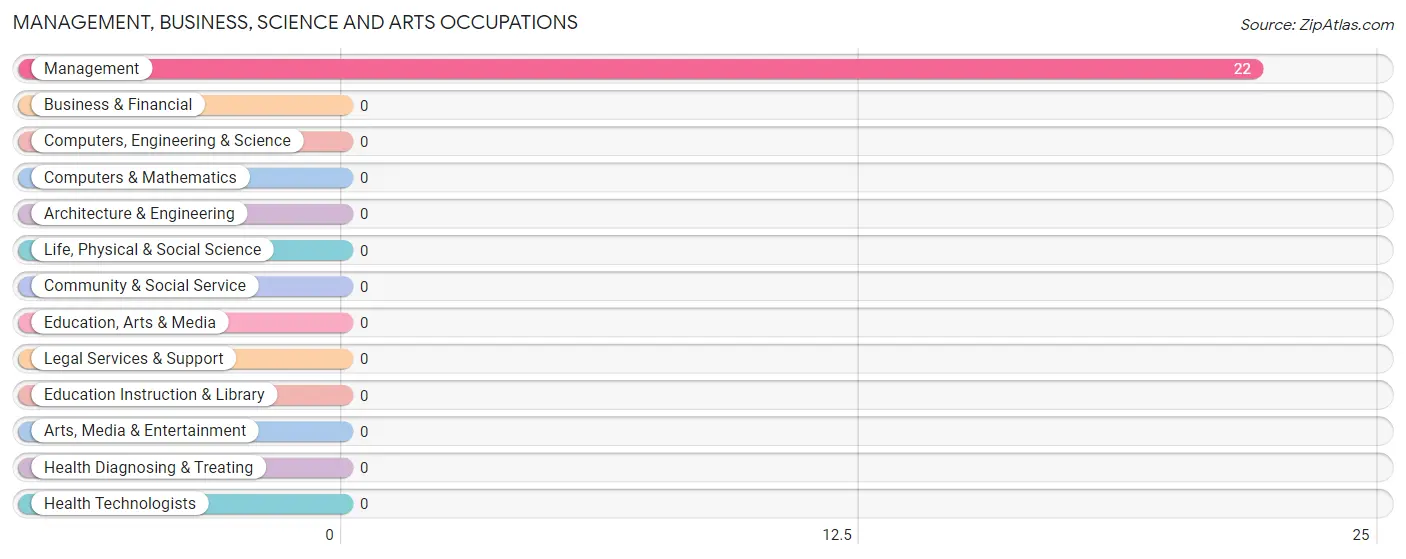
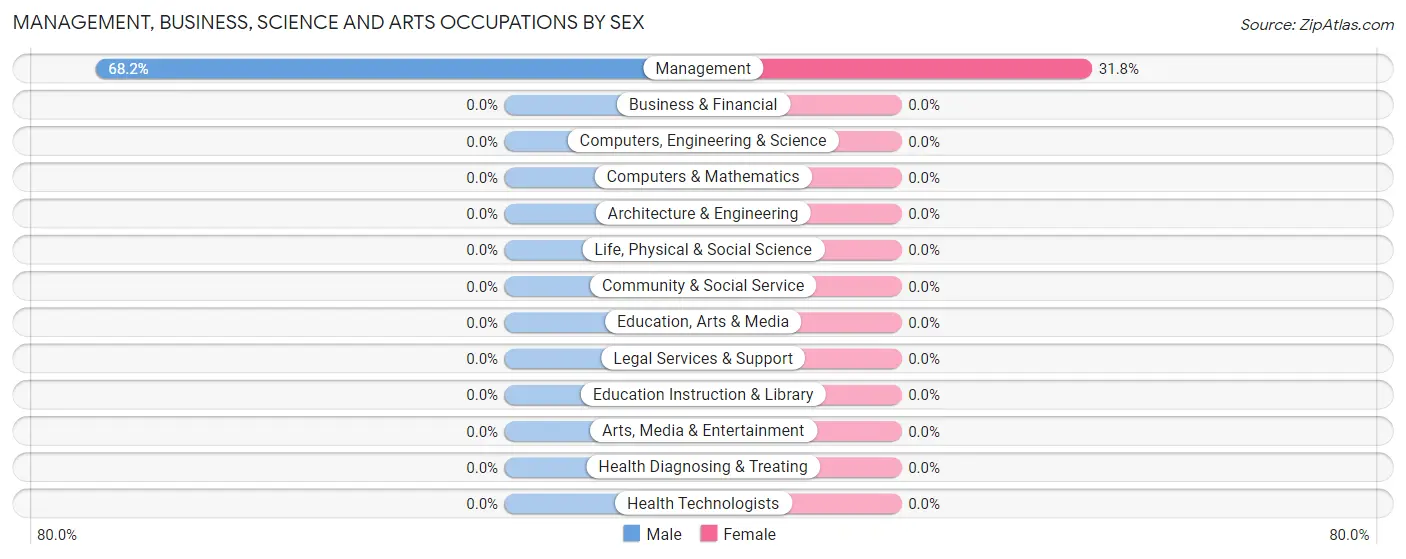
Management, Business, Science and Arts Occupations by Sex
| Occupation | Male | Female |
| Management | 15 (68.2%) | 7 (31.8%) |
| Business & Financial | 0 (0.0%) | 0 (0.0%) |
| Computers, Engineering & Science | 0 (0.0%) | 0 (0.0%) |
| Computers & Mathematics | 0 (0.0%) | 0 (0.0%) |
| Architecture & Engineering | 0 (0.0%) | 0 (0.0%) |
| Life, Physical & Social Science | 0 (0.0%) | 0 (0.0%) |
| Community & Social Service | 0 (0.0%) | 0 (0.0%) |
| Education, Arts & Media | 0 (0.0%) | 0 (0.0%) |
| Legal Services & Support | 0 (0.0%) | 0 (0.0%) |
| Education Instruction & Library | 0 (0.0%) | 0 (0.0%) |
| Arts, Media & Entertainment | 0 (0.0%) | 0 (0.0%) |
| Health Diagnosing & Treating | 0 (0.0%) | 0 (0.0%) |
| Health Technologists | 0 (0.0%) | 0 (0.0%) |
| Total (Category) | 15 (68.2%) | 7 (31.8%) |
| Total (Overall) | 42 (73.7%) | 15 (26.3%) |
Services Occupations
The most common Services occupations in Alder are , and Food Preparation & Serving (12 | 21.0%).
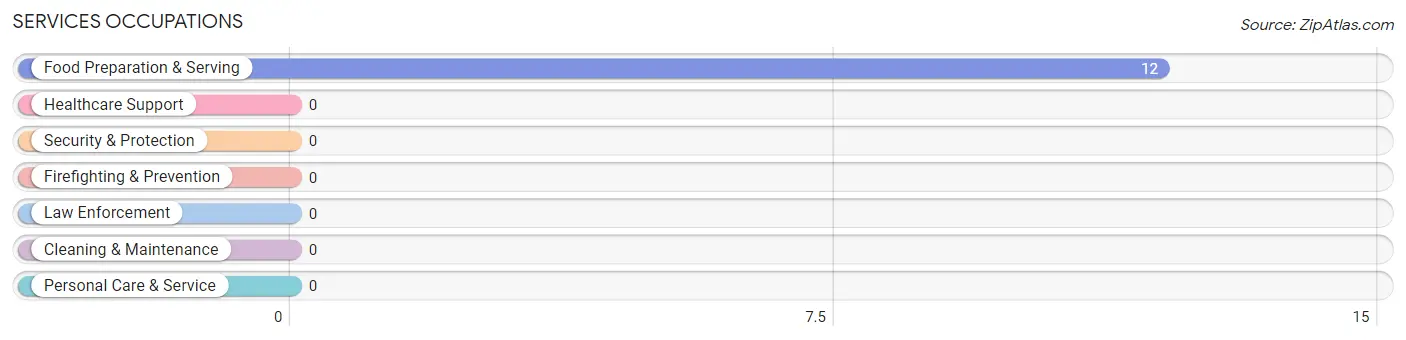
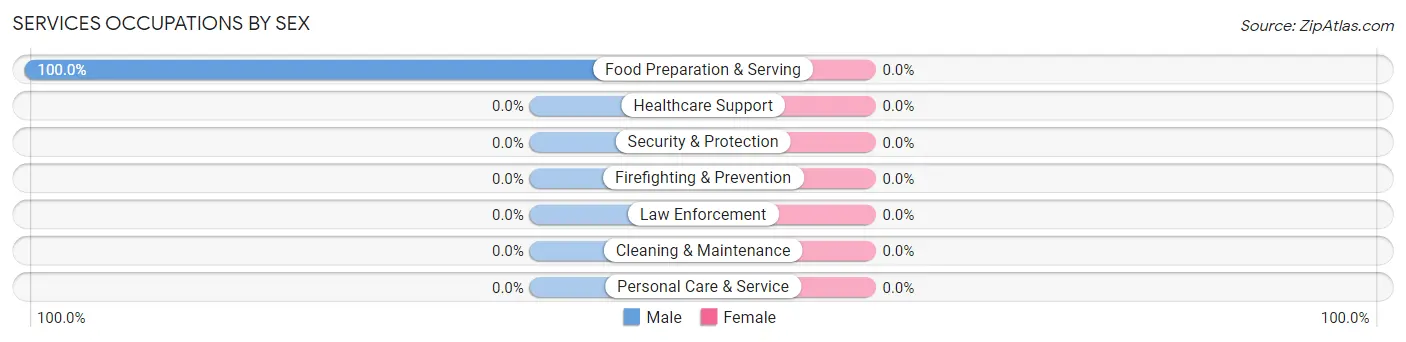
Services Occupations by Sex
| Occupation | Male | Female |
| Healthcare Support | 0 (0.0%) | 0 (0.0%) |
| Security & Protection | 0 (0.0%) | 0 (0.0%) |
| Firefighting & Prevention | 0 (0.0%) | 0 (0.0%) |
| Law Enforcement | 0 (0.0%) | 0 (0.0%) |
| Food Preparation & Serving | 12 (100.0%) | 0 (0.0%) |
| Cleaning & Maintenance | 0 (0.0%) | 0 (0.0%) |
| Personal Care & Service | 0 (0.0%) | 0 (0.0%) |
| Total (Category) | 12 (100.0%) | 0 (0.0%) |
| Total (Overall) | 42 (73.7%) | 15 (26.3%) |
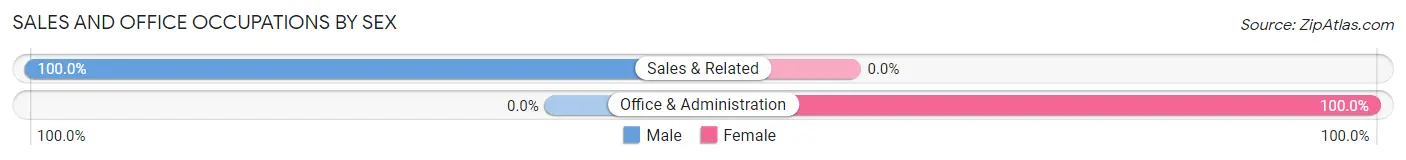
Sales and Office Occupations
The most common Sales and Office occupations in Alder are Office & Administration (8 | 14.0%), and Sales & Related (5 | 8.8%).
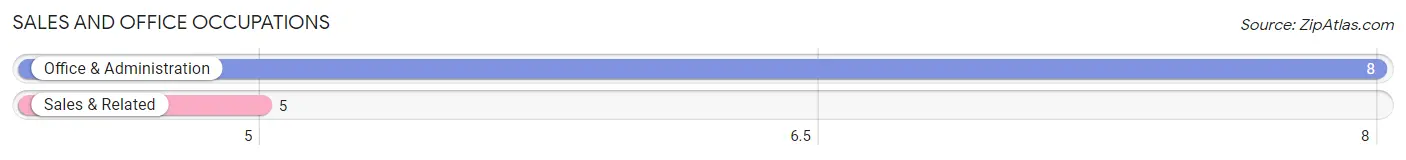
Sales and Office Occupations by Sex
| Occupation | Male | Female |
| Sales & Related | 5 (100.0%) | 0 (0.0%) |
| Office & Administration | 0 (0.0%) | 8 (100.0%) |
| Total (Category) | 5 (38.5%) | 8 (61.5%) |
| Total (Overall) | 42 (73.7%) | 15 (26.3%) |
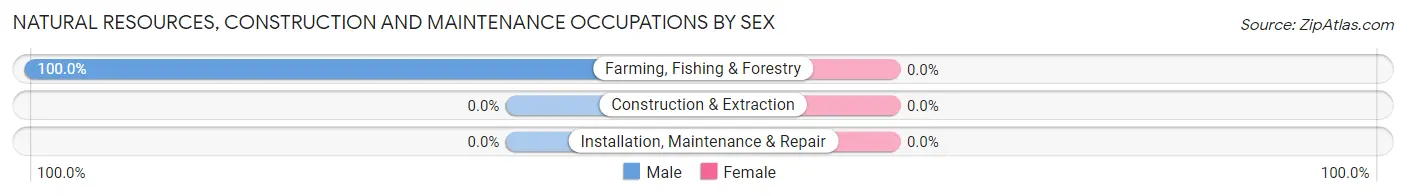
Natural Resources, Construction and Maintenance Occupations
The most common Natural Resources, Construction and Maintenance occupations in Alder are , and Farming, Fishing & Forestry (3 | 5.3%).
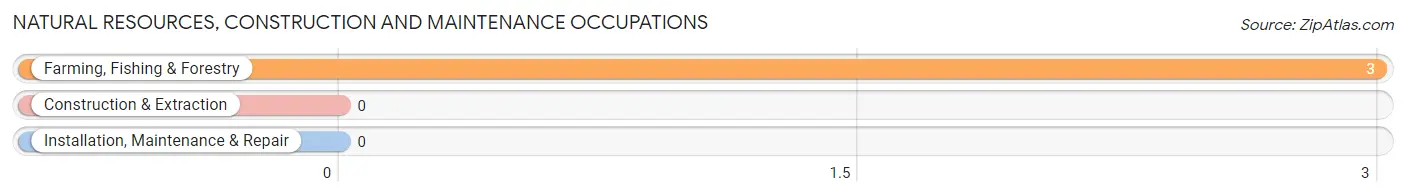
Natural Resources, Construction and Maintenance Occupations by Sex
| Occupation | Male | Female |
| Farming, Fishing & Forestry | 3 (100.0%) | 0 (0.0%) |
| Construction & Extraction | 0 (0.0%) | 0 (0.0%) |
| Installation, Maintenance & Repair | 0 (0.0%) | 0 (0.0%) |
| Total (Category) | 3 (100.0%) | 0 (0.0%) |
| Total (Overall) | 42 (73.7%) | 15 (26.3%) |
Production, Transportation and Moving Occupations
The most common Production, Transportation and Moving occupations in Alder are , and Transportation (7 | 12.3%).
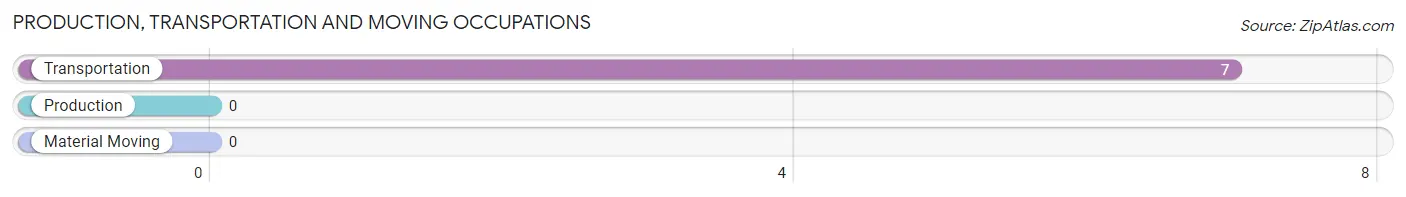
Production, Transportation and Moving Occupations by Sex
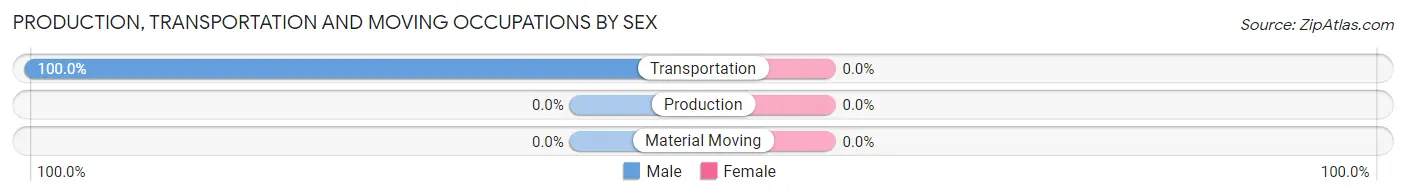
| Occupation | Male | Female |
| Production | 0 (0.0%) | 0 (0.0%) |
| Transportation | 7 (100.0%) | 0 (0.0%) |
| Material Moving | 0 (0.0%) | 0 (0.0%) |
| Total (Category) | 7 (100.0%) | 0 (0.0%) |
| Total (Overall) | 42 (73.7%) | 15 (26.3%) |
Employment Industries by Sex in Alder
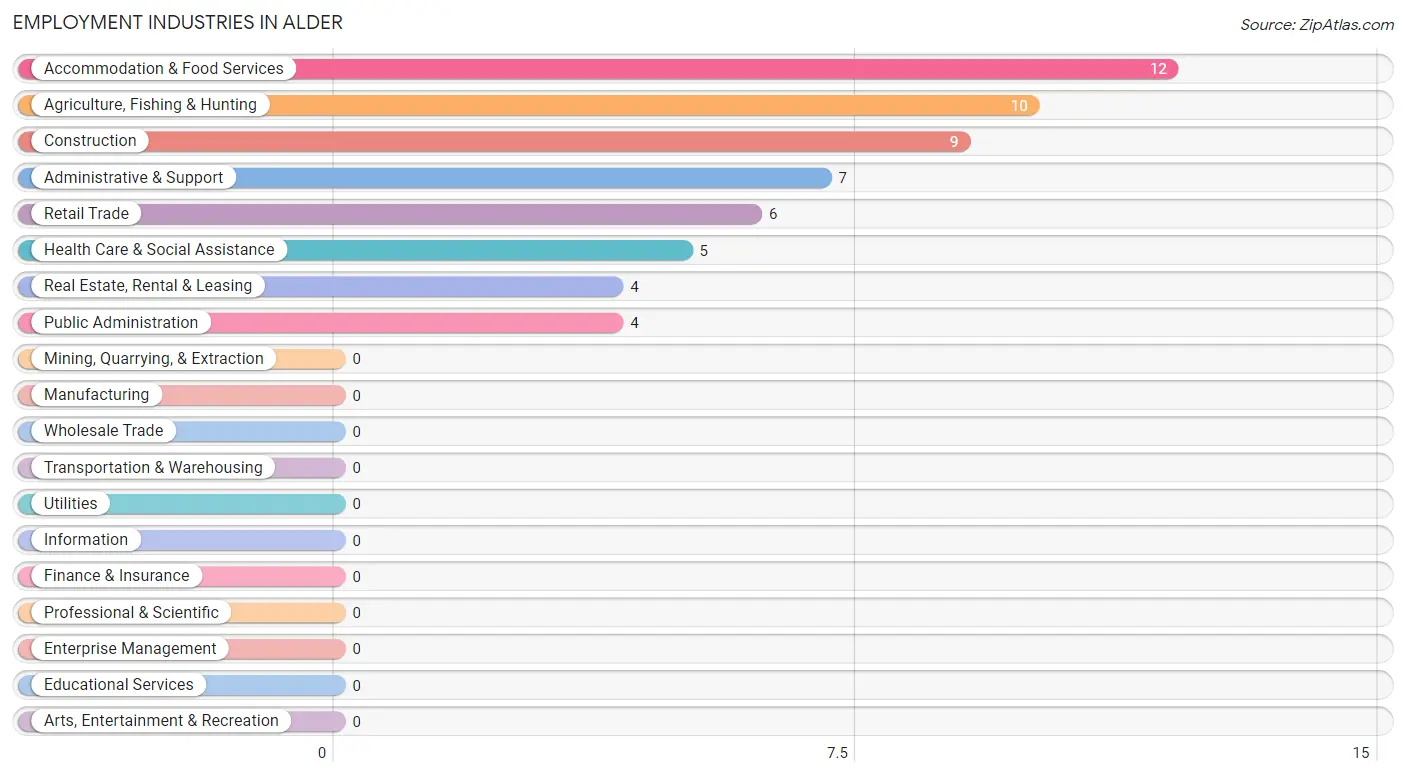
Employment Industries in Alder
The major employment industries in Alder include Accommodation & Food Services (12 | 21.0%), Agriculture, Fishing & Hunting (10 | 17.5%), Construction (9 | 15.8%), Administrative & Support (7 | 12.3%), and Retail Trade (6 | 10.5%).
Employment Industries by Sex in Alder
The Alder industries that see more men than women are Construction (100.0%), Administrative & Support (100.0%), and Accommodation & Food Services (100.0%), whereas the industries that tend to have a higher number of women are Health Care & Social Assistance (100.0%), Public Administration (100.0%), and Retail Trade (50.0%).
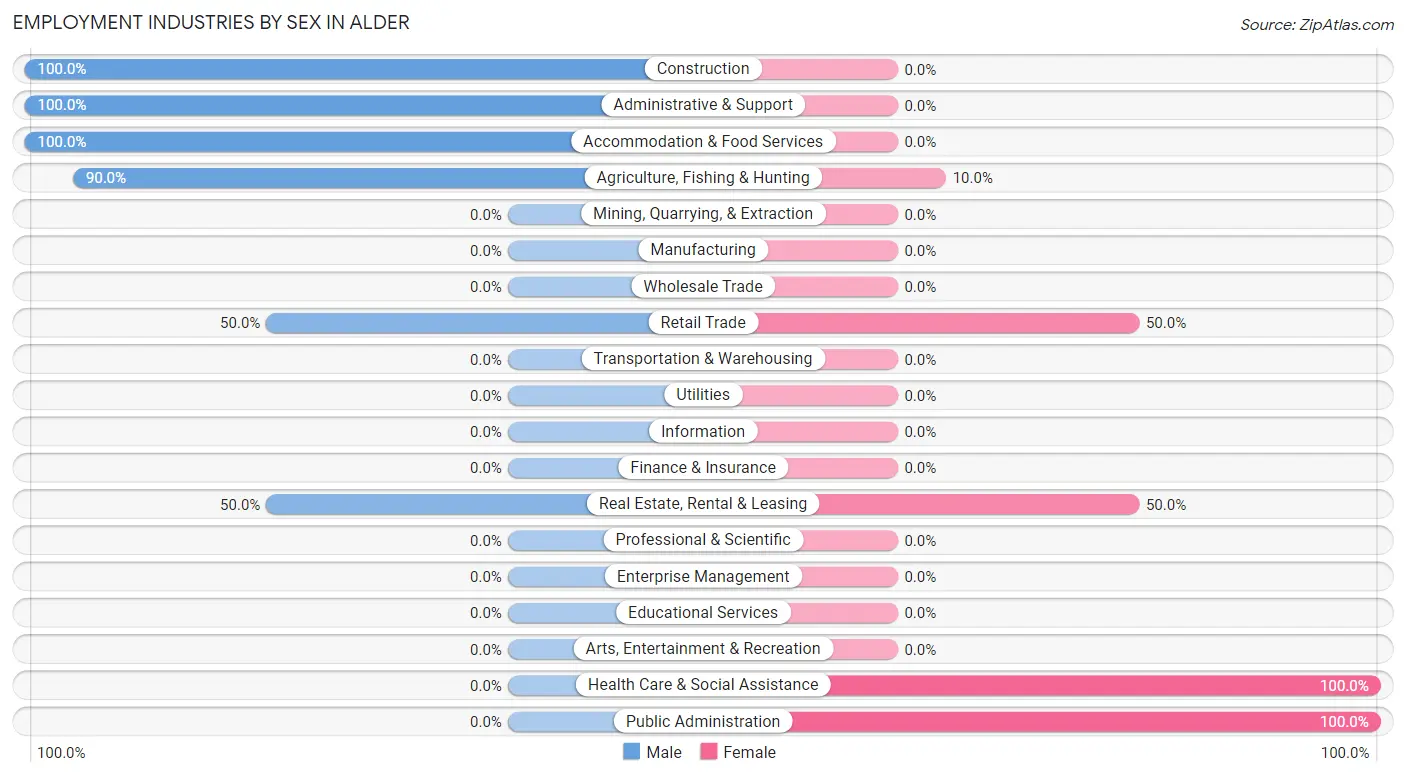
| Industry | Male | Female |
| Agriculture, Fishing & Hunting | 9 (90.0%) | 1 (10.0%) |
| Mining, Quarrying, & Extraction | 0 (0.0%) | 0 (0.0%) |
| Construction | 9 (100.0%) | 0 (0.0%) |
| Manufacturing | 0 (0.0%) | 0 (0.0%) |
| Wholesale Trade | 0 (0.0%) | 0 (0.0%) |
| Retail Trade | 3 (50.0%) | 3 (50.0%) |
| Transportation & Warehousing | 0 (0.0%) | 0 (0.0%) |
| Utilities | 0 (0.0%) | 0 (0.0%) |
| Information | 0 (0.0%) | 0 (0.0%) |
| Finance & Insurance | 0 (0.0%) | 0 (0.0%) |
| Real Estate, Rental & Leasing | 2 (50.0%) | 2 (50.0%) |
| Professional & Scientific | 0 (0.0%) | 0 (0.0%) |
| Enterprise Management | 0 (0.0%) | 0 (0.0%) |
| Administrative & Support | 7 (100.0%) | 0 (0.0%) |
| Educational Services | 0 (0.0%) | 0 (0.0%) |
| Health Care & Social Assistance | 0 (0.0%) | 5 (100.0%) |
| Arts, Entertainment & Recreation | 0 (0.0%) | 0 (0.0%) |
| Accommodation & Food Services | 12 (100.0%) | 0 (0.0%) |
| Public Administration | 0 (0.0%) | 4 (100.0%) |
| Total | 42 (73.7%) | 15 (26.3%) |
Education in Alder
School Enrollment in Alder
The most common levels of schooling among the 14 students in Alder are middle school (8 | 57.1%), nursery / preschool (4 | 28.6%), and elementary school (2 | 14.3%).
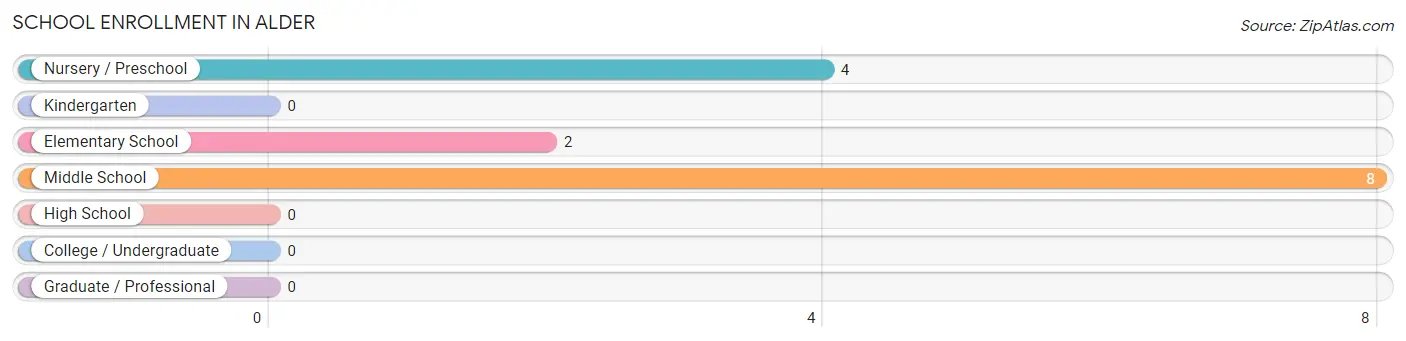
| School Level | # Students | % Students |
| Nursery / Preschool | 4 | 28.6% |
| Kindergarten | 0 | 0.0% |
| Elementary School | 2 | 14.3% |
| Middle School | 8 | 57.1% |
| High School | 0 | 0.0% |
| College / Undergraduate | 0 | 0.0% |
| Graduate / Professional | 0 | 0.0% |
| Total | 14 | 100.0% |
School Enrollment by Age by Funding Source in Alder
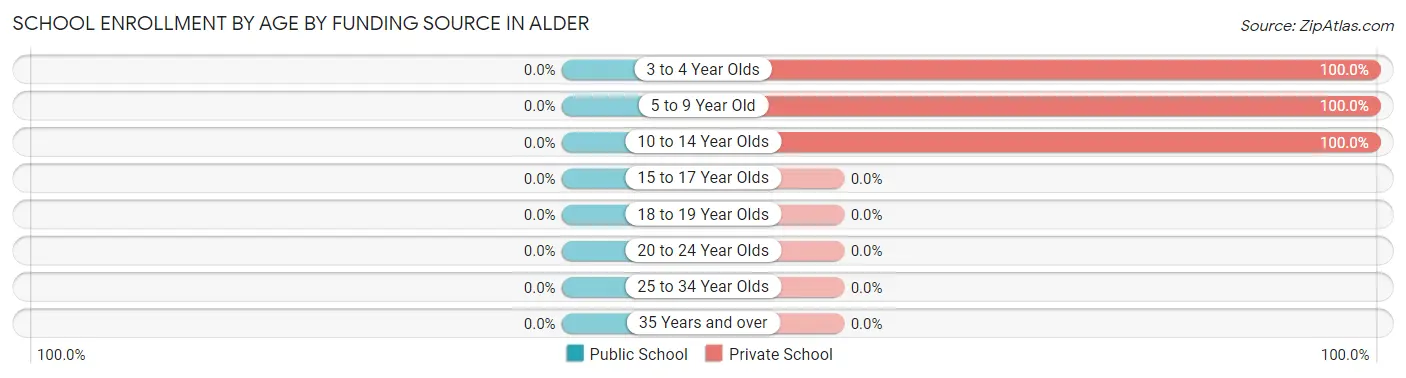
| Age Bracket | Public School | Private School |
| 3 to 4 Year Olds | 0 (0.0%) | 4 (100.0%) |
| 5 to 9 Year Old | 0 (0.0%) | 2 (100.0%) |
| 10 to 14 Year Olds | 0 (0.0%) | 8 (100.0%) |
| 15 to 17 Year Olds | 0 (0.0%) | 0 (0.0%) |
| 18 to 19 Year Olds | 0 (0.0%) | 0 (0.0%) |
| 20 to 24 Year Olds | 0 (0.0%) | 0 (0.0%) |
| 25 to 34 Year Olds | 0 (0.0%) | 0 (0.0%) |
| 35 Years and over | 0 (0.0%) | 0 (0.0%) |
| Total | 0 (0.0%) | 14 (100.0%) |
Educational Attainment by Field of Study in Alder
Visual & performing arts (9 | 39.1%), business (7 | 30.4%), education (3 | 13.0%), bio, nature & agricultural (2 | 8.7%), and science & technology (2 | 8.7%) are the most common fields of study among 23 individuals in Alder who have obtained a bachelor's degree or higher.
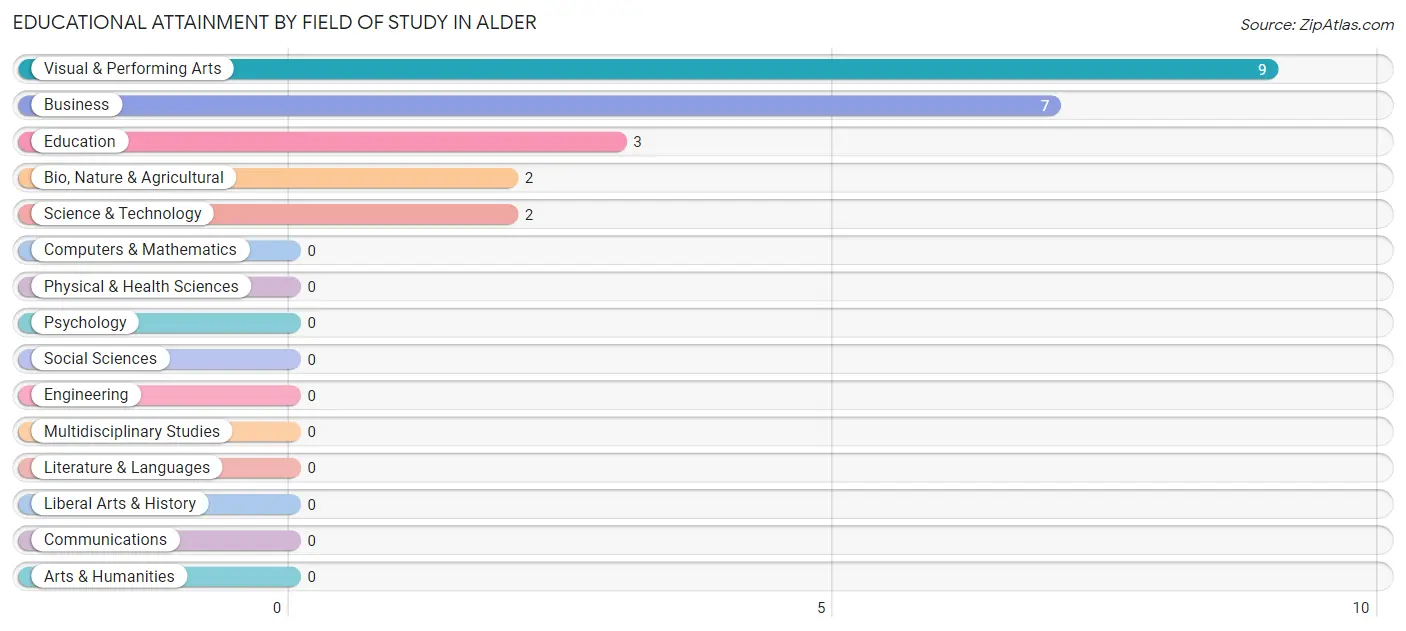
| Field of Study | # Graduates | % Graduates |
| Computers & Mathematics | 0 | 0.0% |
| Bio, Nature & Agricultural | 2 | 8.7% |
| Physical & Health Sciences | 0 | 0.0% |
| Psychology | 0 | 0.0% |
| Social Sciences | 0 | 0.0% |
| Engineering | 0 | 0.0% |
| Multidisciplinary Studies | 0 | 0.0% |
| Science & Technology | 2 | 8.7% |
| Business | 7 | 30.4% |
| Education | 3 | 13.0% |
| Literature & Languages | 0 | 0.0% |
| Liberal Arts & History | 0 | 0.0% |
| Visual & Performing Arts | 9 | 39.1% |
| Communications | 0 | 0.0% |
| Arts & Humanities | 0 | 0.0% |
| Total | 23 | 100.0% |
Transportation & Commute in Alder
Vehicle Availability by Sex in Alder
The most prevalent vehicle ownership categories in Alder are males with 2 vehicles (17, accounting for 44.7%) and females with 2 vehicles (9, making up 113.3%).
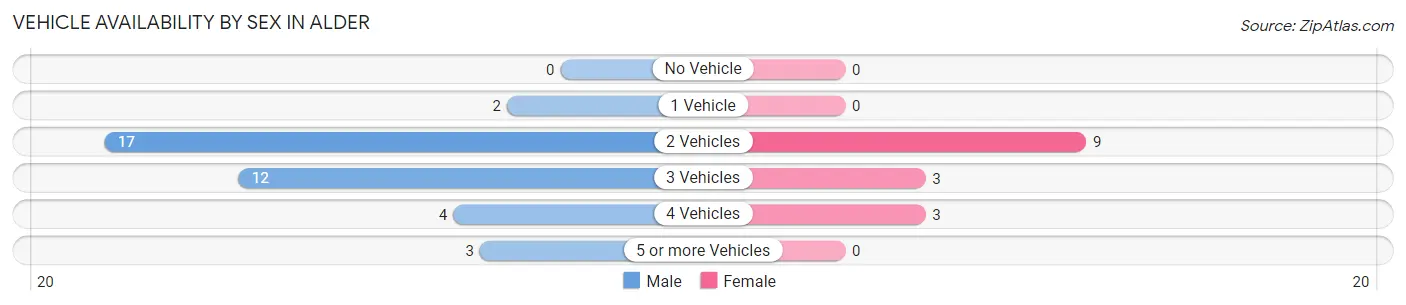
| Vehicles Available | Male | Female |
| No Vehicle | 0 (0.0%) | 0 (0.0%) |
| 1 Vehicle | 2 (5.3%) | 0 (0.0%) |
| 2 Vehicles | 17 (44.7%) | 9 (60.0%) |
| 3 Vehicles | 12 (31.6%) | 3 (20.0%) |
| 4 Vehicles | 4 (10.5%) | 3 (20.0%) |
| 5 or more Vehicles | 3 (7.9%) | 0 (0.0%) |
| Total | 38 (100.0%) | 15 (100.0%) |
Commute Time in Alder
The most frequently occuring commute durations in Alder are less than 5 minutes (23 commuters, 60.5%), 15 to 19 minutes (8 commuters, 21.0%), and 30 to 34 minutes (3 commuters, 7.9%).
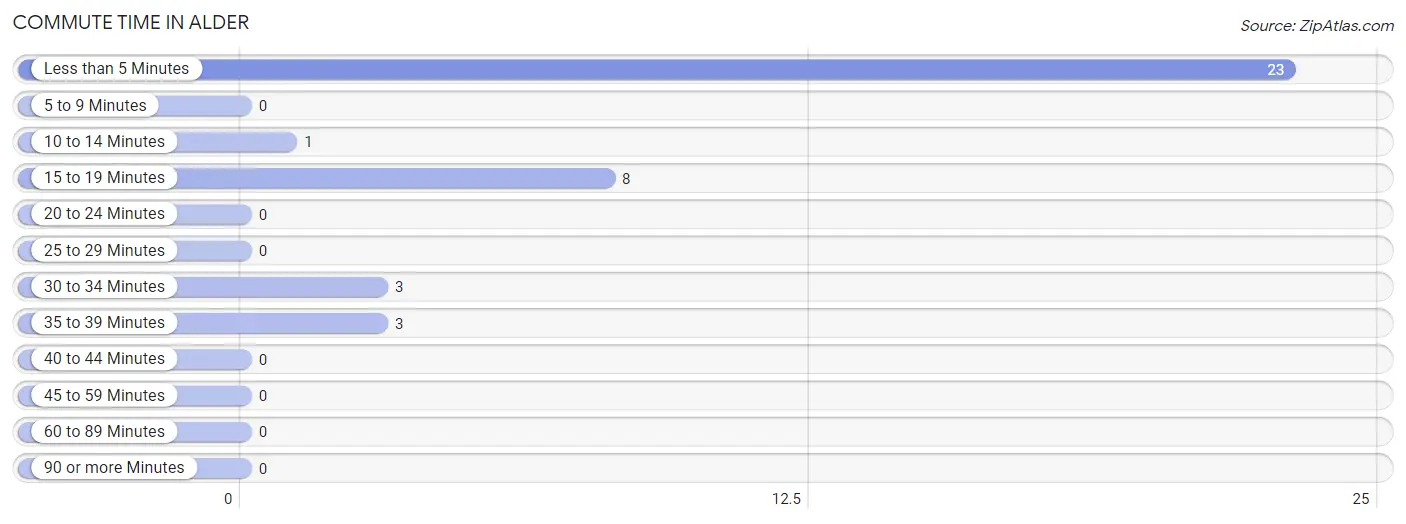
| Commute Time | # Commuters | % Commuters |
| Less than 5 Minutes | 23 | 60.5% |
| 5 to 9 Minutes | 0 | 0.0% |
| 10 to 14 Minutes | 1 | 2.6% |
| 15 to 19 Minutes | 8 | 21.0% |
| 20 to 24 Minutes | 0 | 0.0% |
| 25 to 29 Minutes | 0 | 0.0% |
| 30 to 34 Minutes | 3 | 7.9% |
| 35 to 39 Minutes | 3 | 7.9% |
| 40 to 44 Minutes | 0 | 0.0% |
| 45 to 59 Minutes | 0 | 0.0% |
| 60 to 89 Minutes | 0 | 0.0% |
| 90 or more Minutes | 0 | 0.0% |
Commute Time by Sex in Alder
The most common commute times in Alder are less than 5 minutes (23 commuters, 79.3%) for males and 15 to 19 minutes (8 commuters, 88.9%) for females.
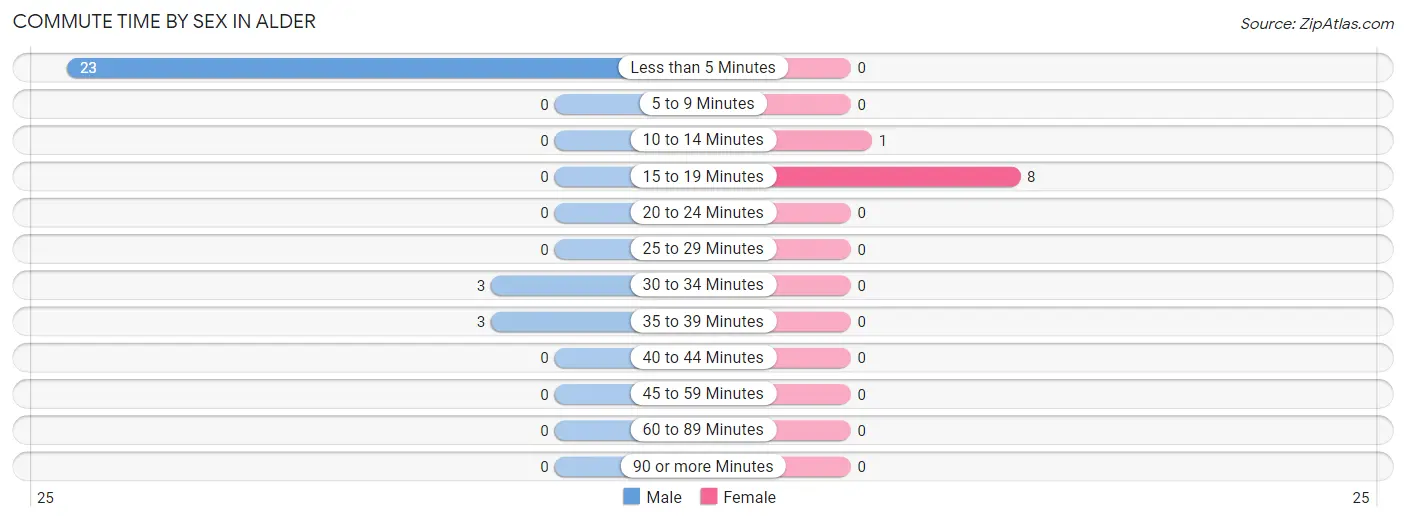
| Commute Time | Male | Female |
| Less than 5 Minutes | 23 (79.3%) | 0 (0.0%) |
| 5 to 9 Minutes | 0 (0.0%) | 0 (0.0%) |
| 10 to 14 Minutes | 0 (0.0%) | 1 (11.1%) |
| 15 to 19 Minutes | 0 (0.0%) | 8 (88.9%) |
| 20 to 24 Minutes | 0 (0.0%) | 0 (0.0%) |
| 25 to 29 Minutes | 0 (0.0%) | 0 (0.0%) |
| 30 to 34 Minutes | 3 (10.3%) | 0 (0.0%) |
| 35 to 39 Minutes | 3 (10.3%) | 0 (0.0%) |
| 40 to 44 Minutes | 0 (0.0%) | 0 (0.0%) |
| 45 to 59 Minutes | 0 (0.0%) | 0 (0.0%) |
| 60 to 89 Minutes | 0 (0.0%) | 0 (0.0%) |
| 90 or more Minutes | 0 (0.0%) | 0 (0.0%) |
Time of Departure to Work by Sex in Alder
The most frequent times of departure to work in Alder are 12:00 PM to 3:59 PM (12, 41.4%) for males and 8:30 AM to 8:59 AM (5, 55.6%) for females.
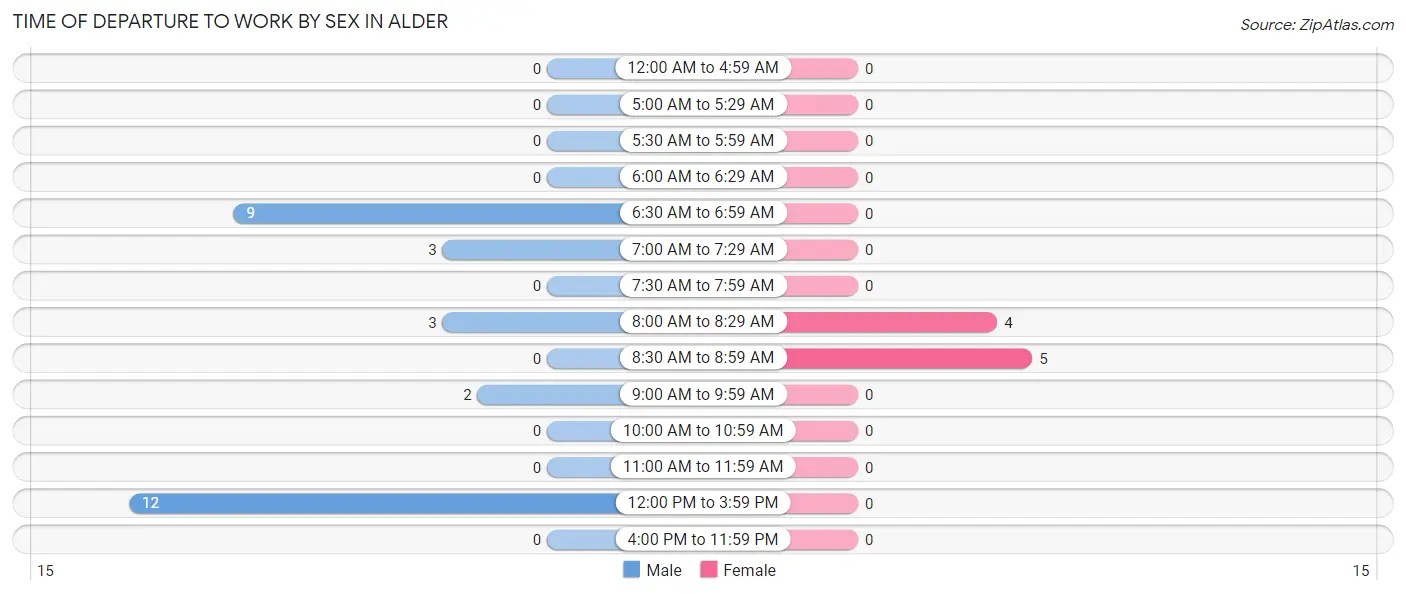
| Time of Departure | Male | Female |
| 12:00 AM to 4:59 AM | 0 (0.0%) | 0 (0.0%) |
| 5:00 AM to 5:29 AM | 0 (0.0%) | 0 (0.0%) |
| 5:30 AM to 5:59 AM | 0 (0.0%) | 0 (0.0%) |
| 6:00 AM to 6:29 AM | 0 (0.0%) | 0 (0.0%) |
| 6:30 AM to 6:59 AM | 9 (31.0%) | 0 (0.0%) |
| 7:00 AM to 7:29 AM | 3 (10.3%) | 0 (0.0%) |
| 7:30 AM to 7:59 AM | 0 (0.0%) | 0 (0.0%) |
| 8:00 AM to 8:29 AM | 3 (10.3%) | 4 (44.4%) |
| 8:30 AM to 8:59 AM | 0 (0.0%) | 5 (55.6%) |
| 9:00 AM to 9:59 AM | 2 (6.9%) | 0 (0.0%) |
| 10:00 AM to 10:59 AM | 0 (0.0%) | 0 (0.0%) |
| 11:00 AM to 11:59 AM | 0 (0.0%) | 0 (0.0%) |
| 12:00 PM to 3:59 PM | 12 (41.4%) | 0 (0.0%) |
| 4:00 PM to 11:59 PM | 0 (0.0%) | 0 (0.0%) |
| Total | 29 (100.0%) | 9 (100.0%) |
Housing Occupancy in Alder
Occupancy by Ownership in Alder
Of the total 52 dwellings in Alder, owner-occupied units account for 40 (76.9%), while renter-occupied units make up 12 (23.1%).
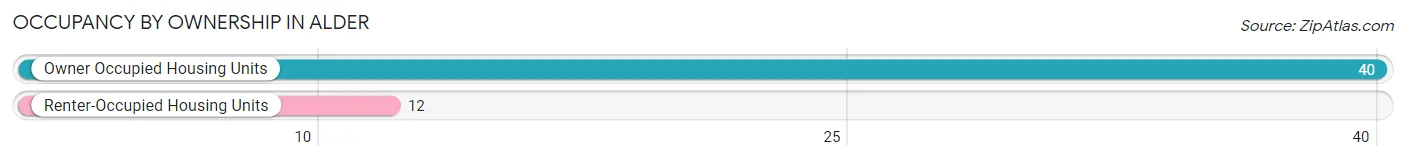
| Occupancy | # Housing Units | % Housing Units |
| Owner Occupied Housing Units | 40 | 76.9% |
| Renter-Occupied Housing Units | 12 | 23.1% |
| Total Occupied Housing Units | 52 | 100.0% |
Occupancy by Household Size in Alder
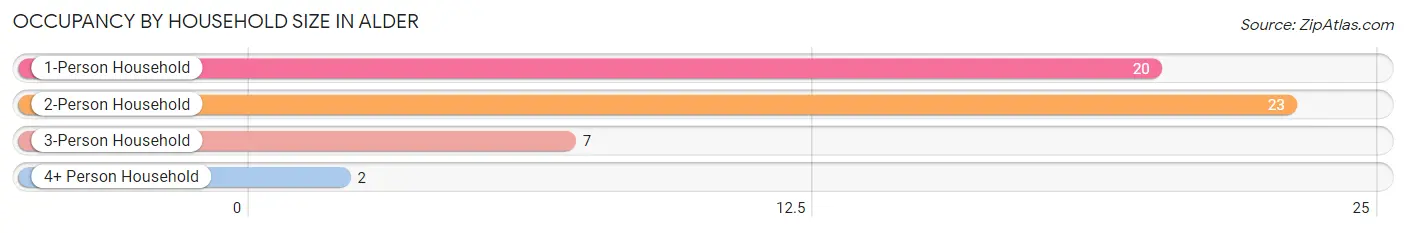
| Household Size | # Housing Units | % Housing Units |
| 1-Person Household | 20 | 38.5% |
| 2-Person Household | 23 | 44.2% |
| 3-Person Household | 7 | 13.5% |
| 4+ Person Household | 2 | 3.8% |
| Total Housing Units | 52 | 100.0% |
Occupancy by Ownership by Household Size in Alder
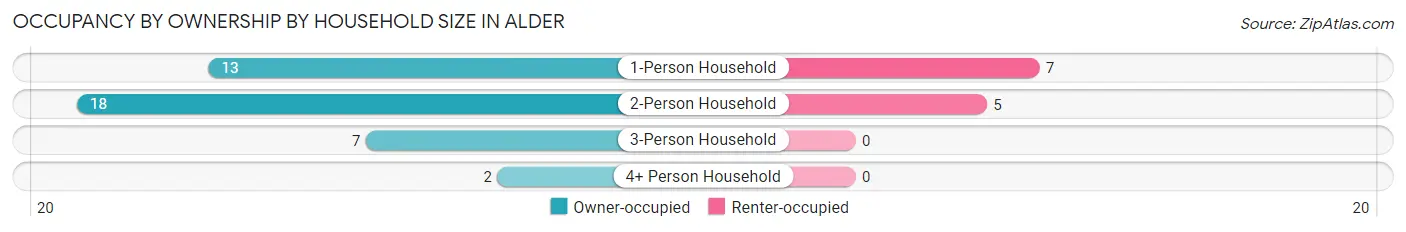
| Household Size | Owner-occupied | Renter-occupied |
| 1-Person Household | 13 (65.0%) | 7 (35.0%) |
| 2-Person Household | 18 (78.3%) | 5 (21.7%) |
| 3-Person Household | 7 (100.0%) | 0 (0.0%) |
| 4+ Person Household | 2 (100.0%) | 0 (0.0%) |
| Total Housing Units | 40 (76.9%) | 12 (23.1%) |
Occupancy by Educational Attainment in Alder
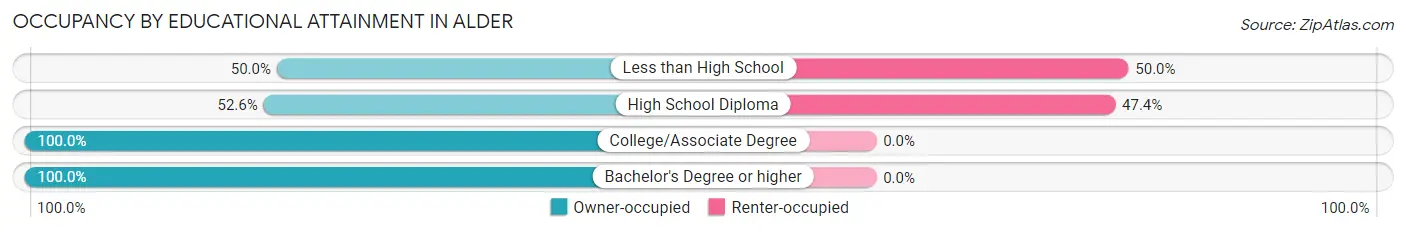
| Household Size | Owner-occupied | Renter-occupied |
| Less than High School | 3 (50.0%) | 3 (50.0%) |
| High School Diploma | 10 (52.6%) | 9 (47.4%) |
| College/Associate Degree | 8 (100.0%) | 0 (0.0%) |
| Bachelor's Degree or higher | 19 (100.0%) | 0 (0.0%) |
Occupancy by Age of Householder in Alder
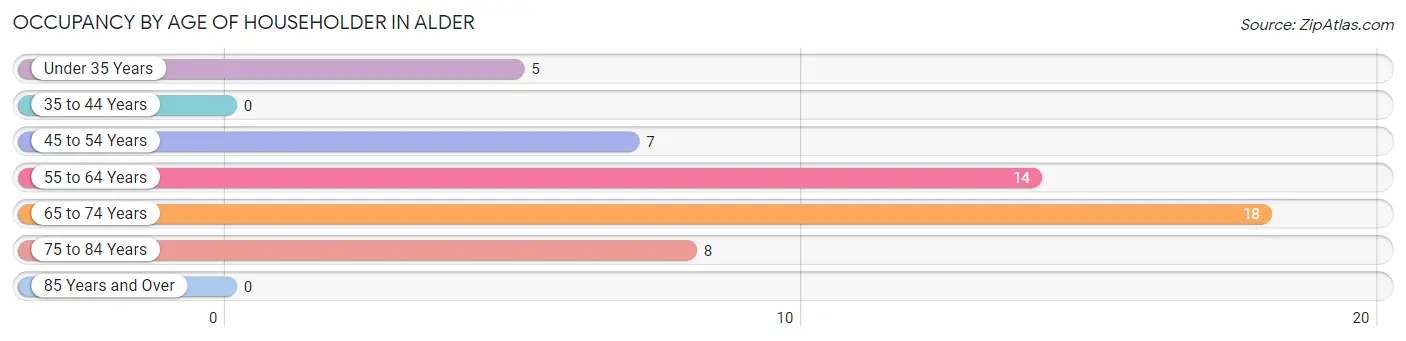
| Age Bracket | # Households | % Households |
| Under 35 Years | 5 | 9.6% |
| 35 to 44 Years | 0 | 0.0% |
| 45 to 54 Years | 7 | 13.5% |
| 55 to 64 Years | 14 | 26.9% |
| 65 to 74 Years | 18 | 34.6% |
| 75 to 84 Years | 8 | 15.4% |
| 85 Years and Over | 0 | 0.0% |
| Total | 52 | 100.0% |
Housing Finances in Alder
Median Income by Occupancy in Alder
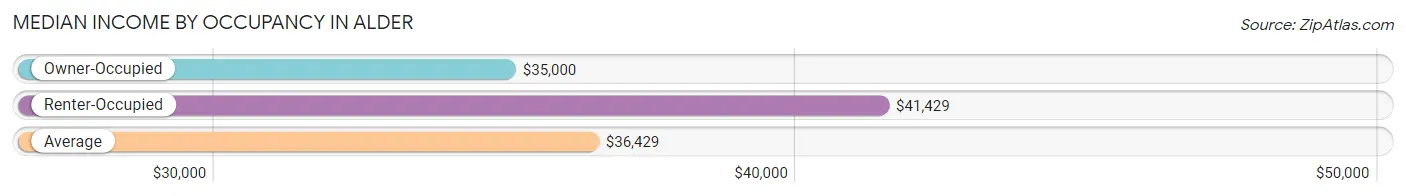
| Occupancy Type | # Households | Median Income |
| Owner-Occupied | 40 (76.9%) | $35,000 |
| Renter-Occupied | 12 (23.1%) | $41,429 |
| Average | 52 (100.0%) | $36,429 |
Occupancy by Householder Income Bracket in Alder
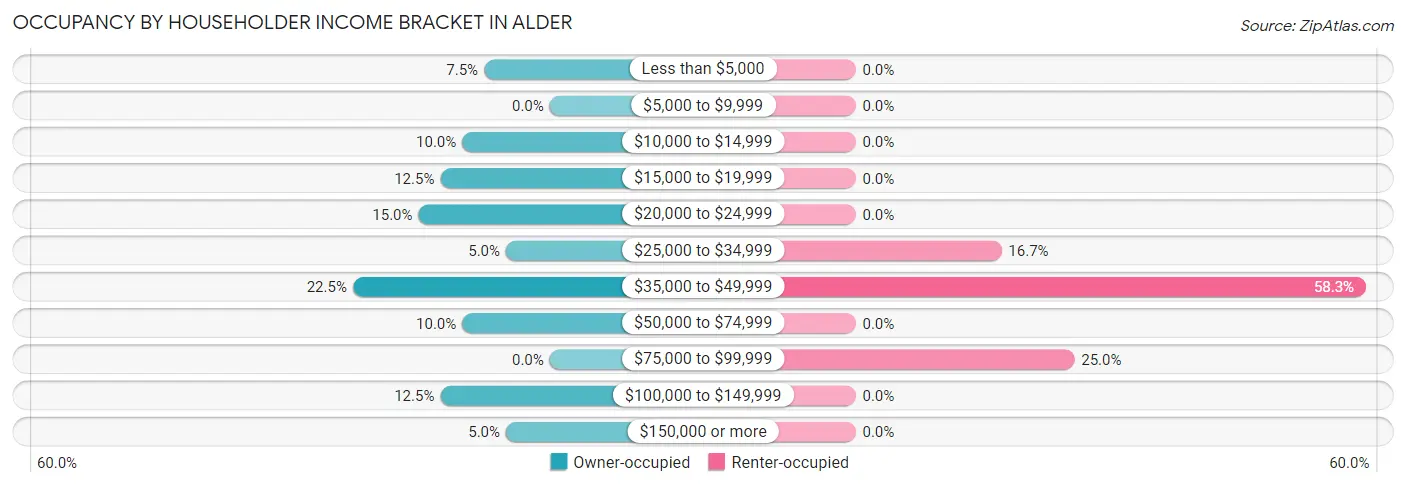
| Income Bracket | Owner-occupied | Renter-occupied |
| Less than $5,000 | 3 (7.5%) | 0 (0.0%) |
| $5,000 to $9,999 | 0 (0.0%) | 0 (0.0%) |
| $10,000 to $14,999 | 4 (10.0%) | 0 (0.0%) |
| $15,000 to $19,999 | 5 (12.5%) | 0 (0.0%) |
| $20,000 to $24,999 | 6 (15.0%) | 0 (0.0%) |
| $25,000 to $34,999 | 2 (5.0%) | 2 (16.7%) |
| $35,000 to $49,999 | 9 (22.5%) | 7 (58.3%) |
| $50,000 to $74,999 | 4 (10.0%) | 0 (0.0%) |
| $75,000 to $99,999 | 0 (0.0%) | 3 (25.0%) |
| $100,000 to $149,999 | 5 (12.5%) | 0 (0.0%) |
| $150,000 or more | 2 (5.0%) | 0 (0.0%) |
| Total | 40 (100.0%) | 12 (100.0%) |
Monthly Housing Cost Tiers in Alder
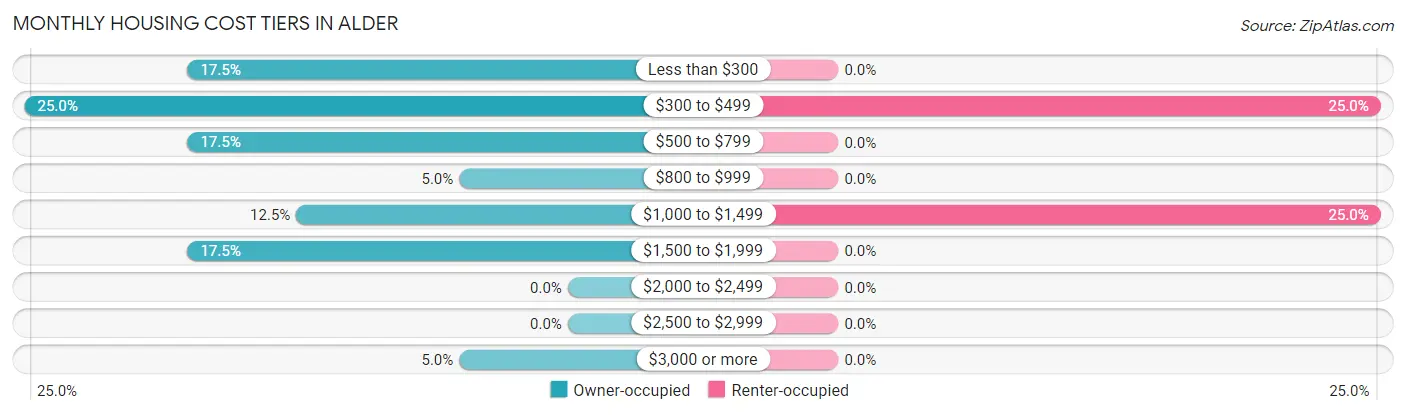
| Monthly Cost | Owner-occupied | Renter-occupied |
| Less than $300 | 7 (17.5%) | 0 (0.0%) |
| $300 to $499 | 10 (25.0%) | 3 (25.0%) |
| $500 to $799 | 7 (17.5%) | 0 (0.0%) |
| $800 to $999 | 2 (5.0%) | 0 (0.0%) |
| $1,000 to $1,499 | 5 (12.5%) | 3 (25.0%) |
| $1,500 to $1,999 | 7 (17.5%) | 0 (0.0%) |
| $2,000 to $2,499 | 0 (0.0%) | 0 (0.0%) |
| $2,500 to $2,999 | 0 (0.0%) | 0 (0.0%) |
| $3,000 or more | 2 (5.0%) | 0 (0.0%) |
| Total | 40 (100.0%) | 12 (100.0%) |
Physical Housing Characteristics in Alder
Housing Structures in Alder
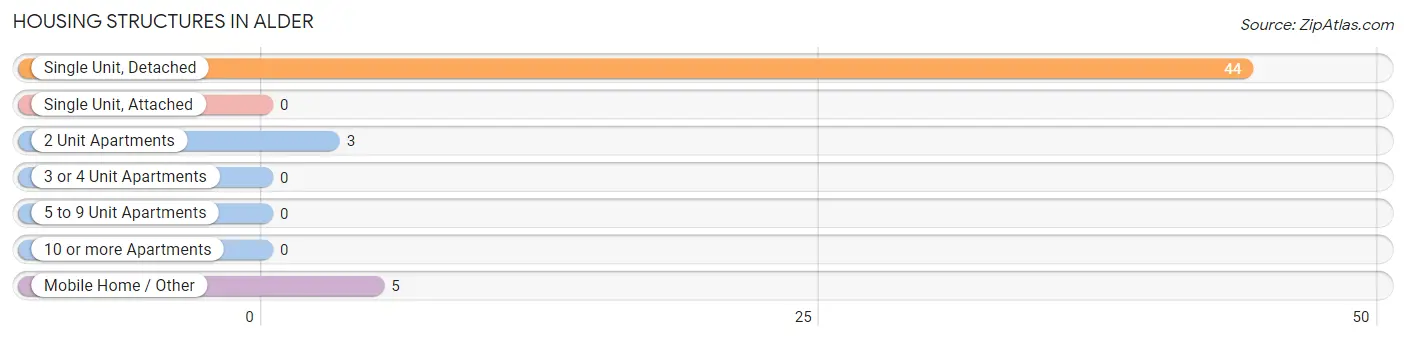
| Structure Type | # Housing Units | % Housing Units |
| Single Unit, Detached | 44 | 84.6% |
| Single Unit, Attached | 0 | 0.0% |
| 2 Unit Apartments | 3 | 5.8% |
| 3 or 4 Unit Apartments | 0 | 0.0% |
| 5 to 9 Unit Apartments | 0 | 0.0% |
| 10 or more Apartments | 0 | 0.0% |
| Mobile Home / Other | 5 | 9.6% |
| Total | 52 | 100.0% |
Housing Structures by Occupancy in Alder
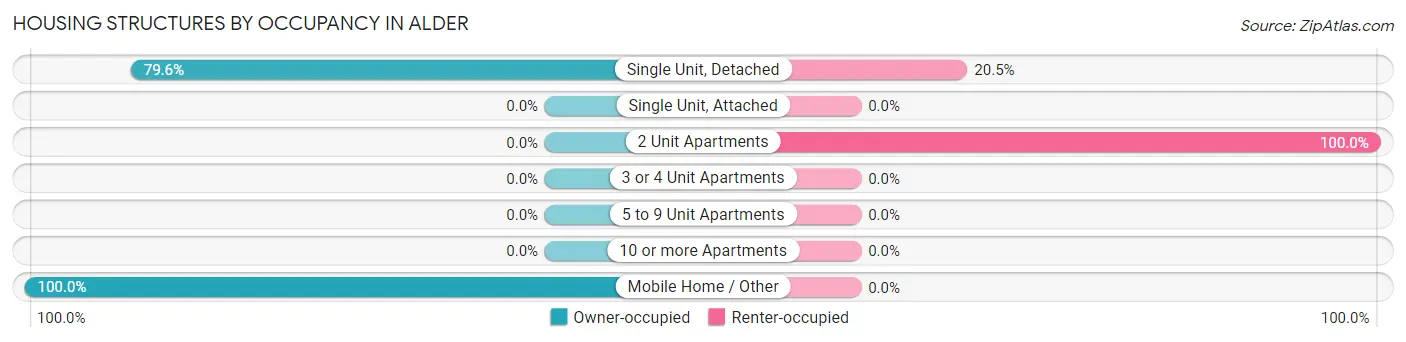
| Structure Type | Owner-occupied | Renter-occupied |
| Single Unit, Detached | 35 (79.5%) | 9 (20.4%) |
| Single Unit, Attached | 0 (0.0%) | 0 (0.0%) |
| 2 Unit Apartments | 0 (0.0%) | 3 (100.0%) |
| 3 or 4 Unit Apartments | 0 (0.0%) | 0 (0.0%) |
| 5 to 9 Unit Apartments | 0 (0.0%) | 0 (0.0%) |
| 10 or more Apartments | 0 (0.0%) | 0 (0.0%) |
| Mobile Home / Other | 5 (100.0%) | 0 (0.0%) |
| Total | 40 (76.9%) | 12 (23.1%) |
Housing Structures by Number of Rooms in Alder
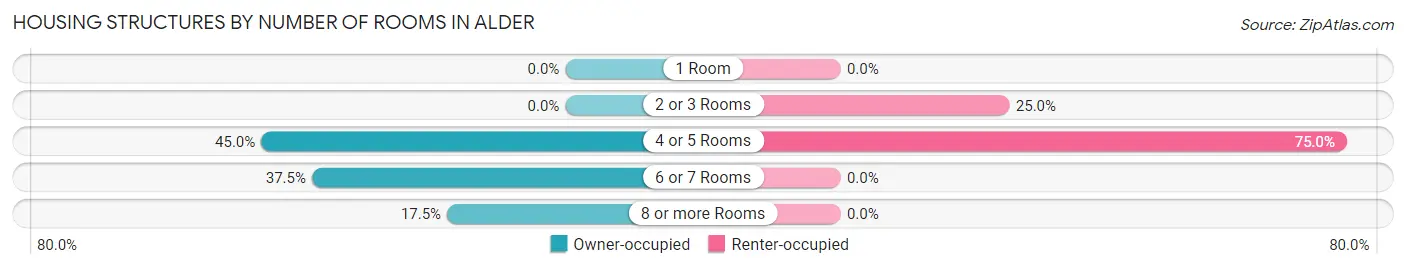
| Number of Rooms | Owner-occupied | Renter-occupied |
| 1 Room | 0 (0.0%) | 0 (0.0%) |
| 2 or 3 Rooms | 0 (0.0%) | 3 (25.0%) |
| 4 or 5 Rooms | 18 (45.0%) | 9 (75.0%) |
| 6 or 7 Rooms | 15 (37.5%) | 0 (0.0%) |
| 8 or more Rooms | 7 (17.5%) | 0 (0.0%) |
| Total | 40 (100.0%) | 12 (100.0%) |
Housing Structure by Heating Type in Alder
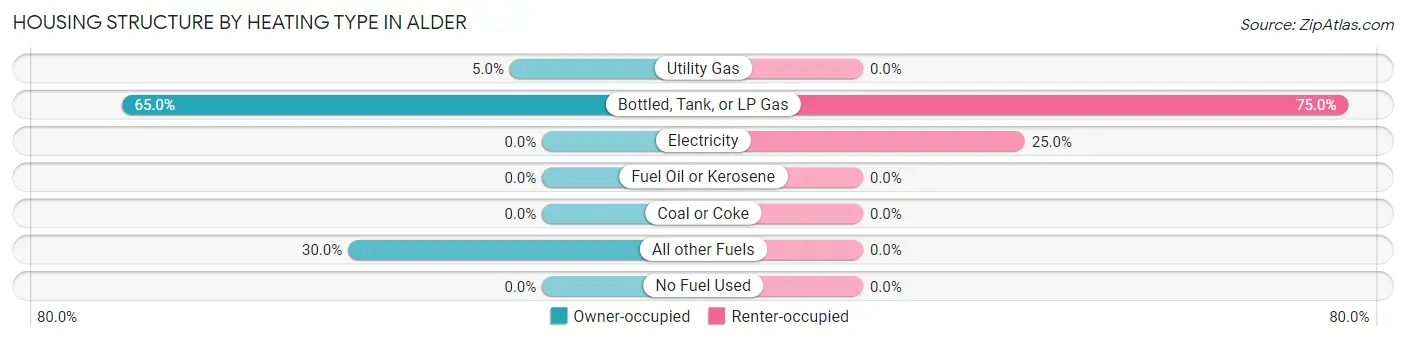
| Heating Type | Owner-occupied | Renter-occupied |
| Utility Gas | 2 (5.0%) | 0 (0.0%) |
| Bottled, Tank, or LP Gas | 26 (65.0%) | 9 (75.0%) |
| Electricity | 0 (0.0%) | 3 (25.0%) |
| Fuel Oil or Kerosene | 0 (0.0%) | 0 (0.0%) |
| Coal or Coke | 0 (0.0%) | 0 (0.0%) |
| All other Fuels | 12 (30.0%) | 0 (0.0%) |
| No Fuel Used | 0 (0.0%) | 0 (0.0%) |
| Total | 40 (100.0%) | 12 (100.0%) |
Household Vehicle Usage in Alder
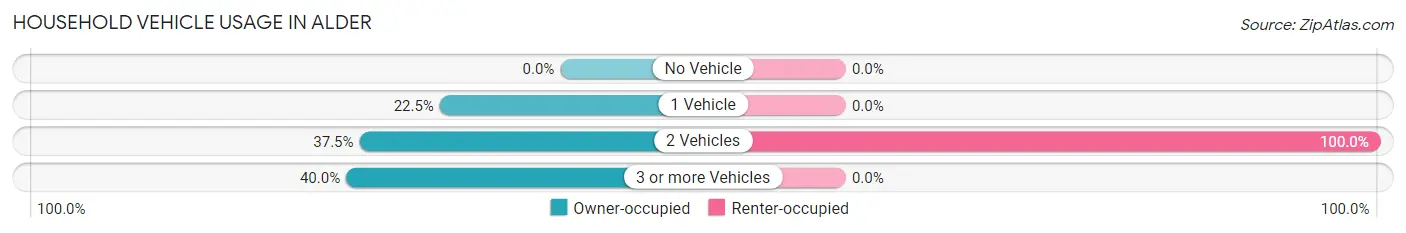
| Vehicles per Household | Owner-occupied | Renter-occupied |
| No Vehicle | 0 (0.0%) | 0 (0.0%) |
| 1 Vehicle | 9 (22.5%) | 0 (0.0%) |
| 2 Vehicles | 15 (37.5%) | 12 (100.0%) |
| 3 or more Vehicles | 16 (40.0%) | 0 (0.0%) |
| Total | 40 (100.0%) | 12 (100.0%) |
Real Estate & Mortgages in Alder
Real Estate and Mortgage Overview in Alder
| Characteristic | Without Mortgage | With Mortgage |
| Housing Units | 26 | 14 |
| Median Property Value | $230,000 | $428,600 |
| Median Household Income | $28,750 | $2 |
| Monthly Housing Costs | $443 | $2 |
| Real Estate Taxes | $1,214 | $0 |
Property Value by Mortgage Status in Alder
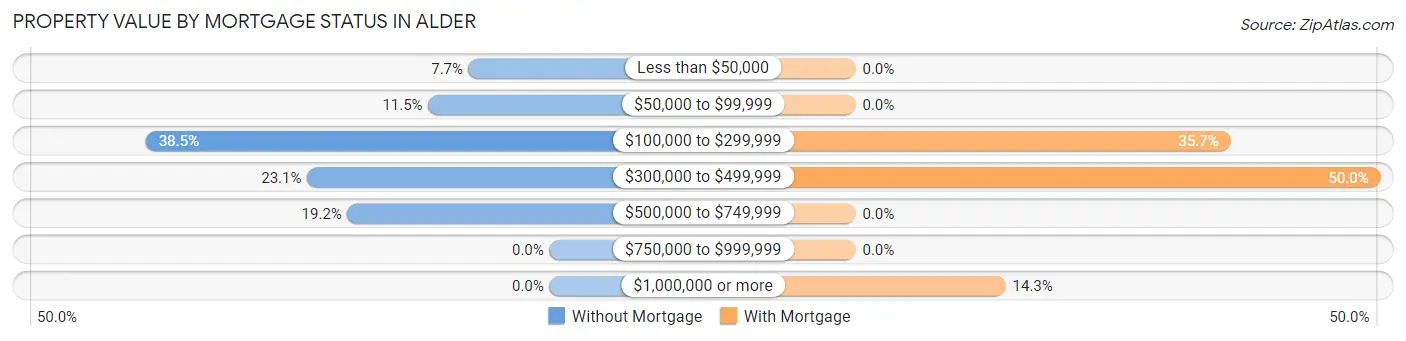
| Property Value | Without Mortgage | With Mortgage |
| Less than $50,000 | 2 (7.7%) | 0 (0.0%) |
| $50,000 to $99,999 | 3 (11.5%) | 0 (0.0%) |
| $100,000 to $299,999 | 10 (38.5%) | 5 (35.7%) |
| $300,000 to $499,999 | 6 (23.1%) | 7 (50.0%) |
| $500,000 to $749,999 | 5 (19.2%) | 0 (0.0%) |
| $750,000 to $999,999 | 0 (0.0%) | 0 (0.0%) |
| $1,000,000 or more | 0 (0.0%) | 2 (14.3%) |
| Total | 26 (100.0%) | 14 (100.0%) |
Household Income by Mortgage Status in Alder
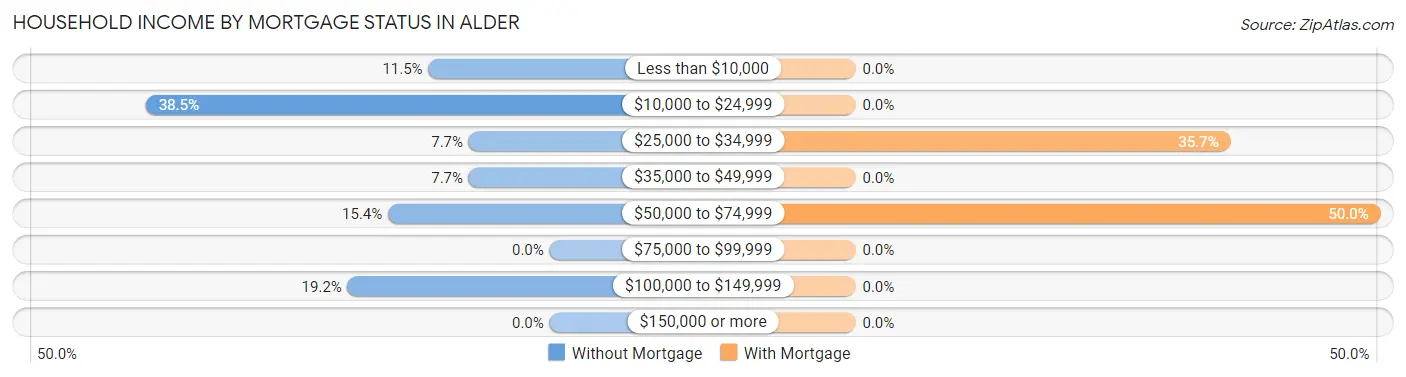
| Household Income | Without Mortgage | With Mortgage |
| Less than $10,000 | 3 (11.5%) | 0 (0.0%) |
| $10,000 to $24,999 | 10 (38.5%) | 0 (0.0%) |
| $25,000 to $34,999 | 2 (7.7%) | 5 (35.7%) |
| $35,000 to $49,999 | 2 (7.7%) | 0 (0.0%) |
| $50,000 to $74,999 | 4 (15.4%) | 7 (50.0%) |
| $75,000 to $99,999 | 0 (0.0%) | 0 (0.0%) |
| $100,000 to $149,999 | 5 (19.2%) | 0 (0.0%) |
| $150,000 or more | 0 (0.0%) | 0 (0.0%) |
| Total | 26 (100.0%) | 14 (100.0%) |
Property Value to Household Income Ratio in Alder
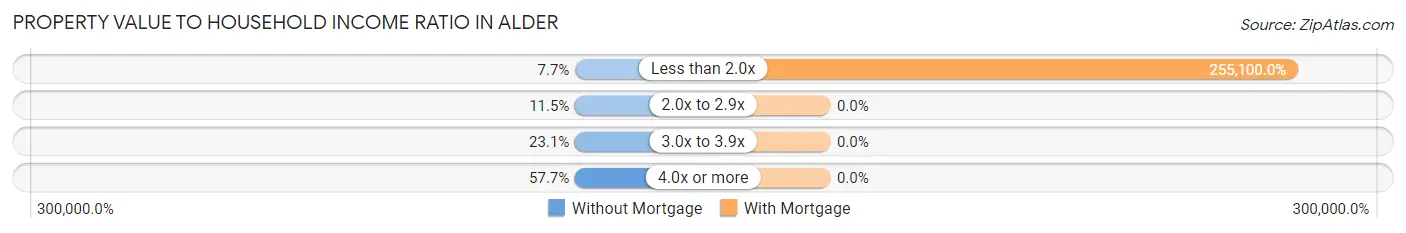
| Value-to-Income Ratio | Without Mortgage | With Mortgage |
| Less than 2.0x | 2 (7.7%) | 35,714 (255,100.0%) |
| 2.0x to 2.9x | 3 (11.5%) | 0 (0.0%) |
| 3.0x to 3.9x | 6 (23.1%) | 0 (0.0%) |
| 4.0x or more | 15 (57.7%) | 0 (0.0%) |
| Total | 26 (100.0%) | 14 (100.0%) |
Real Estate Taxes by Mortgage Status in Alder
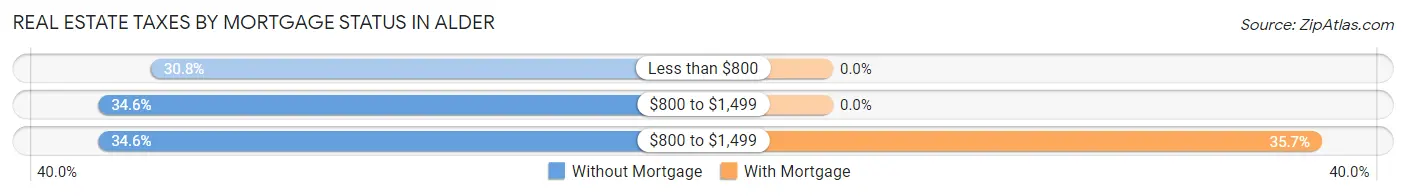
| Property Taxes | Without Mortgage | With Mortgage |
| Less than $800 | 8 (30.8%) | 0 (0.0%) |
| $800 to $1,499 | 9 (34.6%) | 0 (0.0%) |
| $800 to $1,499 | 9 (34.6%) | 5 (35.7%) |
| Total | 26 (100.0%) | 14 (100.0%) |
Health & Disability in Alder
Health Insurance Coverage by Age in Alder
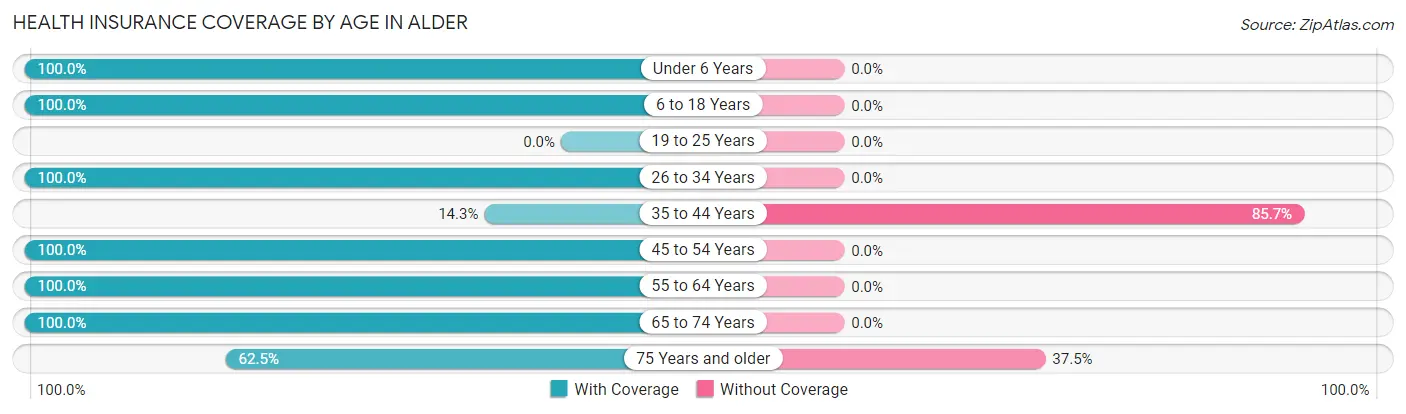
| Age Bracket | With Coverage | Without Coverage |
| Under 6 Years | 4 (100.0%) | 0 (0.0%) |
| 6 to 18 Years | 10 (100.0%) | 0 (0.0%) |
| 19 to 25 Years | 0 (0.0%) | 0 (0.0%) |
| 26 to 34 Years | 5 (100.0%) | 0 (0.0%) |
| 35 to 44 Years | 2 (14.3%) | 12 (85.7%) |
| 45 to 54 Years | 16 (100.0%) | 0 (0.0%) |
| 55 to 64 Years | 21 (100.0%) | 0 (0.0%) |
| 65 to 74 Years | 22 (100.0%) | 0 (0.0%) |
| 75 Years and older | 10 (62.5%) | 6 (37.5%) |
| Total | 90 (83.3%) | 18 (16.7%) |
Health Insurance Coverage by Citizenship Status in Alder
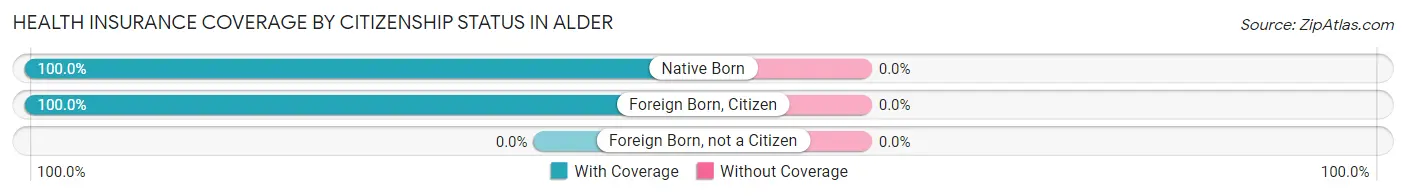
| Citizenship Status | With Coverage | Without Coverage |
| Native Born | 4 (100.0%) | 0 (0.0%) |
| Foreign Born, Citizen | 10 (100.0%) | 0 (0.0%) |
| Foreign Born, not a Citizen | 0 (0.0%) | 0 (0.0%) |
Health Insurance Coverage by Household Income in Alder
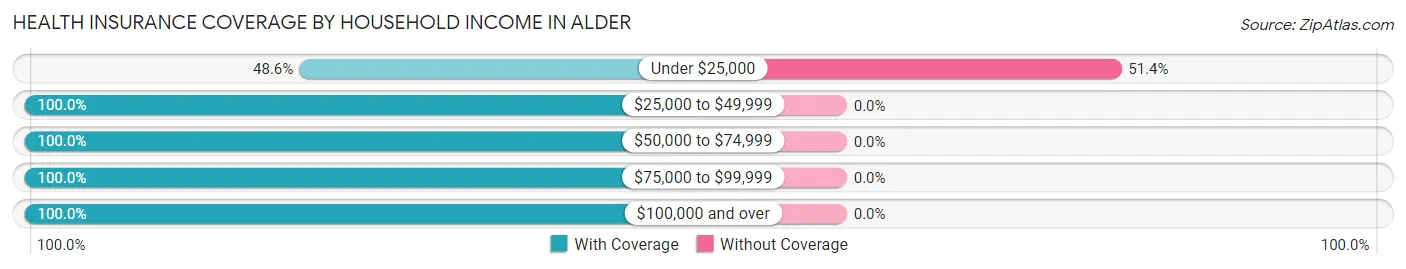
| Household Income | With Coverage | Without Coverage |
| Under $25,000 | 17 (48.6%) | 18 (51.4%) |
| $25,000 to $49,999 | 37 (100.0%) | 0 (0.0%) |
| $50,000 to $74,999 | 6 (100.0%) | 0 (0.0%) |
| $75,000 to $99,999 | 6 (100.0%) | 0 (0.0%) |
| $100,000 and over | 24 (100.0%) | 0 (0.0%) |
Public vs Private Health Insurance Coverage by Age in Alder
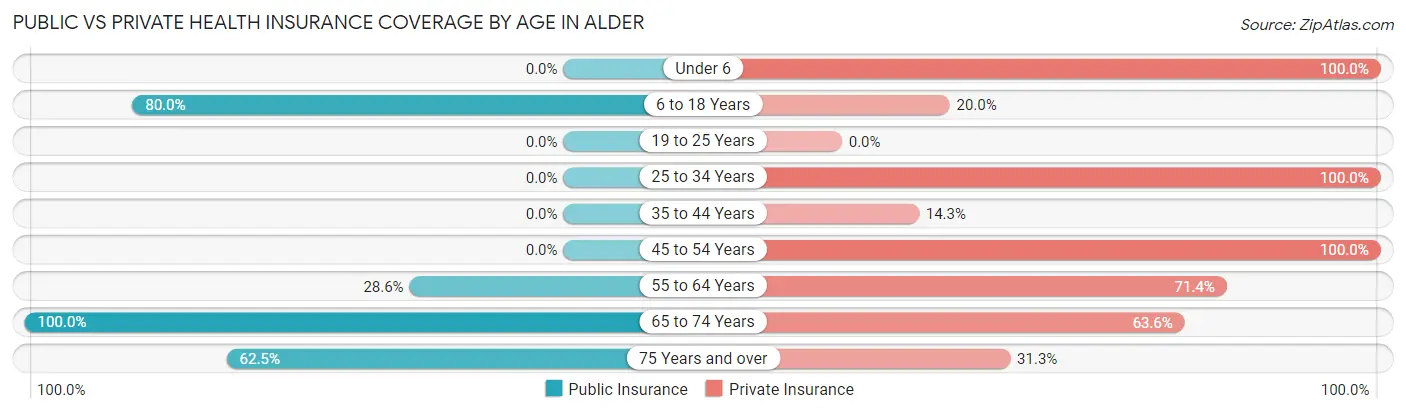
| Age Bracket | Public Insurance | Private Insurance |
| Under 6 | 0 (0.0%) | 4 (100.0%) |
| 6 to 18 Years | 8 (80.0%) | 2 (20.0%) |
| 19 to 25 Years | 0 (0.0%) | 0 (0.0%) |
| 25 to 34 Years | 0 (0.0%) | 5 (100.0%) |
| 35 to 44 Years | 0 (0.0%) | 2 (14.3%) |
| 45 to 54 Years | 0 (0.0%) | 16 (100.0%) |
| 55 to 64 Years | 6 (28.6%) | 15 (71.4%) |
| 65 to 74 Years | 22 (100.0%) | 14 (63.6%) |
| 75 Years and over | 10 (62.5%) | 5 (31.2%) |
| Total | 46 (42.6%) | 63 (58.3%) |
Disability Status by Sex by Age in Alder
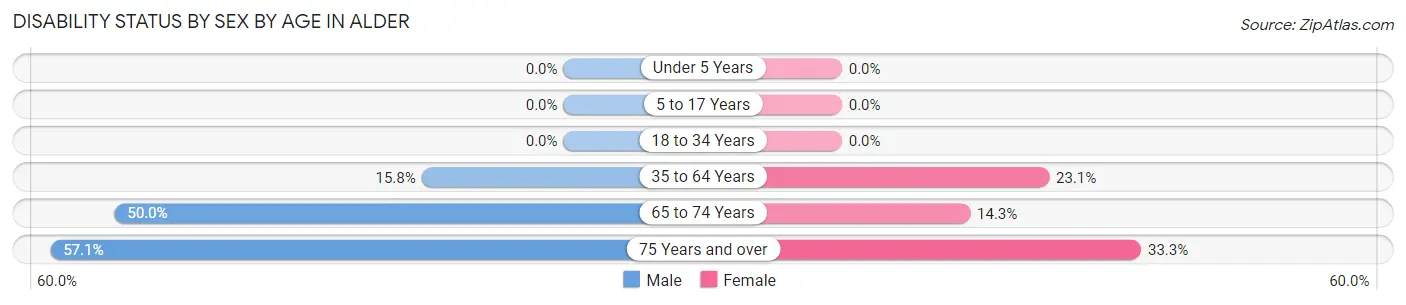
| Age Bracket | Male | Female |
| Under 5 Years | 0 (0.0%) | 0 (0.0%) |
| 5 to 17 Years | 0 (0.0%) | 0 (0.0%) |
| 18 to 34 Years | 0 (0.0%) | 0 (0.0%) |
| 35 to 64 Years | 6 (15.8%) | 3 (23.1%) |
| 65 to 74 Years | 4 (50.0%) | 2 (14.3%) |
| 75 Years and over | 4 (57.1%) | 3 (33.3%) |
Disability Class by Sex by Age in Alder
Disability Class: Hearing Difficulty
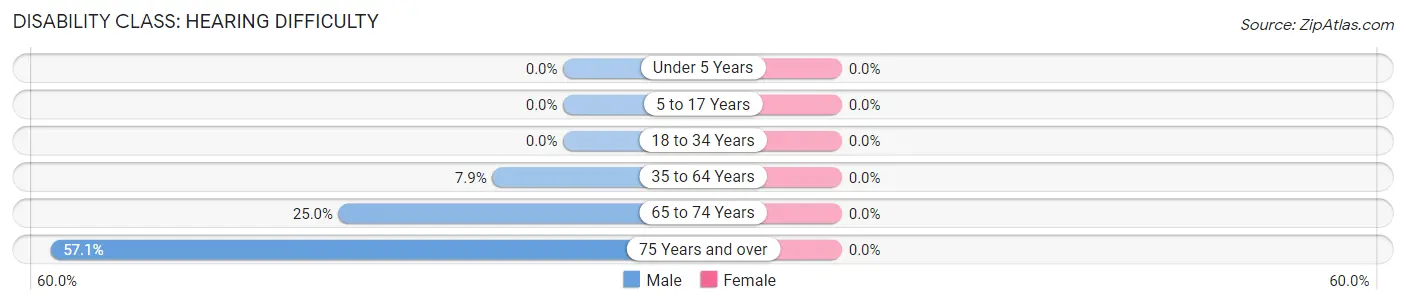
| Age Bracket | Male | Female |
| Under 5 Years | 0 (0.0%) | 0 (0.0%) |
| 5 to 17 Years | 0 (0.0%) | 0 (0.0%) |
| 18 to 34 Years | 0 (0.0%) | 0 (0.0%) |
| 35 to 64 Years | 3 (7.9%) | 0 (0.0%) |
| 65 to 74 Years | 2 (25.0%) | 0 (0.0%) |
| 75 Years and over | 4 (57.1%) | 0 (0.0%) |
Disability Class: Vision Difficulty
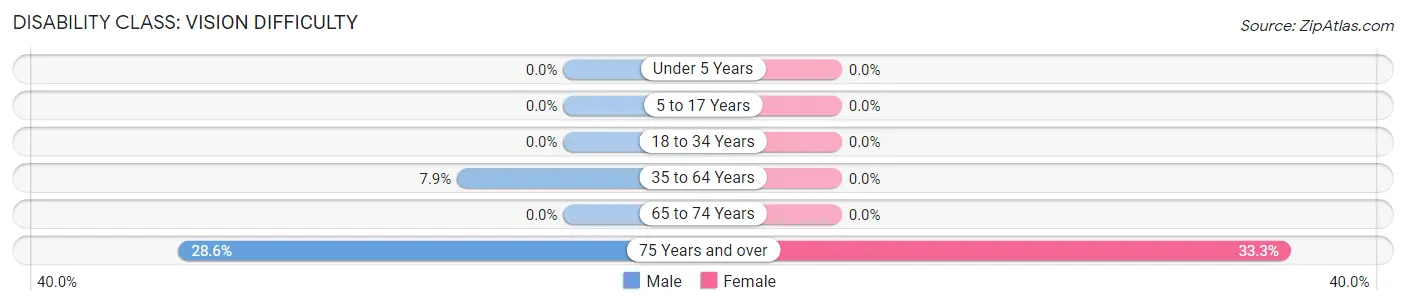
| Age Bracket | Male | Female |
| Under 5 Years | 0 (0.0%) | 0 (0.0%) |
| 5 to 17 Years | 0 (0.0%) | 0 (0.0%) |
| 18 to 34 Years | 0 (0.0%) | 0 (0.0%) |
| 35 to 64 Years | 3 (7.9%) | 0 (0.0%) |
| 65 to 74 Years | 0 (0.0%) | 0 (0.0%) |
| 75 Years and over | 2 (28.6%) | 3 (33.3%) |
Disability Class: Cognitive Difficulty
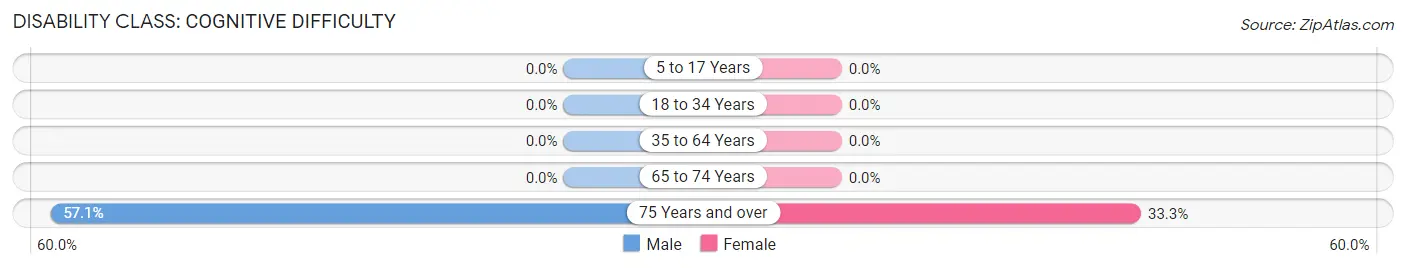
| Age Bracket | Male | Female |
| 5 to 17 Years | 0 (0.0%) | 0 (0.0%) |
| 18 to 34 Years | 0 (0.0%) | 0 (0.0%) |
| 35 to 64 Years | 0 (0.0%) | 0 (0.0%) |
| 65 to 74 Years | 0 (0.0%) | 0 (0.0%) |
| 75 Years and over | 4 (57.1%) | 3 (33.3%) |
Disability Class: Ambulatory Difficulty
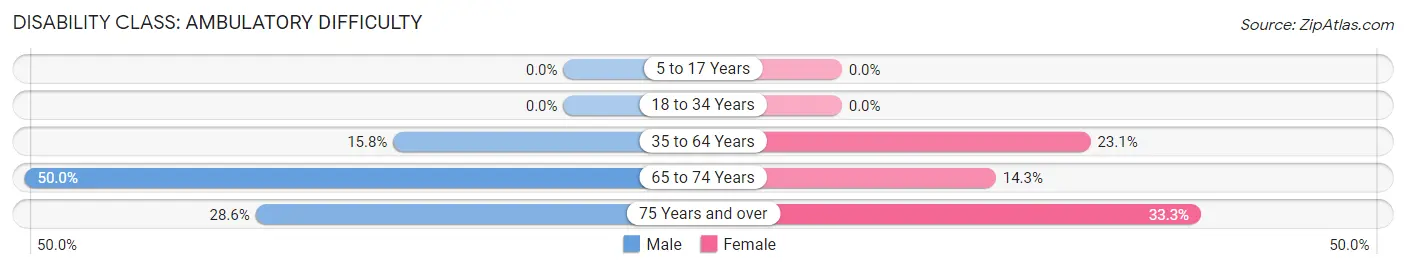
| Age Bracket | Male | Female |
| 5 to 17 Years | 0 (0.0%) | 0 (0.0%) |
| 18 to 34 Years | 0 (0.0%) | 0 (0.0%) |
| 35 to 64 Years | 6 (15.8%) | 3 (23.1%) |
| 65 to 74 Years | 4 (50.0%) | 2 (14.3%) |
| 75 Years and over | 2 (28.6%) | 3 (33.3%) |
Disability Class: Self-Care Difficulty
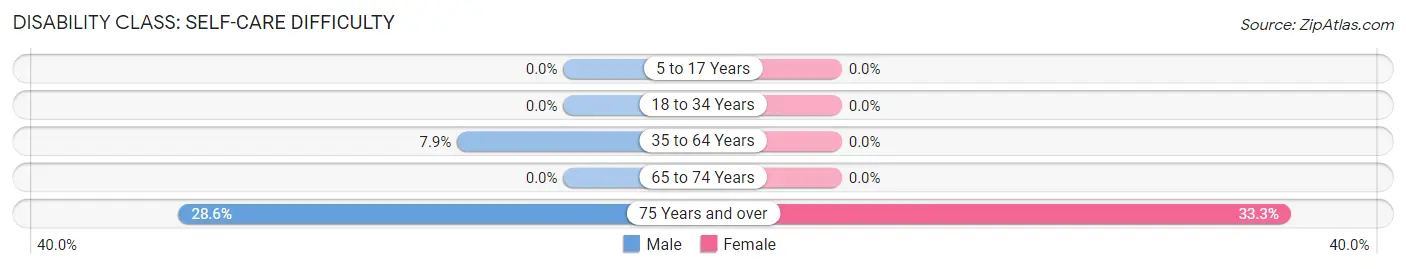
| Age Bracket | Male | Female |
| 5 to 17 Years | 0 (0.0%) | 0 (0.0%) |
| 18 to 34 Years | 0 (0.0%) | 0 (0.0%) |
| 35 to 64 Years | 3 (7.9%) | 0 (0.0%) |
| 65 to 74 Years | 0 (0.0%) | 0 (0.0%) |
| 75 Years and over | 2 (28.6%) | 3 (33.3%) |
Technology Access in Alder
Computing Device Access in Alder
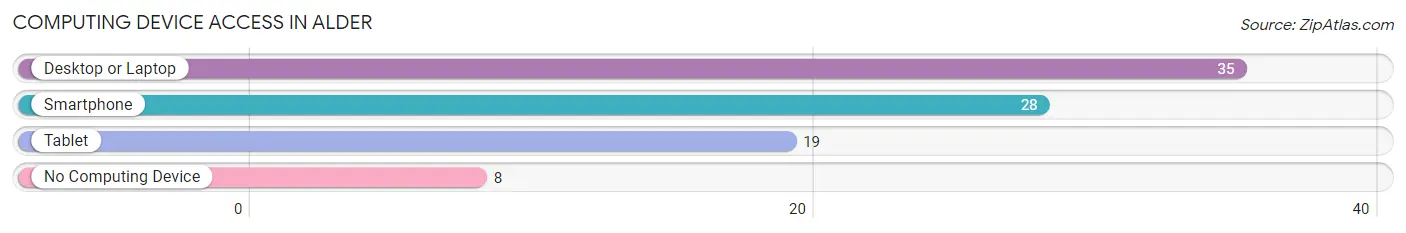
| Device Type | # Households | % Households |
| Desktop or Laptop | 35 | 67.3% |
| Smartphone | 28 | 53.8% |
| Tablet | 19 | 36.5% |
| No Computing Device | 8 | 15.4% |
| Total | 52 | 100.0% |
Internet Access in Alder
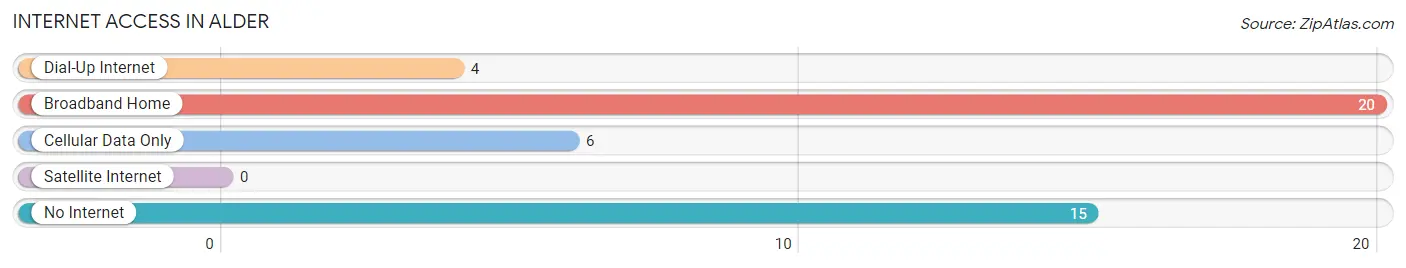
| Internet Type | # Households | % Households |
| Dial-Up Internet | 4 | 7.7% |
| Broadband Home | 20 | 38.5% |
| Cellular Data Only | 6 | 11.5% |
| Satellite Internet | 0 | 0.0% |
| No Internet | 15 | 28.8% |
| Total | 52 | 100.0% |
Alder Summary
Alder, Montana is a small town located in Madison County, Montana. It is situated in the southwestern part of the state, approximately 20 miles south of the city of Bozeman. The town was founded in 1883 and has a population of approximately 500 people.
Alder is located in the Madison Valley, which is a long, narrow valley that runs from the Madison River in the north to the Tobacco Root Mountains in the south. The valley is surrounded by the Madison Range to the east and the Gravelly Range to the west. The town is situated at an elevation of 4,890 feet and is surrounded by rolling hills and grasslands.
The economy of Alder is largely based on agriculture and ranching. The town is home to several large ranches, including the historic Alder Ranch, which has been in operation since the late 1800s. The town also has a small manufacturing sector, with several small businesses producing a variety of products, including furniture, clothing, and leather goods.
The demographics of Alder are largely white, with a small Hispanic population. The median household income is approximately $45,000, and the median age is 44. The town is served by the Madison County School District, which includes two elementary schools, one middle school, and one high school.
Alder is a small, rural town with a rich history and a strong sense of community. The town is home to several historic buildings, including the Alder Hotel, which was built in 1883 and is listed on the National Register of Historic Places. The town also has a number of parks and recreational areas, including the Alder Recreation Area, which offers camping, fishing, and hiking opportunities.
Alder is a great place to live and work, with a strong sense of community and a variety of recreational activities. The town is a great place to raise a family, with a low cost of living and a safe, friendly environment. With its rich history and strong sense of community, Alder is a great place to call home.
Common Questions
What is the Total Population of Alder?
Total Population of Alder is 108.
What is the Total Male Population of Alder?
Total Male Population of Alder is 60.
What is the Total Female Population of Alder?
Total Female Population of Alder is 48.
What is the Ratio of Males per 100 Females in Alder?
There are 125.00 Males per 100 Females in Alder.
What is the Ratio of Females per 100 Males in Alder?
There are 80.00 Females per 100 Males in Alder.
What is the Median Population Age in Alder?
Median Population Age in Alder is 56.7 Years.
What is the Average Family Size in Alder
Average Family Size in Alder is 2.8 People.
What is the Average Household Size in Alder
Average Household Size in Alder is 2.1 People.
What is Per Capita Income in Alder?
Per Capita income in Alder is $26,358.
What is the Median Household income in Alder?
Median Household Income in Alder is $36,429.
What is Inequality or Gini Index in Alder?
Inequality or Gini Index in Alder is 0.43.
How Large is the Labor Force in Alder?
There are 57 People in the Labor Forcein in Alder.
What is the Percentage of People in the Labor Force in Alder?
60.6% of People are in the Labor Force in Alder.