Zip Codes with the Highest Percentage of Population Employed in Office & Administration in Jackson, MS
RELATED REPORTS & OPTIONS
Office & Administration
Jackson
Compare Zip Codes
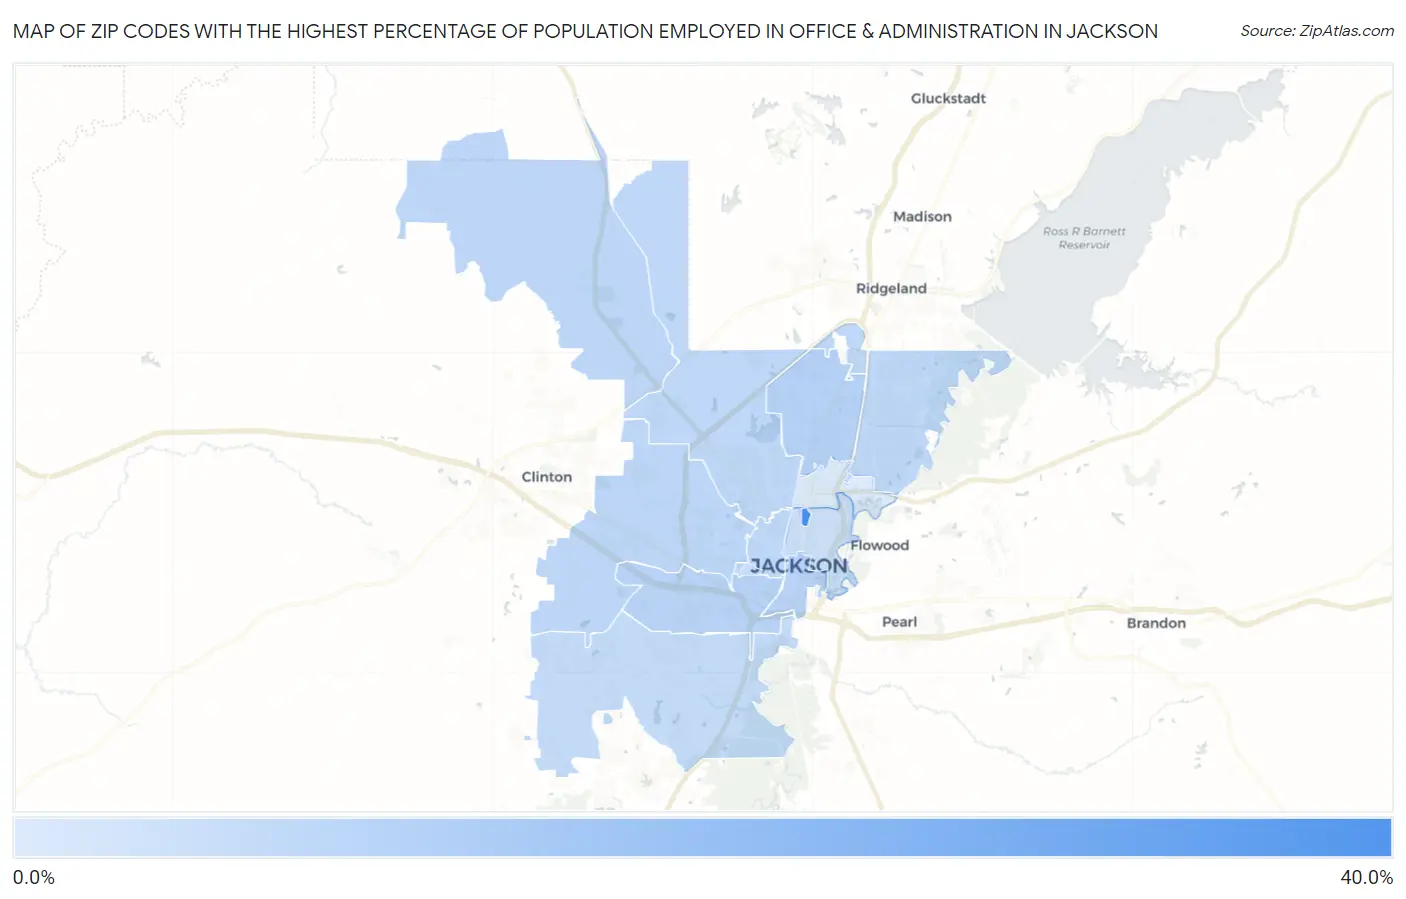
Map of Zip Codes with the Highest Percentage of Population Employed in Office & Administration in Jackson
4.4%
39.7%
Zip Codes with the Highest Percentage of Population Employed in Office & Administration in Jackson, MS
| Zip Code | % Employed | vs State | vs National | |
| 1. | 39210 | 39.7% | 10.8%(+28.9)#5 | 10.9%(+28.8)#273 |
| 2. | 39206 | 12.9% | 10.8%(+2.15)#112 | 10.9%(+2.04)#8,315 |
| 3. | 39204 | 12.3% | 10.8%(+1.57)#126 | 10.9%(+1.47)#9,785 |
| 4. | 39201 | 12.2% | 10.8%(+1.43)#130 | 10.9%(+1.33)#10,194 |
| 5. | 39209 | 11.2% | 10.8%(+0.488)#167 | 10.9%(+0.384)#13,079 |
| 6. | 39213 | 10.9% | 10.8%(+0.137)#175 | 10.9%(+0.033)#14,220 |
| 7. | 39211 | 10.6% | 10.8%(-0.135)#184 | 10.9%(-0.238)#15,062 |
| 8. | 39203 | 10.6% | 10.8%(-0.165)#186 | 10.9%(-0.268)#15,170 |
| 9. | 39212 | 9.5% | 10.8%(-1.21)#227 | 10.9%(-1.31)#18,592 |
| 10. | 39217 | 9.1% | 10.8%(-1.66)#247 | 10.9%(-1.77)#19,976 |
| 11. | 39202 | 7.7% | 10.8%(-3.03)#293 | 10.9%(-3.14)#23,652 |
| 12. | 39216 | 4.4% | 10.8%(-6.36)#357 | 10.9%(-6.46)#28,663 |
1
Common Questions
What are the Top 10 Zip Codes with the Highest Percentage of Population Employed in Office & Administration in Jackson, MS?
Top 10 Zip Codes with the Highest Percentage of Population Employed in Office & Administration in Jackson, MS are:
What zip code has the Highest Percentage of Population Employed in Office & Administration in Jackson, MS?
39210 has the Highest Percentage of Population Employed in Office & Administration in Jackson, MS with 39.7%.
What is the Percentage of Population Employed in Office & Administration in Jackson, MS?
Percentage of Population Employed in Office & Administration in Jackson is 10.6%.
What is the Percentage of Population Employed in Office & Administration in Mississippi?
Percentage of Population Employed in Office & Administration in Mississippi is 10.8%.
What is the Percentage of Population Employed in Office & Administration in the United States?
Percentage of Population Employed in Office & Administration in the United States is 10.9%.