Zip Codes with the Highest Percentage of Population Employed in Farming, Fishing & Forestry in Redford, MI
RELATED REPORTS & OPTIONS
Farming, Fishing & Forestry
Redford
Compare Zip Codes
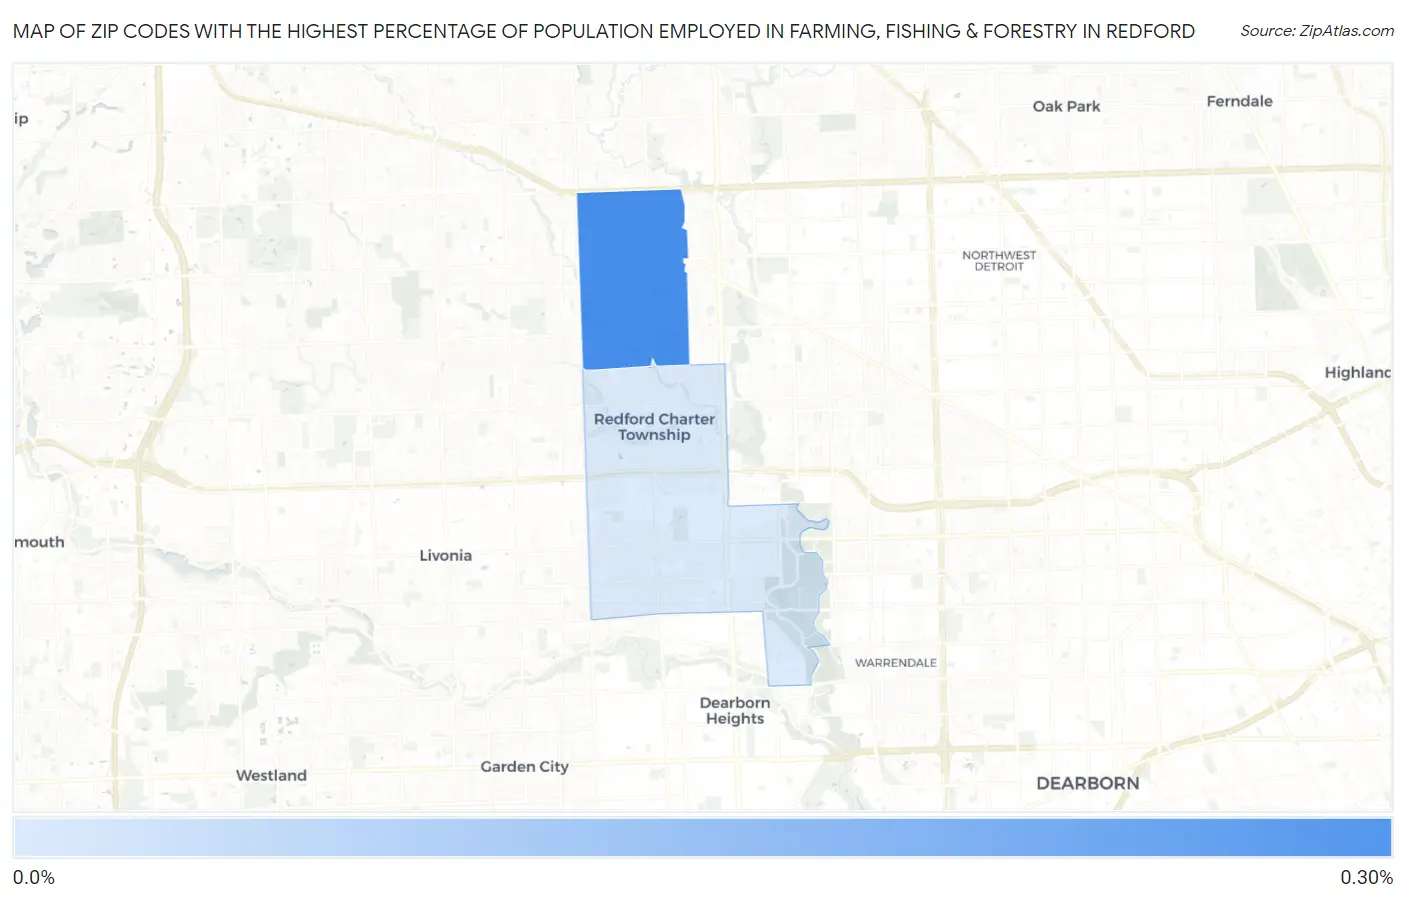
Map of Zip Codes with the Highest Percentage of Population Employed in Farming, Fishing & Forestry in Redford
0.0%
0.30%
Zip Codes with the Highest Percentage of Population Employed in Farming, Fishing & Forestry in Redford, MI
| Zip Code | % Employed | vs State | vs National | |
| 1. | 48240 | 0.27% | 0.47%(-0.198)#527 | 0.61%(-0.337)#15,188 |
| 2. | 48239 | 0.049% | 0.47%(-0.418)#668 | 0.61%(-0.557)#18,688 |
1
Common Questions
What are the Top Zip Codes with the Highest Percentage of Population Employed in Farming, Fishing & Forestry in Redford, MI?
Top Zip Codes with the Highest Percentage of Population Employed in Farming, Fishing & Forestry in Redford, MI are:
What zip code has the Highest Percentage of Population Employed in Farming, Fishing & Forestry in Redford, MI?
48240 has the Highest Percentage of Population Employed in Farming, Fishing & Forestry in Redford, MI with 0.27%.
What is the Percentage of Population Employed in Farming, Fishing & Forestry in Michigan?
Percentage of Population Employed in Farming, Fishing & Forestry in Michigan is 0.47%.
What is the Percentage of Population Employed in Farming, Fishing & Forestry in the United States?
Percentage of Population Employed in Farming, Fishing & Forestry in the United States is 0.61%.