Zip Codes with the Highest Percentage of Households Heated by Bottled Gas / Liquid Propane in Jackson, MI
RELATED REPORTS & OPTIONS
Bottled Gas / LP Heating
Jackson
Compare Zip Codes
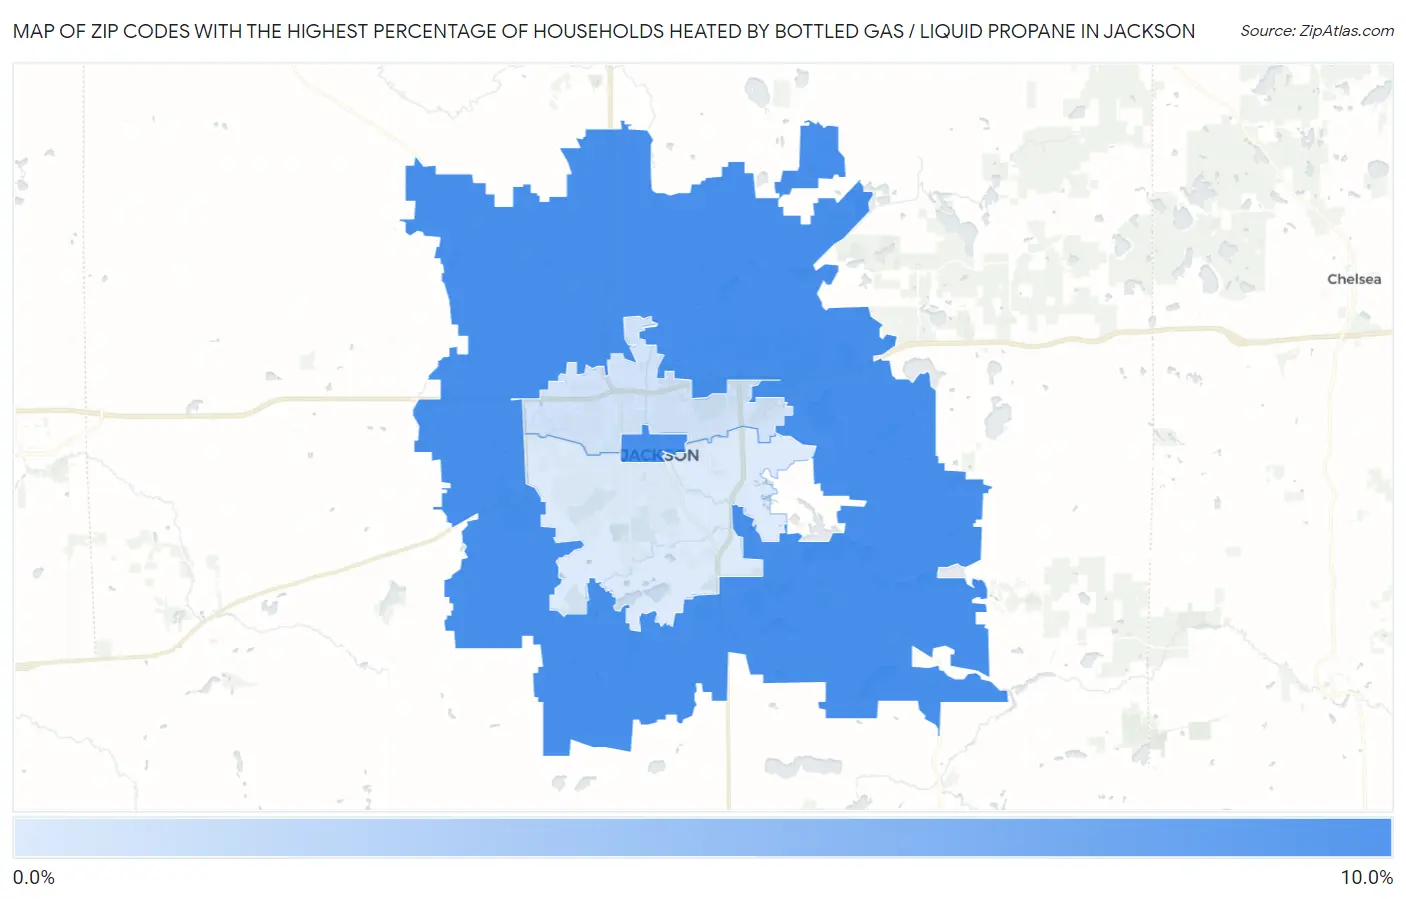
Map of Zip Codes with the Highest Percentage of Households Heated by Bottled Gas / Liquid Propane in Jackson
0.0%
10.0%
Zip Codes with the Highest Percentage of Households Heated by Bottled Gas / Liquid Propane in Jackson, MI
| Zip Code | Bottled Gas / LP Heating | vs State | vs National | |
| 1. | 49201 | 9.5% | 8.5%(+1.000)#611 | 4.9%(+4.60)#14,791 |
| 2. | 49202 | 1.6% | 8.5%(-6.90)#779 | 4.9%(-3.30)#24,460 |
| 3. | 49203 | 1.0% | 8.5%(-7.50)#861 | 4.9%(-3.90)#26,604 |
1
Common Questions
What are the Top Zip Codes with the Highest Percentage of Households Heated by Bottled Gas / Liquid Propane in Jackson, MI?
Top Zip Codes with the Highest Percentage of Households Heated by Bottled Gas / Liquid Propane in Jackson, MI are:
What zip code has the Highest Percentage of Households Heated by Bottled Gas / Liquid Propane in Jackson, MI?
49201 has the Highest Percentage of Households Heated by Bottled Gas / Liquid Propane in Jackson, MI with 9.5%.
What is the Percentage of Households Heated by Bottled Gas / Liquid Propane in Jackson, MI?
Percentage of Households Heated by Bottled Gas / Liquid Propane in Jackson is 1.6%.
What is the Percentage of Households Heated by Bottled Gas / Liquid Propane in Michigan?
Percentage of Households Heated by Bottled Gas / Liquid Propane in Michigan is 8.5%.
What is the Percentage of Households Heated by Bottled Gas / Liquid Propane in the United States?
Percentage of Households Heated by Bottled Gas / Liquid Propane in the United States is 4.9%.