Zip Codes with the Highest Percentage of Population Employed in Agriculture, Fishing & Hunting in Dearborn Heights, MI
RELATED REPORTS & OPTIONS
Agriculture, Fishing & Hunting
Dearborn Heights
Compare Zip Codes
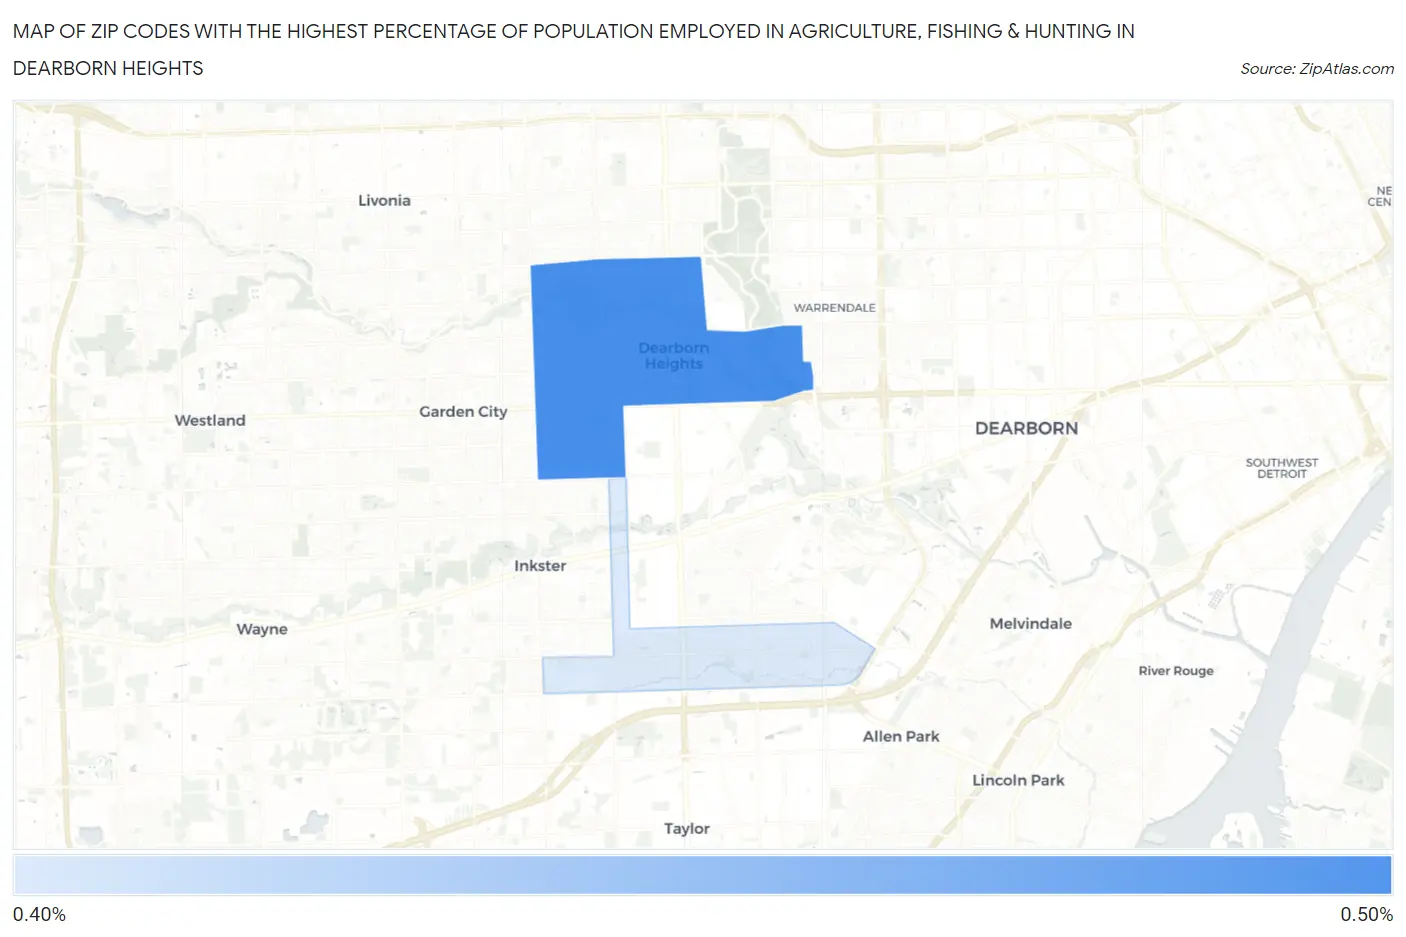
Map of Zip Codes with the Highest Percentage of Population Employed in Agriculture, Fishing & Hunting in Dearborn Heights
0.0%
0.50%
Zip Codes with the Highest Percentage of Population Employed in Agriculture, Fishing & Hunting in Dearborn Heights, MI
| Zip Code | % Employed | vs State | vs National | |
| 1. | 48127 | 0.43% | 0.98%(-0.554)#660 | 1.2%(-0.769)#19,901 |
| 2. | 48125 | 0.41% | 0.98%(-0.573)#662 | 1.2%(-0.789)#20,051 |
1
Common Questions
What are the Top Zip Codes with the Highest Percentage of Population Employed in Agriculture, Fishing & Hunting in Dearborn Heights, MI?
Top Zip Codes with the Highest Percentage of Population Employed in Agriculture, Fishing & Hunting in Dearborn Heights, MI are:
What zip code has the Highest Percentage of Population Employed in Agriculture, Fishing & Hunting in Dearborn Heights, MI?
48127 has the Highest Percentage of Population Employed in Agriculture, Fishing & Hunting in Dearborn Heights, MI with 0.43%.
What is the Percentage of Population Employed in Agriculture, Fishing & Hunting in Dearborn Heights, MI?
Percentage of Population Employed in Agriculture, Fishing & Hunting in Dearborn Heights is 0.42%.
What is the Percentage of Population Employed in Agriculture, Fishing & Hunting in Michigan?
Percentage of Population Employed in Agriculture, Fishing & Hunting in Michigan is 0.98%.
What is the Percentage of Population Employed in Agriculture, Fishing & Hunting in the United States?
Percentage of Population Employed in Agriculture, Fishing & Hunting in the United States is 1.2%.