Zip Codes with the Highest Percentage of Population Employed in Agriculture, Fishing & Hunting in Clinton Township, MI
RELATED REPORTS & OPTIONS
Agriculture, Fishing & Hunting
Clinton Township
Compare Zip Codes
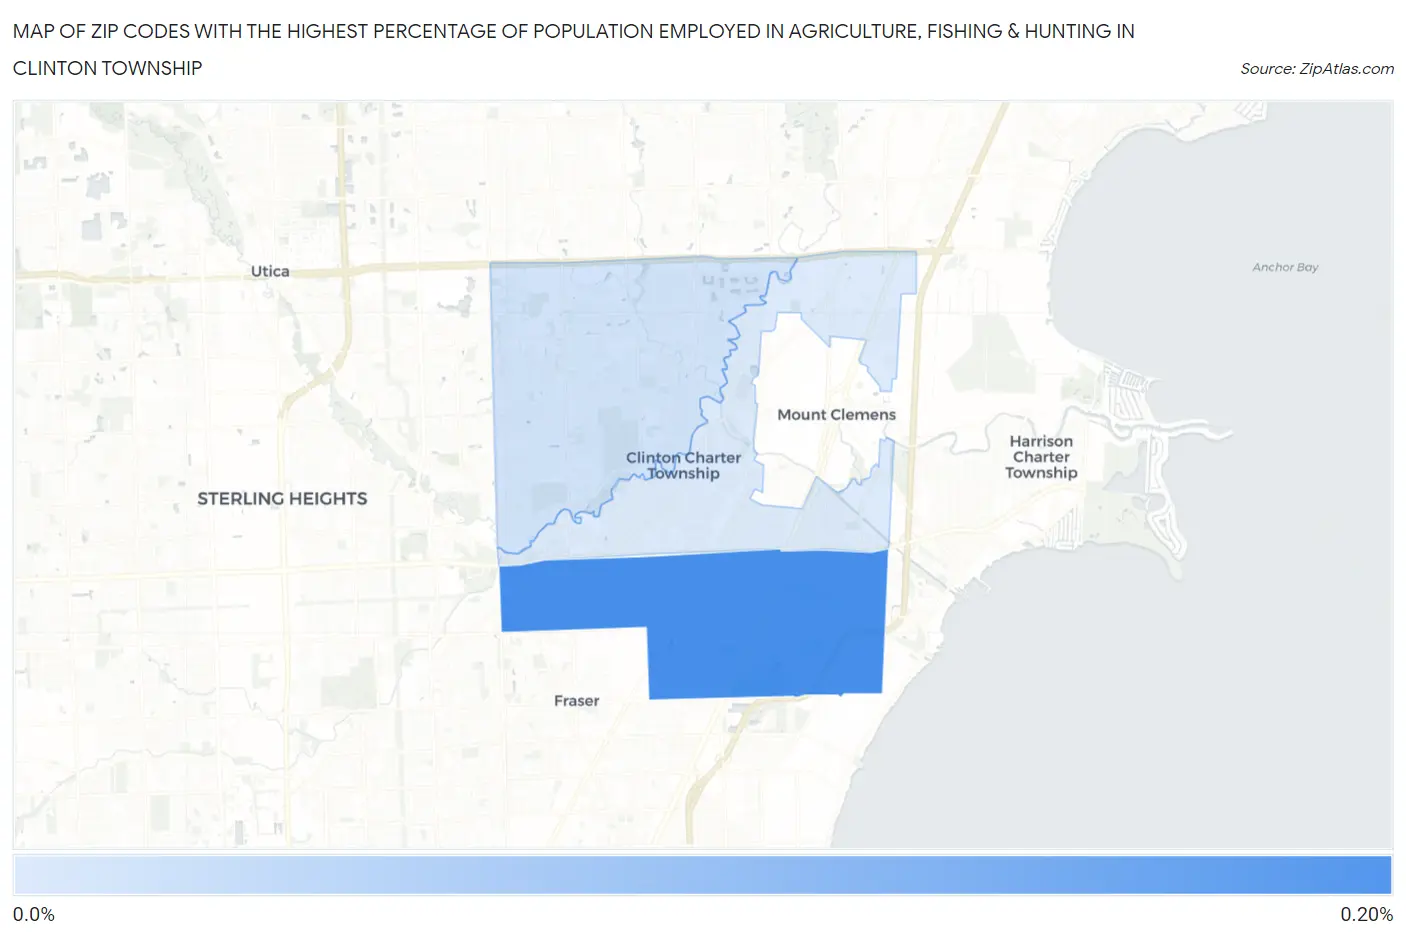
Map of Zip Codes with the Highest Percentage of Population Employed in Agriculture, Fishing & Hunting in Clinton Township
0.0%
0.20%
Zip Codes with the Highest Percentage of Population Employed in Agriculture, Fishing & Hunting in Clinton Township, MI
| Zip Code | % Employed | vs State | vs National | |
| 1. | 48035 | 0.17% | 0.98%(-0.816)#757 | 1.2%(-1.03)#22,758 |
| 2. | 48038 | 0.021% | 0.98%(-0.963)#816 | 1.2%(-1.18)#24,570 |
| 3. | 48036 | 0.010% | 0.98%(-0.974)#817 | 1.2%(-1.19)#24,621 |
1
Common Questions
What are the Top Zip Codes with the Highest Percentage of Population Employed in Agriculture, Fishing & Hunting in Clinton Township, MI?
Top Zip Codes with the Highest Percentage of Population Employed in Agriculture, Fishing & Hunting in Clinton Township, MI are:
What zip code has the Highest Percentage of Population Employed in Agriculture, Fishing & Hunting in Clinton Township, MI?
48035 has the Highest Percentage of Population Employed in Agriculture, Fishing & Hunting in Clinton Township, MI with 0.17%.
What is the Percentage of Population Employed in Agriculture, Fishing & Hunting in Michigan?
Percentage of Population Employed in Agriculture, Fishing & Hunting in Michigan is 0.98%.
What is the Percentage of Population Employed in Agriculture, Fishing & Hunting in the United States?
Percentage of Population Employed in Agriculture, Fishing & Hunting in the United States is 1.2%.