Zip Codes with the Highest Percentage of Population Employed in Food Preparation & Serving in Waltham, MA
RELATED REPORTS & OPTIONS
Food Preparation & Serving
Waltham
Compare Zip Codes
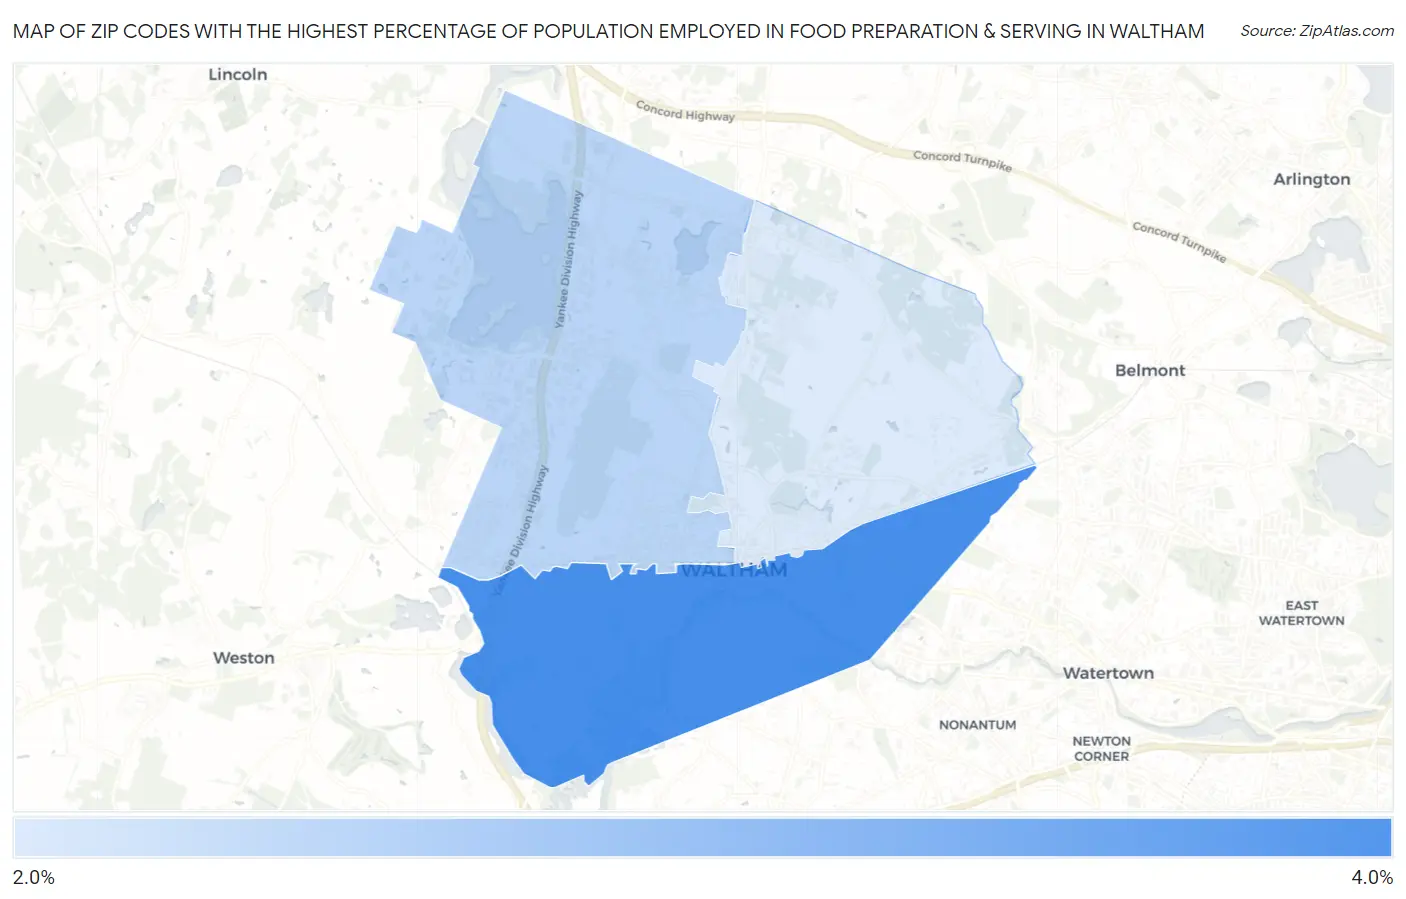
Map of Zip Codes with the Highest Percentage of Population Employed in Food Preparation & Serving in Waltham
2.7%
3.9%
Zip Codes with the Highest Percentage of Population Employed in Food Preparation & Serving in Waltham, MA
| Zip Code | % Employed | vs State | vs National | |
| 1. | 02453 | 3.9% | 4.6%(-0.737)#269 | 5.3%(-1.41)#17,652 |
| 2. | 02451 | 3.0% | 4.6%(-1.62)#331 | 5.3%(-2.30)#21,289 |
| 3. | 02452 | 2.7% | 4.6%(-1.87)#355 | 5.3%(-2.55)#22,297 |
1
Common Questions
What are the Top Zip Codes with the Highest Percentage of Population Employed in Food Preparation & Serving in Waltham, MA?
Top Zip Codes with the Highest Percentage of Population Employed in Food Preparation & Serving in Waltham, MA are:
What zip code has the Highest Percentage of Population Employed in Food Preparation & Serving in Waltham, MA?
02453 has the Highest Percentage of Population Employed in Food Preparation & Serving in Waltham, MA with 3.9%.
What is the Percentage of Population Employed in Food Preparation & Serving in Waltham, MA?
Percentage of Population Employed in Food Preparation & Serving in Waltham is 3.4%.
What is the Percentage of Population Employed in Food Preparation & Serving in Massachusetts?
Percentage of Population Employed in Food Preparation & Serving in Massachusetts is 4.6%.
What is the Percentage of Population Employed in Food Preparation & Serving in the United States?
Percentage of Population Employed in Food Preparation & Serving in the United States is 5.3%.