Zip Codes with the Highest Percentage of Population Employed in Food Preparation & Serving in Somerset, MA
RELATED REPORTS & OPTIONS
Food Preparation & Serving
Somerset
Compare Zip Codes
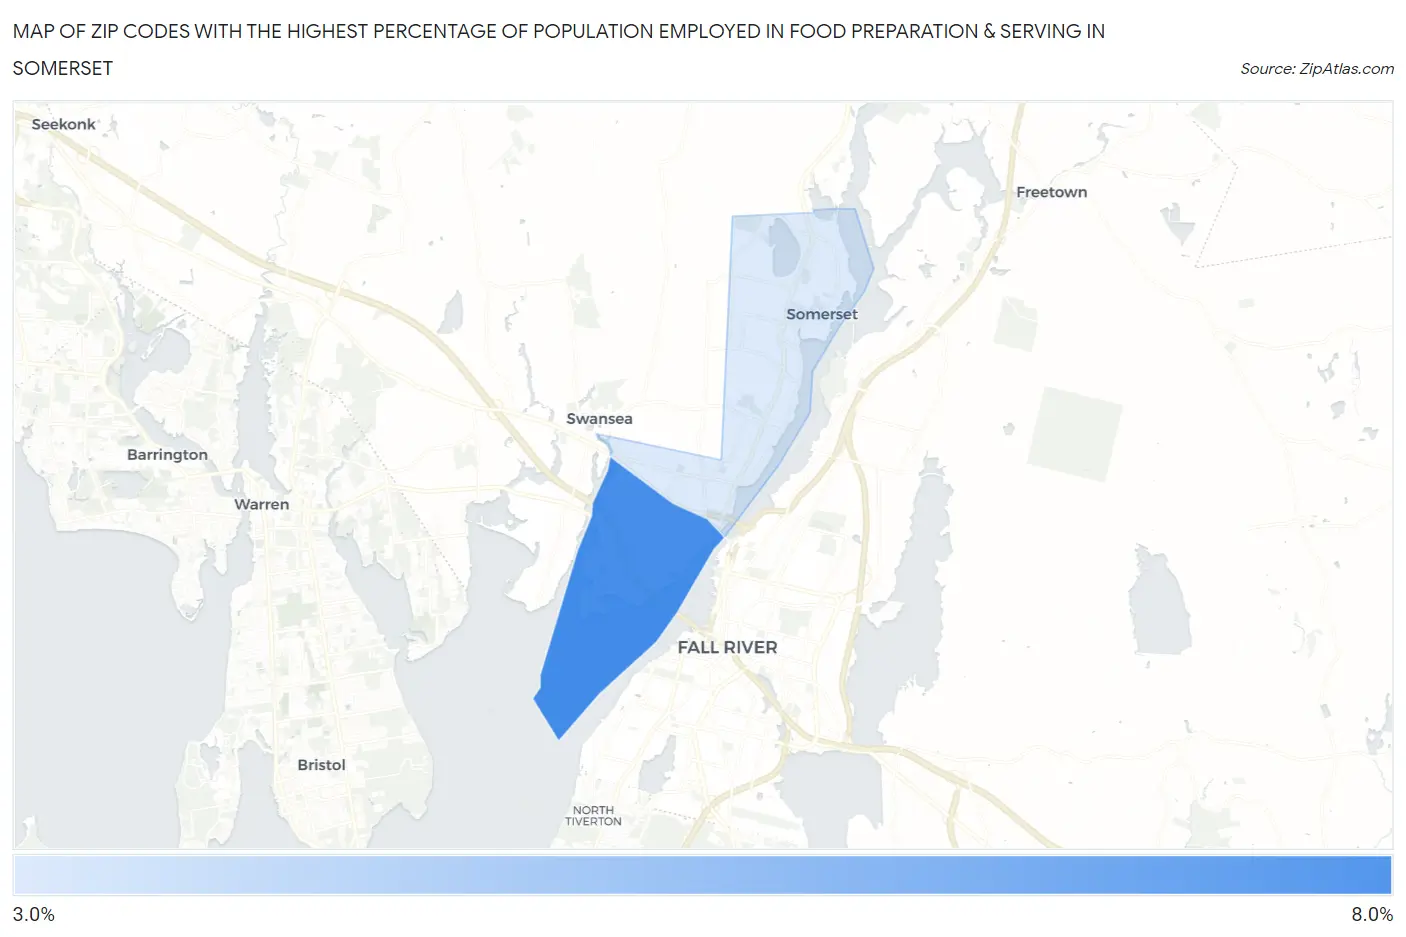
Map of Zip Codes with the Highest Percentage of Population Employed in Food Preparation & Serving in Somerset
3.0%
7.9%
Zip Codes with the Highest Percentage of Population Employed in Food Preparation & Serving in Somerset, MA
| Zip Code | % Employed | vs State | vs National | |
| 1. | 02725 | 7.9% | 4.6%(+3.32)#48 | 5.3%(+2.64)#4,847 |
| 2. | 02726 | 3.0% | 4.6%(-1.58)#329 | 5.3%(-2.26)#21,159 |
1
Common Questions
What are the Top Zip Codes with the Highest Percentage of Population Employed in Food Preparation & Serving in Somerset, MA?
Top Zip Codes with the Highest Percentage of Population Employed in Food Preparation & Serving in Somerset, MA are:
What zip code has the Highest Percentage of Population Employed in Food Preparation & Serving in Somerset, MA?
02725 has the Highest Percentage of Population Employed in Food Preparation & Serving in Somerset, MA with 7.9%.
What is the Percentage of Population Employed in Food Preparation & Serving in Somerset, MA?
Percentage of Population Employed in Food Preparation & Serving in Somerset is 3.7%.
What is the Percentage of Population Employed in Food Preparation & Serving in Massachusetts?
Percentage of Population Employed in Food Preparation & Serving in Massachusetts is 4.6%.
What is the Percentage of Population Employed in Food Preparation & Serving in the United States?
Percentage of Population Employed in Food Preparation & Serving in the United States is 5.3%.