Zip Codes with the Highest Percentage of Population Employed in Food Preparation & Serving in Brockton, MA
RELATED REPORTS & OPTIONS
Food Preparation & Serving
Brockton
Compare Zip Codes
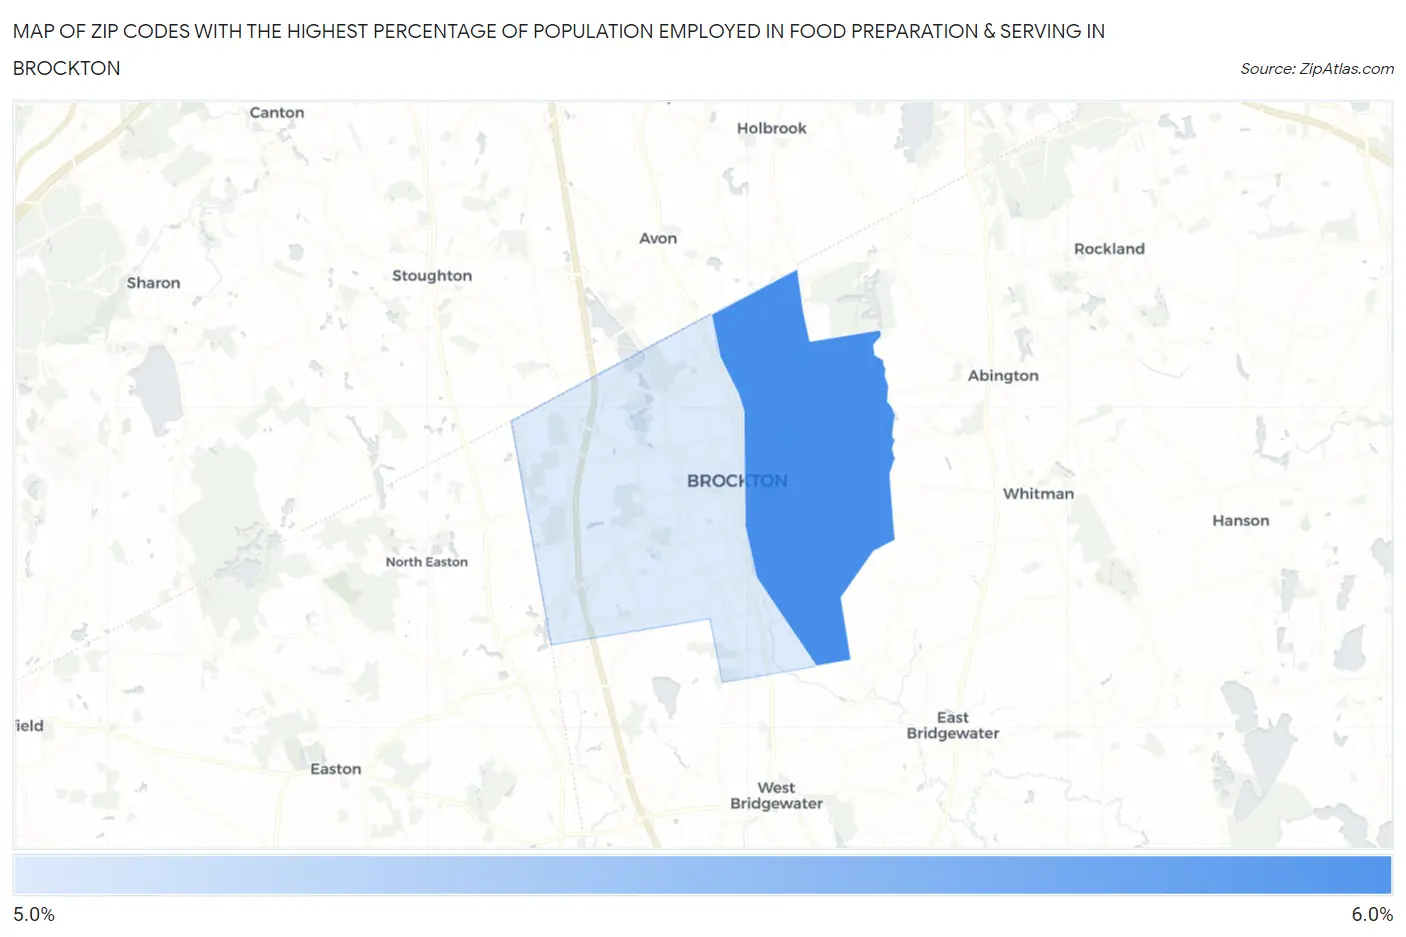
Map of Zip Codes with the Highest Percentage of Population Employed in Food Preparation & Serving in Brockton
5.1%
5.5%
Zip Codes with the Highest Percentage of Population Employed in Food Preparation & Serving in Brockton, MA
| Zip Code | % Employed | vs State | vs National | |
| 1. | 02302 | 5.5% | 4.6%(+0.909)#143 | 5.3%(+0.234)#10,999 |
| 2. | 02301 | 5.1% | 4.6%(+0.537)#166 | 5.3%(-0.139)#12,374 |
1
Common Questions
What are the Top Zip Codes with the Highest Percentage of Population Employed in Food Preparation & Serving in Brockton, MA?
Top Zip Codes with the Highest Percentage of Population Employed in Food Preparation & Serving in Brockton, MA are:
What zip code has the Highest Percentage of Population Employed in Food Preparation & Serving in Brockton, MA?
02302 has the Highest Percentage of Population Employed in Food Preparation & Serving in Brockton, MA with 5.5%.
What is the Percentage of Population Employed in Food Preparation & Serving in Brockton, MA?
Percentage of Population Employed in Food Preparation & Serving in Brockton is 5.3%.
What is the Percentage of Population Employed in Food Preparation & Serving in Massachusetts?
Percentage of Population Employed in Food Preparation & Serving in Massachusetts is 4.6%.
What is the Percentage of Population Employed in Food Preparation & Serving in the United States?
Percentage of Population Employed in Food Preparation & Serving in the United States is 5.3%.