Zip Codes with the Highest Percentage of Population Employed in Farming, Fishing & Forestry in Fall River, MA
RELATED REPORTS & OPTIONS
Farming, Fishing & Forestry
Fall River
Compare Zip Codes
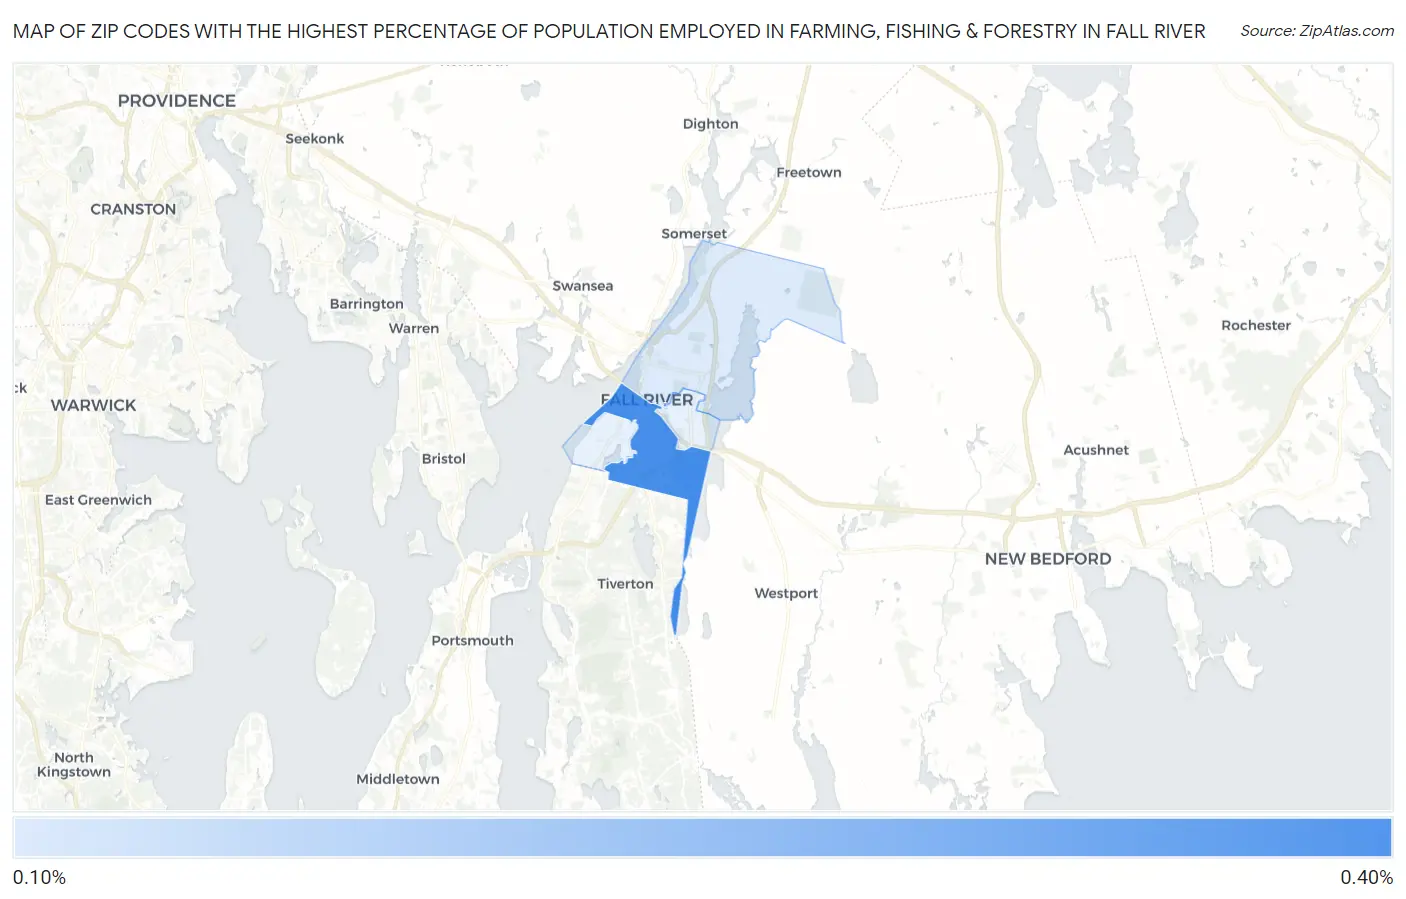
Map of Zip Codes with the Highest Percentage of Population Employed in Farming, Fishing & Forestry in Fall River
0.0%
0.40%
Zip Codes with the Highest Percentage of Population Employed in Farming, Fishing & Forestry in Fall River, MA
| Zip Code | % Employed | vs State | vs National | |
| 1. | 02721 | 0.32% | 0.22%(+0.101)#145 | 0.61%(-0.289)#14,639 |
| 2. | 02720 | 0.14% | 0.22%(-0.075)#209 | 0.61%(-0.465)#17,095 |
1
Common Questions
What are the Top 3 Zip Codes with the Highest Percentage of Population Employed in Farming, Fishing & Forestry in Fall River, MA?
Top 3 Zip Codes with the Highest Percentage of Population Employed in Farming, Fishing & Forestry in Fall River, MA are:
What zip code has the Highest Percentage of Population Employed in Farming, Fishing & Forestry in Fall River, MA?
02721 has the Highest Percentage of Population Employed in Farming, Fishing & Forestry in Fall River, MA with 0.32%.
What is the Percentage of Population Employed in Farming, Fishing & Forestry in Fall River, MA?
Percentage of Population Employed in Farming, Fishing & Forestry in Fall River is 0.14%.
What is the Percentage of Population Employed in Farming, Fishing & Forestry in Massachusetts?
Percentage of Population Employed in Farming, Fishing & Forestry in Massachusetts is 0.22%.
What is the Percentage of Population Employed in Farming, Fishing & Forestry in the United States?
Percentage of Population Employed in Farming, Fishing & Forestry in the United States is 0.61%.