Zip Codes with the Highest Percentage of Families with Income Above $200,000 in Brockton, MA
RELATED REPORTS & OPTIONS
Family Income | $200k+
Brockton
Compare Zip Codes
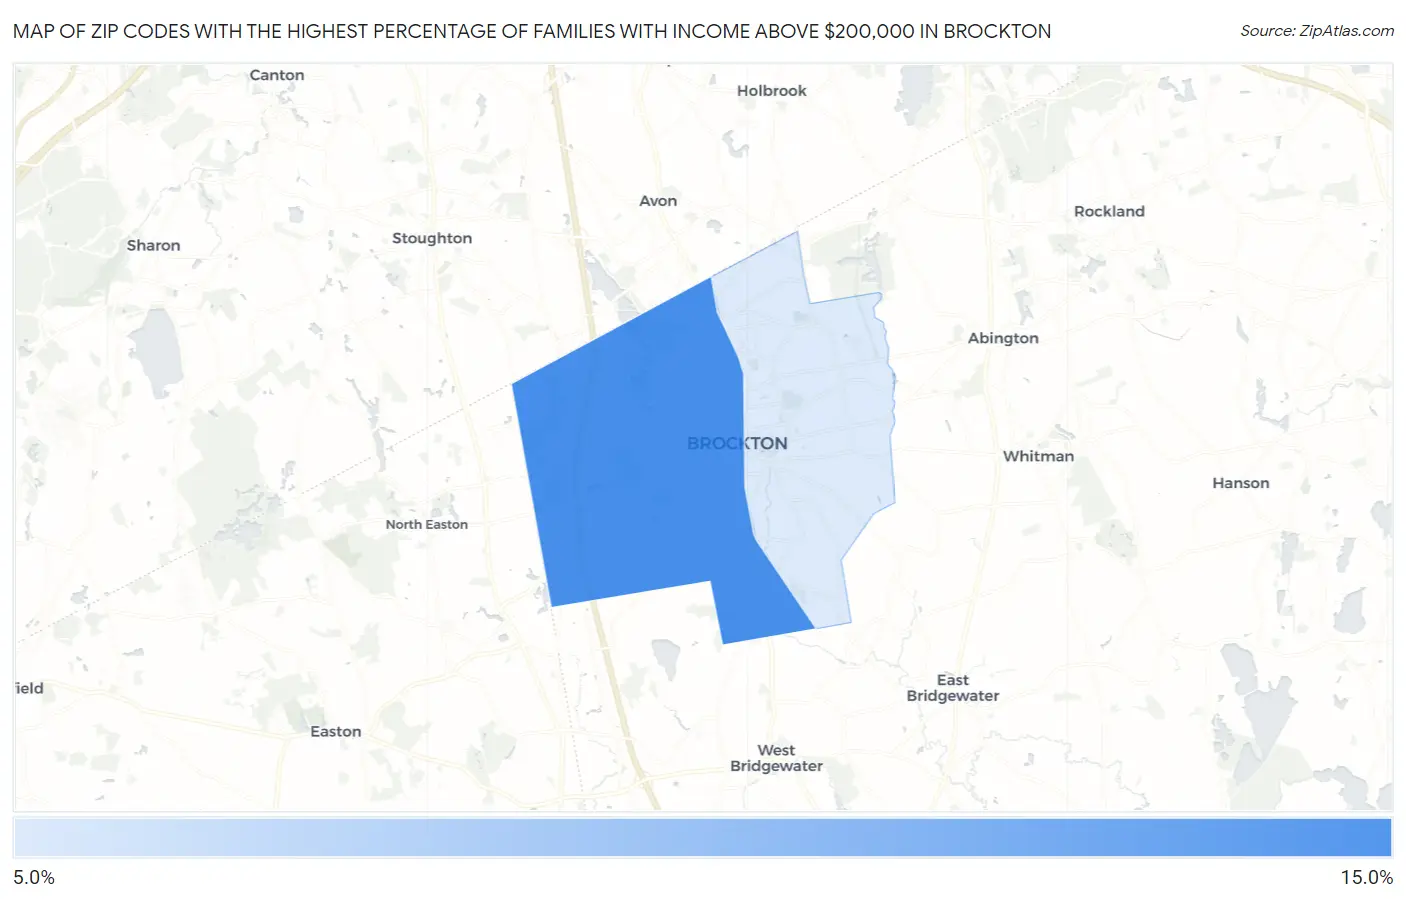
Map of Zip Codes with the Highest Percentage of Families with Income Above $200,000 in Brockton
10.9%
12.1%
Zip Codes with the Highest Percentage of Families with Income Above $200,000 in Brockton, MA
| Zip Code | Families with Income > $200k | vs State | vs National | |
| 1. | 02301 | 12.1% | 25.6%(-13.5)#396 | 14.8%(-2.70)#8,878 |
| 2. | 02302 | 10.9% | 25.6%(-14.7)#414 | 14.8%(-3.90)#9,901 |
1
Common Questions
What are the Top Zip Codes with the Highest Percentage of Families with Income Above $200,000 in Brockton, MA?
Top Zip Codes with the Highest Percentage of Families with Income Above $200,000 in Brockton, MA are:
What zip code has the Highest Percentage of Families with Income Above $200,000 in Brockton, MA?
02301 has the Highest Percentage of Families with Income Above $200,000 in Brockton, MA with 12.1%.
What is the Percentage of Families with Income Above $200,000 in Brockton, MA?
Percentage of Families with Income Above $200,000 in Brockton is 11.7%.
What is the Percentage of Families with Income Above $200,000 in Massachusetts?
Percentage of Families with Income Above $200,000 in Massachusetts is 25.6%.
What is the Percentage of Families with Income Above $200,000 in the United States?
Percentage of Families with Income Above $200,000 in the United States is 14.8%.