Zip Codes with the Highest Percentage of Population Employed in Food Preparation & Serving in Mandeville, LA
RELATED REPORTS & OPTIONS
Food Preparation & Serving
Mandeville
Compare Zip Codes
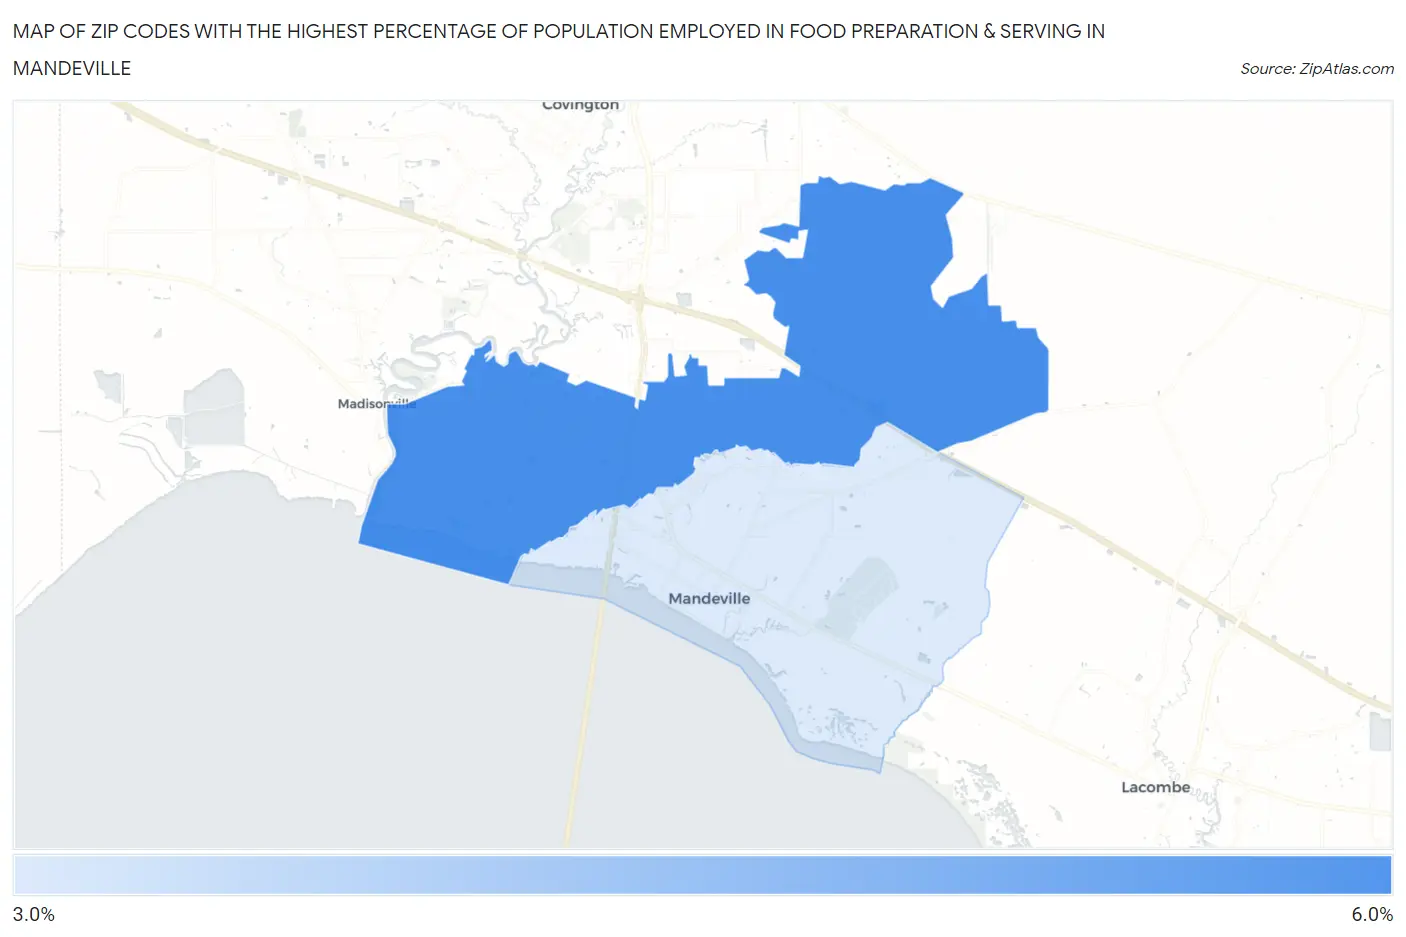
Map of Zip Codes with the Highest Percentage of Population Employed in Food Preparation & Serving in Mandeville
3.8%
5.3%
Zip Codes with the Highest Percentage of Population Employed in Food Preparation & Serving in Mandeville, LA
| Zip Code | % Employed | vs State | vs National | |
| 1. | 70471 | 5.3% | 6.0%(-0.748)#200 | 5.3%(+0.008)#11,788 |
| 2. | 70448 | 3.8% | 6.0%(-2.28)#286 | 5.3%(-1.53)#18,099 |
1
Common Questions
What are the Top Zip Codes with the Highest Percentage of Population Employed in Food Preparation & Serving in Mandeville, LA?
Top Zip Codes with the Highest Percentage of Population Employed in Food Preparation & Serving in Mandeville, LA are:
What zip code has the Highest Percentage of Population Employed in Food Preparation & Serving in Mandeville, LA?
70471 has the Highest Percentage of Population Employed in Food Preparation & Serving in Mandeville, LA with 5.3%.
What is the Percentage of Population Employed in Food Preparation & Serving in Mandeville, LA?
Percentage of Population Employed in Food Preparation & Serving in Mandeville is 3.8%.
What is the Percentage of Population Employed in Food Preparation & Serving in Louisiana?
Percentage of Population Employed in Food Preparation & Serving in Louisiana is 6.0%.
What is the Percentage of Population Employed in Food Preparation & Serving in the United States?
Percentage of Population Employed in Food Preparation & Serving in the United States is 5.3%.