Zip Codes with the Highest Percentage of Population Employed in Food Preparation & Serving in Covington, LA
RELATED REPORTS & OPTIONS
Food Preparation & Serving
Covington
Compare Zip Codes
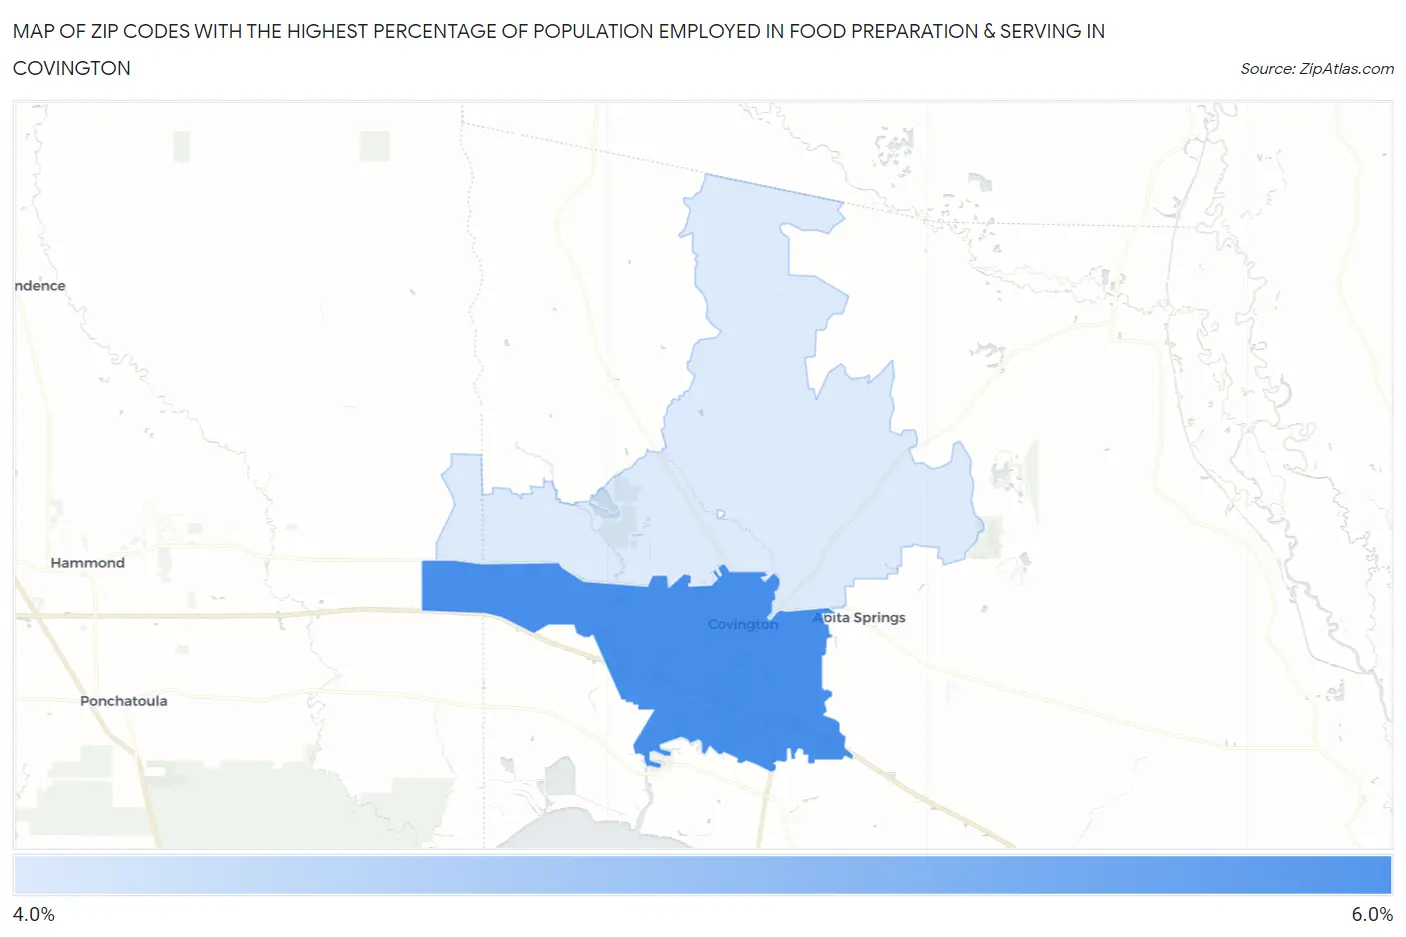
Map of Zip Codes with the Highest Percentage of Population Employed in Food Preparation & Serving in Covington
4.1%
5.3%
Zip Codes with the Highest Percentage of Population Employed in Food Preparation & Serving in Covington, LA
| Zip Code | % Employed | vs State | vs National | |
| 1. | 70433 | 5.3% | 6.0%(-0.783)#201 | 5.3%(-0.027)#11,930 |
| 2. | 70435 | 4.1% | 6.0%(-1.99)#276 | 5.3%(-1.23)#16,928 |
1
Common Questions
What are the Top Zip Codes with the Highest Percentage of Population Employed in Food Preparation & Serving in Covington, LA?
Top Zip Codes with the Highest Percentage of Population Employed in Food Preparation & Serving in Covington, LA are:
What zip code has the Highest Percentage of Population Employed in Food Preparation & Serving in Covington, LA?
70433 has the Highest Percentage of Population Employed in Food Preparation & Serving in Covington, LA with 5.3%.
What is the Percentage of Population Employed in Food Preparation & Serving in Covington, LA?
Percentage of Population Employed in Food Preparation & Serving in Covington is 5.9%.
What is the Percentage of Population Employed in Food Preparation & Serving in Louisiana?
Percentage of Population Employed in Food Preparation & Serving in Louisiana is 6.0%.
What is the Percentage of Population Employed in Food Preparation & Serving in the United States?
Percentage of Population Employed in Food Preparation & Serving in the United States is 5.3%.