Zip Codes with the Highest Percentage of Population Employed in Food Preparation & Serving in Kenner, LA
RELATED REPORTS & OPTIONS
Food Preparation & Serving
Kenner
Compare Zip Codes
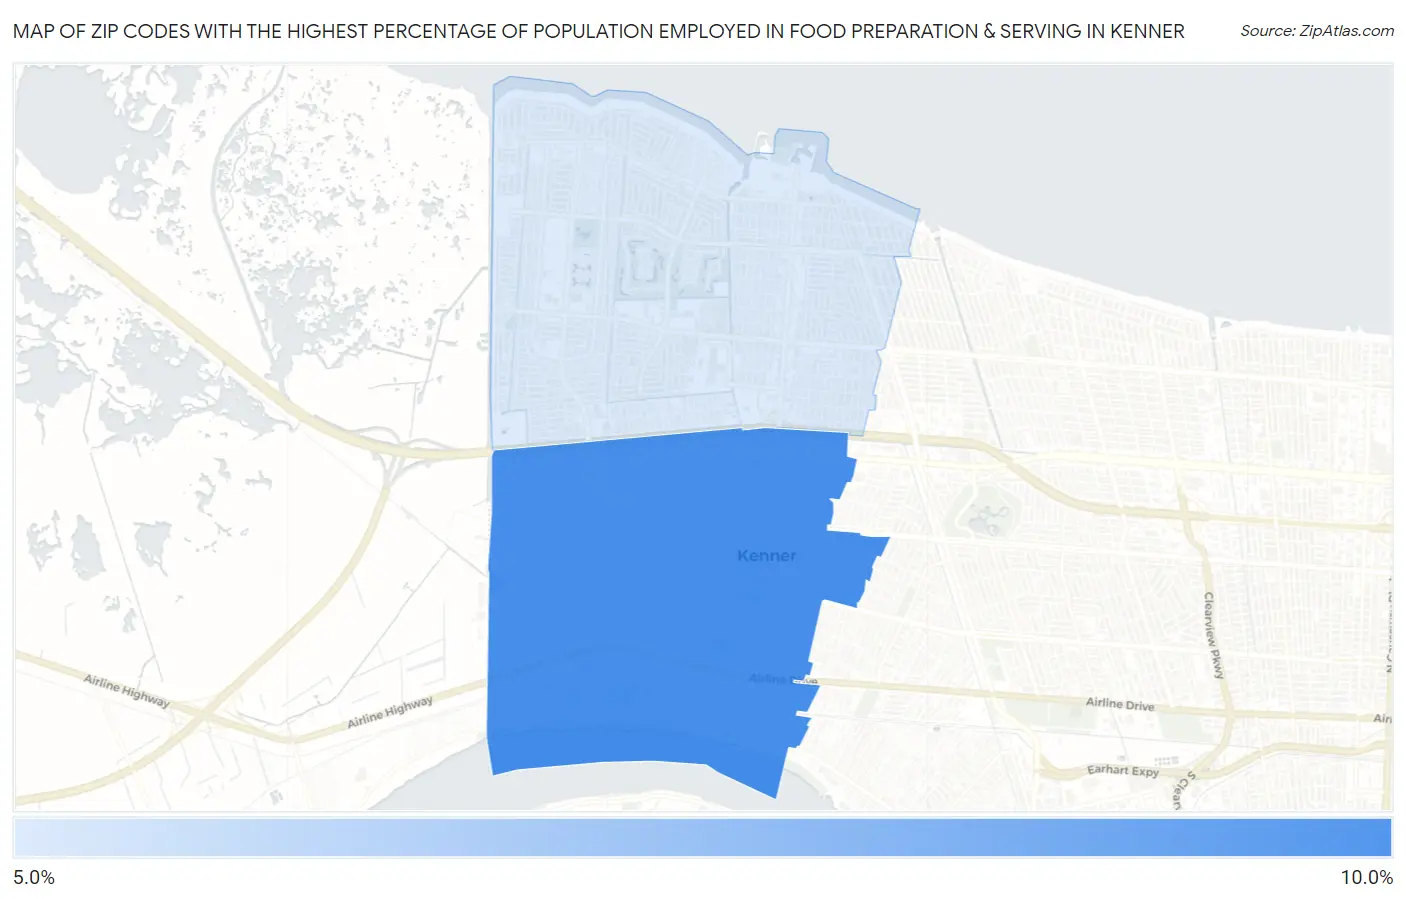
Map of Zip Codes with the Highest Percentage of Population Employed in Food Preparation & Serving in Kenner
5.6%
9.2%
Zip Codes with the Highest Percentage of Population Employed in Food Preparation & Serving in Kenner, LA
| Zip Code | % Employed | vs State | vs National | |
| 1. | 70062 | 9.2% | 6.0%(+3.16)#74 | 5.3%(+3.92)#3,319 |
| 2. | 70065 | 5.6% | 6.0%(-0.463)#183 | 5.3%(+0.293)#10,775 |
1
Common Questions
What are the Top Zip Codes with the Highest Percentage of Population Employed in Food Preparation & Serving in Kenner, LA?
Top Zip Codes with the Highest Percentage of Population Employed in Food Preparation & Serving in Kenner, LA are:
What zip code has the Highest Percentage of Population Employed in Food Preparation & Serving in Kenner, LA?
70062 has the Highest Percentage of Population Employed in Food Preparation & Serving in Kenner, LA with 9.2%.
What is the Percentage of Population Employed in Food Preparation & Serving in Kenner, LA?
Percentage of Population Employed in Food Preparation & Serving in Kenner is 6.5%.
What is the Percentage of Population Employed in Food Preparation & Serving in Louisiana?
Percentage of Population Employed in Food Preparation & Serving in Louisiana is 6.0%.
What is the Percentage of Population Employed in Food Preparation & Serving in the United States?
Percentage of Population Employed in Food Preparation & Serving in the United States is 5.3%.