Zip Codes with the Highest Percentage of Population Employed in Food Preparation & Serving in West Monroe, LA
RELATED REPORTS & OPTIONS
Food Preparation & Serving
West Monroe
Compare Zip Codes
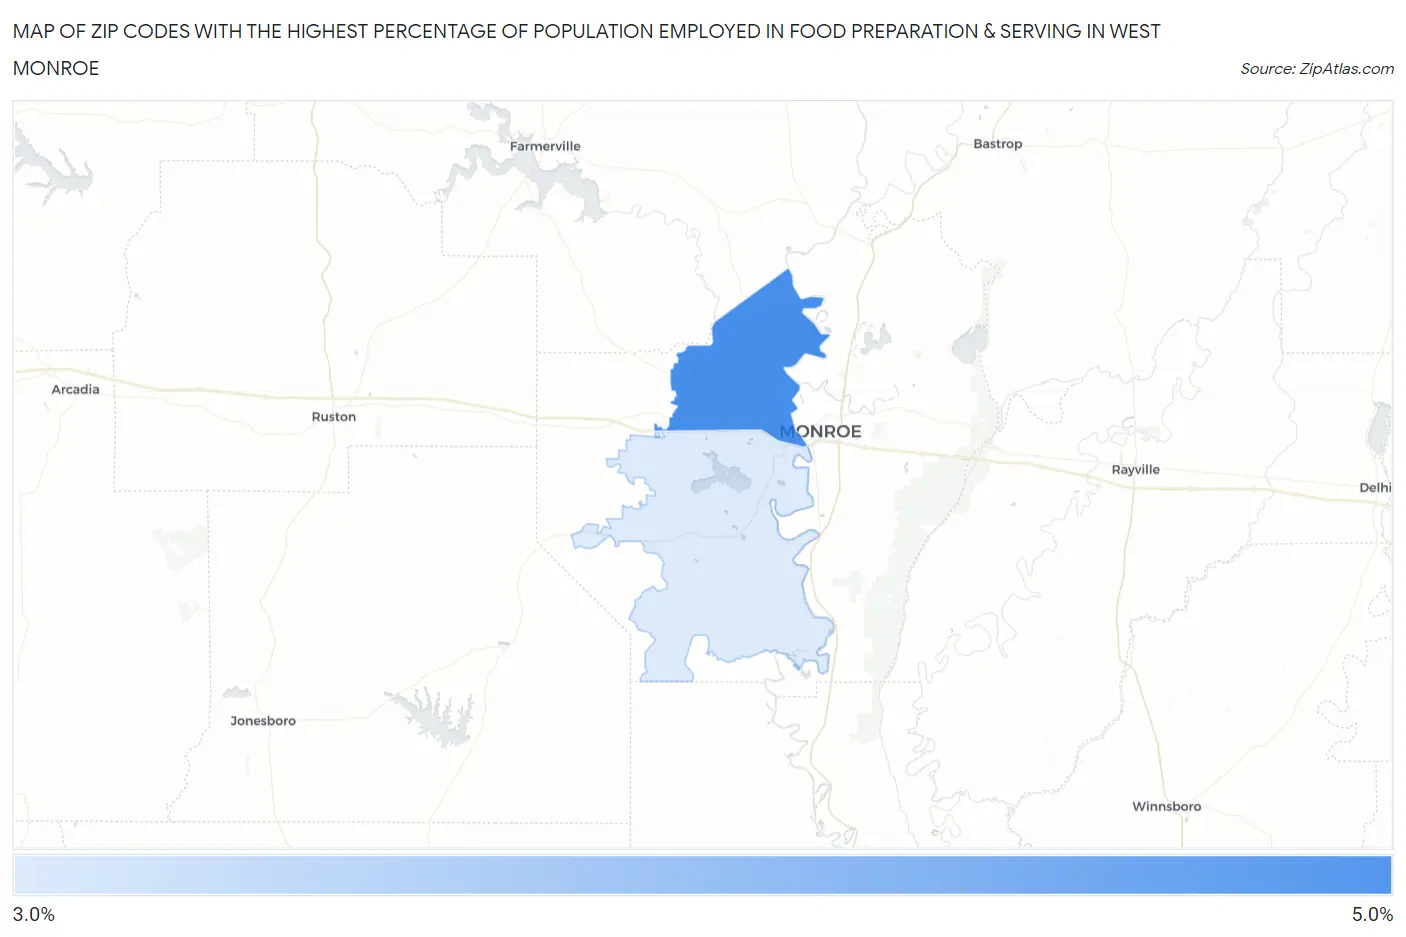
Map of Zip Codes with the Highest Percentage of Population Employed in Food Preparation & Serving in West Monroe
3.0%
4.4%
Zip Codes with the Highest Percentage of Population Employed in Food Preparation & Serving in West Monroe, LA
| Zip Code | % Employed | vs State | vs National | |
| 1. | 71291 | 4.4% | 6.0%(-1.69)#250 | 5.3%(-0.932)#15,626 |
| 2. | 71292 | 3.0% | 6.0%(-2.99)#322 | 5.3%(-2.24)#21,070 |
1
Common Questions
What are the Top Zip Codes with the Highest Percentage of Population Employed in Food Preparation & Serving in West Monroe, LA?
Top Zip Codes with the Highest Percentage of Population Employed in Food Preparation & Serving in West Monroe, LA are:
What zip code has the Highest Percentage of Population Employed in Food Preparation & Serving in West Monroe, LA?
71291 has the Highest Percentage of Population Employed in Food Preparation & Serving in West Monroe, LA with 4.4%.
What is the Percentage of Population Employed in Food Preparation & Serving in West Monroe, LA?
Percentage of Population Employed in Food Preparation & Serving in West Monroe is 7.9%.
What is the Percentage of Population Employed in Food Preparation & Serving in Louisiana?
Percentage of Population Employed in Food Preparation & Serving in Louisiana is 6.0%.
What is the Percentage of Population Employed in Food Preparation & Serving in the United States?
Percentage of Population Employed in Food Preparation & Serving in the United States is 5.3%.