Zip Codes with the Highest Percentage of Population Employed in Food Preparation & Serving in Slidell, LA
RELATED REPORTS & OPTIONS
Food Preparation & Serving
Slidell
Compare Zip Codes
Map of Zip Codes with the Highest Percentage of Population Employed in Food Preparation & Serving in Slidell
4.5%
7.5%
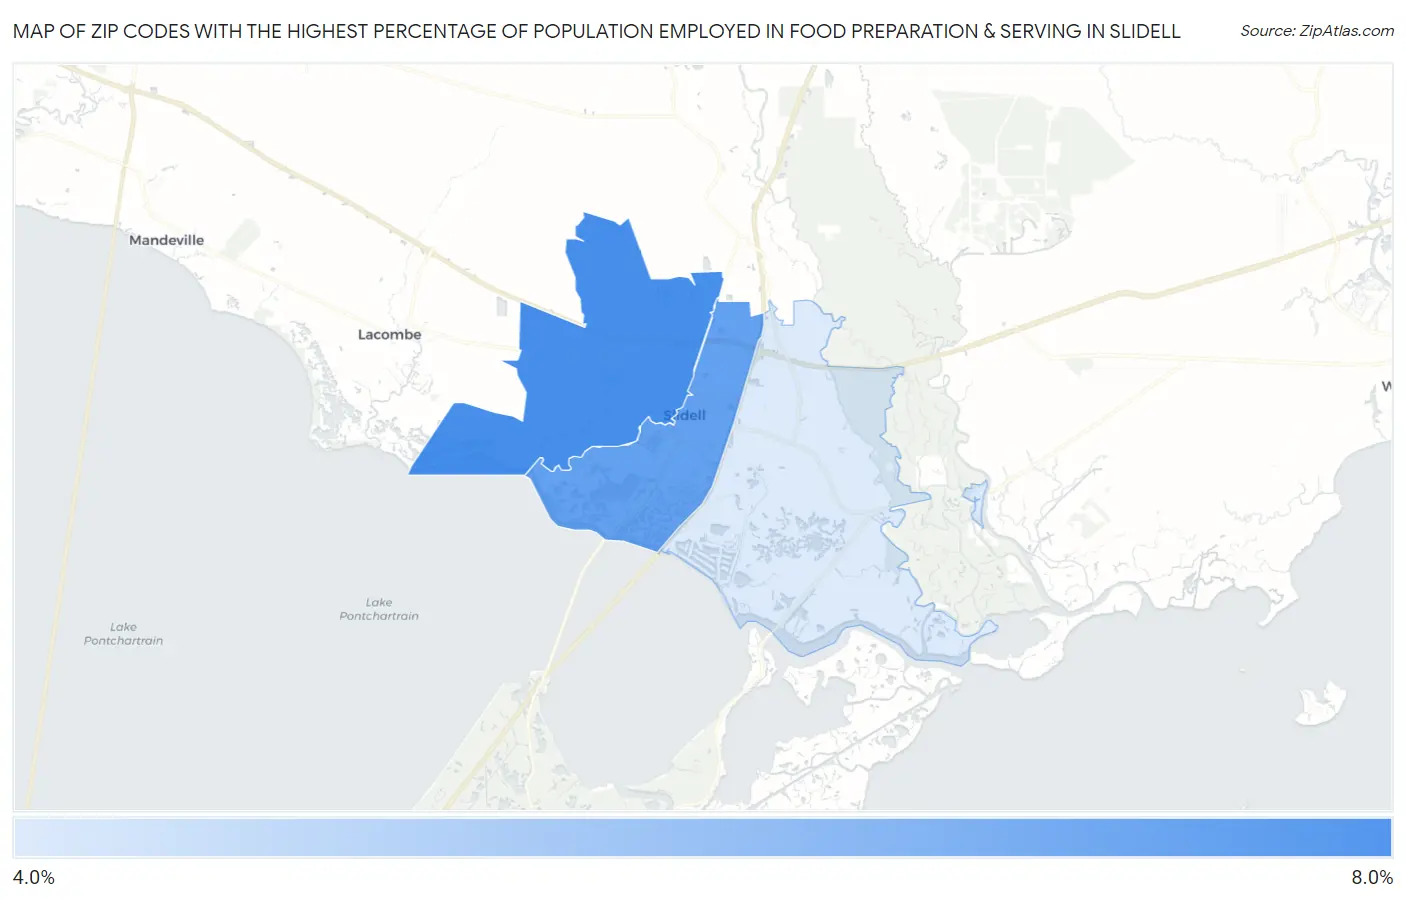
Zip Codes with the Highest Percentage of Population Employed in Food Preparation & Serving in Slidell, LA
| Zip Code | % Employed | vs State | vs National | |
| 1. | 70460 | 7.5% | 6.0%(+1.48)#112 | 5.3%(+2.23)#5,525 |
| 2. | 70458 | 7.0% | 6.0%(+0.943)#129 | 5.3%(+1.70)#6,605 |
| 3. | 70461 | 4.5% | 6.0%(-1.50)#238 | 5.3%(-0.740)#14,830 |
1
Common Questions
What are the Top Zip Codes with the Highest Percentage of Population Employed in Food Preparation & Serving in Slidell, LA?
Top Zip Codes with the Highest Percentage of Population Employed in Food Preparation & Serving in Slidell, LA are:
What zip code has the Highest Percentage of Population Employed in Food Preparation & Serving in Slidell, LA?
70460 has the Highest Percentage of Population Employed in Food Preparation & Serving in Slidell, LA with 7.5%.
What is the Percentage of Population Employed in Food Preparation & Serving in Slidell, LA?
Percentage of Population Employed in Food Preparation & Serving in Slidell is 6.6%.
What is the Percentage of Population Employed in Food Preparation & Serving in Louisiana?
Percentage of Population Employed in Food Preparation & Serving in Louisiana is 6.0%.
What is the Percentage of Population Employed in Food Preparation & Serving in the United States?
Percentage of Population Employed in Food Preparation & Serving in the United States is 5.3%.