Mandeville, LA Map & Demographics
Mandeville Map
Mandeville Overview
$58,156
PER CAPITA INCOME
$127,589
AVG FAMILY INCOME
$84,886
AVG HOUSEHOLD INCOME
53.9%
WAGE / INCOME GAP [ % ]
46.1¢/ $1
WAGE / INCOME GAP [ $ ]
$8,515
FAMILY INCOME DEFICIT
0.52
INEQUALITY / GINI INDEX
13,194
TOTAL POPULATION
6,354
MALE POPULATION
6,840
FEMALE POPULATION
92.89
MALES / 100 FEMALES
107.65
FEMALES / 100 MALES
45.1
MEDIAN AGE
2.9
AVG FAMILY SIZE
2.4
AVG HOUSEHOLD SIZE
6,272
LABOR FORCE [ PEOPLE ]
59.1%
PERCENT IN LABOR FORCE
3.6%
UNEMPLOYMENT RATE
Mandeville Area Codes
Income in Mandeville
Income Overview in Mandeville
Per Capita Income in Mandeville is $58,156, while median incomes of families and households are $127,589 and $84,886 respectively.
| Characteristic | Number | Measure |
| Per Capita Income | 13,194 | $58,156 |
| Median Family Income | 3,723 | $127,589 |
| Mean Family Income | 3,723 | $170,261 |
| Median Household Income | 5,500 | $84,886 |
| Mean Household Income | 5,500 | $137,110 |
| Income Deficit | 3,723 | $8,515 |
| Wage / Income Gap (%) | 13,194 | 53.93% |
| Wage / Income Gap ($) | 13,194 | 46.07¢ per $1 |
| Gini / Inequality Index | 13,194 | 0.52 |
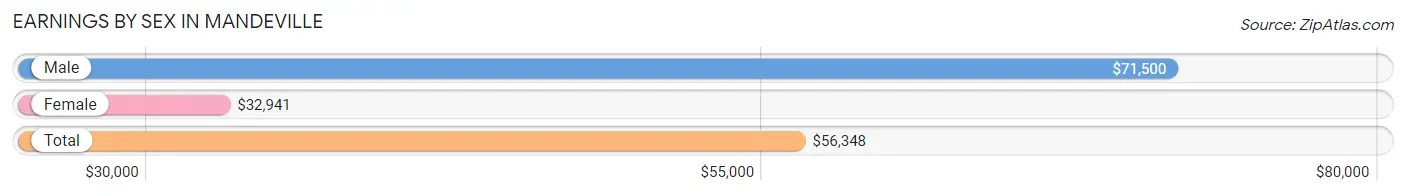
Earnings by Sex in Mandeville
Average Earnings in Mandeville are $56,348, $71,500 for men and $32,941 for women, a difference of 53.9%.
| Sex | Number | Average Earnings |
| Male | 3,714 (56.6%) | $71,500 |
| Female | 2,852 (43.4%) | $32,941 |
| Total | 6,566 (100.0%) | $56,348 |
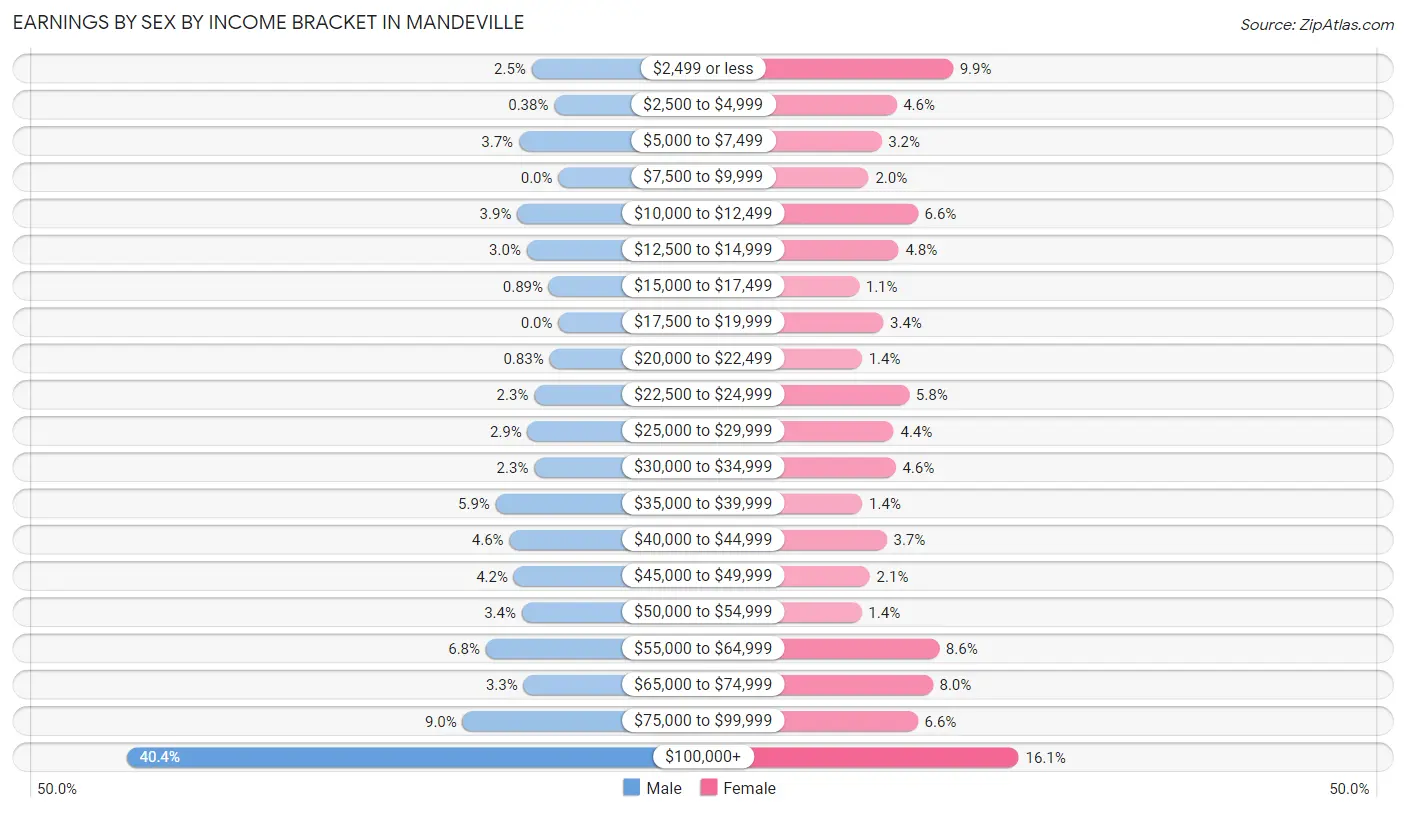
Earnings by Sex by Income Bracket in Mandeville
The most common earnings brackets in Mandeville are $100,000+ for men (1,502 | 40.4%) and $100,000+ for women (459 | 16.1%).
| Income | Male | Female |
| $2,499 or less | 93 (2.5%) | 283 (9.9%) |
| $2,500 to $4,999 | 14 (0.4%) | 132 (4.6%) |
| $5,000 to $7,499 | 137 (3.7%) | 92 (3.2%) |
| $7,500 to $9,999 | 0 (0.0%) | 58 (2.0%) |
| $10,000 to $12,499 | 143 (3.8%) | 189 (6.6%) |
| $12,500 to $14,999 | 110 (3.0%) | 138 (4.8%) |
| $15,000 to $17,499 | 33 (0.9%) | 32 (1.1%) |
| $17,500 to $19,999 | 0 (0.0%) | 97 (3.4%) |
| $20,000 to $22,499 | 31 (0.8%) | 40 (1.4%) |
| $22,500 to $24,999 | 84 (2.3%) | 166 (5.8%) |
| $25,000 to $29,999 | 107 (2.9%) | 125 (4.4%) |
| $30,000 to $34,999 | 84 (2.3%) | 130 (4.6%) |
| $35,000 to $39,999 | 218 (5.9%) | 41 (1.4%) |
| $40,000 to $44,999 | 170 (4.6%) | 106 (3.7%) |
| $45,000 to $49,999 | 155 (4.2%) | 61 (2.1%) |
| $50,000 to $54,999 | 127 (3.4%) | 39 (1.4%) |
| $55,000 to $64,999 | 252 (6.8%) | 246 (8.6%) |
| $65,000 to $74,999 | 121 (3.3%) | 229 (8.0%) |
| $75,000 to $99,999 | 333 (9.0%) | 189 (6.6%) |
| $100,000+ | 1,502 (40.4%) | 459 (16.1%) |
| Total | 3,714 (100.0%) | 2,852 (100.0%) |
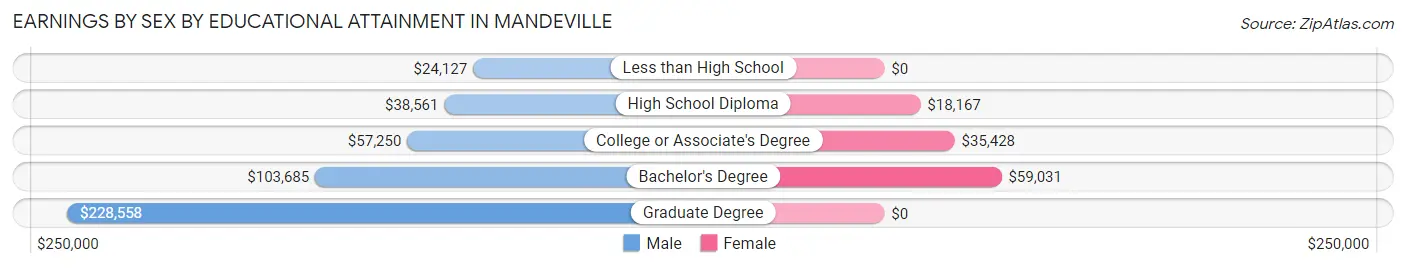
Earnings by Sex by Educational Attainment in Mandeville
Average earnings in Mandeville are $90,352 for men and $40,560 for women, a difference of 55.1%. Men with an educational attainment of graduate degree enjoy the highest average annual earnings of $228,558, while those with less than high school education earn the least with $24,127. Women with an educational attainment of bachelor's degree earn the most with the average annual earnings of $59,031, while those with high school diploma education have the smallest earnings of $18,167.
| Educational Attainment | Male Income | Female Income |
| Less than High School | $24,127 | $0 |
| High School Diploma | $38,561 | $18,167 |
| College or Associate's Degree | $57,250 | $35,428 |
| Bachelor's Degree | $103,685 | $59,031 |
| Graduate Degree | $228,558 | $0 |
| Total | $90,352 | $40,560 |
Family Income in Mandeville
Family Income Brackets in Mandeville
According to the Mandeville family income data, there are 1,065 families falling into the $200,000+ income range, which is the most common income bracket and makes up 28.6% of all families. Conversely, the less than $10,000 income bracket is the least frequent group with only 22 families (0.6%) belonging to this category.
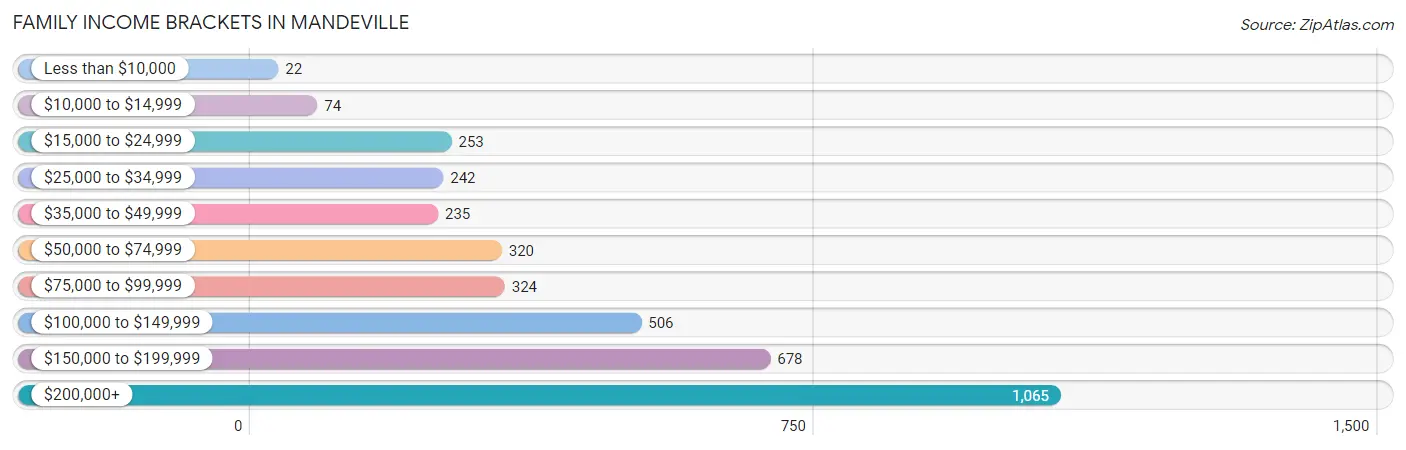
| Income Bracket | # Families | % Families |
| Less than $10,000 | 22 | 0.6% |
| $10,000 to $14,999 | 74 | 2.0% |
| $15,000 to $24,999 | 253 | 6.8% |
| $25,000 to $34,999 | 242 | 6.5% |
| $35,000 to $49,999 | 235 | 6.3% |
| $50,000 to $74,999 | 320 | 8.6% |
| $75,000 to $99,999 | 324 | 8.7% |
| $100,000 to $149,999 | 506 | 13.6% |
| $150,000 to $199,999 | 678 | 18.2% |
| $200,000+ | 1,065 | 28.6% |
Family Income by Famaliy Size in Mandeville
5-person families (136 | 3.6%) account for the highest median family income in Mandeville with $181,200 per family, while 3-person families (1,159 | 31.1%) have the highest median income of $58,007 per family member.
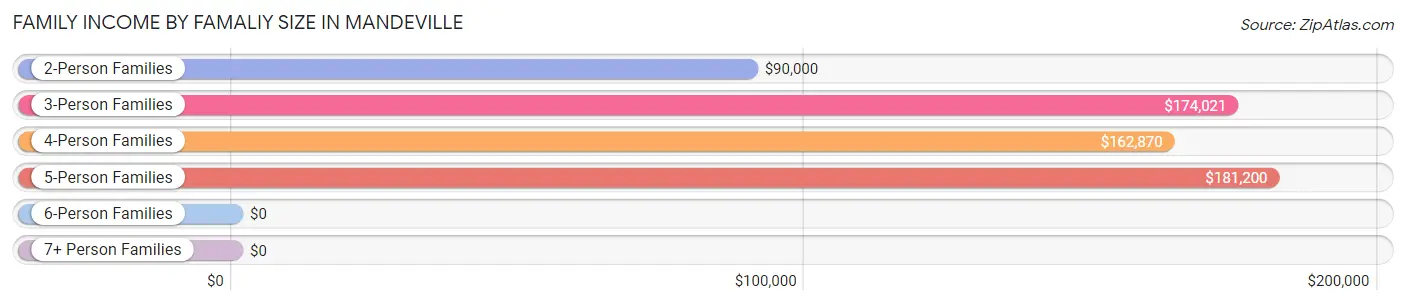
| Income Bracket | # Families | Median Income |
| 2-Person Families | 1,738 (46.7%) | $90,000 |
| 3-Person Families | 1,159 (31.1%) | $174,021 |
| 4-Person Families | 532 (14.3%) | $162,870 |
| 5-Person Families | 136 (3.6%) | $181,200 |
| 6-Person Families | 158 (4.2%) | $0 |
| 7+ Person Families | 0 (0.0%) | $0 |
| Total | 3,723 (100.0%) | $127,589 |
Family Income by Number of Earners in Mandeville
The median family income in Mandeville is $127,589, with families comprising 3+ earners (292) having the highest median family income of $189,000, while families with no earners (589) have the lowest median family income of $40,221, accounting for 7.8% and 15.8% of families, respectively.
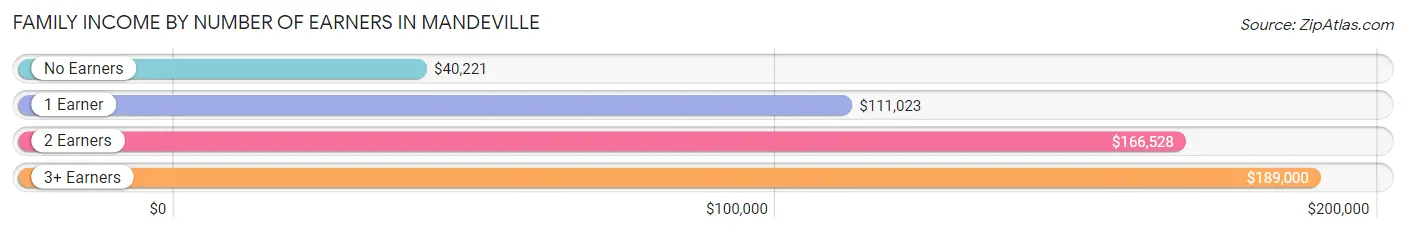
| Number of Earners | # Families | Median Income |
| No Earners | 589 (15.8%) | $40,221 |
| 1 Earner | 1,457 (39.1%) | $111,023 |
| 2 Earners | 1,385 (37.2%) | $166,528 |
| 3+ Earners | 292 (7.8%) | $189,000 |
| Total | 3,723 (100.0%) | $127,589 |
Household Income in Mandeville
Household Income Brackets in Mandeville
With 1,150 households falling in the category, the $200,000+ income range is the most frequent in Mandeville, accounting for 20.9% of all households. In contrast, only 176 households (3.2%) fall into the $10,000 to $14,999 income bracket, making it the least populous group.
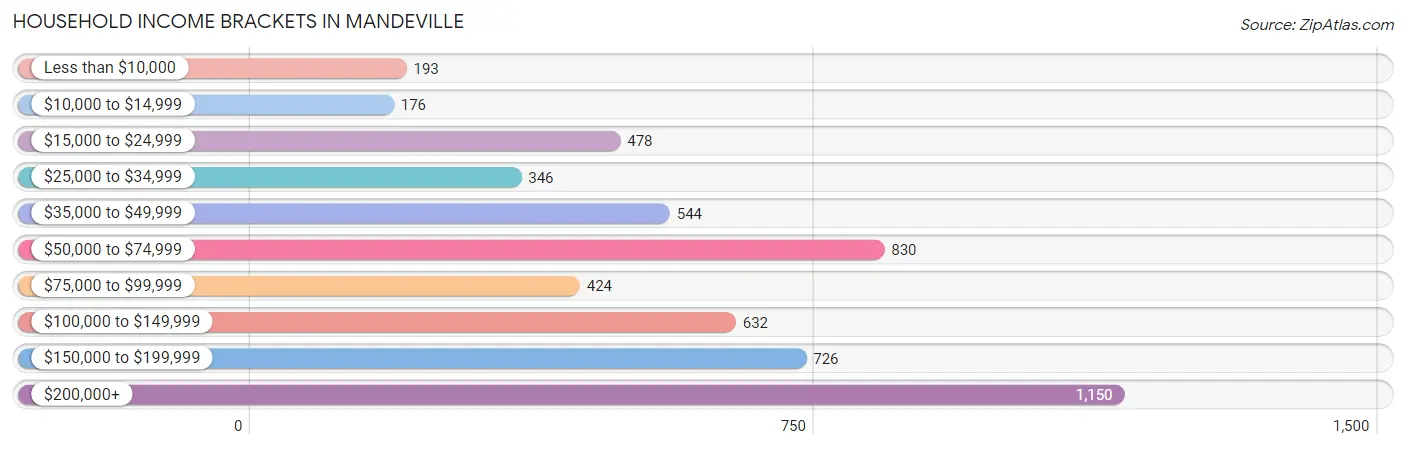
| Income Bracket | # Households | % Households |
| Less than $10,000 | 193 | 3.5% |
| $10,000 to $14,999 | 176 | 3.2% |
| $15,000 to $24,999 | 478 | 8.7% |
| $25,000 to $34,999 | 346 | 6.3% |
| $35,000 to $49,999 | 544 | 9.9% |
| $50,000 to $74,999 | 830 | 15.1% |
| $75,000 to $99,999 | 424 | 7.7% |
| $100,000 to $149,999 | 632 | 11.5% |
| $150,000 to $199,999 | 726 | 13.2% |
| $200,000+ | 1,150 | 20.9% |
Household Income by Householder Age in Mandeville
The median household income in Mandeville is $84,886, with the highest median household income of $172,939 found in the 15 to 24 years age bracket for the primary householder. A total of 122 households (2.2%) fall into this category. Meanwhile, the 65+ years age bracket for the primary householder has the lowest median household income of $44,620, with 1,716 households (31.2%) in this group.
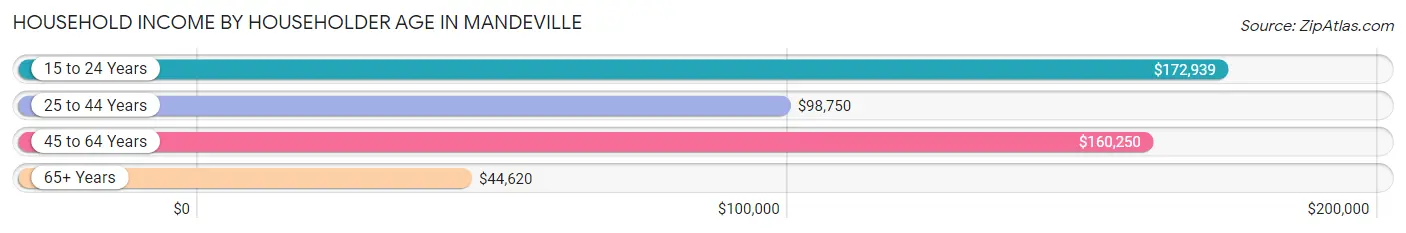
| Income Bracket | # Households | Median Income |
| 15 to 24 Years | 122 (2.2%) | $172,939 |
| 25 to 44 Years | 1,522 (27.7%) | $98,750 |
| 45 to 64 Years | 2,140 (38.9%) | $160,250 |
| 65+ Years | 1,716 (31.2%) | $44,620 |
| Total | 5,500 (100.0%) | $84,886 |
Poverty in Mandeville
Income Below Poverty by Sex and Age in Mandeville
With 5.7% poverty level for males and 13.8% for females among the residents of Mandeville, 6 to 11 year old males and 15 year old females are the most vulnerable to poverty, with 63 males (13.5%) and 70 females (48.3%) in their respective age groups living below the poverty level.
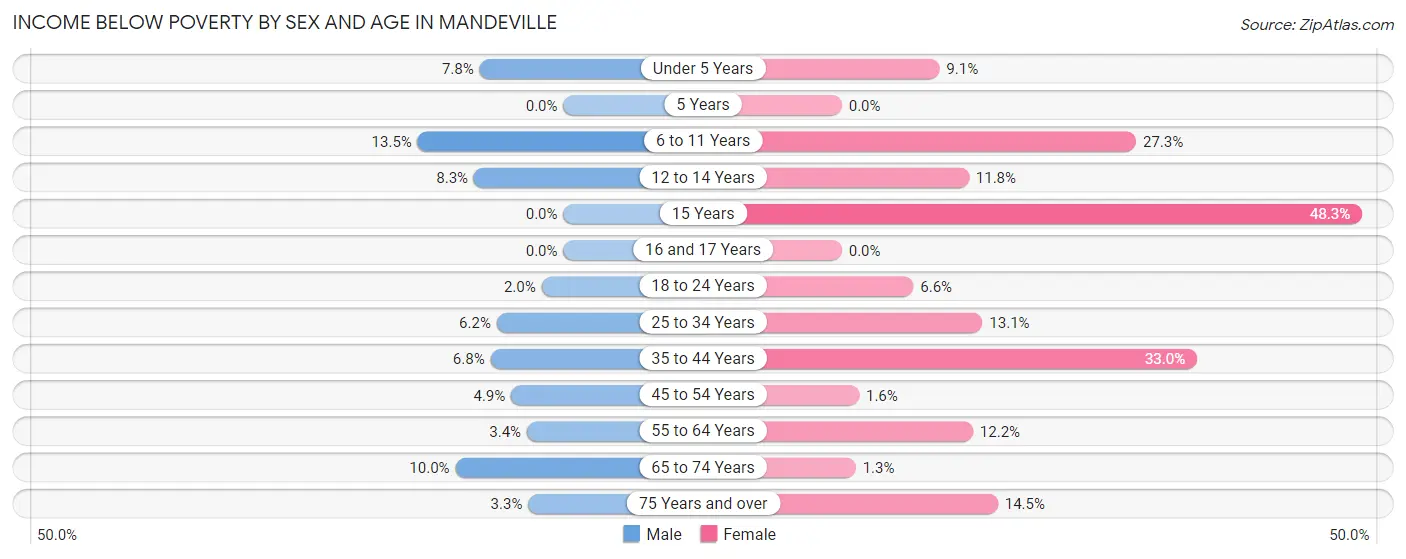
| Age Bracket | Male | Female |
| Under 5 Years | 14 (7.8%) | 23 (9.1%) |
| 5 Years | 0 (0.0%) | 0 (0.0%) |
| 6 to 11 Years | 63 (13.5%) | 201 (27.3%) |
| 12 to 14 Years | 21 (8.3%) | 46 (11.8%) |
| 15 Years | 0 (0.0%) | 70 (48.3%) |
| 16 and 17 Years | 0 (0.0%) | 0 (0.0%) |
| 18 to 24 Years | 10 (2.0%) | 17 (6.6%) |
| 25 to 34 Years | 47 (6.2%) | 86 (13.1%) |
| 35 to 44 Years | 46 (6.8%) | 234 (33.0%) |
| 45 to 54 Years | 40 (4.9%) | 15 (1.6%) |
| 55 to 64 Years | 36 (3.4%) | 116 (12.2%) |
| 65 to 74 Years | 60 (10.0%) | 10 (1.3%) |
| 75 Years and over | 18 (3.3%) | 104 (14.5%) |
| Total | 355 (5.7%) | 922 (13.8%) |
Income Above Poverty by Sex and Age in Mandeville
According to the poverty statistics in Mandeville, males aged 15 years and females aged 5 years are the age groups that are most secure financially, with 100.0% of males and 100.0% of females in these age groups living above the poverty line.
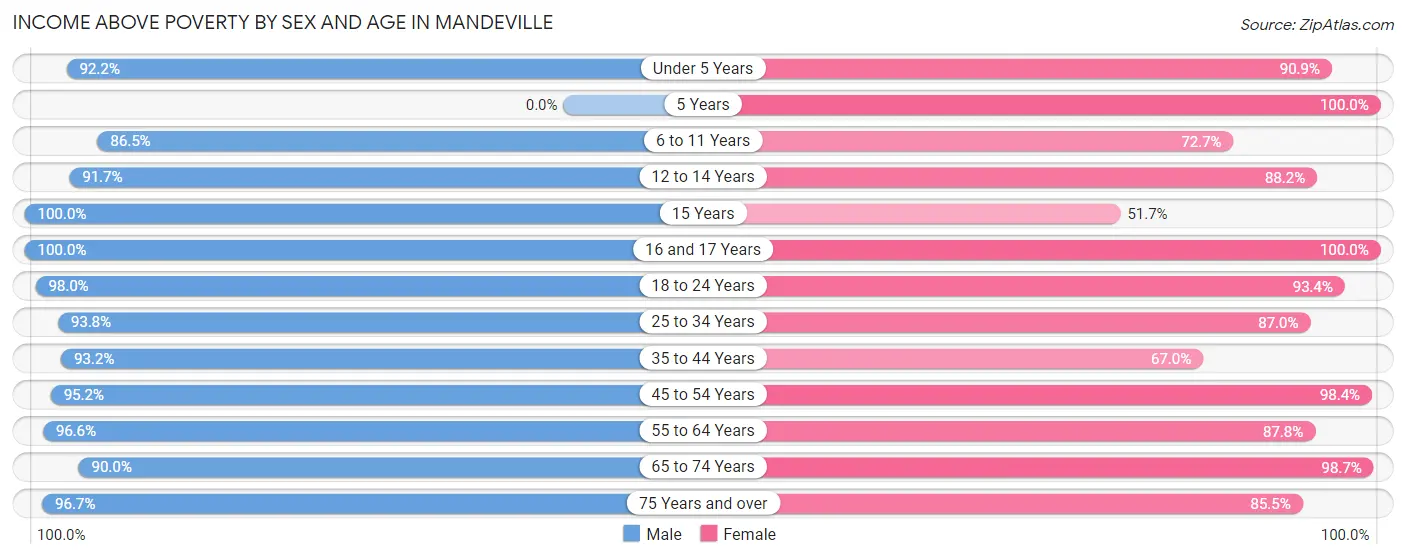
| Age Bracket | Male | Female |
| Under 5 Years | 166 (92.2%) | 231 (90.9%) |
| 5 Years | 0 (0.0%) | 38 (100.0%) |
| 6 to 11 Years | 403 (86.5%) | 535 (72.7%) |
| 12 to 14 Years | 232 (91.7%) | 344 (88.2%) |
| 15 Years | 119 (100.0%) | 75 (51.7%) |
| 16 and 17 Years | 280 (100.0%) | 117 (100.0%) |
| 18 to 24 Years | 485 (98.0%) | 239 (93.4%) |
| 25 to 34 Years | 714 (93.8%) | 573 (87.0%) |
| 35 to 44 Years | 634 (93.2%) | 476 (67.0%) |
| 45 to 54 Years | 784 (95.2%) | 925 (98.4%) |
| 55 to 64 Years | 1,028 (96.6%) | 837 (87.8%) |
| 65 to 74 Years | 539 (90.0%) | 765 (98.7%) |
| 75 Years and over | 534 (96.7%) | 614 (85.5%) |
| Total | 5,918 (94.3%) | 5,769 (86.2%) |
Income Below Poverty Among Married-Couple Families in Mandeville
The poverty statistics for married-couple families in Mandeville show that 3.6% or 106 of the total 2,926 families live below the poverty line. Families with 1 or 2 children have the highest poverty rate of 5.1%, comprising of 46 families. On the other hand, families with 3 or 4 children have the lowest poverty rate of 0.0%, which includes 0 families.
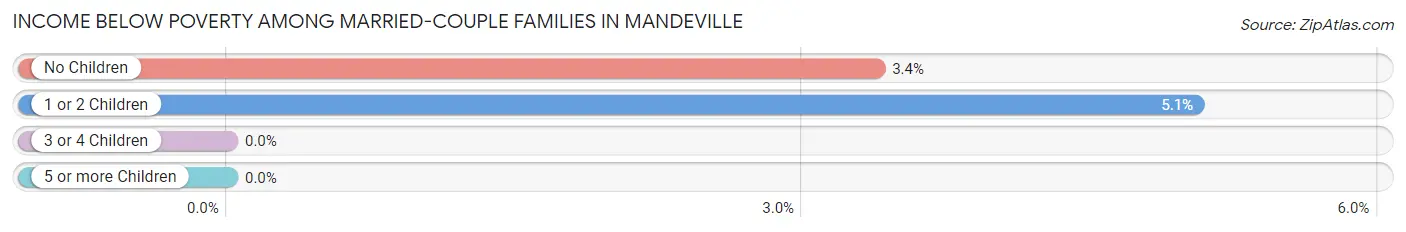
| Children | Above Poverty | Below Poverty |
| No Children | 1,717 (96.6%) | 60 (3.4%) |
| 1 or 2 Children | 865 (95.0%) | 46 (5.1%) |
| 3 or 4 Children | 238 (100.0%) | 0 (0.0%) |
| 5 or more Children | 0 (0.0%) | 0 (0.0%) |
| Total | 2,820 (96.4%) | 106 (3.6%) |
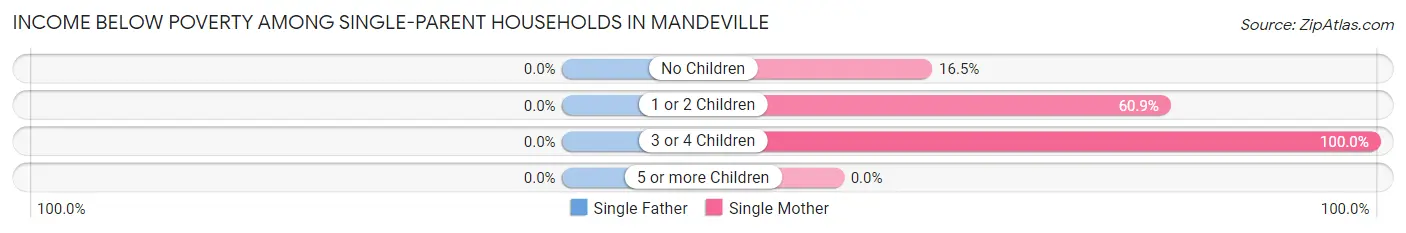
Income Below Poverty Among Single-Parent Households in Mandeville
| Children | Single Father | Single Mother |
| No Children | 0 (0.0%) | 15 (16.5%) |
| 1 or 2 Children | 0 (0.0%) | 134 (60.9%) |
| 3 or 4 Children | 0 (0.0%) | 38 (100.0%) |
| 5 or more Children | 0 (0.0%) | 0 (0.0%) |
| Total | 0 (0.0%) | 187 (53.6%) |
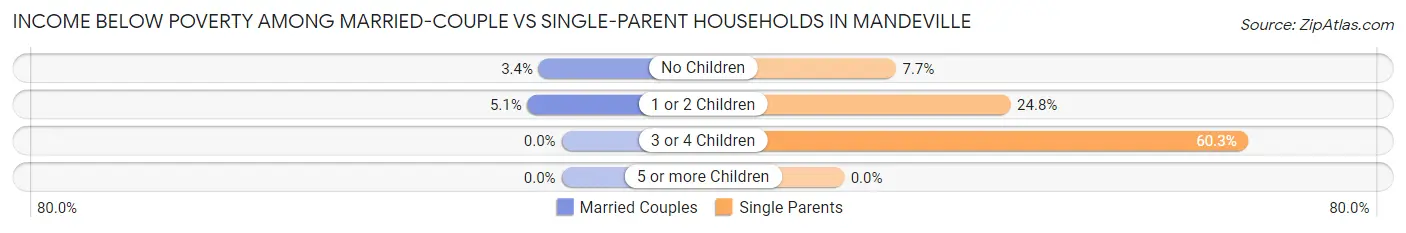
Income Below Poverty Among Married-Couple vs Single-Parent Households in Mandeville
The poverty data for Mandeville shows that 106 of the married-couple family households (3.6%) and 187 of the single-parent households (23.5%) are living below the poverty level. Within the married-couple family households, those with 1 or 2 children have the highest poverty rate, with 46 households (5.1%) falling below the poverty line. Among the single-parent households, those with 3 or 4 children have the highest poverty rate, with 38 household (60.3%) living below poverty.
| Children | Married-Couple Families | Single-Parent Households |
| No Children | 60 (3.4%) | 15 (7.7%) |
| 1 or 2 Children | 46 (5.1%) | 134 (24.8%) |
| 3 or 4 Children | 0 (0.0%) | 38 (60.3%) |
| 5 or more Children | 0 (0.0%) | 0 (0.0%) |
| Total | 106 (3.6%) | 187 (23.5%) |
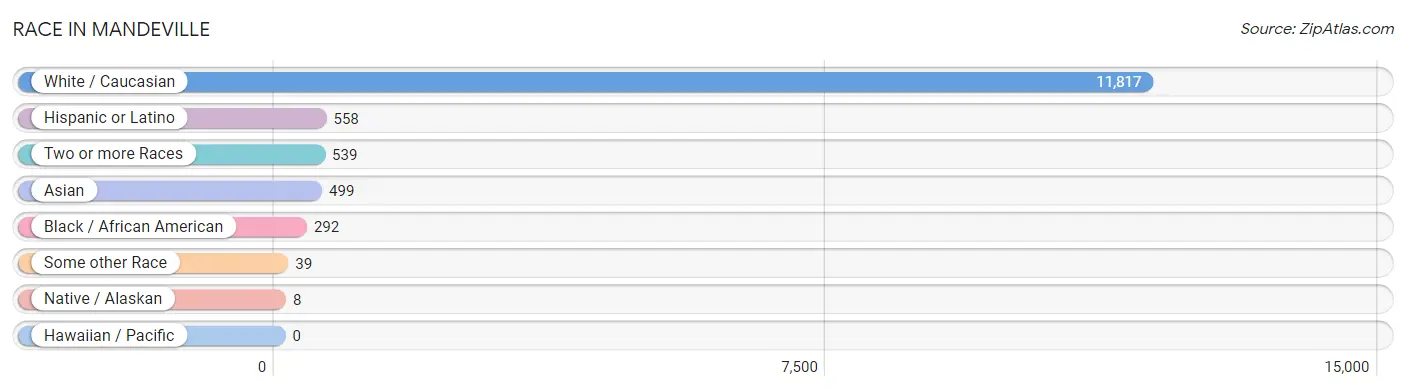
Race in Mandeville
The most populous races in Mandeville are White / Caucasian (11,817 | 89.6%), Hispanic or Latino (558 | 4.2%), and Two or more Races (539 | 4.1%).
| Race | # Population | % Population |
| Asian | 499 | 3.8% |
| Black / African American | 292 | 2.2% |
| Hawaiian / Pacific | 0 | 0.0% |
| Hispanic or Latino | 558 | 4.2% |
| Native / Alaskan | 8 | 0.1% |
| White / Caucasian | 11,817 | 89.6% |
| Two or more Races | 539 | 4.1% |
| Some other Race | 39 | 0.3% |
| Total | 13,194 | 100.0% |
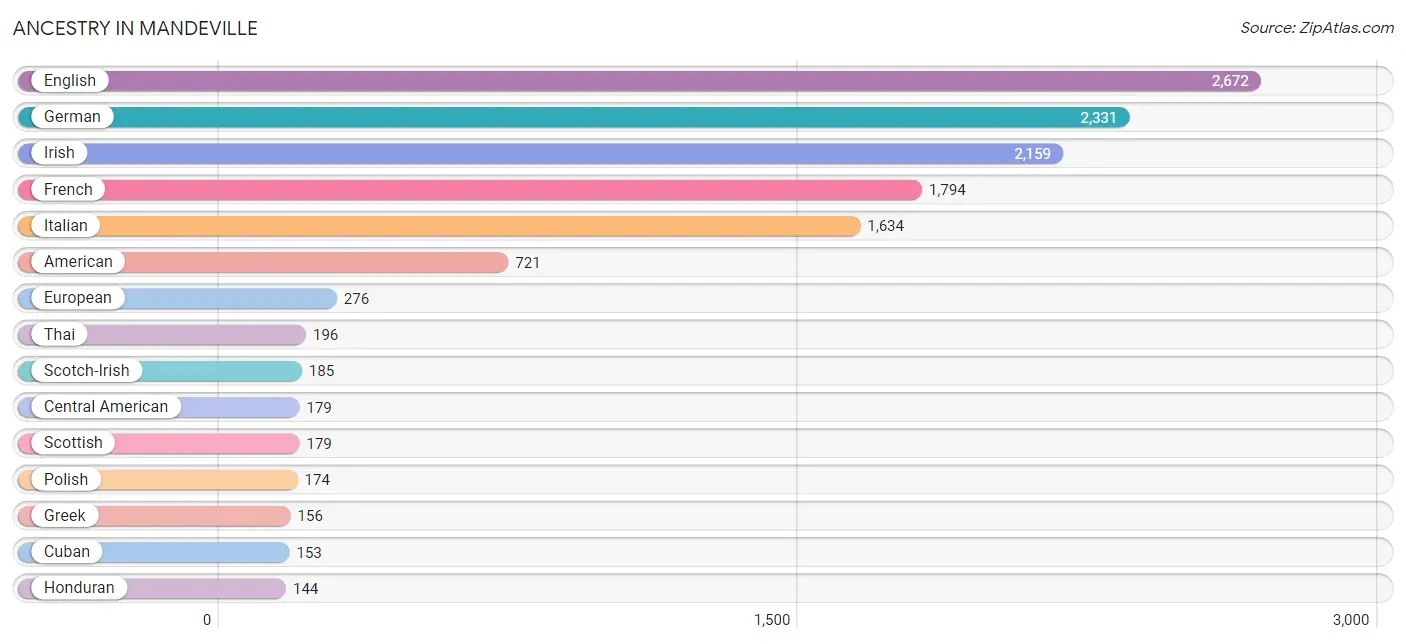
Ancestry in Mandeville
The most populous ancestries reported in Mandeville are English (2,672 | 20.3%), German (2,331 | 17.7%), Irish (2,159 | 16.4%), French (1,794 | 13.6%), and Italian (1,634 | 12.4%), together accounting for 80.3% of all Mandeville residents.
| Ancestry | # Population | % Population |
| American | 721 | 5.5% |
| Austrian | 22 | 0.2% |
| Basque | 21 | 0.2% |
| Bhutanese | 85 | 0.6% |
| Bolivian | 7 | 0.1% |
| British | 38 | 0.3% |
| Cajun | 23 | 0.2% |
| Celtic | 24 | 0.2% |
| Central American | 179 | 1.4% |
| Colombian | 13 | 0.1% |
| Croatian | 17 | 0.1% |
| Cuban | 153 | 1.2% |
| Czech | 23 | 0.2% |
| Czechoslovakian | 15 | 0.1% |
| Danish | 78 | 0.6% |
| Dutch | 45 | 0.3% |
| English | 2,672 | 20.3% |
| European | 276 | 2.1% |
| French | 1,794 | 13.6% |
| French Canadian | 21 | 0.2% |
| German | 2,331 | 17.7% |
| Greek | 156 | 1.2% |
| Guatemalan | 22 | 0.2% |
| Honduran | 144 | 1.1% |
| Houma | 30 | 0.2% |
| Hungarian | 33 | 0.3% |
| Indian (Asian) | 77 | 0.6% |
| Iranian | 2 | 0.0% |
| Irish | 2,159 | 16.4% |
| Italian | 1,634 | 12.4% |
| Korean | 70 | 0.5% |
| Lithuanian | 135 | 1.0% |
| Mexican | 83 | 0.6% |
| Norwegian | 39 | 0.3% |
| Panamanian | 13 | 0.1% |
| Peruvian | 14 | 0.1% |
| Polish | 174 | 1.3% |
| Portuguese | 9 | 0.1% |
| Puerto Rican | 13 | 0.1% |
| Romanian | 50 | 0.4% |
| Russian | 25 | 0.2% |
| Scandinavian | 63 | 0.5% |
| Scotch-Irish | 185 | 1.4% |
| Scottish | 179 | 1.4% |
| Serbian | 48 | 0.4% |
| Slovak | 15 | 0.1% |
| South American | 34 | 0.3% |
| Spaniard | 54 | 0.4% |
| Spanish | 42 | 0.3% |
| Sri Lankan | 93 | 0.7% |
| Swedish | 99 | 0.7% |
| Thai | 196 | 1.5% |
| Welsh | 135 | 1.0% | View All 53 Rows |
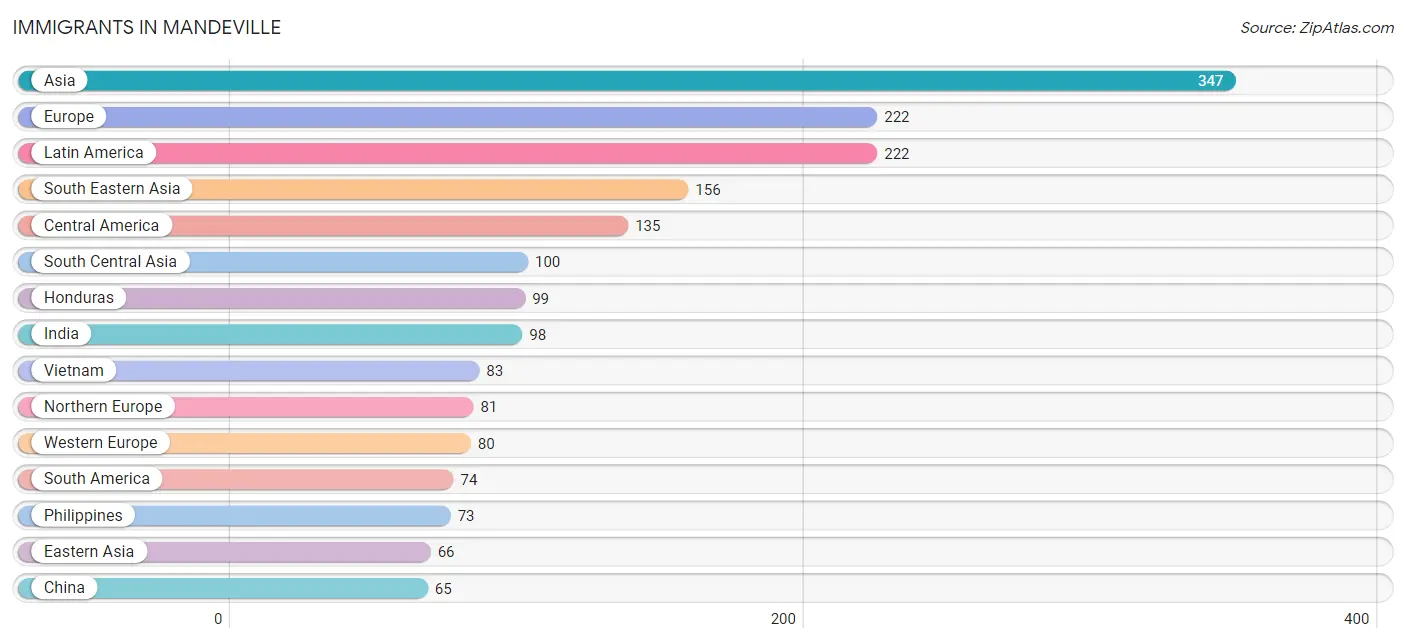
Immigrants in Mandeville
The most numerous immigrant groups reported in Mandeville came from Asia (347 | 2.6%), Europe (222 | 1.7%), Latin America (222 | 1.7%), South Eastern Asia (156 | 1.2%), and Central America (135 | 1.0%), together accounting for 8.2% of all Mandeville residents.
| Immigration Origin | # Population | % Population |
| Argentina | 2 | 0.0% |
| Asia | 347 | 2.6% |
| Australia | 6 | 0.1% |
| Bolivia | 7 | 0.1% |
| Canada | 15 | 0.1% |
| Caribbean | 13 | 0.1% |
| Central America | 135 | 1.0% |
| China | 65 | 0.5% |
| Colombia | 13 | 0.1% |
| Cuba | 13 | 0.1% |
| Eastern Asia | 66 | 0.5% |
| Eastern Europe | 60 | 0.4% |
| England | 27 | 0.2% |
| Europe | 222 | 1.7% |
| France | 45 | 0.3% |
| Germany | 19 | 0.1% |
| Guatemala | 22 | 0.2% |
| Guyana | 52 | 0.4% |
| Honduras | 99 | 0.7% |
| India | 98 | 0.7% |
| Iran | 2 | 0.0% |
| Italy | 1 | 0.0% |
| Japan | 1 | 0.0% |
| Latin America | 222 | 1.7% |
| Lebanon | 25 | 0.2% |
| Mexico | 1 | 0.0% |
| Netherlands | 16 | 0.1% |
| Northern Europe | 81 | 0.6% |
| Oceania | 6 | 0.1% |
| Panama | 13 | 0.1% |
| Philippines | 73 | 0.5% |
| Scotland | 24 | 0.2% |
| Serbia | 60 | 0.4% |
| South America | 74 | 0.6% |
| South Central Asia | 100 | 0.8% |
| South Eastern Asia | 156 | 1.2% |
| Southern Europe | 1 | 0.0% |
| Vietnam | 83 | 0.6% |
| Western Asia | 25 | 0.2% |
| Western Europe | 80 | 0.6% | View All 40 Rows |
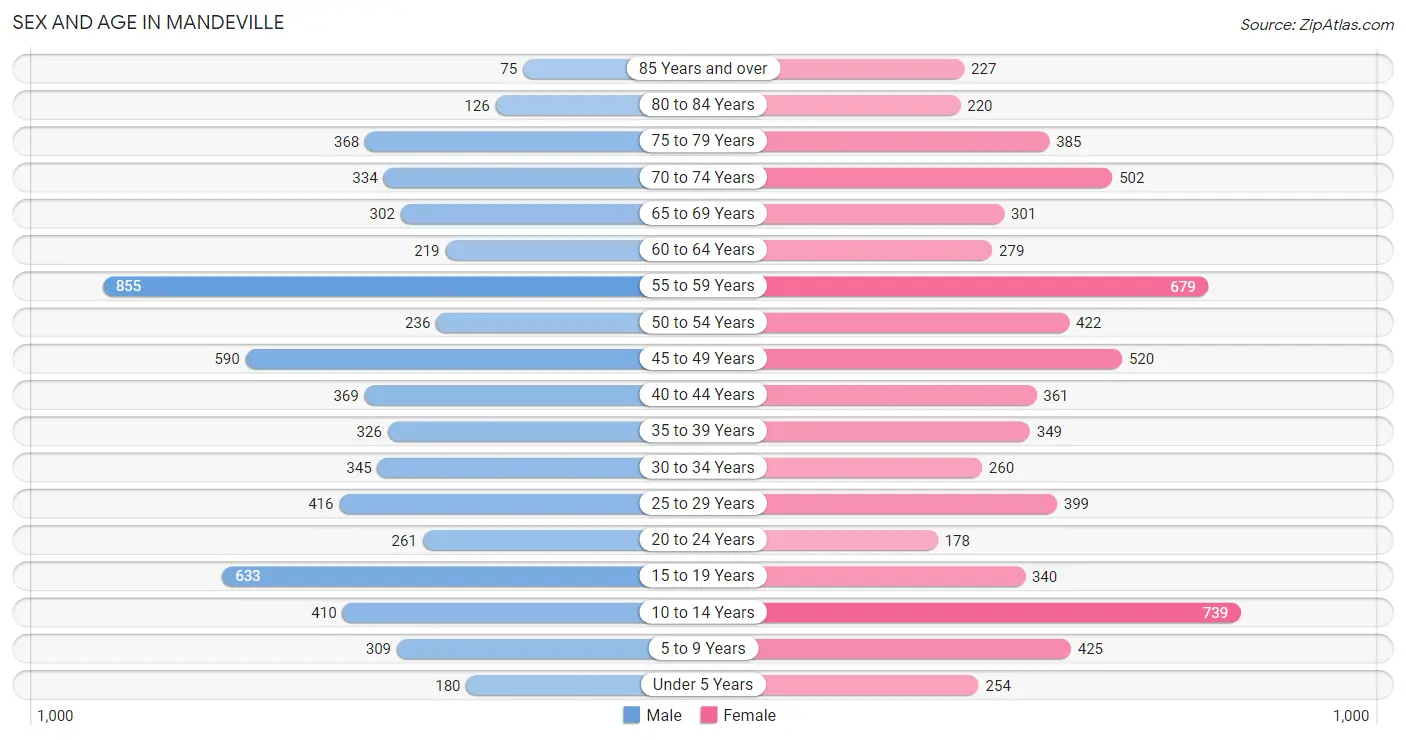
Sex and Age in Mandeville
Sex and Age in Mandeville
The most populous age groups in Mandeville are 55 to 59 Years (855 | 13.5%) for men and 10 to 14 Years (739 | 10.8%) for women.
| Age Bracket | Male | Female |
| Under 5 Years | 180 (2.8%) | 254 (3.7%) |
| 5 to 9 Years | 309 (4.9%) | 425 (6.2%) |
| 10 to 14 Years | 410 (6.5%) | 739 (10.8%) |
| 15 to 19 Years | 633 (10.0%) | 340 (5.0%) |
| 20 to 24 Years | 261 (4.1%) | 178 (2.6%) |
| 25 to 29 Years | 416 (6.6%) | 399 (5.8%) |
| 30 to 34 Years | 345 (5.4%) | 260 (3.8%) |
| 35 to 39 Years | 326 (5.1%) | 349 (5.1%) |
| 40 to 44 Years | 369 (5.8%) | 361 (5.3%) |
| 45 to 49 Years | 590 (9.3%) | 520 (7.6%) |
| 50 to 54 Years | 236 (3.7%) | 422 (6.2%) |
| 55 to 59 Years | 855 (13.5%) | 679 (9.9%) |
| 60 to 64 Years | 219 (3.5%) | 279 (4.1%) |
| 65 to 69 Years | 302 (4.8%) | 301 (4.4%) |
| 70 to 74 Years | 334 (5.3%) | 502 (7.3%) |
| 75 to 79 Years | 368 (5.8%) | 385 (5.6%) |
| 80 to 84 Years | 126 (2.0%) | 220 (3.2%) |
| 85 Years and over | 75 (1.2%) | 227 (3.3%) |
| Total | 6,354 (100.0%) | 6,840 (100.0%) |
Families and Households in Mandeville
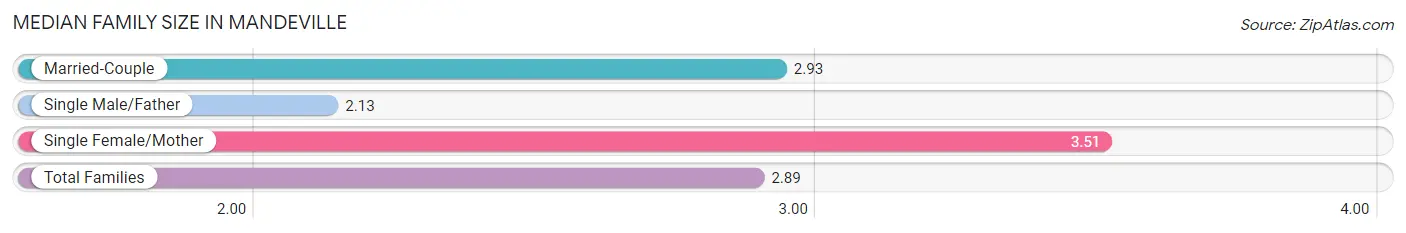
Median Family Size in Mandeville
The median family size in Mandeville is 2.89 persons per family, with single female/mother families (349 | 9.4%) accounting for the largest median family size of 3.51 persons per family. On the other hand, single male/father families (448 | 12.0%) represent the smallest median family size with 2.13 persons per family.
| Family Type | # Families | Family Size |
| Married-Couple | 2,926 (78.6%) | 2.93 |
| Single Male/Father | 448 (12.0%) | 2.13 |
| Single Female/Mother | 349 (9.4%) | 3.51 |
| Total Families | 3,723 (100.0%) | 2.89 |
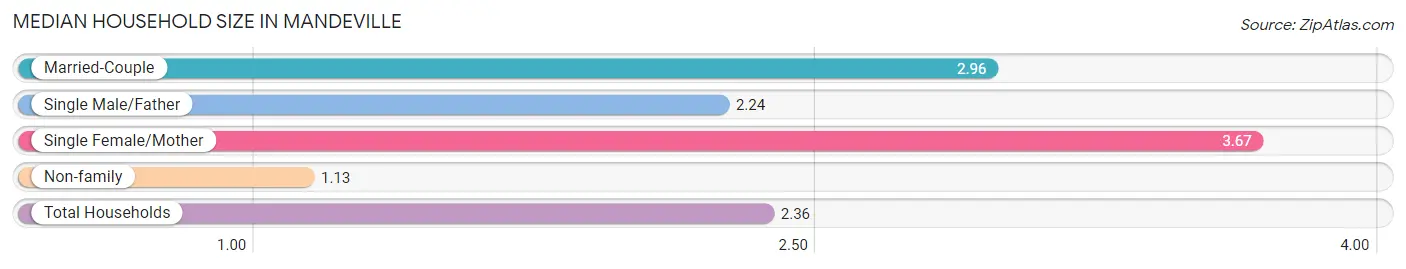
Median Household Size in Mandeville
The median household size in Mandeville is 2.36 persons per household, with single female/mother households (349 | 6.4%) accounting for the largest median household size of 3.67 persons per household. non-family households (1,777 | 32.3%) represent the smallest median household size with 1.13 persons per household.
| Household Type | # Households | Household Size |
| Married-Couple | 2,926 (53.2%) | 2.96 |
| Single Male/Father | 448 (8.2%) | 2.24 |
| Single Female/Mother | 349 (6.4%) | 3.67 |
| Non-family | 1,777 (32.3%) | 1.13 |
| Total Households | 5,500 (100.0%) | 2.36 |
Household Size by Marriage Status in Mandeville
Out of a total of 5,500 households in Mandeville, 3,723 (67.7%) are family households, while 1,777 (32.3%) are nonfamily households. The most numerous type of family households are 2-person households, comprising 1,662, and the most common type of nonfamily households are 1-person households, comprising 1,566.
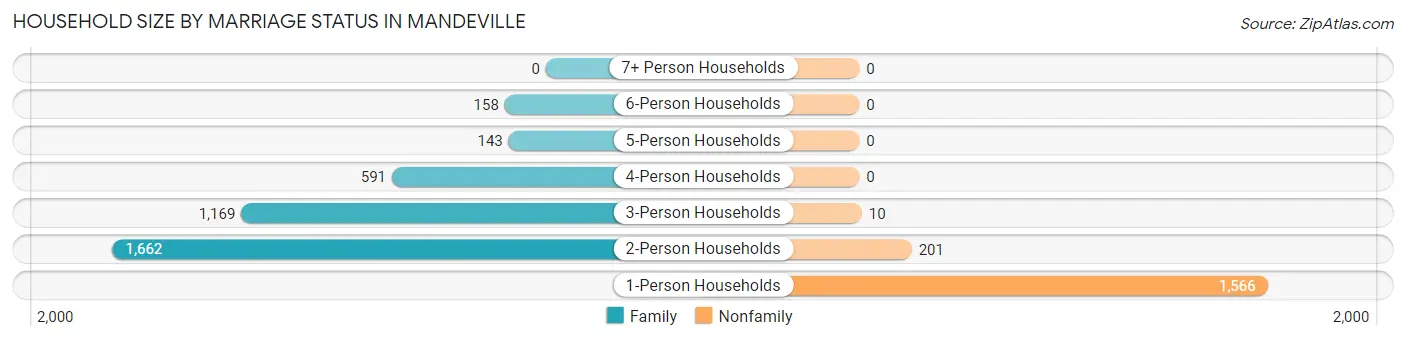
| Household Size | Family Households | Nonfamily Households |
| 1-Person Households | - | 1,566 (28.5%) |
| 2-Person Households | 1,662 (30.2%) | 201 (3.6%) |
| 3-Person Households | 1,169 (21.2%) | 10 (0.2%) |
| 4-Person Households | 591 (10.7%) | 0 (0.0%) |
| 5-Person Households | 143 (2.6%) | 0 (0.0%) |
| 6-Person Households | 158 (2.9%) | 0 (0.0%) |
| 7+ Person Households | 0 (0.0%) | 0 (0.0%) |
| Total | 3,723 (67.7%) | 1,777 (32.3%) |
Female Fertility in Mandeville
Fertility by Age in Mandeville
Average fertility rate in Mandeville is 52.0 births per 1,000 women. Women in the age bracket of 20 to 34 years have the highest fertility rate with 73.0 births per 1,000 women. Women in the age bracket of 35 to 50 years acount for 52.0% of all women with births.
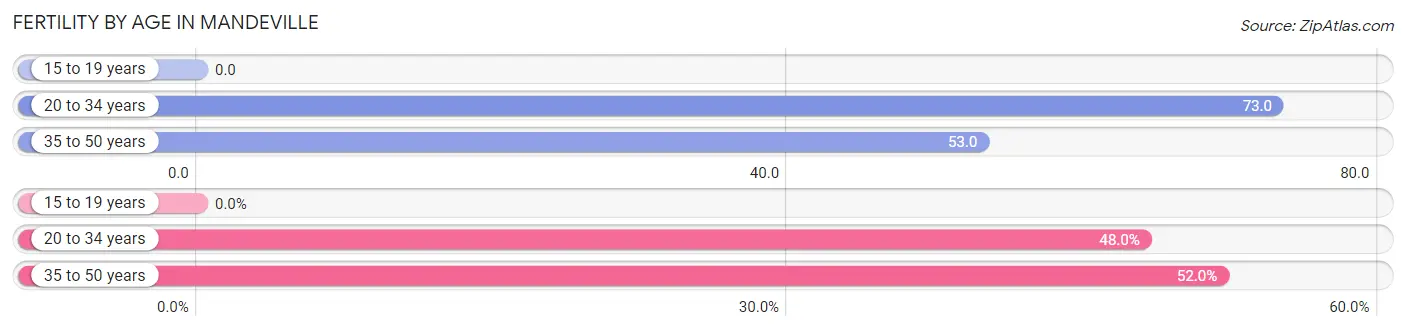
| Age Bracket | Women with Births | Births / 1,000 Women |
| 15 to 19 years | 0 (0.0%) | 0.0 |
| 20 to 34 years | 61 (48.0%) | 73.0 |
| 35 to 50 years | 66 (52.0%) | 53.0 |
| Total | 127 (100.0%) | 52.0 |
Fertility by Age by Marriage Status in Mandeville
86.6% of women with births (127) in Mandeville are married. The highest percentage of unmarried women with births falls into 20 to 34 years age bracket with 27.9% of them unmarried at the time of birth, while the lowest percentage of unmarried women with births belong to 35 to 50 years age bracket with 0.0% of them unmarried.
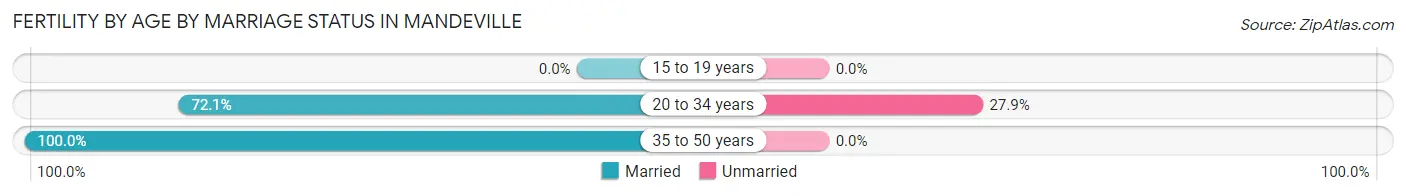
| Age Bracket | Married | Unmarried |
| 15 to 19 years | 0 (0.0%) | 0 (0.0%) |
| 20 to 34 years | 44 (72.1%) | 17 (27.9%) |
| 35 to 50 years | 66 (100.0%) | 0 (0.0%) |
| Total | 110 (86.6%) | 17 (13.4%) |
Fertility by Education in Mandeville
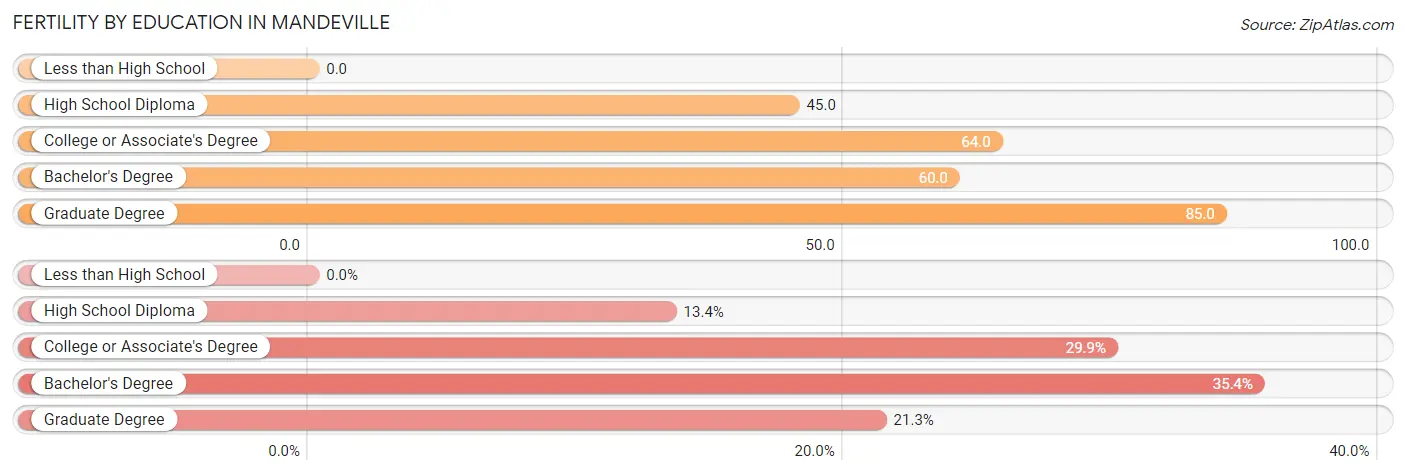
| Educational Attainment | Women with Births | Births / 1,000 Women |
| Less than High School | 0 (0.0%) | 0.0 |
| High School Diploma | 17 (13.4%) | 45.0 |
| College or Associate's Degree | 38 (29.9%) | 64.0 |
| Bachelor's Degree | 45 (35.4%) | 60.0 |
| Graduate Degree | 27 (21.3%) | 85.0 |
| Total | 127 (100.0%) | 52.0 |
Fertility by Education by Marriage Status in Mandeville
13.4% of women with births in Mandeville are unmarried. Women with the educational attainment of college or associate's degree are most likely to be married with 100.0% of them married at childbirth, while women with the educational attainment of high school diploma are least likely to be married with 100.0% of them unmarried at childbirth.
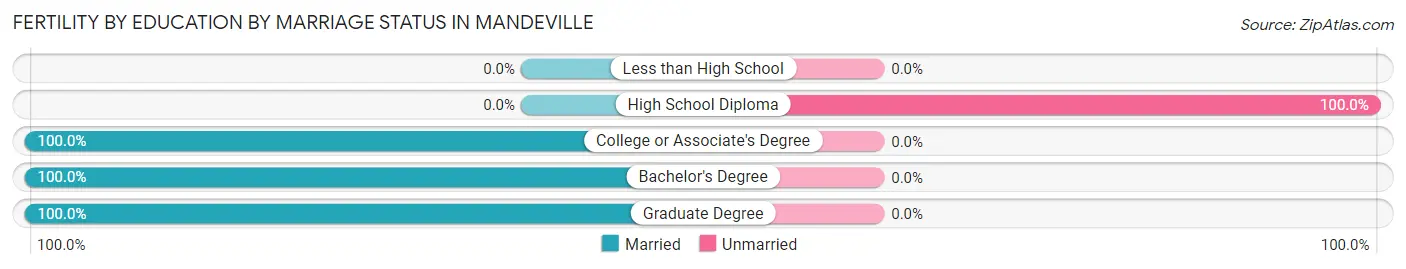
| Educational Attainment | Married | Unmarried |
| Less than High School | 0 (0.0%) | 0 (0.0%) |
| High School Diploma | 0 (0.0%) | 17 (100.0%) |
| College or Associate's Degree | 38 (100.0%) | 0 (0.0%) |
| Bachelor's Degree | 45 (100.0%) | 0 (0.0%) |
| Graduate Degree | 27 (100.0%) | 0 (0.0%) |
| Total | 110 (86.6%) | 17 (13.4%) |
Employment Characteristics in Mandeville
Employment by Class of Employer in Mandeville
Among the 5,969 employed individuals in Mandeville, private company employees (4,165 | 69.8%), self-employed (not incorporated) (574 | 9.6%), and self-employed (incorporated) (322 | 5.4%) make up the most common classes of employment.
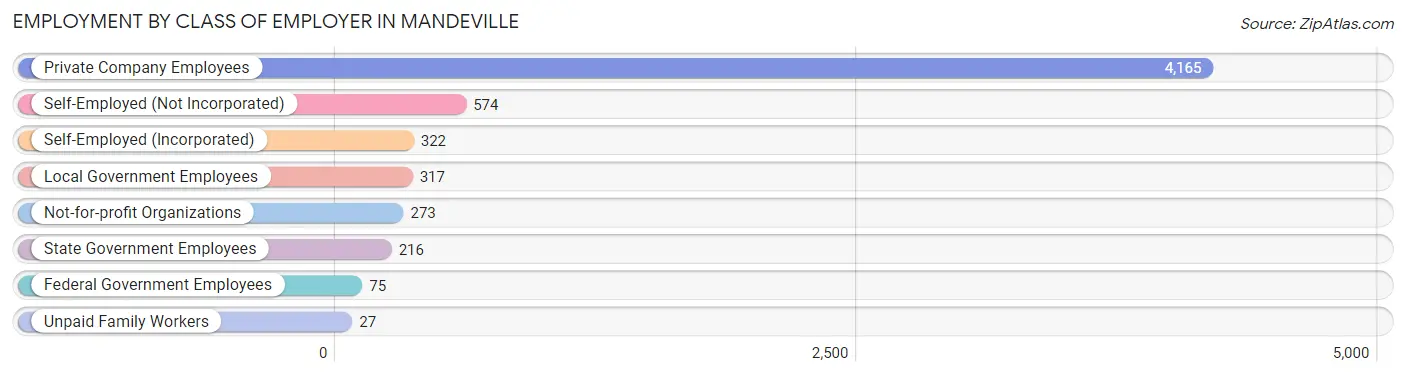
| Employer Class | # Employees | % Employees |
| Private Company Employees | 4,165 | 69.8% |
| Self-Employed (Incorporated) | 322 | 5.4% |
| Self-Employed (Not Incorporated) | 574 | 9.6% |
| Not-for-profit Organizations | 273 | 4.6% |
| Local Government Employees | 317 | 5.3% |
| State Government Employees | 216 | 3.6% |
| Federal Government Employees | 75 | 1.3% |
| Unpaid Family Workers | 27 | 0.4% |
| Total | 5,969 | 100.0% |
Employment Status by Age in Mandeville
According to the labor force statistics for Mandeville, out of the total population over 16 years of age (10,613), 59.1% or 6,272 individuals are in the labor force, with 3.6% or 226 of them unemployed. The age group with the highest labor force participation rate is 30 to 34 years, with 95.9% or 580 individuals in the labor force. Within the labor force, the 16 to 19 years age range has the highest percentage of unemployed individuals, with 40.4% or 86 of them being unemployed.
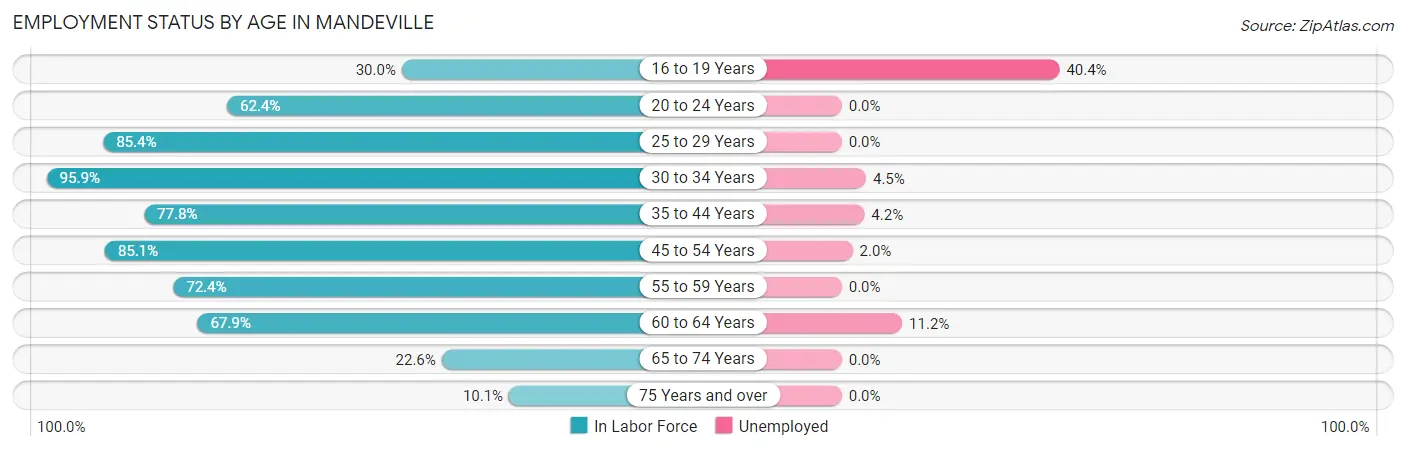
| Age Bracket | In Labor Force | Unemployed |
| 16 to 19 Years | 213 (30.0%) | 86 (40.4%) |
| 20 to 24 Years | 274 (62.4%) | 0 (0.0%) |
| 25 to 29 Years | 696 (85.4%) | 0 (0.0%) |
| 30 to 34 Years | 580 (95.9%) | 26 (4.5%) |
| 35 to 44 Years | 1,093 (77.8%) | 46 (4.2%) |
| 45 to 54 Years | 1,505 (85.1%) | 30 (2.0%) |
| 55 to 59 Years | 1,111 (72.4%) | 0 (0.0%) |
| 60 to 64 Years | 338 (67.9%) | 38 (11.2%) |
| 65 to 74 Years | 325 (22.6%) | 0 (0.0%) |
| 75 Years and over | 142 (10.1%) | 0 (0.0%) |
| Total | 6,272 (59.1%) | 226 (3.6%) |
Employment Status by Educational Attainment in Mandeville
According to labor force statistics for Mandeville, 80.3% of individuals (5,320) out of the total population between 25 and 64 years of age (6,625) are in the labor force, with 2.6% or 138 of them being unemployed. The group with the highest labor force participation rate are those with the educational attainment of bachelor's degree or higher, with 86.1% or 3,032 individuals in the labor force. Within the labor force, individuals with college / associate degree education have the highest percentage of unemployment, with 7.3% or 110 of them being unemployed.
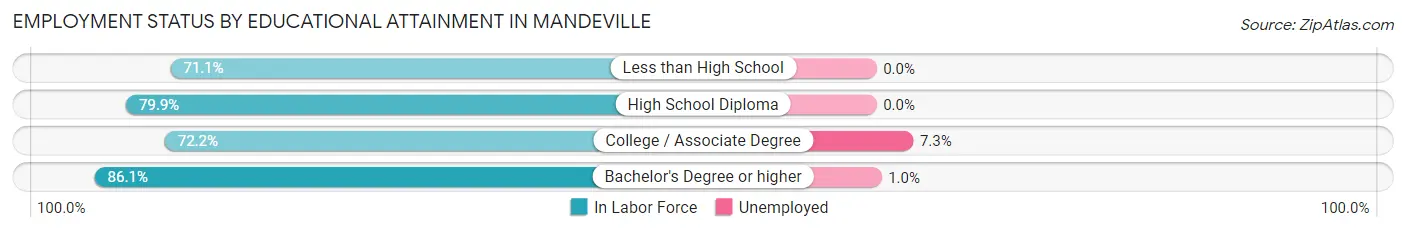
| Educational Attainment | In Labor Force | Unemployed |
| Less than High School | 236 (71.1%) | 0 (0.0%) |
| High School Diploma | 546 (79.9%) | 0 (0.0%) |
| College / Associate Degree | 1,508 (72.2%) | 152 (7.3%) |
| Bachelor's Degree or higher | 3,032 (86.1%) | 35 (1.0%) |
| Total | 5,320 (80.3%) | 172 (2.6%) |
Employment Occupations by Sex in Mandeville
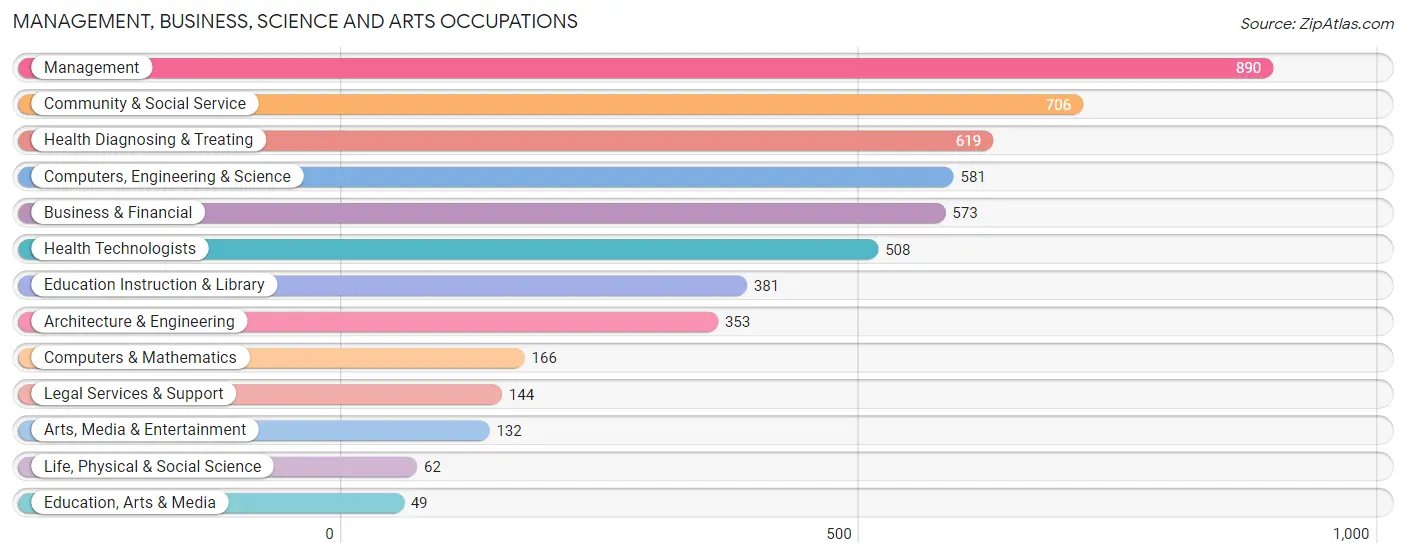
Management, Business, Science and Arts Occupations
The most common Management, Business, Science and Arts occupations in Mandeville are Management (890 | 14.7%), Community & Social Service (706 | 11.7%), Health Diagnosing & Treating (619 | 10.2%), Computers, Engineering & Science (581 | 9.6%), and Business & Financial (573 | 9.5%).
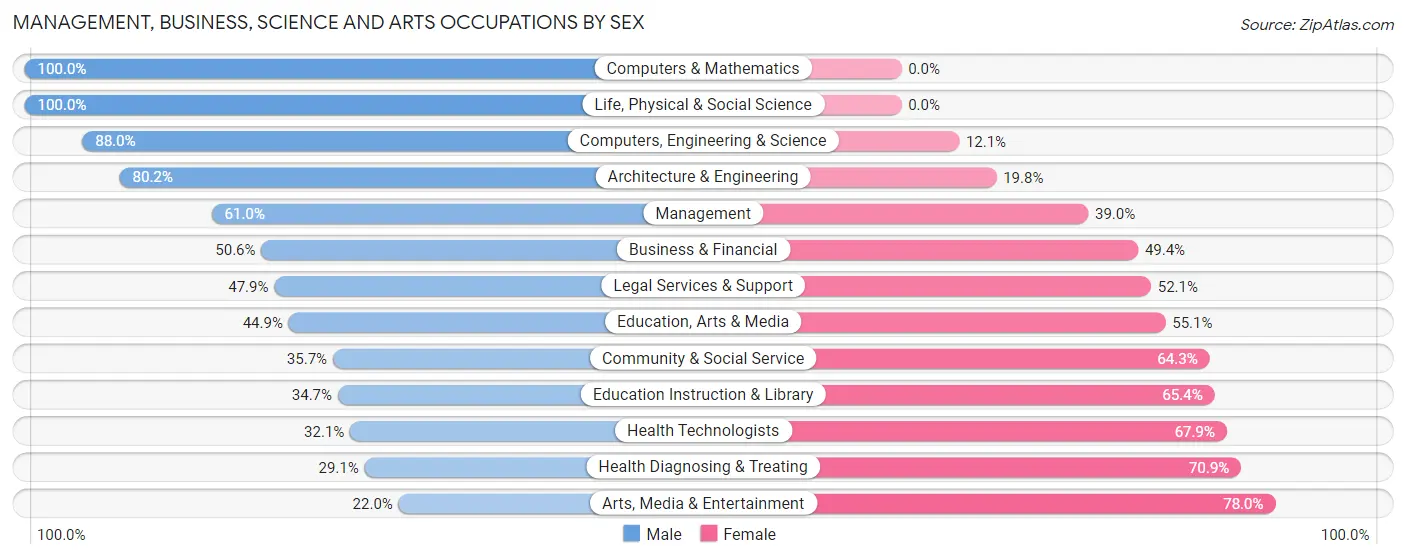
Management, Business, Science and Arts Occupations by Sex
Within the Management, Business, Science and Arts occupations in Mandeville, the most male-oriented occupations are Computers & Mathematics (100.0%), Life, Physical & Social Science (100.0%), and Computers, Engineering & Science (87.9%), while the most female-oriented occupations are Arts, Media & Entertainment (78.0%), Health Diagnosing & Treating (70.9%), and Health Technologists (67.9%).
| Occupation | Male | Female |
| Management | 543 (61.0%) | 347 (39.0%) |
| Business & Financial | 290 (50.6%) | 283 (49.4%) |
| Computers, Engineering & Science | 511 (87.9%) | 70 (12.0%) |
| Computers & Mathematics | 166 (100.0%) | 0 (0.0%) |
| Architecture & Engineering | 283 (80.2%) | 70 (19.8%) |
| Life, Physical & Social Science | 62 (100.0%) | 0 (0.0%) |
| Community & Social Service | 252 (35.7%) | 454 (64.3%) |
| Education, Arts & Media | 22 (44.9%) | 27 (55.1%) |
| Legal Services & Support | 69 (47.9%) | 75 (52.1%) |
| Education Instruction & Library | 132 (34.6%) | 249 (65.3%) |
| Arts, Media & Entertainment | 29 (22.0%) | 103 (78.0%) |
| Health Diagnosing & Treating | 180 (29.1%) | 439 (70.9%) |
| Health Technologists | 163 (32.1%) | 345 (67.9%) |
| Total (Category) | 1,776 (52.7%) | 1,593 (47.3%) |
| Total (Overall) | 3,599 (59.5%) | 2,450 (40.5%) |
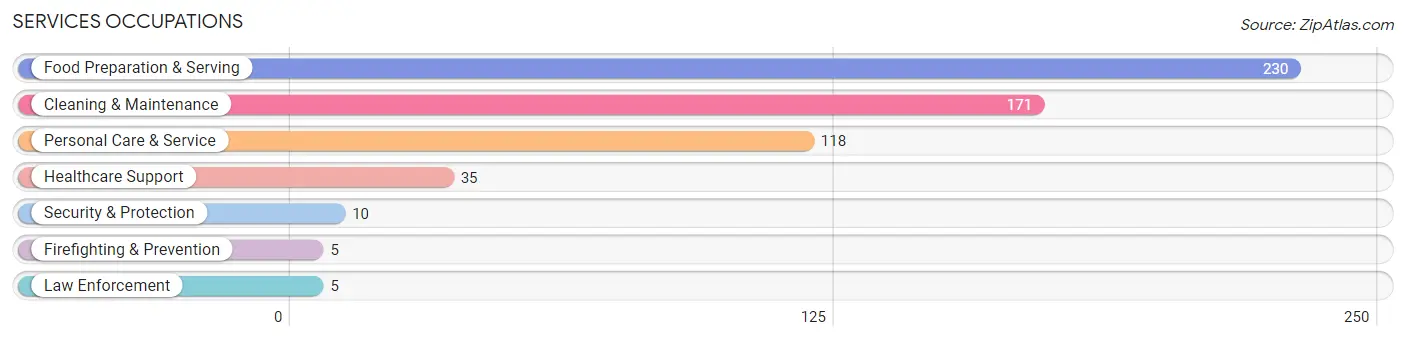
Services Occupations
The most common Services occupations in Mandeville are Food Preparation & Serving (230 | 3.8%), Cleaning & Maintenance (171 | 2.8%), Personal Care & Service (118 | 1.9%), Healthcare Support (35 | 0.6%), and Security & Protection (10 | 0.2%).
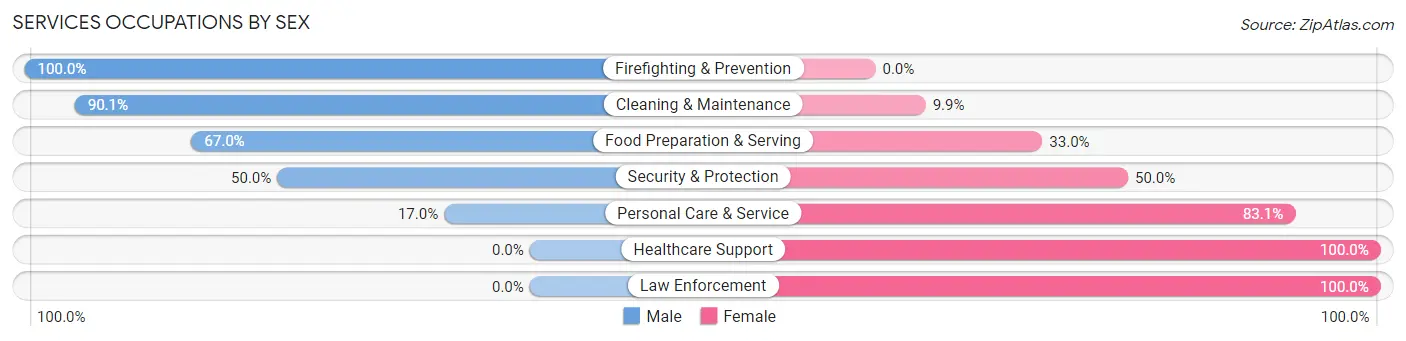
Services Occupations by Sex
Within the Services occupations in Mandeville, the most male-oriented occupations are Firefighting & Prevention (100.0%), Cleaning & Maintenance (90.1%), and Food Preparation & Serving (67.0%), while the most female-oriented occupations are Healthcare Support (100.0%), Law Enforcement (100.0%), and Personal Care & Service (83.1%).
| Occupation | Male | Female |
| Healthcare Support | 0 (0.0%) | 35 (100.0%) |
| Security & Protection | 5 (50.0%) | 5 (50.0%) |
| Firefighting & Prevention | 5 (100.0%) | 0 (0.0%) |
| Law Enforcement | 0 (0.0%) | 5 (100.0%) |
| Food Preparation & Serving | 154 (67.0%) | 76 (33.0%) |
| Cleaning & Maintenance | 154 (90.1%) | 17 (9.9%) |
| Personal Care & Service | 20 (17.0%) | 98 (83.1%) |
| Total (Category) | 333 (59.0%) | 231 (41.0%) |
| Total (Overall) | 3,599 (59.5%) | 2,450 (40.5%) |
Sales and Office Occupations
The most common Sales and Office occupations in Mandeville are Sales & Related (872 | 14.4%), and Office & Administration (420 | 6.9%).

Sales and Office Occupations by Sex
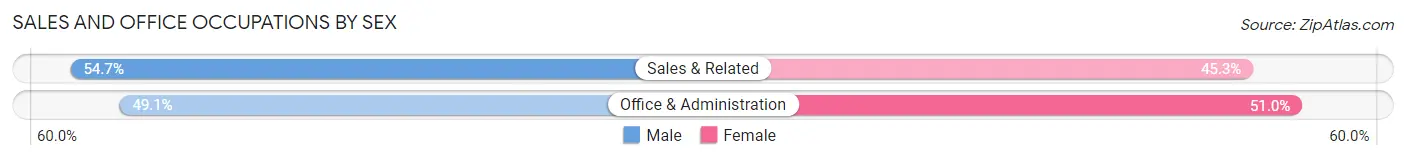
| Occupation | Male | Female |
| Sales & Related | 477 (54.7%) | 395 (45.3%) |
| Office & Administration | 206 (49.0%) | 214 (50.9%) |
| Total (Category) | 683 (52.9%) | 609 (47.1%) |
| Total (Overall) | 3,599 (59.5%) | 2,450 (40.5%) |
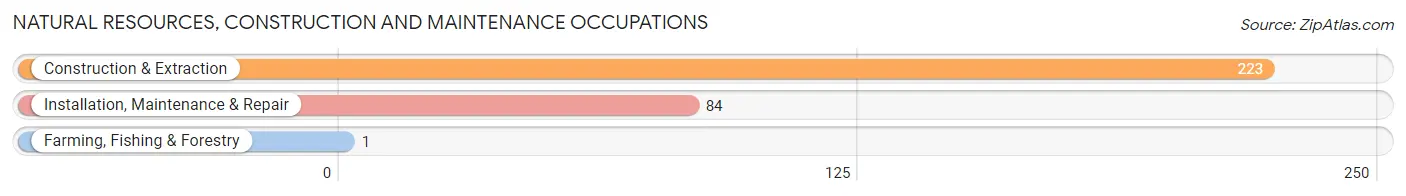
Natural Resources, Construction and Maintenance Occupations
The most common Natural Resources, Construction and Maintenance occupations in Mandeville are Construction & Extraction (223 | 3.7%), Installation, Maintenance & Repair (84 | 1.4%), and Farming, Fishing & Forestry (1 | 0.0%).
Natural Resources, Construction and Maintenance Occupations by Sex
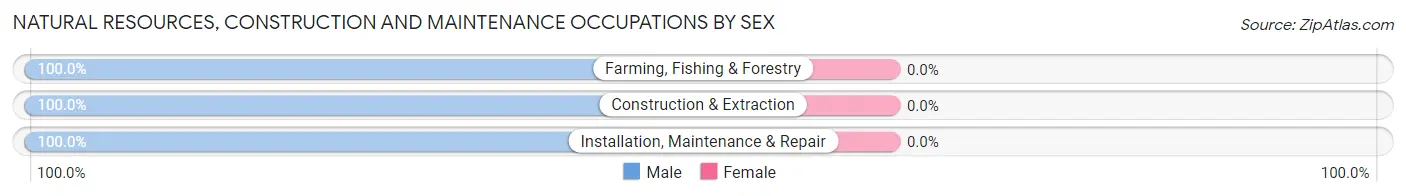
| Occupation | Male | Female |
| Farming, Fishing & Forestry | 1 (100.0%) | 0 (0.0%) |
| Construction & Extraction | 223 (100.0%) | 0 (0.0%) |
| Installation, Maintenance & Repair | 84 (100.0%) | 0 (0.0%) |
| Total (Category) | 308 (100.0%) | 0 (0.0%) |
| Total (Overall) | 3,599 (59.5%) | 2,450 (40.5%) |
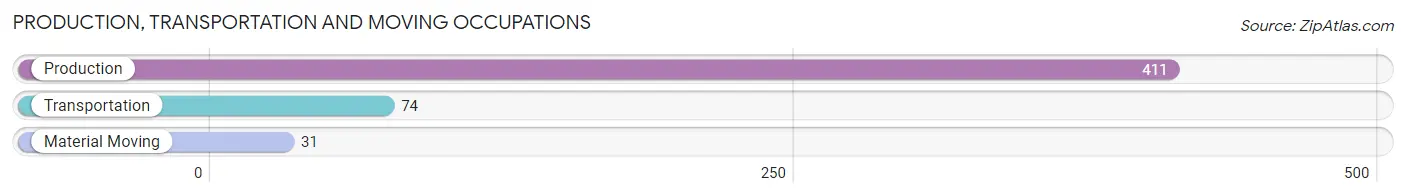
Production, Transportation and Moving Occupations
The most common Production, Transportation and Moving occupations in Mandeville are Production (411 | 6.8%), Transportation (74 | 1.2%), and Material Moving (31 | 0.5%).
Production, Transportation and Moving Occupations by Sex
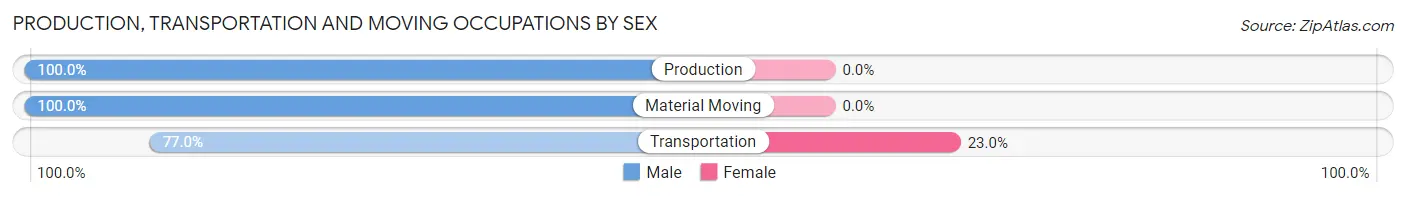
| Occupation | Male | Female |
| Production | 411 (100.0%) | 0 (0.0%) |
| Transportation | 57 (77.0%) | 17 (23.0%) |
| Material Moving | 31 (100.0%) | 0 (0.0%) |
| Total (Category) | 499 (96.7%) | 17 (3.3%) |
| Total (Overall) | 3,599 (59.5%) | 2,450 (40.5%) |
Employment Industries by Sex in Mandeville
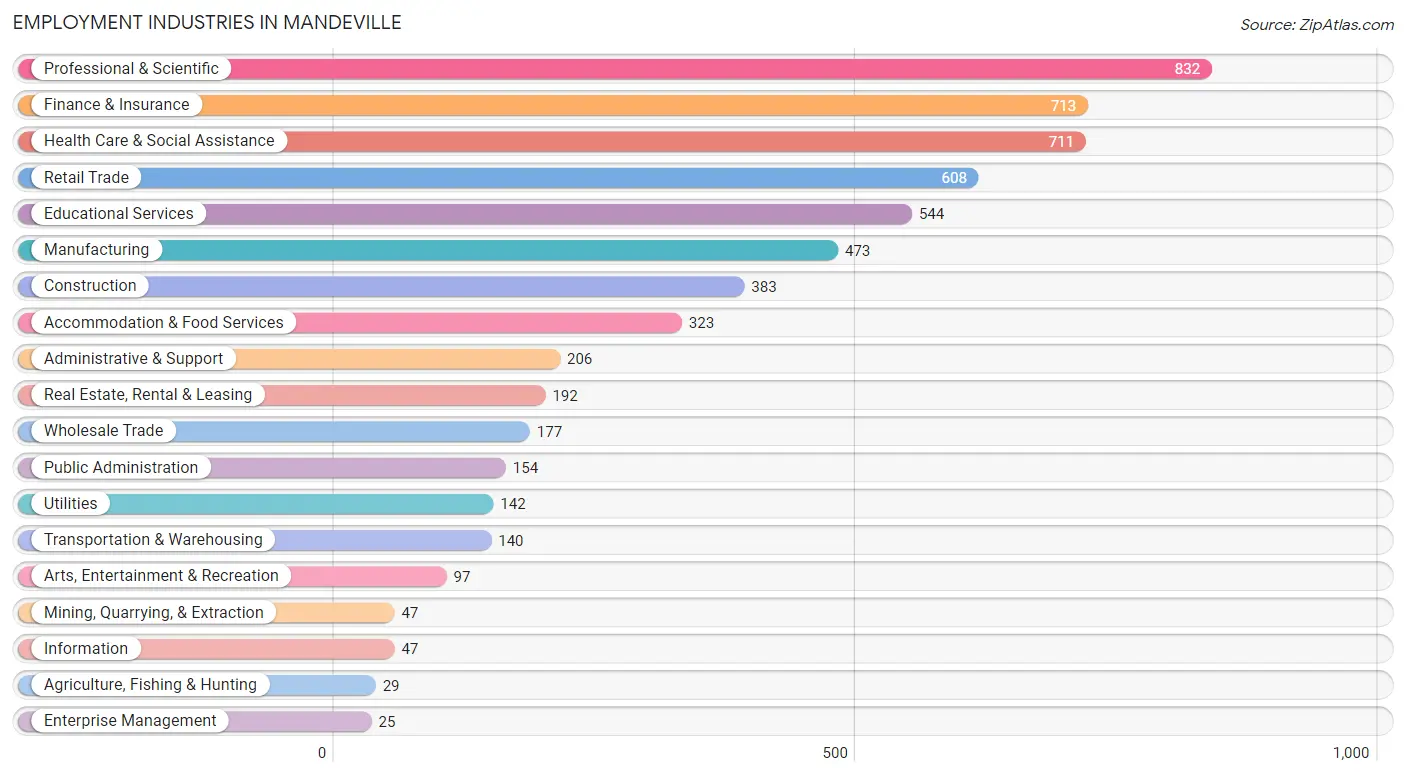
Employment Industries in Mandeville
The major employment industries in Mandeville include Professional & Scientific (832 | 13.8%), Finance & Insurance (713 | 11.8%), Health Care & Social Assistance (711 | 11.7%), Retail Trade (608 | 10.1%), and Educational Services (544 | 9.0%).
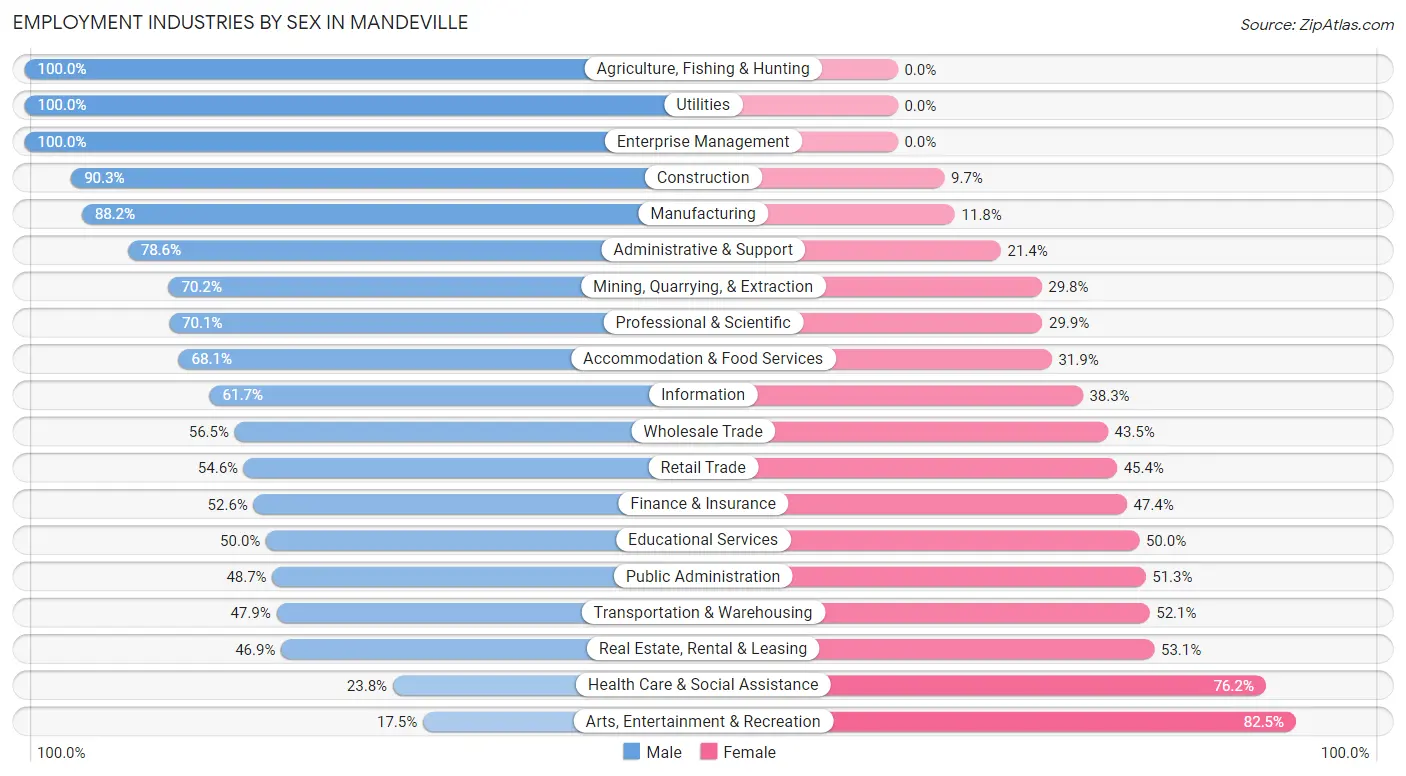
Employment Industries by Sex in Mandeville
The Mandeville industries that see more men than women are Agriculture, Fishing & Hunting (100.0%), Utilities (100.0%), and Enterprise Management (100.0%), whereas the industries that tend to have a higher number of women are Arts, Entertainment & Recreation (82.5%), Health Care & Social Assistance (76.2%), and Real Estate, Rental & Leasing (53.1%).
| Industry | Male | Female |
| Agriculture, Fishing & Hunting | 29 (100.0%) | 0 (0.0%) |
| Mining, Quarrying, & Extraction | 33 (70.2%) | 14 (29.8%) |
| Construction | 346 (90.3%) | 37 (9.7%) |
| Manufacturing | 417 (88.2%) | 56 (11.8%) |
| Wholesale Trade | 100 (56.5%) | 77 (43.5%) |
| Retail Trade | 332 (54.6%) | 276 (45.4%) |
| Transportation & Warehousing | 67 (47.9%) | 73 (52.1%) |
| Utilities | 142 (100.0%) | 0 (0.0%) |
| Information | 29 (61.7%) | 18 (38.3%) |
| Finance & Insurance | 375 (52.6%) | 338 (47.4%) |
| Real Estate, Rental & Leasing | 90 (46.9%) | 102 (53.1%) |
| Professional & Scientific | 583 (70.1%) | 249 (29.9%) |
| Enterprise Management | 25 (100.0%) | 0 (0.0%) |
| Administrative & Support | 162 (78.6%) | 44 (21.4%) |
| Educational Services | 272 (50.0%) | 272 (50.0%) |
| Health Care & Social Assistance | 169 (23.8%) | 542 (76.2%) |
| Arts, Entertainment & Recreation | 17 (17.5%) | 80 (82.5%) |
| Accommodation & Food Services | 220 (68.1%) | 103 (31.9%) |
| Public Administration | 75 (48.7%) | 79 (51.3%) |
| Total | 3,599 (59.5%) | 2,450 (40.5%) |
Education in Mandeville
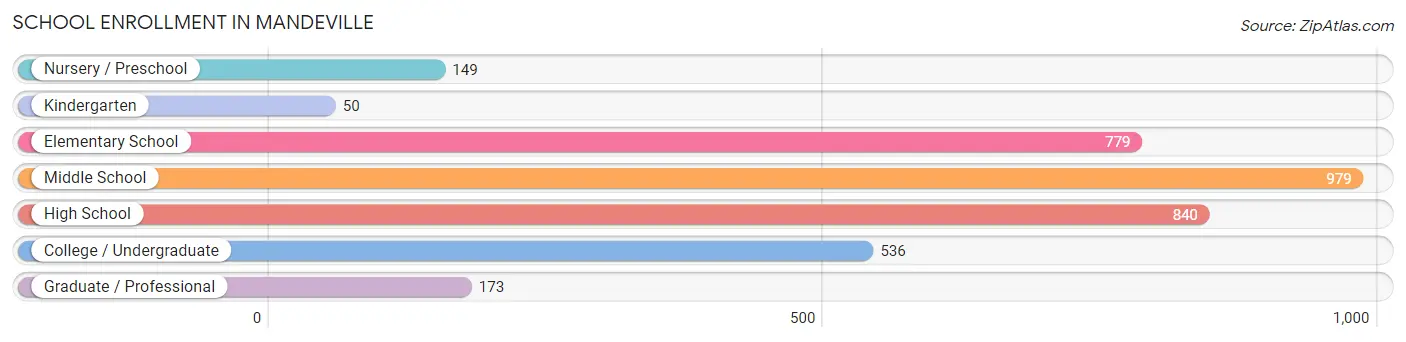
School Enrollment in Mandeville
The most common levels of schooling among the 3,506 students in Mandeville are middle school (979 | 27.9%), high school (840 | 24.0%), and elementary school (779 | 22.2%).
| School Level | # Students | % Students |
| Nursery / Preschool | 149 | 4.3% |
| Kindergarten | 50 | 1.4% |
| Elementary School | 779 | 22.2% |
| Middle School | 979 | 27.9% |
| High School | 840 | 24.0% |
| College / Undergraduate | 536 | 15.3% |
| Graduate / Professional | 173 | 4.9% |
| Total | 3,506 | 100.0% |
School Enrollment by Age by Funding Source in Mandeville
Out of a total of 3,506 students who are enrolled in schools in Mandeville, 1,052 (30.0%) attend a private institution, while the remaining 2,454 (70.0%) are enrolled in public schools. The age group of 5 to 9 year old has the highest likelihood of being enrolled in private schools, with 280 (39.2% in the age bracket) enrolled. Conversely, the age group of 35 years and over has the lowest likelihood of being enrolled in a private school, with 154 (88.5% in the age bracket) attending a public institution.
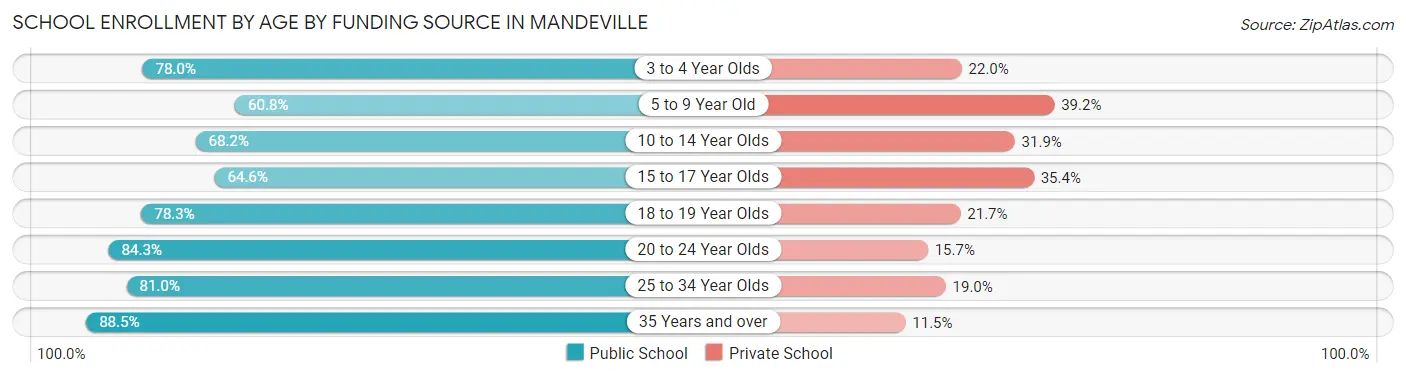
| Age Bracket | Public School | Private School |
| 3 to 4 Year Olds | 103 (78.0%) | 29 (22.0%) |
| 5 to 9 Year Old | 434 (60.8%) | 280 (39.2%) |
| 10 to 14 Year Olds | 781 (68.1%) | 365 (31.9%) |
| 15 to 17 Year Olds | 427 (64.6%) | 234 (35.4%) |
| 18 to 19 Year Olds | 126 (78.3%) | 35 (21.7%) |
| 20 to 24 Year Olds | 237 (84.3%) | 44 (15.7%) |
| 25 to 34 Year Olds | 192 (81.0%) | 45 (19.0%) |
| 35 Years and over | 154 (88.5%) | 20 (11.5%) |
| Total | 2,454 (70.0%) | 1,052 (30.0%) |
Educational Attainment by Field of Study in Mandeville
Business (885 | 17.8%), science & technology (700 | 14.1%), liberal arts & history (511 | 10.3%), engineering (485 | 9.8%), and education (419 | 8.4%) are the most common fields of study among 4,969 individuals in Mandeville who have obtained a bachelor's degree or higher.
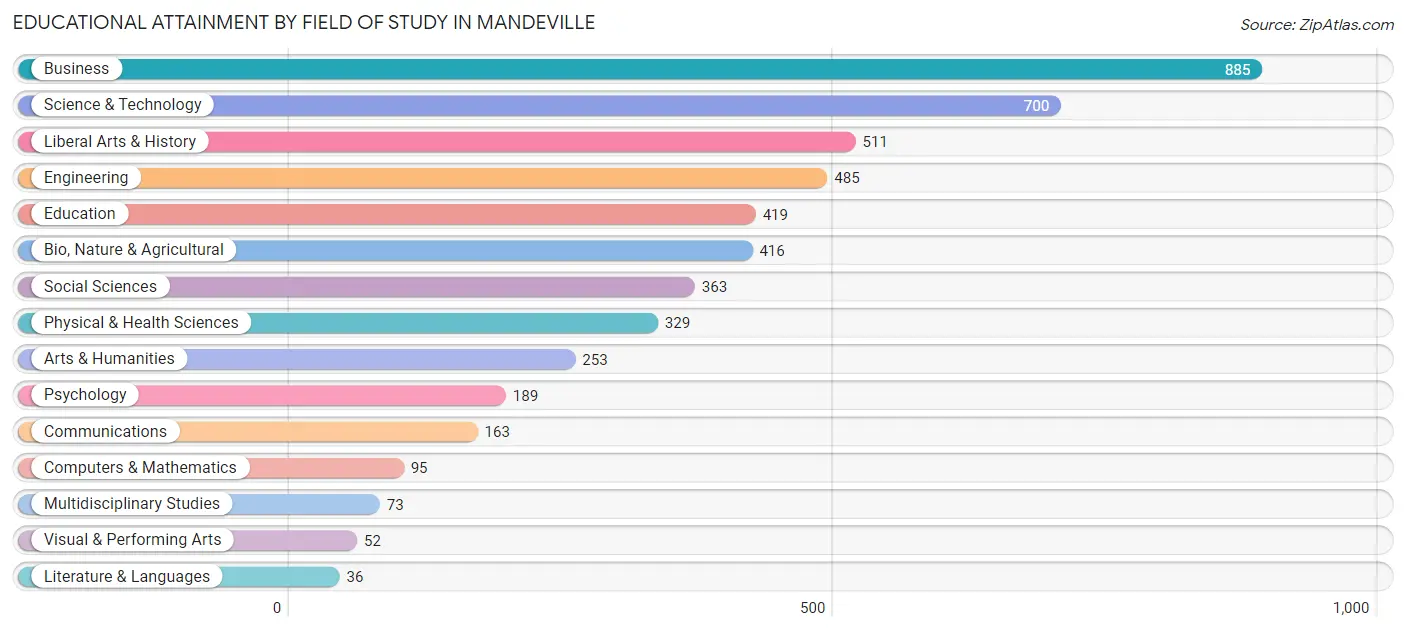
| Field of Study | # Graduates | % Graduates |
| Computers & Mathematics | 95 | 1.9% |
| Bio, Nature & Agricultural | 416 | 8.4% |
| Physical & Health Sciences | 329 | 6.6% |
| Psychology | 189 | 3.8% |
| Social Sciences | 363 | 7.3% |
| Engineering | 485 | 9.8% |
| Multidisciplinary Studies | 73 | 1.5% |
| Science & Technology | 700 | 14.1% |
| Business | 885 | 17.8% |
| Education | 419 | 8.4% |
| Literature & Languages | 36 | 0.7% |
| Liberal Arts & History | 511 | 10.3% |
| Visual & Performing Arts | 52 | 1.1% |
| Communications | 163 | 3.3% |
| Arts & Humanities | 253 | 5.1% |
| Total | 4,969 | 100.0% |
Transportation & Commute in Mandeville
Vehicle Availability by Sex in Mandeville
The most prevalent vehicle ownership categories in Mandeville are males with 2 vehicles (1,576, accounting for 43.9%) and females with 2 vehicles (1,056, making up 66.2%).
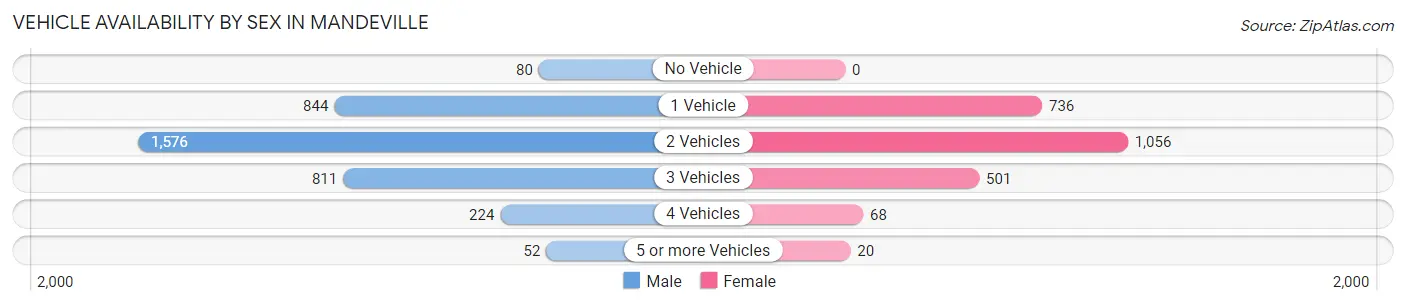
| Vehicles Available | Male | Female |
| No Vehicle | 80 (2.2%) | 0 (0.0%) |
| 1 Vehicle | 844 (23.5%) | 736 (30.9%) |
| 2 Vehicles | 1,576 (43.9%) | 1,056 (44.4%) |
| 3 Vehicles | 811 (22.6%) | 501 (21.0%) |
| 4 Vehicles | 224 (6.2%) | 68 (2.9%) |
| 5 or more Vehicles | 52 (1.5%) | 20 (0.8%) |
| Total | 3,587 (100.0%) | 2,381 (100.0%) |
Commute Time in Mandeville
The most frequently occuring commute durations in Mandeville are 15 to 19 minutes (1,024 commuters, 20.5%), 30 to 34 minutes (685 commuters, 13.7%), and 45 to 59 minutes (677 commuters, 13.6%).
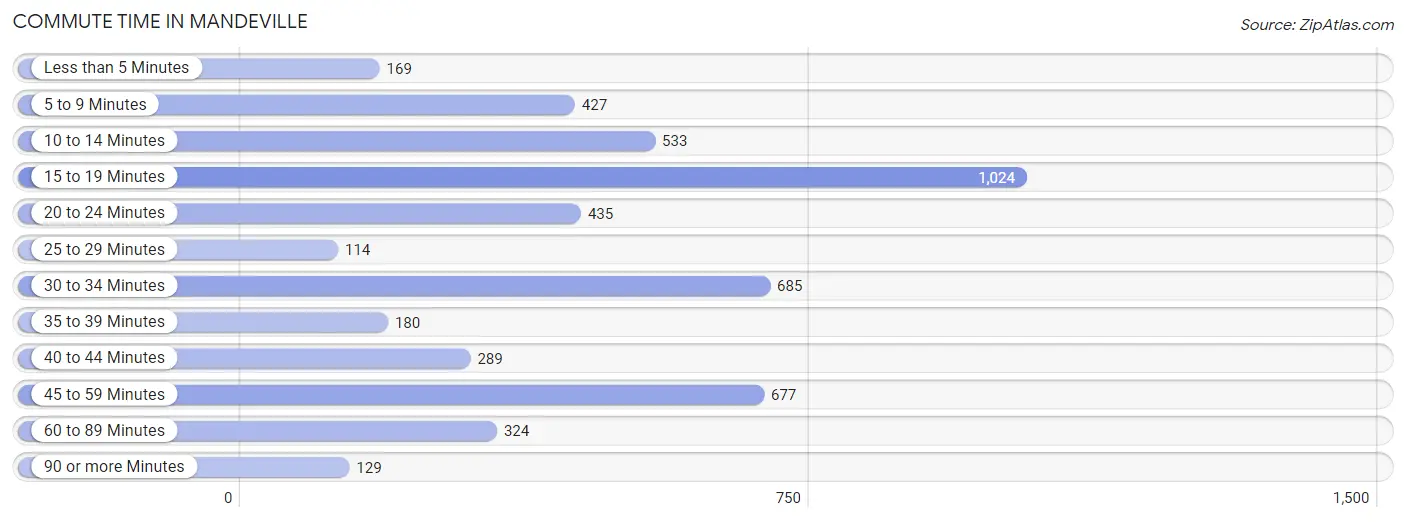
| Commute Time | # Commuters | % Commuters |
| Less than 5 Minutes | 169 | 3.4% |
| 5 to 9 Minutes | 427 | 8.6% |
| 10 to 14 Minutes | 533 | 10.7% |
| 15 to 19 Minutes | 1,024 | 20.5% |
| 20 to 24 Minutes | 435 | 8.7% |
| 25 to 29 Minutes | 114 | 2.3% |
| 30 to 34 Minutes | 685 | 13.7% |
| 35 to 39 Minutes | 180 | 3.6% |
| 40 to 44 Minutes | 289 | 5.8% |
| 45 to 59 Minutes | 677 | 13.6% |
| 60 to 89 Minutes | 324 | 6.5% |
| 90 or more Minutes | 129 | 2.6% |
Commute Time by Sex in Mandeville
The most common commute times in Mandeville are 15 to 19 minutes (677 commuters, 21.5%) for males and 10 to 14 minutes (384 commuters, 20.9%) for females.
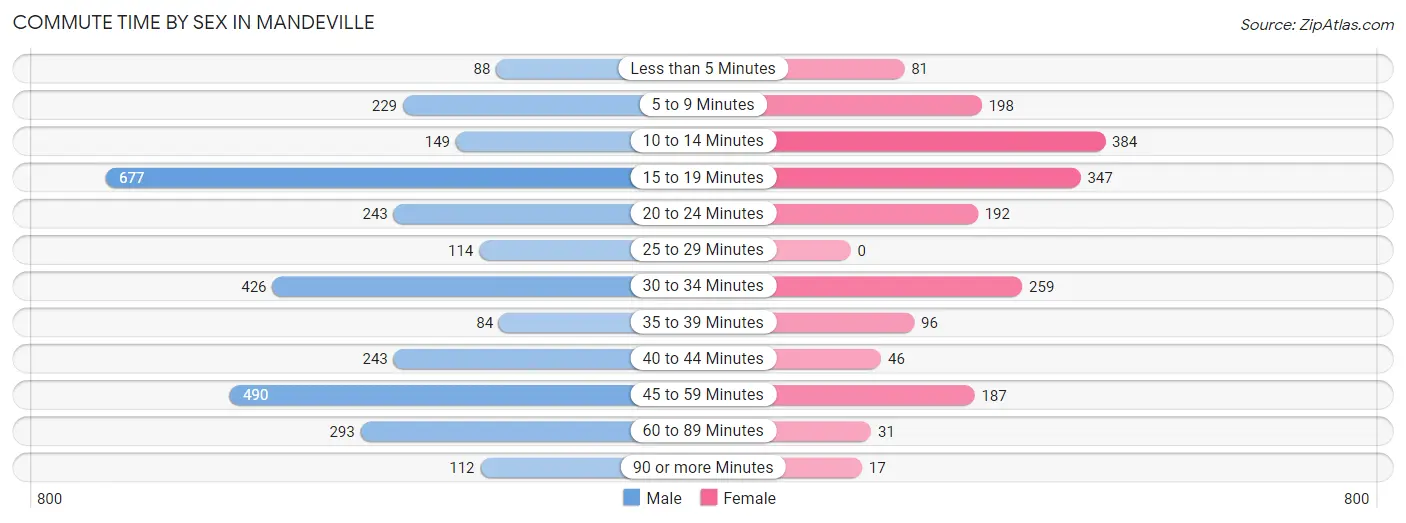
| Commute Time | Male | Female |
| Less than 5 Minutes | 88 (2.8%) | 81 (4.4%) |
| 5 to 9 Minutes | 229 (7.3%) | 198 (10.8%) |
| 10 to 14 Minutes | 149 (4.7%) | 384 (20.9%) |
| 15 to 19 Minutes | 677 (21.5%) | 347 (18.9%) |
| 20 to 24 Minutes | 243 (7.7%) | 192 (10.4%) |
| 25 to 29 Minutes | 114 (3.6%) | 0 (0.0%) |
| 30 to 34 Minutes | 426 (13.5%) | 259 (14.1%) |
| 35 to 39 Minutes | 84 (2.7%) | 96 (5.2%) |
| 40 to 44 Minutes | 243 (7.7%) | 46 (2.5%) |
| 45 to 59 Minutes | 490 (15.6%) | 187 (10.2%) |
| 60 to 89 Minutes | 293 (9.3%) | 31 (1.7%) |
| 90 or more Minutes | 112 (3.6%) | 17 (0.9%) |
Time of Departure to Work by Sex in Mandeville
The most frequent times of departure to work in Mandeville are 7:30 AM to 7:59 AM (661, 21.0%) for males and 8:00 AM to 8:29 AM (366, 19.9%) for females.
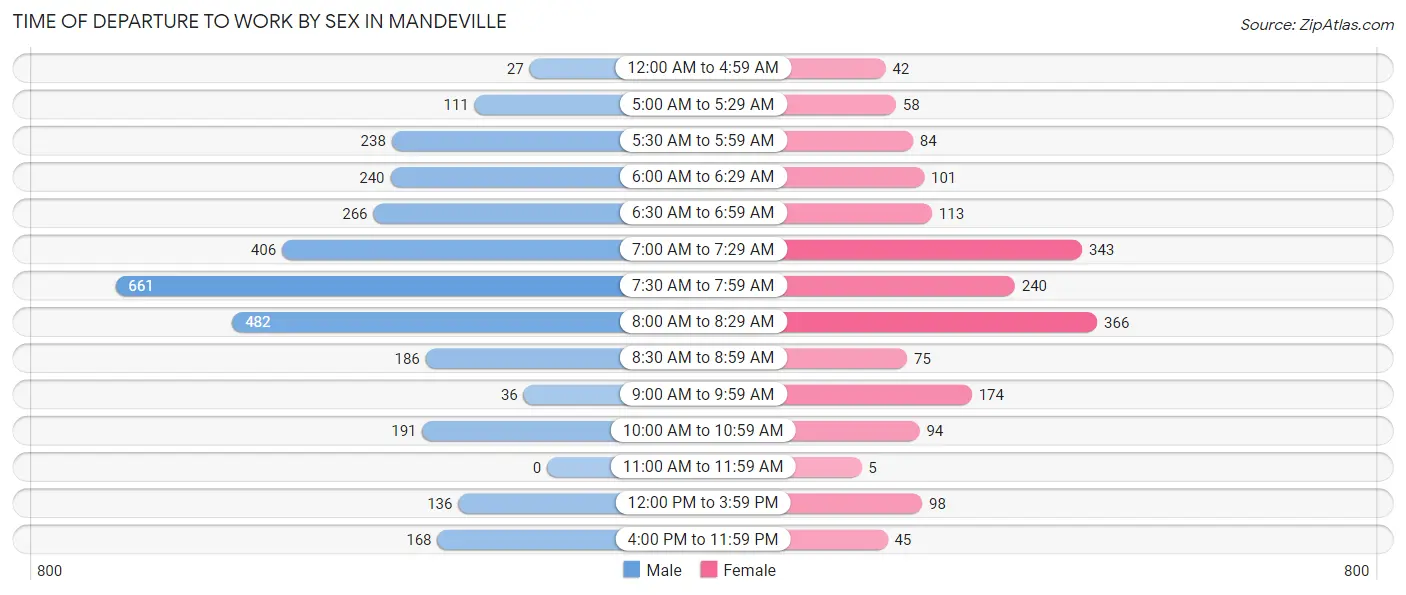
| Time of Departure | Male | Female |
| 12:00 AM to 4:59 AM | 27 (0.9%) | 42 (2.3%) |
| 5:00 AM to 5:29 AM | 111 (3.5%) | 58 (3.2%) |
| 5:30 AM to 5:59 AM | 238 (7.6%) | 84 (4.6%) |
| 6:00 AM to 6:29 AM | 240 (7.6%) | 101 (5.5%) |
| 6:30 AM to 6:59 AM | 266 (8.5%) | 113 (6.1%) |
| 7:00 AM to 7:29 AM | 406 (12.9%) | 343 (18.7%) |
| 7:30 AM to 7:59 AM | 661 (21.0%) | 240 (13.1%) |
| 8:00 AM to 8:29 AM | 482 (15.3%) | 366 (19.9%) |
| 8:30 AM to 8:59 AM | 186 (5.9%) | 75 (4.1%) |
| 9:00 AM to 9:59 AM | 36 (1.1%) | 174 (9.5%) |
| 10:00 AM to 10:59 AM | 191 (6.1%) | 94 (5.1%) |
| 11:00 AM to 11:59 AM | 0 (0.0%) | 5 (0.3%) |
| 12:00 PM to 3:59 PM | 136 (4.3%) | 98 (5.3%) |
| 4:00 PM to 11:59 PM | 168 (5.3%) | 45 (2.5%) |
| Total | 3,148 (100.0%) | 1,838 (100.0%) |
Housing Occupancy in Mandeville
Occupancy by Ownership in Mandeville
Of the total 5,500 dwellings in Mandeville, owner-occupied units account for 3,791 (68.9%), while renter-occupied units make up 1,709 (31.1%).
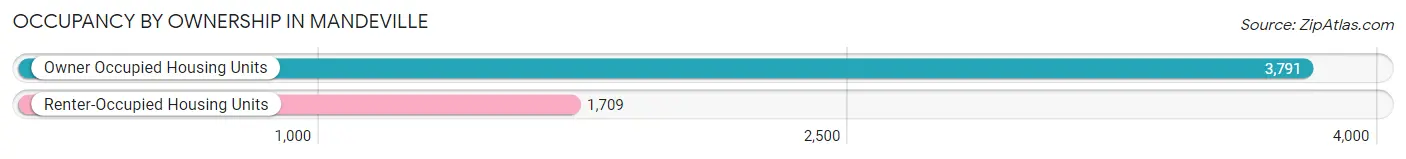
| Occupancy | # Housing Units | % Housing Units |
| Owner Occupied Housing Units | 3,791 | 68.9% |
| Renter-Occupied Housing Units | 1,709 | 31.1% |
| Total Occupied Housing Units | 5,500 | 100.0% |
Occupancy by Household Size in Mandeville
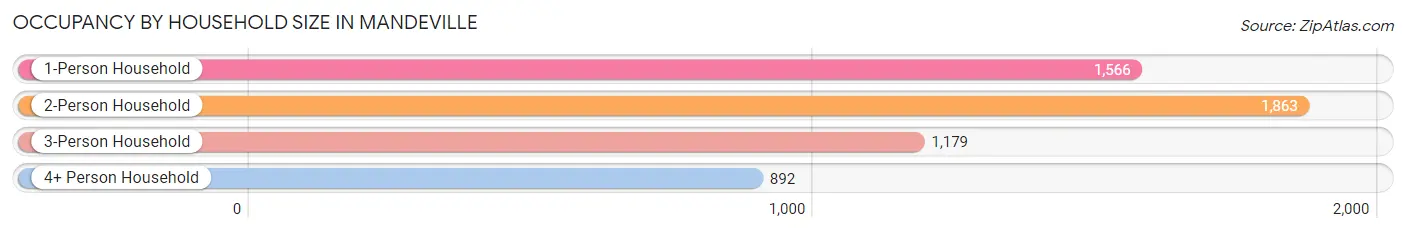
| Household Size | # Housing Units | % Housing Units |
| 1-Person Household | 1,566 | 28.5% |
| 2-Person Household | 1,863 | 33.9% |
| 3-Person Household | 1,179 | 21.4% |
| 4+ Person Household | 892 | 16.2% |
| Total Housing Units | 5,500 | 100.0% |
Occupancy by Ownership by Household Size in Mandeville
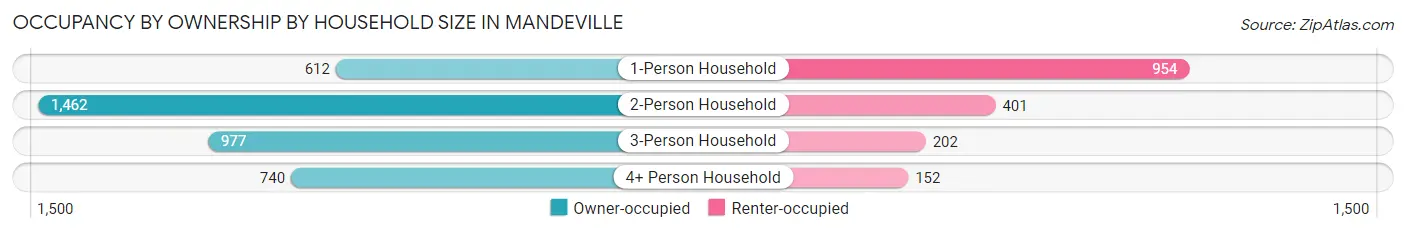
| Household Size | Owner-occupied | Renter-occupied |
| 1-Person Household | 612 (39.1%) | 954 (60.9%) |
| 2-Person Household | 1,462 (78.5%) | 401 (21.5%) |
| 3-Person Household | 977 (82.9%) | 202 (17.1%) |
| 4+ Person Household | 740 (83.0%) | 152 (17.0%) |
| Total Housing Units | 3,791 (68.9%) | 1,709 (31.1%) |
Occupancy by Educational Attainment in Mandeville
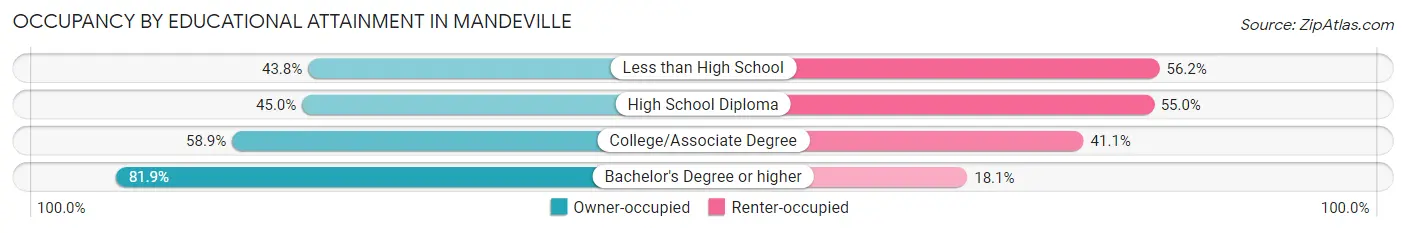
| Household Size | Owner-occupied | Renter-occupied |
| Less than High School | 92 (43.8%) | 118 (56.2%) |
| High School Diploma | 291 (45.0%) | 356 (55.0%) |
| College/Associate Degree | 1,010 (58.9%) | 706 (41.1%) |
| Bachelor's Degree or higher | 2,398 (81.9%) | 529 (18.1%) |
Occupancy by Age of Householder in Mandeville
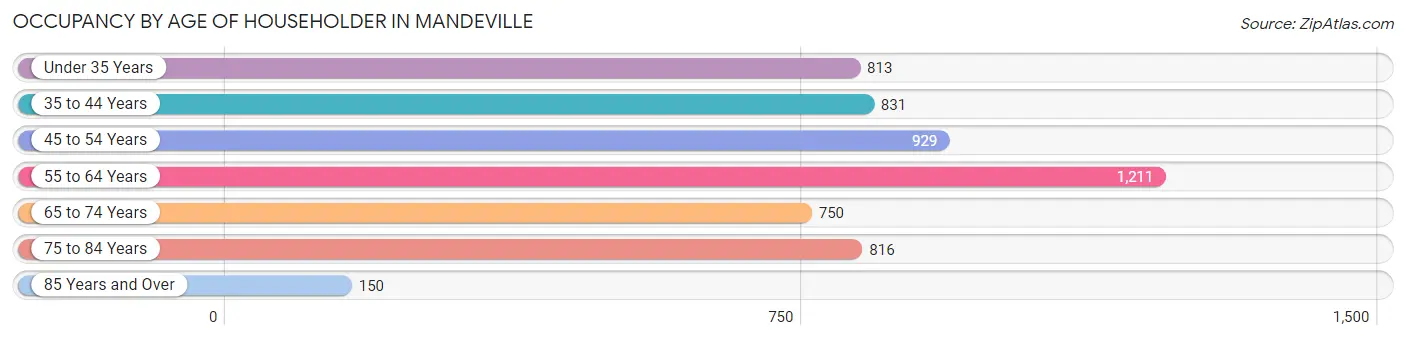
| Age Bracket | # Households | % Households |
| Under 35 Years | 813 | 14.8% |
| 35 to 44 Years | 831 | 15.1% |
| 45 to 54 Years | 929 | 16.9% |
| 55 to 64 Years | 1,211 | 22.0% |
| 65 to 74 Years | 750 | 13.6% |
| 75 to 84 Years | 816 | 14.8% |
| 85 Years and Over | 150 | 2.7% |
| Total | 5,500 | 100.0% |
Housing Finances in Mandeville
Median Income by Occupancy in Mandeville
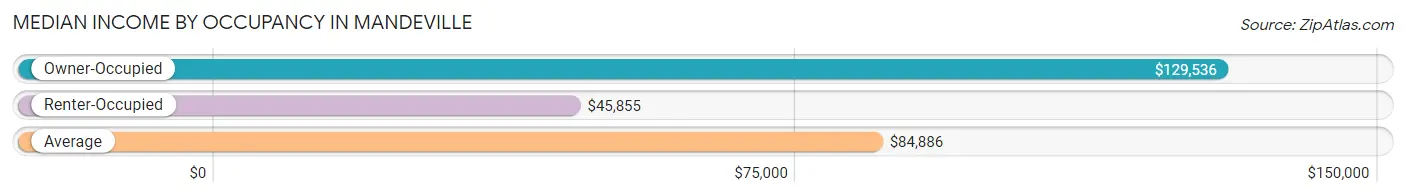
| Occupancy Type | # Households | Median Income |
| Owner-Occupied | 3,791 (68.9%) | $129,536 |
| Renter-Occupied | 1,709 (31.1%) | $45,855 |
| Average | 5,500 (100.0%) | $84,886 |
Occupancy by Householder Income Bracket in Mandeville
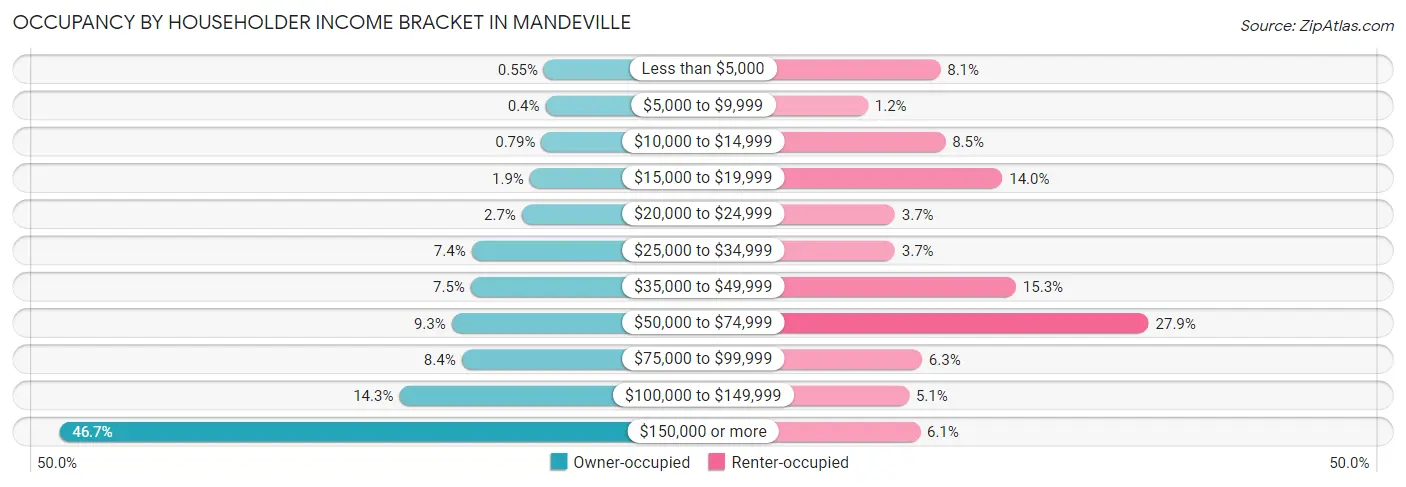
| Income Bracket | Owner-occupied | Renter-occupied |
| Less than $5,000 | 21 (0.5%) | 138 (8.1%) |
| $5,000 to $9,999 | 15 (0.4%) | 20 (1.2%) |
| $10,000 to $14,999 | 30 (0.8%) | 146 (8.5%) |
| $15,000 to $19,999 | 72 (1.9%) | 239 (14.0%) |
| $20,000 to $24,999 | 101 (2.7%) | 64 (3.7%) |
| $25,000 to $34,999 | 282 (7.4%) | 64 (3.7%) |
| $35,000 to $49,999 | 285 (7.5%) | 261 (15.3%) |
| $50,000 to $74,999 | 354 (9.3%) | 477 (27.9%) |
| $75,000 to $99,999 | 318 (8.4%) | 108 (6.3%) |
| $100,000 to $149,999 | 543 (14.3%) | 87 (5.1%) |
| $150,000 or more | 1,770 (46.7%) | 105 (6.1%) |
| Total | 3,791 (100.0%) | 1,709 (100.0%) |
Monthly Housing Cost Tiers in Mandeville
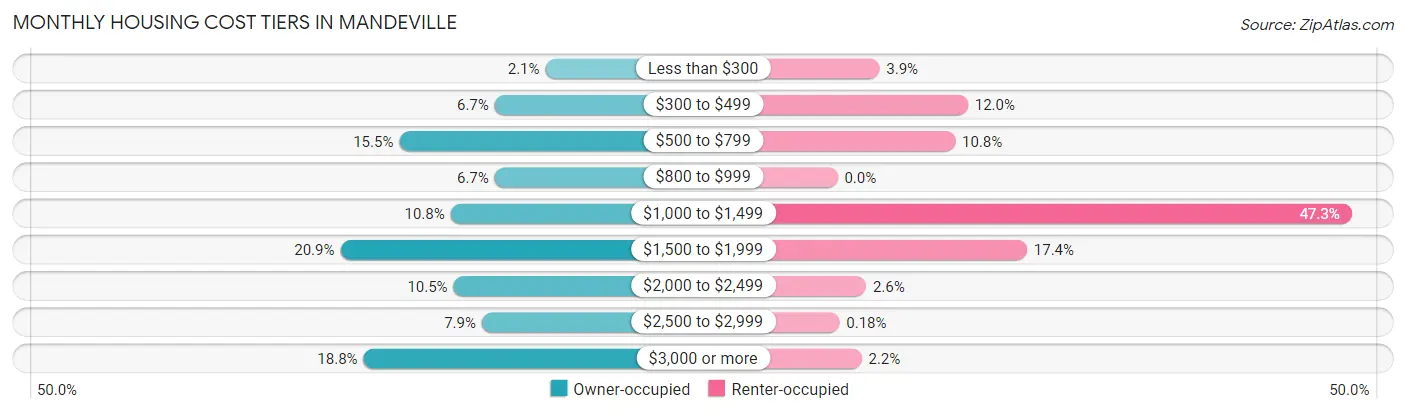
| Monthly Cost | Owner-occupied | Renter-occupied |
| Less than $300 | 78 (2.1%) | 66 (3.9%) |
| $300 to $499 | 255 (6.7%) | 205 (12.0%) |
| $500 to $799 | 588 (15.5%) | 185 (10.8%) |
| $800 to $999 | 255 (6.7%) | 0 (0.0%) |
| $1,000 to $1,499 | 409 (10.8%) | 809 (47.3%) |
| $1,500 to $1,999 | 794 (20.9%) | 298 (17.4%) |
| $2,000 to $2,499 | 399 (10.5%) | 45 (2.6%) |
| $2,500 to $2,999 | 300 (7.9%) | 3 (0.2%) |
| $3,000 or more | 713 (18.8%) | 38 (2.2%) |
| Total | 3,791 (100.0%) | 1,709 (100.0%) |
Physical Housing Characteristics in Mandeville
Housing Structures in Mandeville
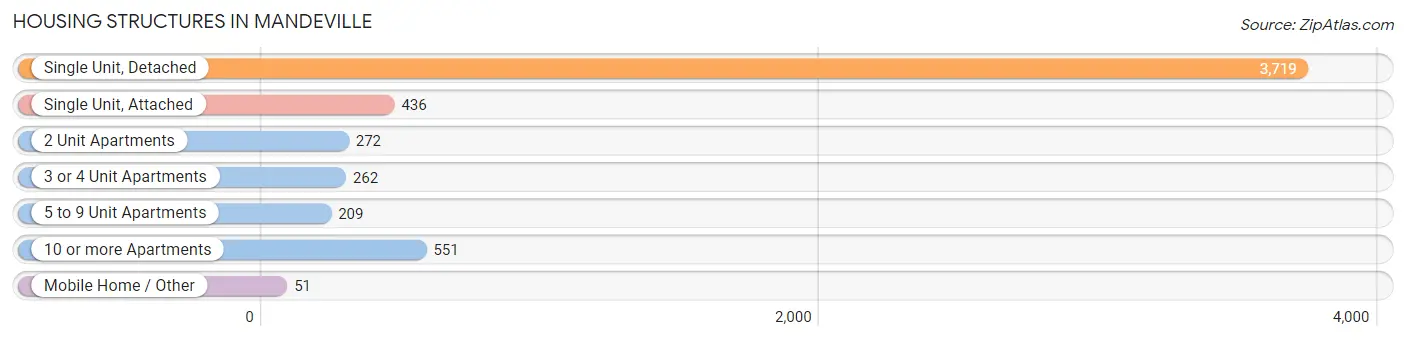
| Structure Type | # Housing Units | % Housing Units |
| Single Unit, Detached | 3,719 | 67.6% |
| Single Unit, Attached | 436 | 7.9% |
| 2 Unit Apartments | 272 | 5.0% |
| 3 or 4 Unit Apartments | 262 | 4.8% |
| 5 to 9 Unit Apartments | 209 | 3.8% |
| 10 or more Apartments | 551 | 10.0% |
| Mobile Home / Other | 51 | 0.9% |
| Total | 5,500 | 100.0% |
Housing Structures by Occupancy in Mandeville
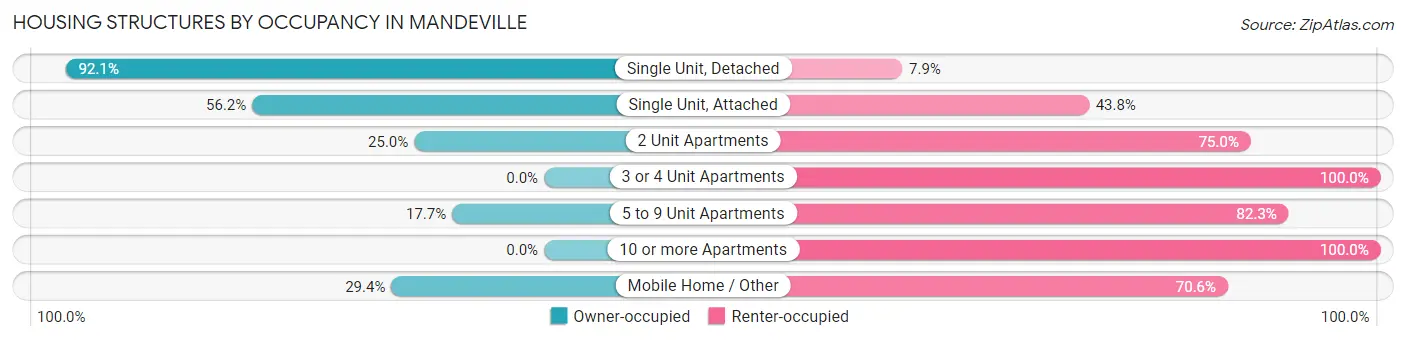
| Structure Type | Owner-occupied | Renter-occupied |
| Single Unit, Detached | 3,426 (92.1%) | 293 (7.9%) |
| Single Unit, Attached | 245 (56.2%) | 191 (43.8%) |
| 2 Unit Apartments | 68 (25.0%) | 204 (75.0%) |
| 3 or 4 Unit Apartments | 0 (0.0%) | 262 (100.0%) |
| 5 to 9 Unit Apartments | 37 (17.7%) | 172 (82.3%) |
| 10 or more Apartments | 0 (0.0%) | 551 (100.0%) |
| Mobile Home / Other | 15 (29.4%) | 36 (70.6%) |
| Total | 3,791 (68.9%) | 1,709 (31.1%) |
Housing Structures by Number of Rooms in Mandeville
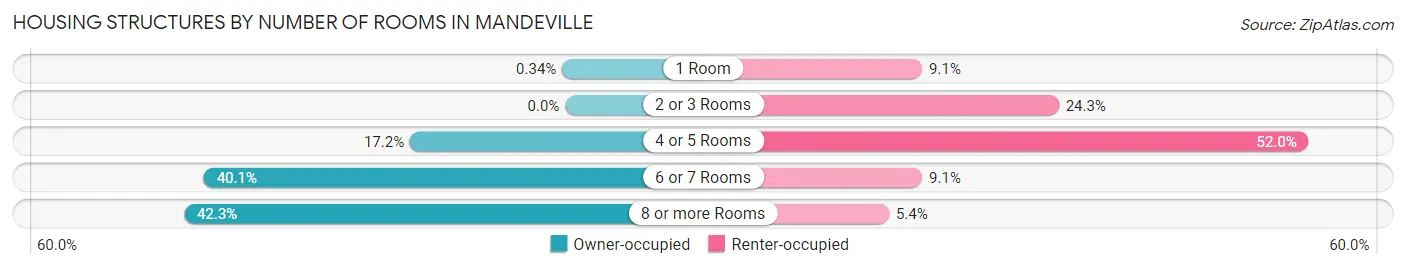
| Number of Rooms | Owner-occupied | Renter-occupied |
| 1 Room | 13 (0.3%) | 156 (9.1%) |
| 2 or 3 Rooms | 0 (0.0%) | 415 (24.3%) |
| 4 or 5 Rooms | 653 (17.2%) | 889 (52.0%) |
| 6 or 7 Rooms | 1,521 (40.1%) | 156 (9.1%) |
| 8 or more Rooms | 1,604 (42.3%) | 93 (5.4%) |
| Total | 3,791 (100.0%) | 1,709 (100.0%) |
Housing Structure by Heating Type in Mandeville
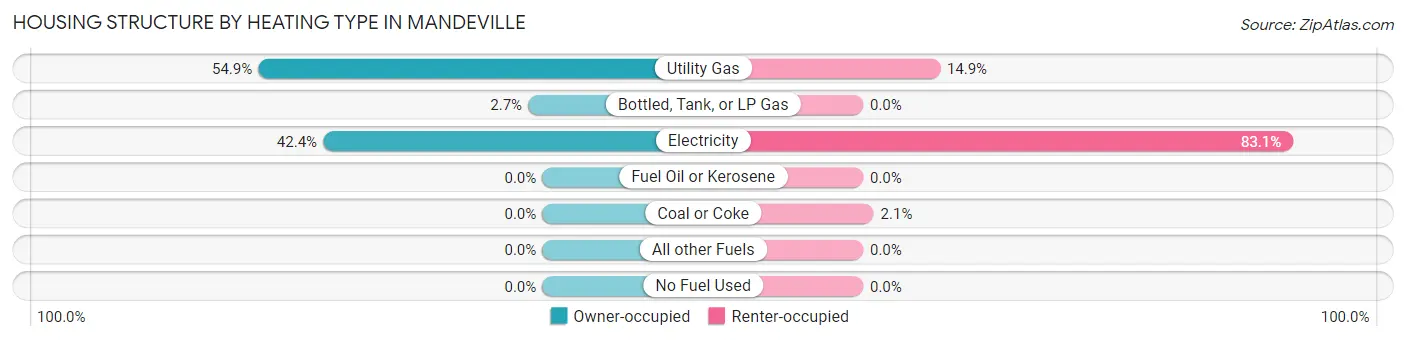
| Heating Type | Owner-occupied | Renter-occupied |
| Utility Gas | 2,081 (54.9%) | 254 (14.9%) |
| Bottled, Tank, or LP Gas | 104 (2.7%) | 0 (0.0%) |
| Electricity | 1,606 (42.4%) | 1,420 (83.1%) |
| Fuel Oil or Kerosene | 0 (0.0%) | 0 (0.0%) |
| Coal or Coke | 0 (0.0%) | 35 (2.1%) |
| All other Fuels | 0 (0.0%) | 0 (0.0%) |
| No Fuel Used | 0 (0.0%) | 0 (0.0%) |
| Total | 3,791 (100.0%) | 1,709 (100.0%) |
Household Vehicle Usage in Mandeville
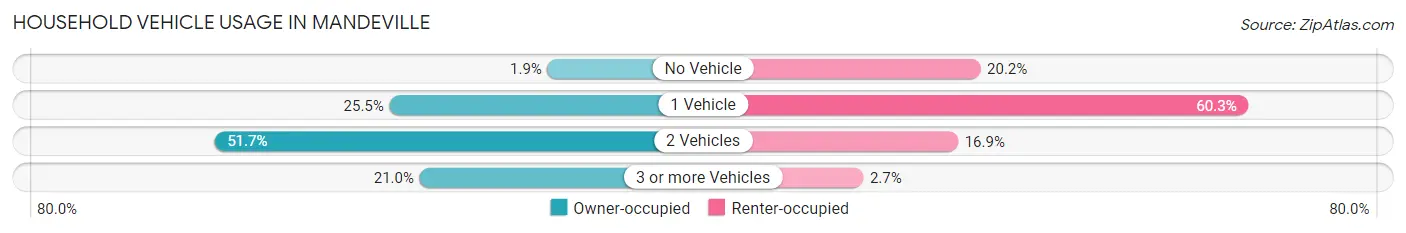
| Vehicles per Household | Owner-occupied | Renter-occupied |
| No Vehicle | 71 (1.9%) | 345 (20.2%) |
| 1 Vehicle | 966 (25.5%) | 1,030 (60.3%) |
| 2 Vehicles | 1,959 (51.7%) | 288 (16.9%) |
| 3 or more Vehicles | 795 (21.0%) | 46 (2.7%) |
| Total | 3,791 (100.0%) | 1,709 (100.0%) |
Real Estate & Mortgages in Mandeville
Real Estate and Mortgage Overview in Mandeville
| Characteristic | Without Mortgage | With Mortgage |
| Housing Units | 1,349 | 2,442 |
| Median Property Value | $344,800 | $381,000 |
| Median Household Income | $85,817 | $1,395 |
| Monthly Housing Costs | $681 | $690 |
| Real Estate Taxes | $2,568 | $20 |
Property Value by Mortgage Status in Mandeville
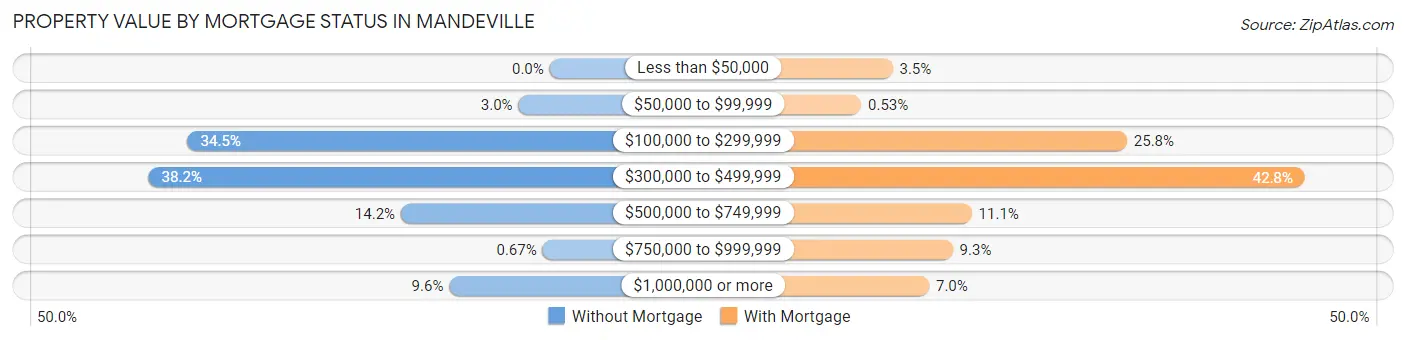
| Property Value | Without Mortgage | With Mortgage |
| Less than $50,000 | 0 (0.0%) | 86 (3.5%) |
| $50,000 to $99,999 | 40 (3.0%) | 13 (0.5%) |
| $100,000 to $299,999 | 465 (34.5%) | 631 (25.8%) |
| $300,000 to $499,999 | 515 (38.2%) | 1,045 (42.8%) |
| $500,000 to $749,999 | 191 (14.2%) | 270 (11.1%) |
| $750,000 to $999,999 | 9 (0.7%) | 226 (9.2%) |
| $1,000,000 or more | 129 (9.6%) | 171 (7.0%) |
| Total | 1,349 (100.0%) | 2,442 (100.0%) |
Household Income by Mortgage Status in Mandeville
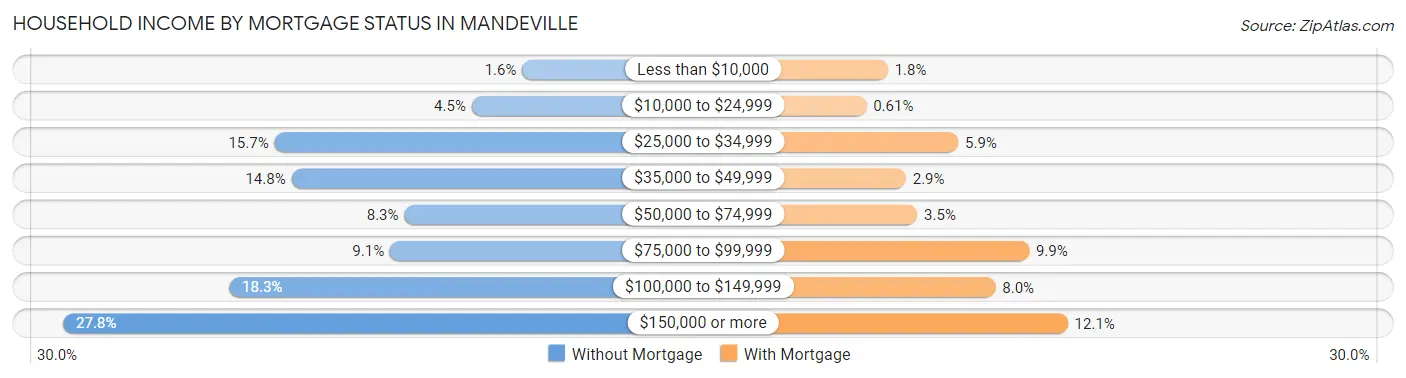
| Household Income | Without Mortgage | With Mortgage |
| Less than $10,000 | 21 (1.6%) | 45 (1.8%) |
| $10,000 to $24,999 | 60 (4.4%) | 15 (0.6%) |
| $25,000 to $34,999 | 212 (15.7%) | 143 (5.9%) |
| $35,000 to $49,999 | 199 (14.7%) | 70 (2.9%) |
| $50,000 to $74,999 | 112 (8.3%) | 86 (3.5%) |
| $75,000 to $99,999 | 123 (9.1%) | 242 (9.9%) |
| $100,000 to $149,999 | 247 (18.3%) | 195 (8.0%) |
| $150,000 or more | 375 (27.8%) | 296 (12.1%) |
| Total | 1,349 (100.0%) | 2,442 (100.0%) |
Property Value to Household Income Ratio in Mandeville
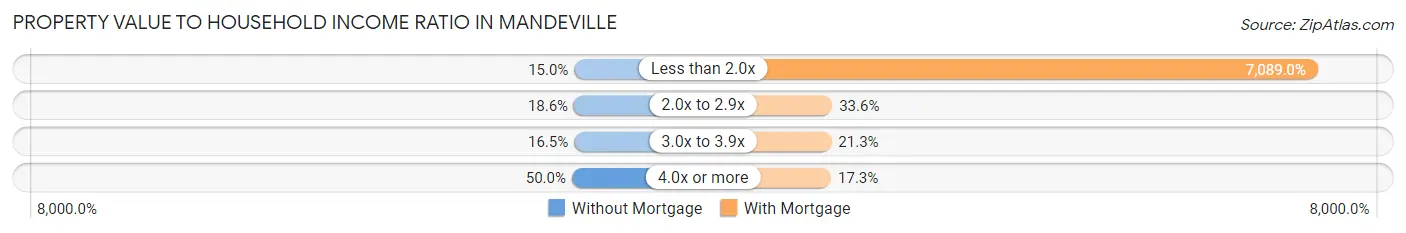
| Value-to-Income Ratio | Without Mortgage | With Mortgage |
| Less than 2.0x | 202 (15.0%) | 173,113 (7,089.0%) |
| 2.0x to 2.9x | 251 (18.6%) | 821 (33.6%) |
| 3.0x to 3.9x | 222 (16.5%) | 520 (21.3%) |
| 4.0x or more | 674 (50.0%) | 422 (17.3%) |
| Total | 1,349 (100.0%) | 2,442 (100.0%) |
Real Estate Taxes by Mortgage Status in Mandeville
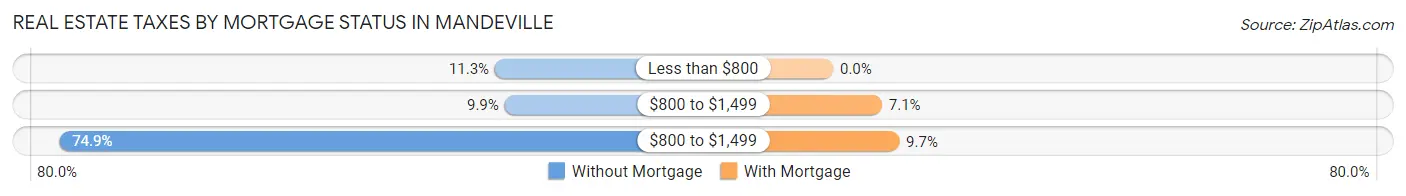
| Property Taxes | Without Mortgage | With Mortgage |
| Less than $800 | 152 (11.3%) | 0 (0.0%) |
| $800 to $1,499 | 133 (9.9%) | 174 (7.1%) |
| $800 to $1,499 | 1,011 (74.9%) | 236 (9.7%) |
| Total | 1,349 (100.0%) | 2,442 (100.0%) |
Health & Disability in Mandeville
Health Insurance Coverage by Age in Mandeville
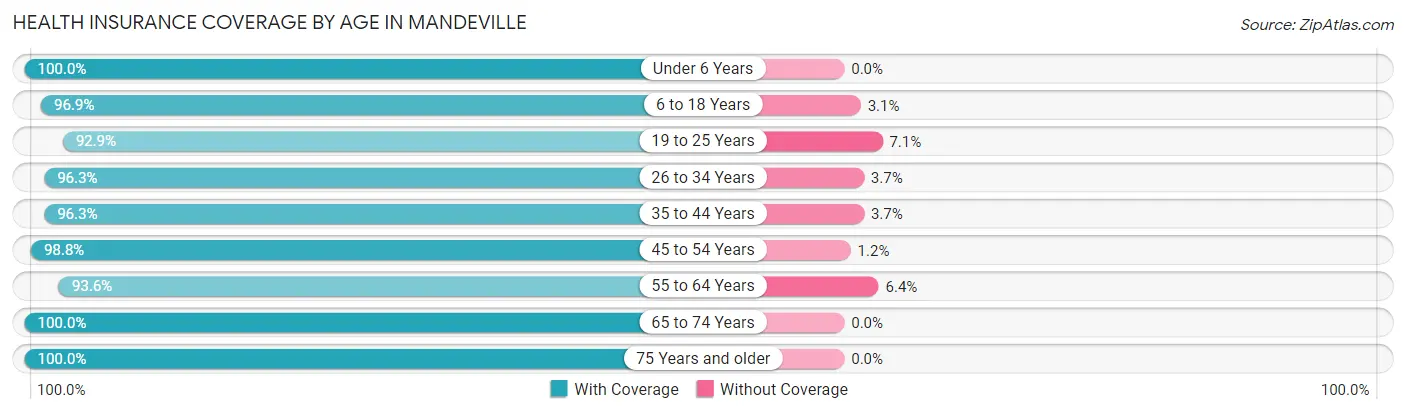
| Age Bracket | With Coverage | Without Coverage |
| Under 6 Years | 472 (100.0%) | 0 (0.0%) |
| 6 to 18 Years | 2,715 (96.9%) | 86 (3.1%) |
| 19 to 25 Years | 626 (92.9%) | 48 (7.1%) |
| 26 to 34 Years | 1,158 (96.3%) | 44 (3.7%) |
| 35 to 44 Years | 1,339 (96.3%) | 51 (3.7%) |
| 45 to 54 Years | 1,743 (98.8%) | 21 (1.2%) |
| 55 to 64 Years | 1,888 (93.6%) | 129 (6.4%) |
| 65 to 74 Years | 1,374 (100.0%) | 0 (0.0%) |
| 75 Years and older | 1,270 (100.0%) | 0 (0.0%) |
| Total | 12,585 (97.1%) | 379 (2.9%) |
Health Insurance Coverage by Citizenship Status in Mandeville
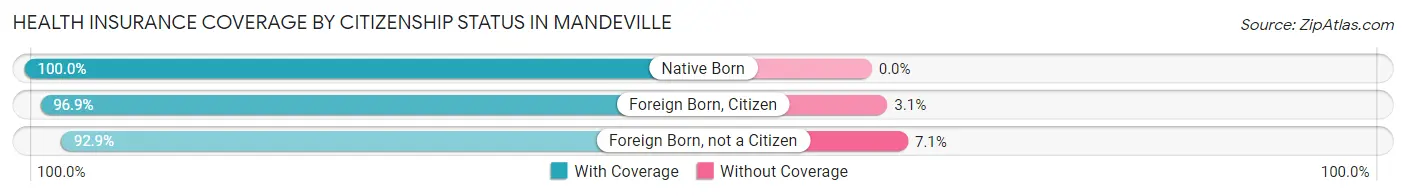
| Citizenship Status | With Coverage | Without Coverage |
| Native Born | 472 (100.0%) | 0 (0.0%) |
| Foreign Born, Citizen | 2,715 (96.9%) | 86 (3.1%) |
| Foreign Born, not a Citizen | 626 (92.9%) | 48 (7.1%) |
Health Insurance Coverage by Household Income in Mandeville
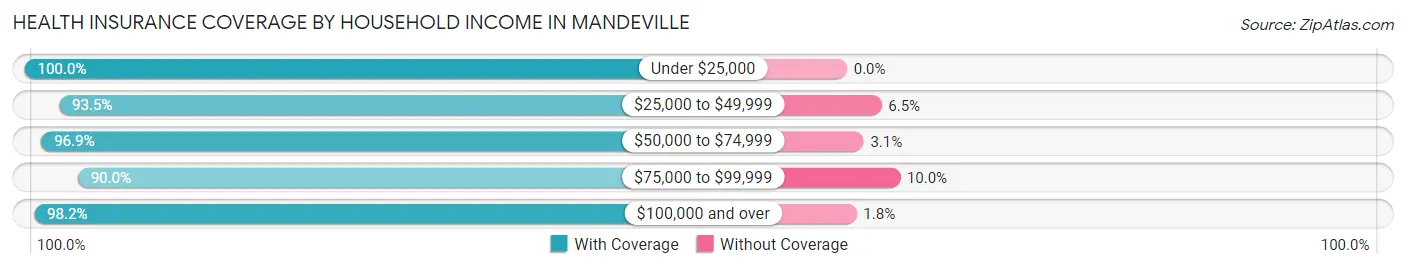
| Household Income | With Coverage | Without Coverage |
| Under $25,000 | 1,521 (100.0%) | 0 (0.0%) |
| $25,000 to $49,999 | 1,546 (93.5%) | 107 (6.5%) |
| $50,000 to $74,999 | 1,367 (96.9%) | 44 (3.1%) |
| $75,000 to $99,999 | 832 (90.0%) | 92 (10.0%) |
| $100,000 and over | 7,313 (98.2%) | 134 (1.8%) |
Public vs Private Health Insurance Coverage by Age in Mandeville
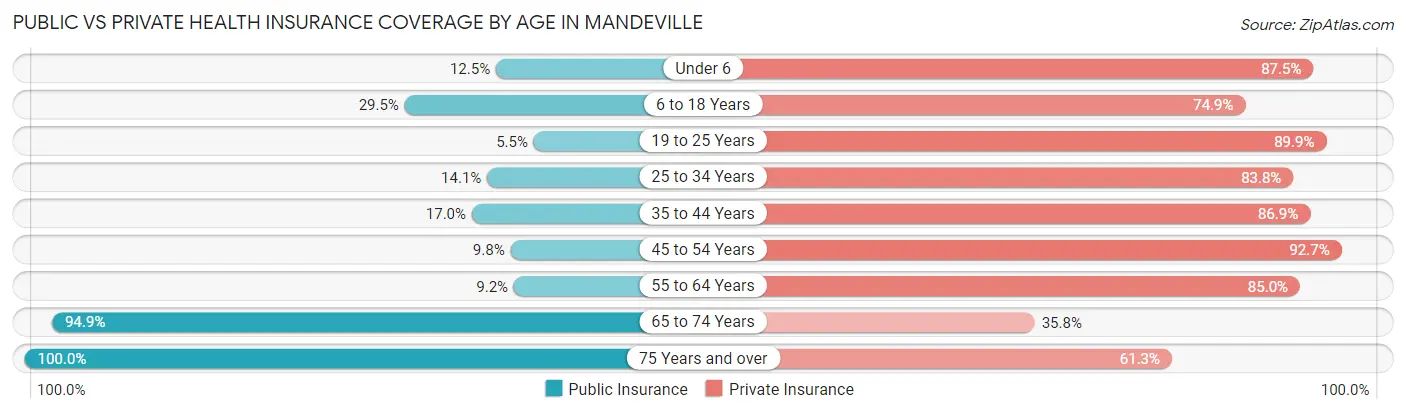
| Age Bracket | Public Insurance | Private Insurance |
| Under 6 | 59 (12.5%) | 413 (87.5%) |
| 6 to 18 Years | 825 (29.4%) | 2,098 (74.9%) |
| 19 to 25 Years | 37 (5.5%) | 606 (89.9%) |
| 25 to 34 Years | 170 (14.1%) | 1,007 (83.8%) |
| 35 to 44 Years | 236 (17.0%) | 1,208 (86.9%) |
| 45 to 54 Years | 173 (9.8%) | 1,636 (92.7%) |
| 55 to 64 Years | 185 (9.2%) | 1,715 (85.0%) |
| 65 to 74 Years | 1,304 (94.9%) | 492 (35.8%) |
| 75 Years and over | 1,270 (100.0%) | 778 (61.3%) |
| Total | 4,259 (32.9%) | 9,953 (76.8%) |
Disability Status by Sex by Age in Mandeville
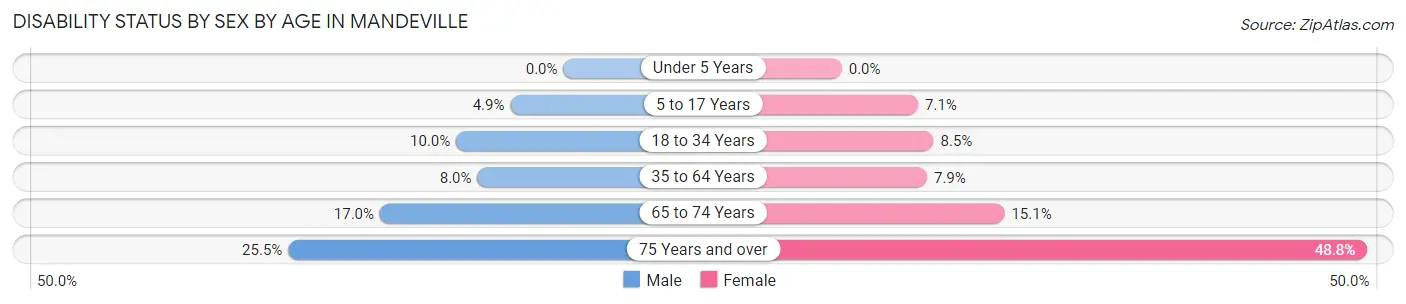
| Age Bracket | Male | Female |
| Under 5 Years | 0 (0.0%) | 0 (0.0%) |
| 5 to 17 Years | 55 (4.9%) | 101 (7.1%) |
| 18 to 34 Years | 125 (10.0%) | 78 (8.5%) |
| 35 to 64 Years | 205 (8.0%) | 206 (7.9%) |
| 65 to 74 Years | 102 (17.0%) | 117 (15.1%) |
| 75 Years and over | 141 (25.5%) | 350 (48.7%) |
Disability Class by Sex by Age in Mandeville
Disability Class: Hearing Difficulty
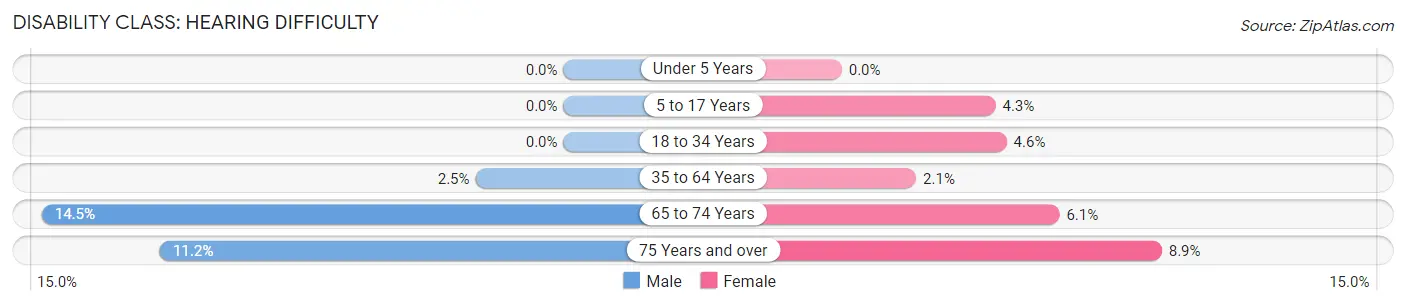
| Age Bracket | Male | Female |
| Under 5 Years | 0 (0.0%) | 0 (0.0%) |
| 5 to 17 Years | 0 (0.0%) | 61 (4.3%) |
| 18 to 34 Years | 0 (0.0%) | 42 (4.6%) |
| 35 to 64 Years | 63 (2.5%) | 54 (2.1%) |
| 65 to 74 Years | 87 (14.5%) | 47 (6.1%) |
| 75 Years and over | 62 (11.2%) | 64 (8.9%) |
Disability Class: Vision Difficulty
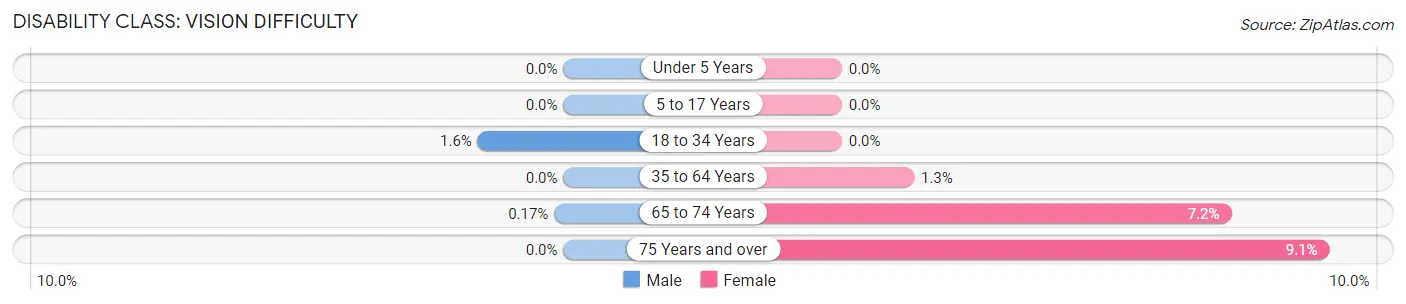
| Age Bracket | Male | Female |
| Under 5 Years | 0 (0.0%) | 0 (0.0%) |
| 5 to 17 Years | 0 (0.0%) | 0 (0.0%) |
| 18 to 34 Years | 20 (1.6%) | 0 (0.0%) |
| 35 to 64 Years | 0 (0.0%) | 35 (1.3%) |
| 65 to 74 Years | 1 (0.2%) | 56 (7.2%) |
| 75 Years and over | 0 (0.0%) | 65 (9.0%) |
Disability Class: Cognitive Difficulty
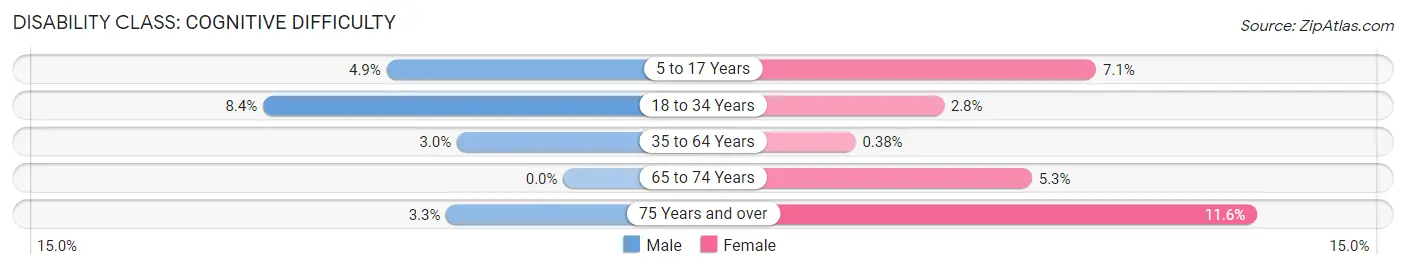
| Age Bracket | Male | Female |
| 5 to 17 Years | 55 (4.9%) | 101 (7.1%) |
| 18 to 34 Years | 105 (8.4%) | 26 (2.8%) |
| 35 to 64 Years | 76 (3.0%) | 10 (0.4%) |
| 65 to 74 Years | 0 (0.0%) | 41 (5.3%) |
| 75 Years and over | 18 (3.3%) | 83 (11.6%) |
Disability Class: Ambulatory Difficulty
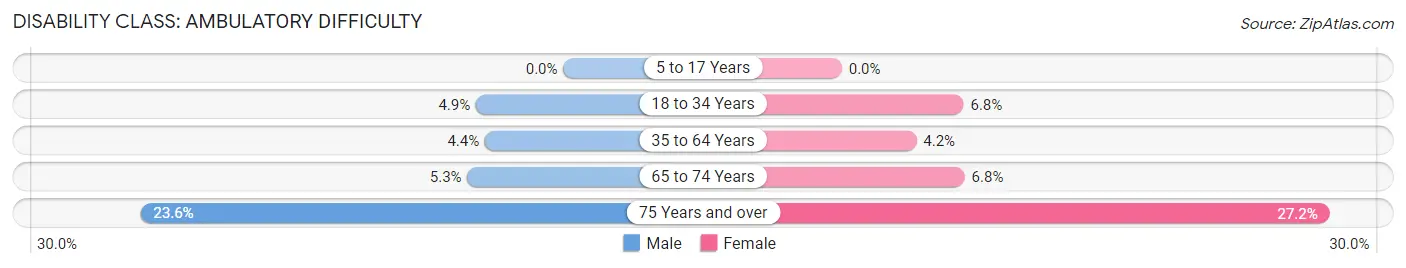
| Age Bracket | Male | Female |
| 5 to 17 Years | 0 (0.0%) | 0 (0.0%) |
| 18 to 34 Years | 61 (4.9%) | 62 (6.8%) |
| 35 to 64 Years | 112 (4.4%) | 108 (4.2%) |
| 65 to 74 Years | 32 (5.3%) | 53 (6.8%) |
| 75 Years and over | 130 (23.5%) | 195 (27.2%) |
Disability Class: Self-Care Difficulty
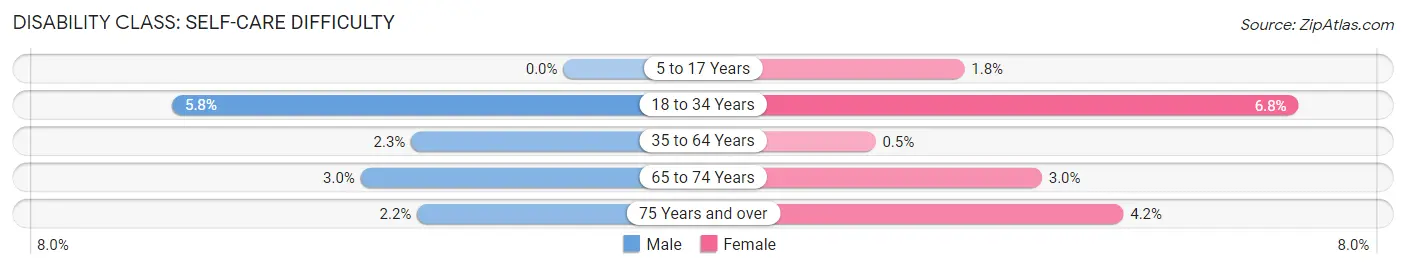
| Age Bracket | Male | Female |
| 5 to 17 Years | 0 (0.0%) | 26 (1.8%) |
| 18 to 34 Years | 73 (5.8%) | 62 (6.8%) |
| 35 to 64 Years | 58 (2.3%) | 13 (0.5%) |
| 65 to 74 Years | 18 (3.0%) | 23 (3.0%) |
| 75 Years and over | 12 (2.2%) | 30 (4.2%) |
Technology Access in Mandeville
Computing Device Access in Mandeville
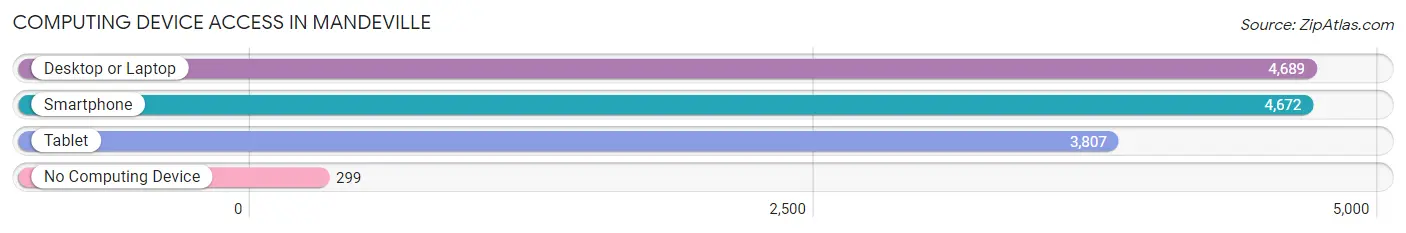
| Device Type | # Households | % Households |
| Desktop or Laptop | 4,689 | 85.3% |
| Smartphone | 4,672 | 85.0% |
| Tablet | 3,807 | 69.2% |
| No Computing Device | 299 | 5.4% |
| Total | 5,500 | 100.0% |
Internet Access in Mandeville
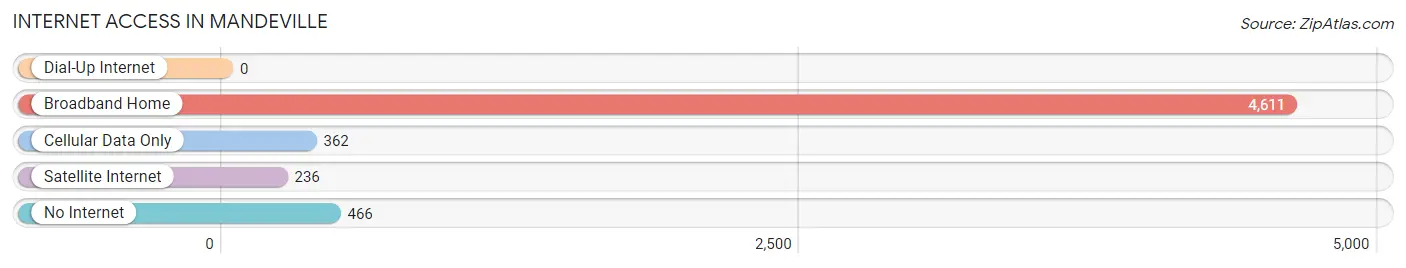
| Internet Type | # Households | % Households |
| Dial-Up Internet | 0 | 0.0% |
| Broadband Home | 4,611 | 83.8% |
| Cellular Data Only | 362 | 6.6% |
| Satellite Internet | 236 | 4.3% |
| No Internet | 466 | 8.5% |
| Total | 5,500 | 100.0% |
Mandeville Summary
Mandeville, Louisiana is a small city located in St. Tammany Parish, Louisiana, United States. It is situated on the north shore of Lake Pontchartrain, approximately 40 miles north of New Orleans. The city is part of the New Orleans-Metairie-Kenner Metropolitan Statistical Area. As of the 2010 census, the population of Mandeville was 11,560.
History
The area that is now Mandeville was originally inhabited by Native Americans, including the Choctaw and Houma tribes. The first European settlers arrived in the area in the late 1700s, and the city was officially founded in 1834. The city was named after the Marquis de Mandeville, a French nobleman who had served in the Louisiana Legislature.
In the early 19th century, Mandeville was a popular summer resort for wealthy New Orleanians. The city was connected to New Orleans by a ferry service, and many of the city’s grand homes were built during this period.
In the late 19th century, the city’s economy was largely based on the lumber industry. The city was also home to several sawmills and a large paper mill.
Geography
Mandeville is located in St. Tammany Parish, Louisiana, United States. It is situated on the north shore of Lake Pontchartrain, approximately 40 miles north of New Orleans. The city is part of the New Orleans-Metairie-Kenner Metropolitan Statistical Area.
The city has a total area of 8.2 square miles, of which 7.9 square miles is land and 0.3 square miles is water. The city is bordered by the Tchefuncte River to the east and the Bogue Falaya River to the west.
Economy
The economy of Mandeville is largely based on tourism and retail. The city is home to several restaurants, bars, and shops, as well as a number of hotels and resorts. The city is also home to several corporate offices, including those of the St. Tammany Parish School Board and the St. Tammany Parish Sheriff’s Office.
Demographics
As of the 2010 census, the population of Mandeville was 11,560. The racial makeup of the city was 87.3% White, 8.2% African American, 0.4% Native American, 1.2% Asian, 0.1% Pacific Islander, 0.7% from other races, and 2.1% from two or more races. Hispanic or Latino of any race were 3.2% of the population.
The median income for a household in the city was $50,945, and the median income for a family was $62,917. The per capita income for the city was $30,945. About 6.2% of families and 8.7% of the population were below the poverty line, including 11.2% of those under age 18 and 6.2% of those age 65 or over.
Common Questions
What is Per Capita Income in Mandeville?
Per Capita income in Mandeville is $58,156.
What is the Median Family Income in Mandeville?
Median Family Income in Mandeville is $127,589.
What is the Median Household income in Mandeville?
Median Household Income in Mandeville is $84,886.
What is Income or Wage Gap in Mandeville?
Income or Wage Gap in Mandeville is 53.9%.
Women in Mandeville earn 46.1 cents for every dollar earned by a man.
What is Family Income Deficit in Mandeville?
Family Income Deficit in Mandeville is $8,515.
Families that are below poverty line in Mandeville earn $8,515 less on average than the poverty threshold level.
What is Inequality or Gini Index in Mandeville?
Inequality or Gini Index in Mandeville is 0.52.
What is the Total Population of Mandeville?
Total Population of Mandeville is 13,194.
What is the Total Male Population of Mandeville?
Total Male Population of Mandeville is 6,354.
What is the Total Female Population of Mandeville?
Total Female Population of Mandeville is 6,840.
What is the Ratio of Males per 100 Females in Mandeville?
There are 92.89 Males per 100 Females in Mandeville.
What is the Ratio of Females per 100 Males in Mandeville?
There are 107.65 Females per 100 Males in Mandeville.
What is the Median Population Age in Mandeville?
Median Population Age in Mandeville is 45.1 Years.
What is the Average Family Size in Mandeville
Average Family Size in Mandeville is 2.9 People.
What is the Average Household Size in Mandeville
Average Household Size in Mandeville is 2.4 People.
How Large is the Labor Force in Mandeville?
There are 6,272 People in the Labor Forcein in Mandeville.
What is the Percentage of People in the Labor Force in Mandeville?
59.1% of People are in the Labor Force in Mandeville.
What is the Unemployment Rate in Mandeville?
Unemployment Rate in Mandeville is 3.6%.