Zip Codes with the Highest Percentage of Population Employed in Health Care & Social Assistance in Denham Springs, LA
RELATED REPORTS & OPTIONS
Health Care & Social Assistance
Denham Springs
Compare Zip Codes
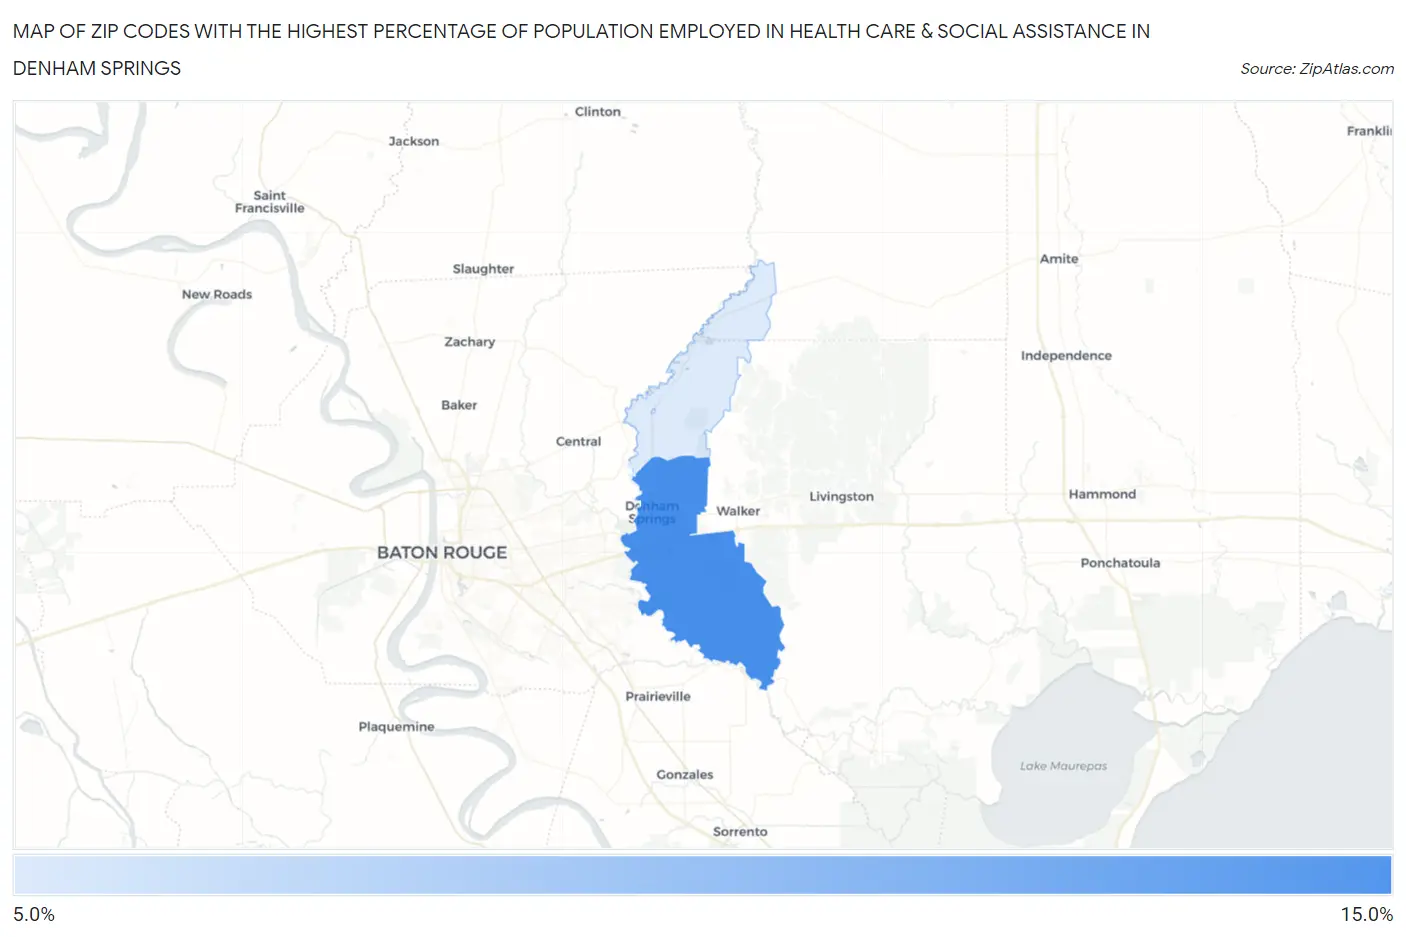
Map of Zip Codes with the Highest Percentage of Population Employed in Health Care & Social Assistance in Denham Springs
0.0%
15.0%
Zip Codes with the Highest Percentage of Population Employed in Health Care & Social Assistance in Denham Springs, LA
| Zip Code | % Employed | vs State | vs National | |
| 1. | 70726 | 13.7% | 15.2%(-1.52)#266 | 13.9%(-0.269)#14,870 |
| 2. | 70706 | 11.5% | 15.2%(-3.65)#333 | 13.9%(-2.40)#20,132 |
1
Common Questions
What are the Top Zip Codes with the Highest Percentage of Population Employed in Health Care & Social Assistance in Denham Springs, LA?
Top Zip Codes with the Highest Percentage of Population Employed in Health Care & Social Assistance in Denham Springs, LA are:
What zip code has the Highest Percentage of Population Employed in Health Care & Social Assistance in Denham Springs, LA?
70726 has the Highest Percentage of Population Employed in Health Care & Social Assistance in Denham Springs, LA with 13.7%.
What is the Percentage of Population Employed in Health Care & Social Assistance in Denham Springs, LA?
Percentage of Population Employed in Health Care & Social Assistance in Denham Springs is 7.9%.
What is the Percentage of Population Employed in Health Care & Social Assistance in Louisiana?
Percentage of Population Employed in Health Care & Social Assistance in Louisiana is 15.2%.
What is the Percentage of Population Employed in Health Care & Social Assistance in the United States?
Percentage of Population Employed in Health Care & Social Assistance in the United States is 13.9%.