Zip Codes with the Highest Percentage of Renter-Occupied Units in Denham Springs, LA
RELATED REPORTS & OPTIONS
Highest Renter-Occupied
Denham Springs
Compare Zip Codes
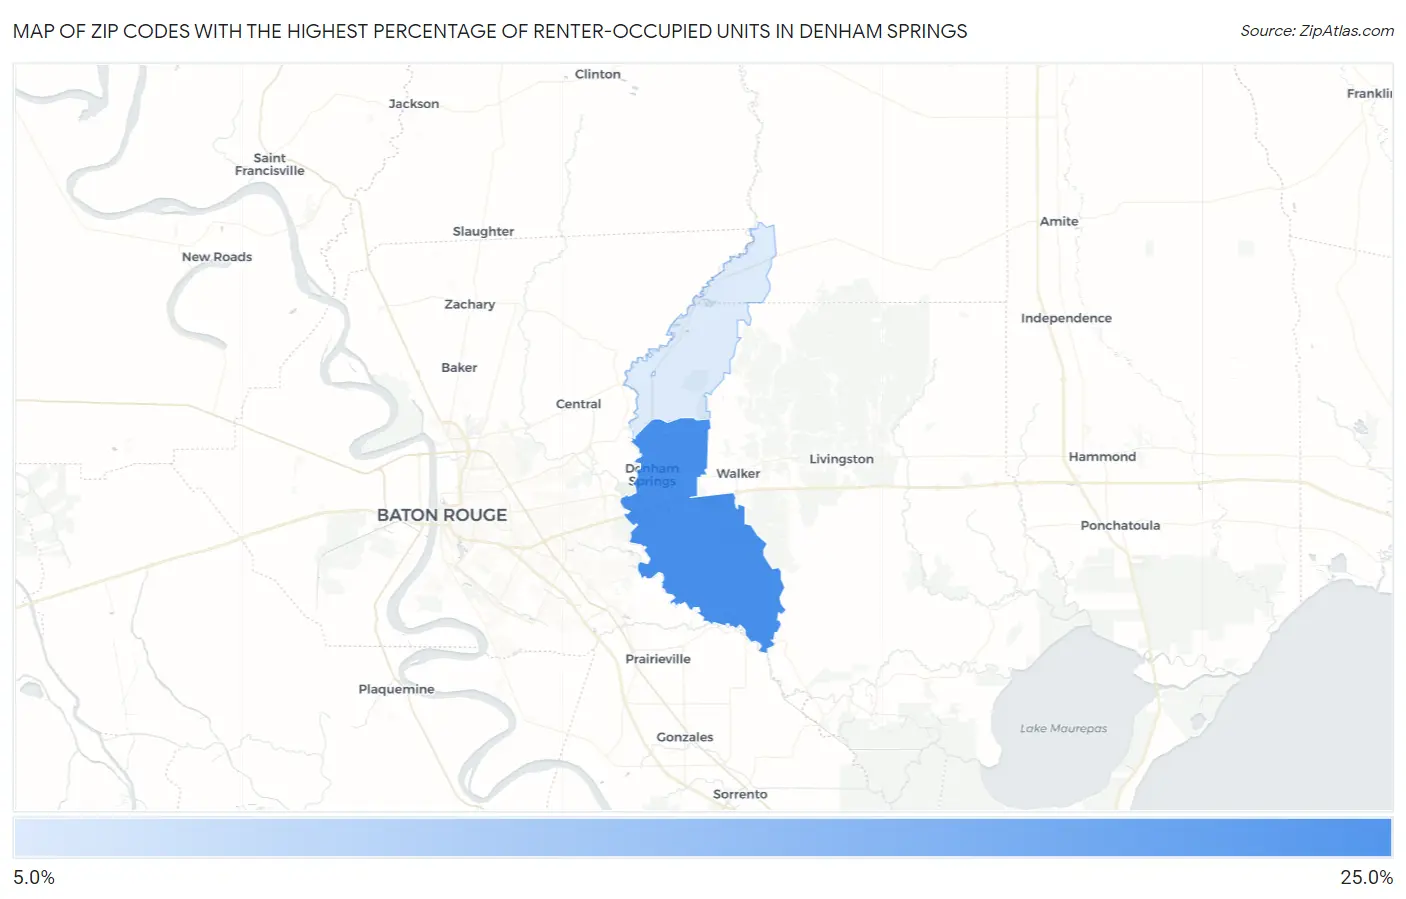
Map of Zip Codes with the Highest Percentage of Renter-Occupied Units in Denham Springs
0.0%
25.0%
Zip Codes with the Highest Percentage of Renter-Occupied Units in Denham Springs, LA
| Zip Code | % Renter-Occupied | vs State | vs National | |
| 1. | 70726 | 23.7% | 32.8%(-9.13)#261 | 35.2%(-11.5)#14,788 |
| 2. | 70706 | 10.5% | 32.8%(-22.3)#433 | 35.2%(-24.7)#26,935 |
1
Common Questions
What are the Top Zip Codes with the Highest Percentage of Renter-Occupied Units in Denham Springs, LA?
Top Zip Codes with the Highest Percentage of Renter-Occupied Units in Denham Springs, LA are:
What zip code has the Highest Percentage of Renter-Occupied Units in Denham Springs, LA?
70726 has the Highest Percentage of Renter-Occupied Units in Denham Springs, LA with 23.7%.
What is the Percentage of Renter-Occupied Units in Denham Springs, LA?
Percentage of Renter-Occupied Units in Denham Springs is 28.6%.
What is the Percentage of Renter-Occupied Units in Louisiana?
Percentage of Renter-Occupied Units in Louisiana is 32.8%.
What is the Percentage of Renter-Occupied Units in the United States?
Percentage of Renter-Occupied Units in the United States is 35.2%.