Wilson, KS Map & Demographics
Wilson Map
Wilson Overview
$25,440
PER CAPITA INCOME
$52,500
AVG FAMILY INCOME
$48,889
AVG HOUSEHOLD INCOME
33.3%
WAGE / INCOME GAP [ % ]
66.7¢/ $1
WAGE / INCOME GAP [ $ ]
0.42
INEQUALITY / GINI INDEX
777
TOTAL POPULATION
420
MALE POPULATION
357
FEMALE POPULATION
117.65
MALES / 100 FEMALES
85.00
FEMALES / 100 MALES
51.4
MEDIAN AGE
3.4
AVG FAMILY SIZE
2.6
AVG HOUSEHOLD SIZE
306
LABOR FORCE [ PEOPLE ]
47.8%
PERCENT IN LABOR FORCE
2.0%
UNEMPLOYMENT RATE
Wilson Zip Codes
Wilson Area Codes
Income in Wilson
Income Overview in Wilson
Per Capita Income in Wilson is $25,440, while median incomes of families and households are $52,500 and $48,889 respectively.
| Characteristic | Number | Measure |
| Per Capita Income | 777 | $25,440 |
| Median Family Income | 160 | $52,500 |
| Mean Family Income | 160 | $68,258 |
| Median Household Income | 270 | $48,889 |
| Mean Household Income | 270 | $63,209 |
| Income Deficit | 160 | $0 |
| Wage / Income Gap (%) | 777 | 33.33% |
| Wage / Income Gap ($) | 777 | 66.67¢ per $1 |
| Gini / Inequality Index | 777 | 0.42 |
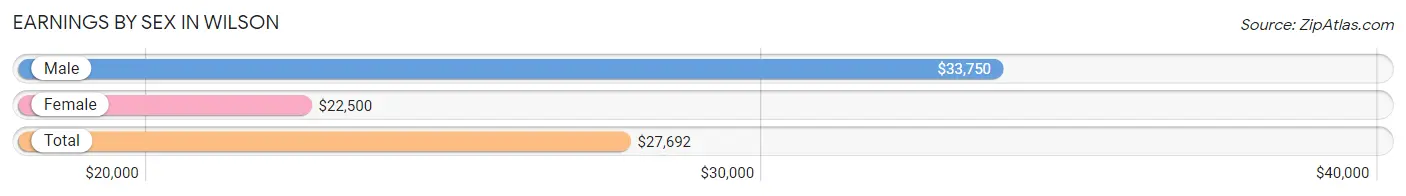
Earnings by Sex in Wilson
Average Earnings in Wilson are $27,692, $33,750 for men and $22,500 for women, a difference of 33.3%.
| Sex | Number | Average Earnings |
| Male | 188 (59.5%) | $33,750 |
| Female | 128 (40.5%) | $22,500 |
| Total | 316 (100.0%) | $27,692 |
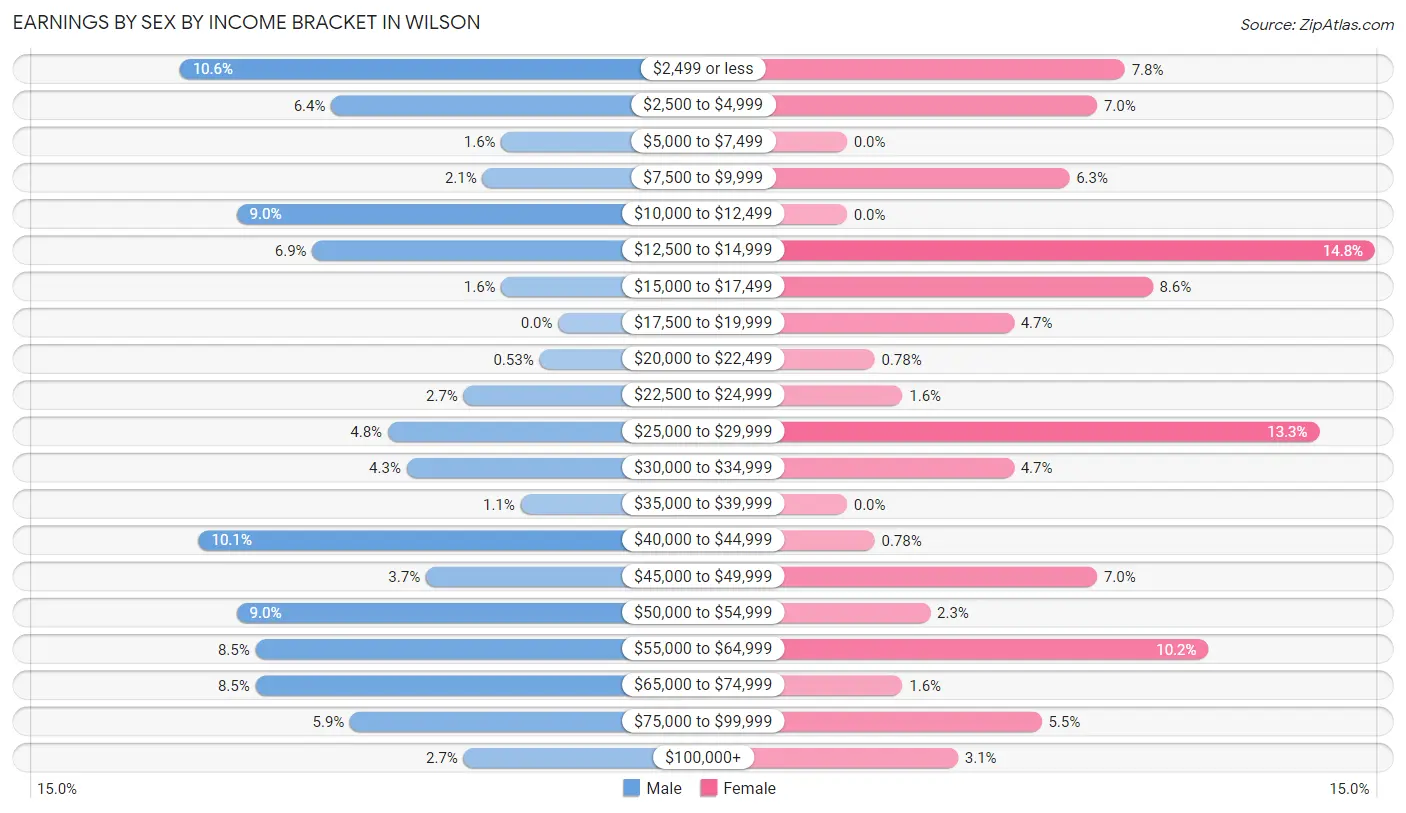
Earnings by Sex by Income Bracket in Wilson
The most common earnings brackets in Wilson are $2,499 or less for men (20 | 10.6%) and $12,500 to $14,999 for women (19 | 14.8%).
| Income | Male | Female |
| $2,499 or less | 20 (10.6%) | 10 (7.8%) |
| $2,500 to $4,999 | 12 (6.4%) | 9 (7.0%) |
| $5,000 to $7,499 | 3 (1.6%) | 0 (0.0%) |
| $7,500 to $9,999 | 4 (2.1%) | 8 (6.2%) |
| $10,000 to $12,499 | 17 (9.0%) | 0 (0.0%) |
| $12,500 to $14,999 | 13 (6.9%) | 19 (14.8%) |
| $15,000 to $17,499 | 3 (1.6%) | 11 (8.6%) |
| $17,500 to $19,999 | 0 (0.0%) | 6 (4.7%) |
| $20,000 to $22,499 | 1 (0.5%) | 1 (0.8%) |
| $22,500 to $24,999 | 5 (2.7%) | 2 (1.6%) |
| $25,000 to $29,999 | 9 (4.8%) | 17 (13.3%) |
| $30,000 to $34,999 | 8 (4.3%) | 6 (4.7%) |
| $35,000 to $39,999 | 2 (1.1%) | 0 (0.0%) |
| $40,000 to $44,999 | 19 (10.1%) | 1 (0.8%) |
| $45,000 to $49,999 | 7 (3.7%) | 9 (7.0%) |
| $50,000 to $54,999 | 17 (9.0%) | 3 (2.3%) |
| $55,000 to $64,999 | 16 (8.5%) | 13 (10.2%) |
| $65,000 to $74,999 | 16 (8.5%) | 2 (1.6%) |
| $75,000 to $99,999 | 11 (5.9%) | 7 (5.5%) |
| $100,000+ | 5 (2.7%) | 4 (3.1%) |
| Total | 188 (100.0%) | 128 (100.0%) |
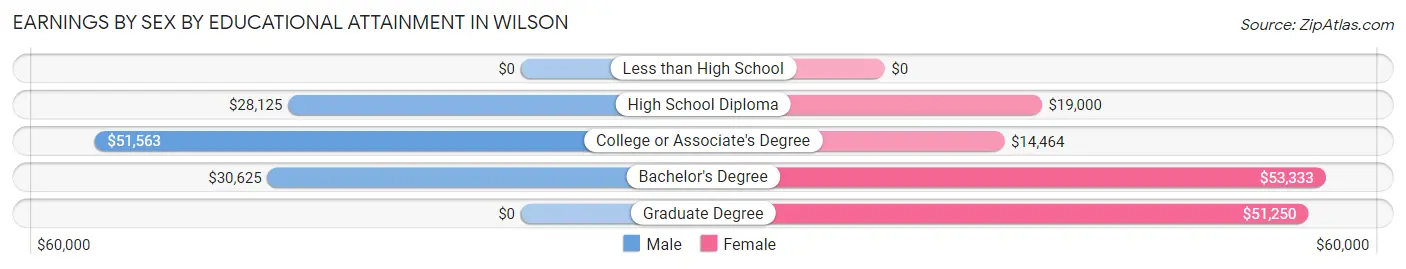
Earnings by Sex by Educational Attainment in Wilson
Average earnings in Wilson are $48,036 for men and $19,792 for women, a difference of 58.8%. Men with an educational attainment of college or associate's degree enjoy the highest average annual earnings of $51,563, while those with high school diploma education earn the least with $28,125. Women with an educational attainment of bachelor's degree earn the most with the average annual earnings of $53,333, while those with college or associate's degree education have the smallest earnings of $14,464.
| Educational Attainment | Male Income | Female Income |
| Less than High School | - | - |
| High School Diploma | $28,125 | $19,000 |
| College or Associate's Degree | $51,563 | $14,464 |
| Bachelor's Degree | $30,625 | $53,333 |
| Graduate Degree | - | - |
| Total | $48,036 | $19,792 |
Family Income in Wilson
Family Income Brackets in Wilson
According to the Wilson family income data, there are 42 families falling into the $35,000 to $49,999 income range, which is the most common income bracket and makes up 26.3% of all families. Conversely, the less than $10,000 income bracket is the least frequent group with only 4 families (2.5%) belonging to this category.
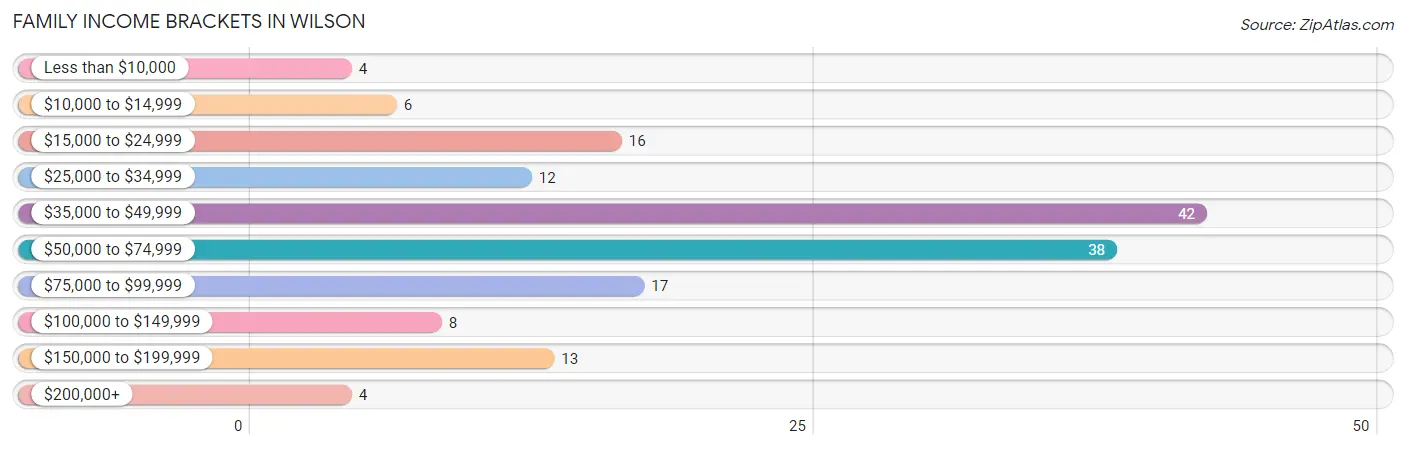
| Income Bracket | # Families | % Families |
| Less than $10,000 | 4 | 2.5% |
| $10,000 to $14,999 | 6 | 3.8% |
| $15,000 to $24,999 | 16 | 10.0% |
| $25,000 to $34,999 | 12 | 7.5% |
| $35,000 to $49,999 | 42 | 26.3% |
| $50,000 to $74,999 | 38 | 23.8% |
| $75,000 to $99,999 | 17 | 10.6% |
| $100,000 to $149,999 | 8 | 5.0% |
| $150,000 to $199,999 | 13 | 8.1% |
| $200,000+ | 4 | 2.5% |
Family Income by Famaliy Size in Wilson
4-person families (35 | 21.9%) account for the highest median family income in Wilson with $66,932 per family, while 2-person families (91 | 56.9%) have the highest median income of $20,903 per family member.
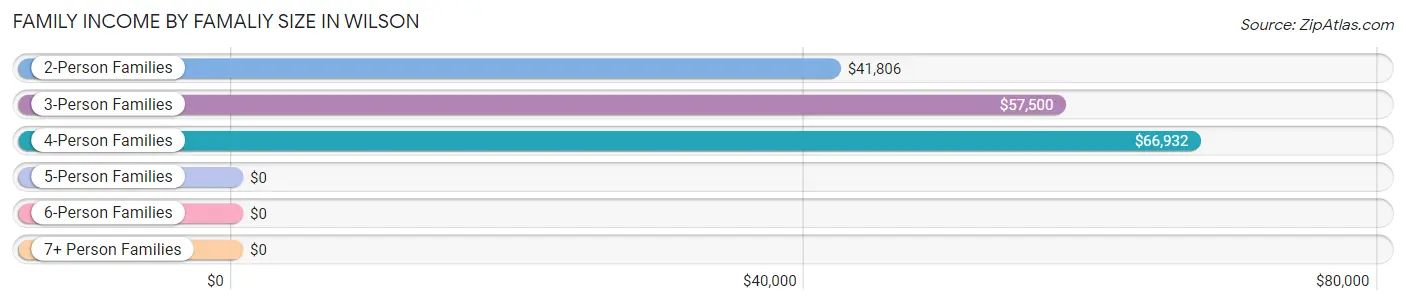
| Income Bracket | # Families | Median Income |
| 2-Person Families | 91 (56.9%) | $41,806 |
| 3-Person Families | 20 (12.5%) | $57,500 |
| 4-Person Families | 35 (21.9%) | $66,932 |
| 5-Person Families | 11 (6.9%) | $0 |
| 6-Person Families | 3 (1.9%) | $0 |
| 7+ Person Families | 0 (0.0%) | $0 |
| Total | 160 (100.0%) | $52,500 |
Family Income by Number of Earners in Wilson
The median family income in Wilson is $52,500, with families comprising 3+ earners (9) having the highest median family income of $197,750, while families with no earners (44) have the lowest median family income of $35,000, accounting for 5.6% and 27.5% of families, respectively.
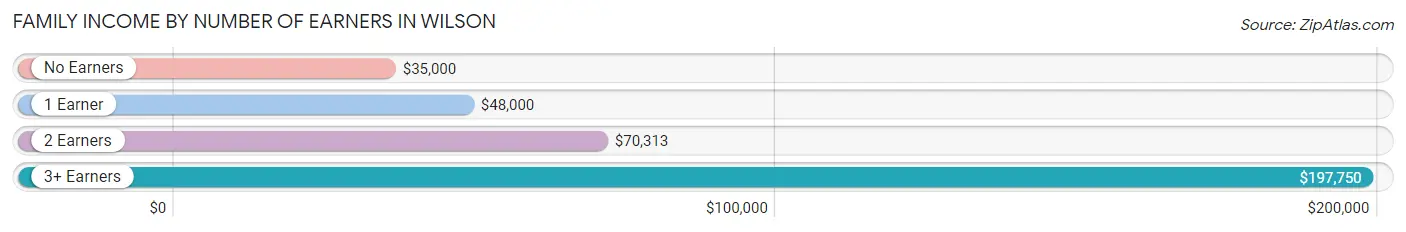
| Number of Earners | # Families | Median Income |
| No Earners | 44 (27.5%) | $35,000 |
| 1 Earner | 50 (31.2%) | $48,000 |
| 2 Earners | 57 (35.6%) | $70,313 |
| 3+ Earners | 9 (5.6%) | $197,750 |
| Total | 160 (100.0%) | $52,500 |
Household Income in Wilson
Household Income Brackets in Wilson
With 61 households falling in the category, the $50,000 to $74,999 income range is the most frequent in Wilson, accounting for 22.6% of all households. In contrast, only 6 households (2.2%) fall into the $200,000+ income bracket, making it the least populous group.
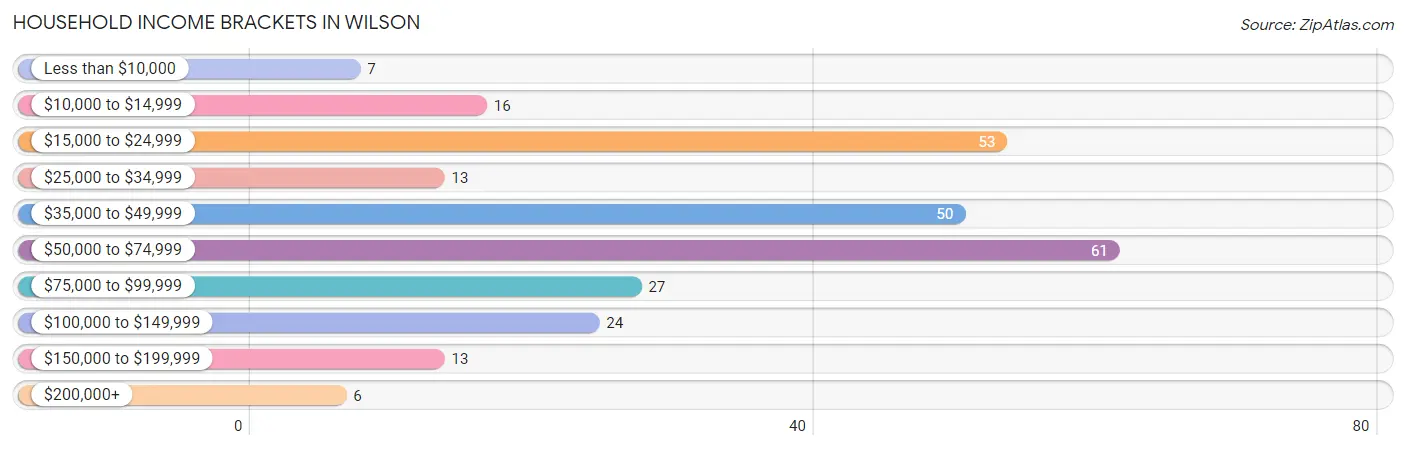
| Income Bracket | # Households | % Households |
| Less than $10,000 | 7 | 2.6% |
| $10,000 to $14,999 | 16 | 5.9% |
| $15,000 to $24,999 | 53 | 19.6% |
| $25,000 to $34,999 | 13 | 4.8% |
| $35,000 to $49,999 | 50 | 18.5% |
| $50,000 to $74,999 | 61 | 22.6% |
| $75,000 to $99,999 | 27 | 10.0% |
| $100,000 to $149,999 | 24 | 8.9% |
| $150,000 to $199,999 | 13 | 4.8% |
| $200,000+ | 6 | 2.2% |
Household Income by Householder Age in Wilson
The median household income in Wilson is $48,889, with the highest median household income of $64,583 found in the 25 to 44 years age bracket for the primary householder. A total of 63 households (23.3%) fall into this category.
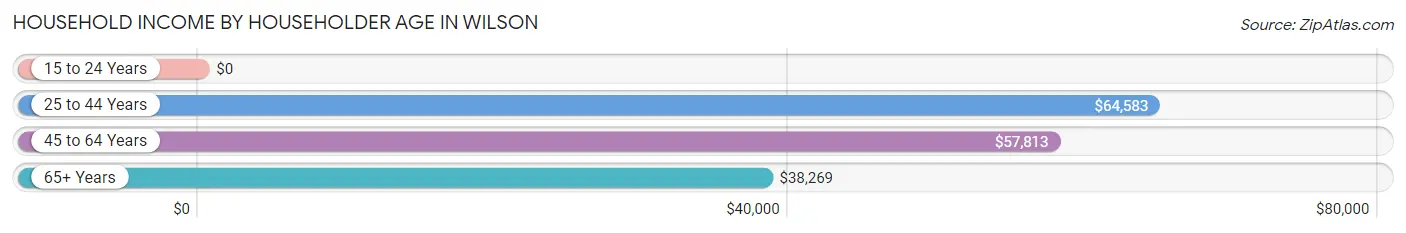
| Income Bracket | # Households | Median Income |
| 15 to 24 Years | 0 (0.0%) | $0 |
| 25 to 44 Years | 63 (23.3%) | $64,583 |
| 45 to 64 Years | 85 (31.5%) | $57,813 |
| 65+ Years | 122 (45.2%) | $38,269 |
| Total | 270 (100.0%) | $48,889 |
Poverty in Wilson
Income Below Poverty by Sex and Age in Wilson
With 16.3% poverty level for males and 17.8% for females among the residents of Wilson, 12 to 14 year old males and 55 to 64 year old females are the most vulnerable to poverty, with 5 males (50.0%) and 15 females (50.0%) in their respective age groups living below the poverty level.
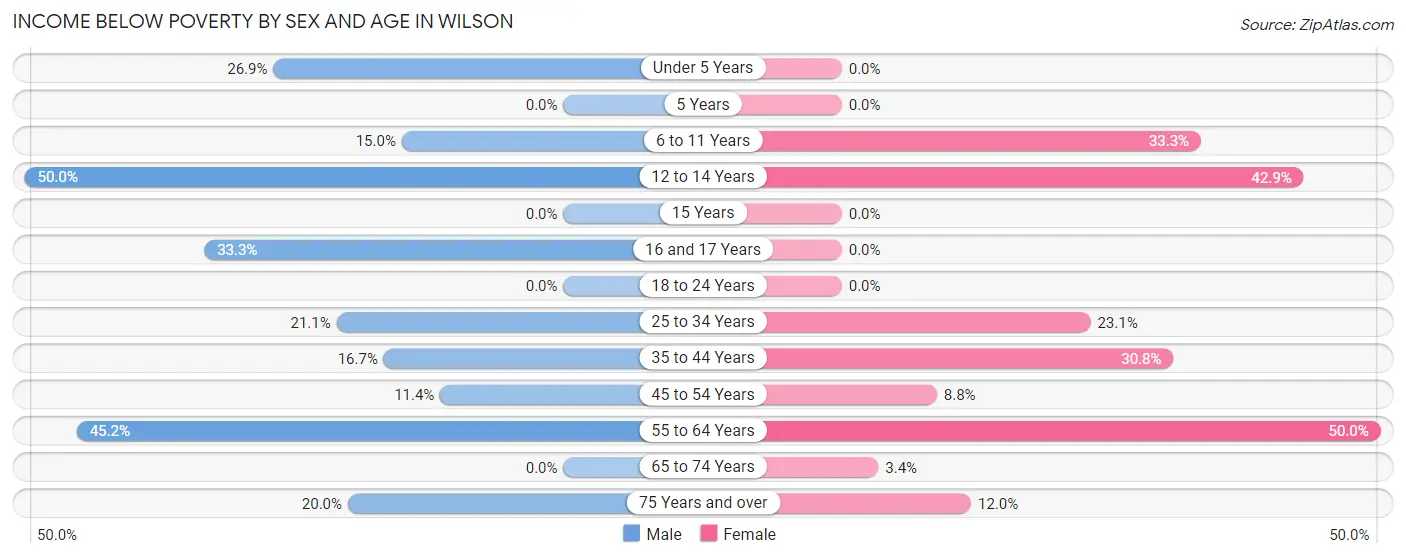
| Age Bracket | Male | Female |
| Under 5 Years | 7 (26.9%) | 0 (0.0%) |
| 5 Years | 0 (0.0%) | 0 (0.0%) |
| 6 to 11 Years | 6 (15.0%) | 10 (33.3%) |
| 12 to 14 Years | 5 (50.0%) | 3 (42.9%) |
| 15 Years | 0 (0.0%) | 0 (0.0%) |
| 16 and 17 Years | 1 (33.3%) | 0 (0.0%) |
| 18 to 24 Years | 0 (0.0%) | 0 (0.0%) |
| 25 to 34 Years | 12 (21.0%) | 9 (23.1%) |
| 35 to 44 Years | 4 (16.7%) | 8 (30.8%) |
| 45 to 54 Years | 4 (11.4%) | 3 (8.8%) |
| 55 to 64 Years | 14 (45.2%) | 15 (50.0%) |
| 65 to 74 Years | 0 (0.0%) | 2 (3.4%) |
| 75 Years and over | 11 (20.0%) | 6 (12.0%) |
| Total | 64 (16.3%) | 56 (17.8%) |
Income Above Poverty by Sex and Age in Wilson
According to the poverty statistics in Wilson, males aged 5 years and females aged under 5 years are the age groups that are most secure financially, with 100.0% of males and 100.0% of females in these age groups living above the poverty line.
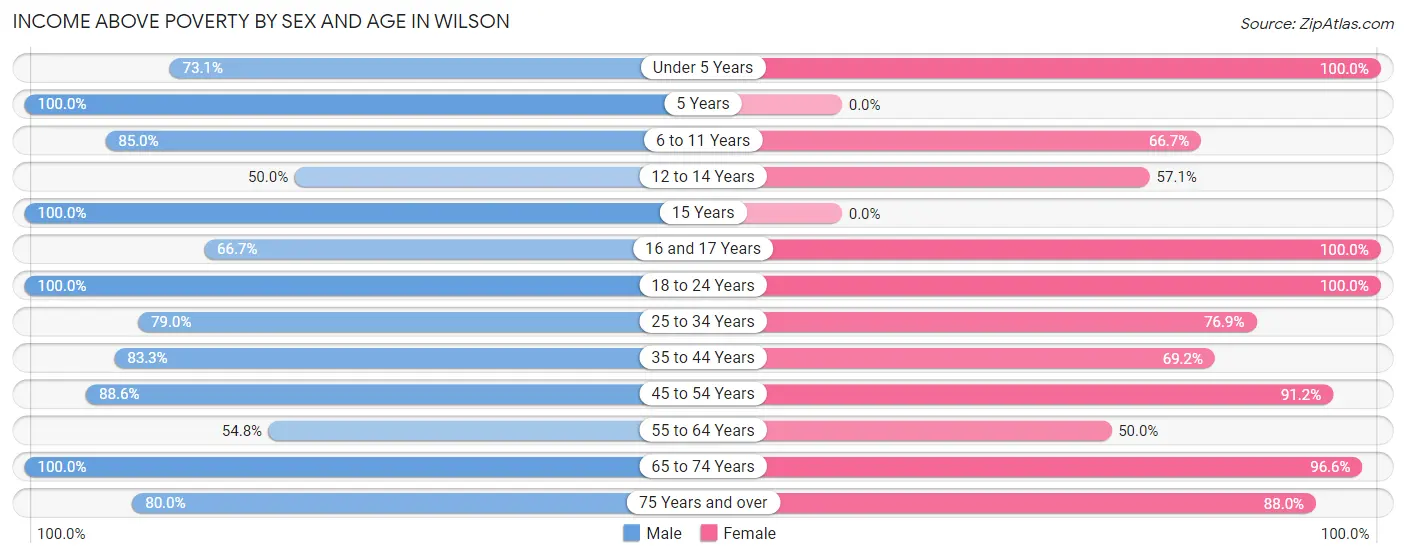
| Age Bracket | Male | Female |
| Under 5 Years | 19 (73.1%) | 18 (100.0%) |
| 5 Years | 2 (100.0%) | 0 (0.0%) |
| 6 to 11 Years | 34 (85.0%) | 20 (66.7%) |
| 12 to 14 Years | 5 (50.0%) | 4 (57.1%) |
| 15 Years | 2 (100.0%) | 0 (0.0%) |
| 16 and 17 Years | 2 (66.7%) | 2 (100.0%) |
| 18 to 24 Years | 46 (100.0%) | 20 (100.0%) |
| 25 to 34 Years | 45 (78.9%) | 30 (76.9%) |
| 35 to 44 Years | 20 (83.3%) | 18 (69.2%) |
| 45 to 54 Years | 31 (88.6%) | 31 (91.2%) |
| 55 to 64 Years | 17 (54.8%) | 15 (50.0%) |
| 65 to 74 Years | 61 (100.0%) | 57 (96.6%) |
| 75 Years and over | 44 (80.0%) | 44 (88.0%) |
| Total | 328 (83.7%) | 259 (82.2%) |
Income Below Poverty Among Married-Couple Families in Wilson
The poverty statistics for married-couple families in Wilson show that 10.4% or 13 of the total 125 families live below the poverty line. Families with no children have the highest poverty rate of 14.5%, comprising of 12 families. On the other hand, families with 1 or 2 children have the lowest poverty rate of 0.0%, which includes 0 families.
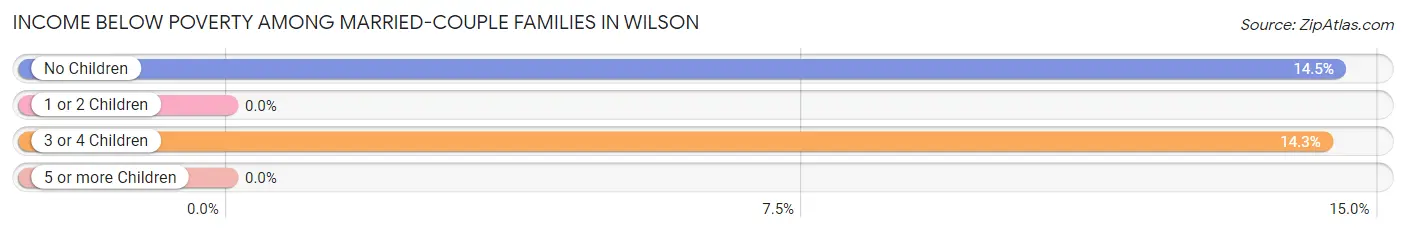
| Children | Above Poverty | Below Poverty |
| No Children | 71 (85.5%) | 12 (14.5%) |
| 1 or 2 Children | 35 (100.0%) | 0 (0.0%) |
| 3 or 4 Children | 6 (85.7%) | 1 (14.3%) |
| 5 or more Children | 0 (0.0%) | 0 (0.0%) |
| Total | 112 (89.6%) | 13 (10.4%) |
Income Below Poverty Among Single-Parent Households in Wilson
According to the poverty data in Wilson, 66.7% or 8 single-father households and 17.4% or 4 single-mother households are living below the poverty line. Among single-father households, those with 3 or 4 children have the highest poverty rate, with 5 households (100.0%) experiencing poverty. Likewise, among single-mother households, those with 3 or 4 children have the highest poverty rate, with 3 households (100.0%) falling below the poverty line.
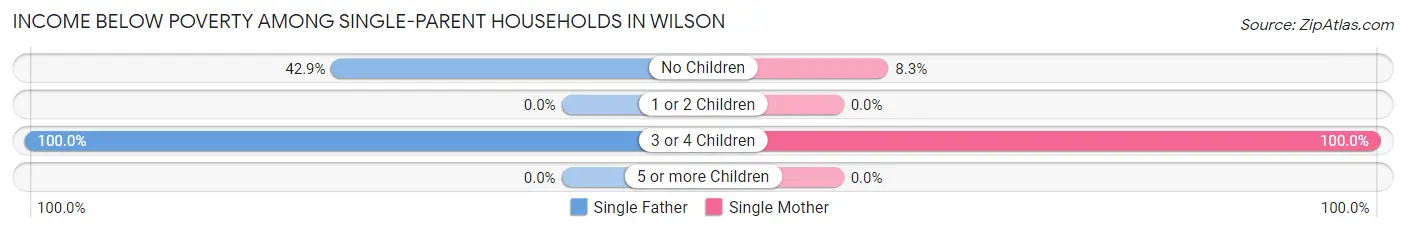
| Children | Single Father | Single Mother |
| No Children | 3 (42.9%) | 1 (8.3%) |
| 1 or 2 Children | 0 (0.0%) | 0 (0.0%) |
| 3 or 4 Children | 5 (100.0%) | 3 (100.0%) |
| 5 or more Children | 0 (0.0%) | 0 (0.0%) |
| Total | 8 (66.7%) | 4 (17.4%) |
Income Below Poverty Among Married-Couple vs Single-Parent Households in Wilson
The poverty data for Wilson shows that 13 of the married-couple family households (10.4%) and 12 of the single-parent households (34.3%) are living below the poverty level. Within the married-couple family households, those with no children have the highest poverty rate, with 12 households (14.5%) falling below the poverty line. Among the single-parent households, those with 3 or 4 children have the highest poverty rate, with 8 household (100.0%) living below poverty.
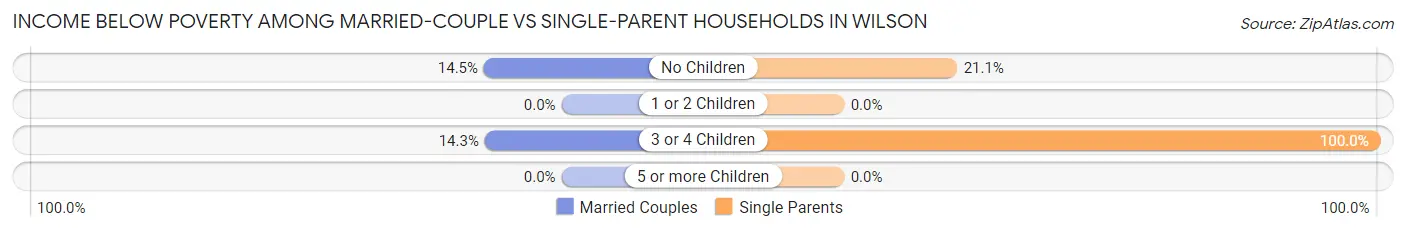
| Children | Married-Couple Families | Single-Parent Households |
| No Children | 12 (14.5%) | 4 (21.0%) |
| 1 or 2 Children | 0 (0.0%) | 0 (0.0%) |
| 3 or 4 Children | 1 (14.3%) | 8 (100.0%) |
| 5 or more Children | 0 (0.0%) | 0 (0.0%) |
| Total | 13 (10.4%) | 12 (34.3%) |
Race in Wilson
The most populous races in Wilson are White / Caucasian (692 | 89.1%), Two or more Races (75 | 9.7%), and Hispanic or Latino (42 | 5.4%).
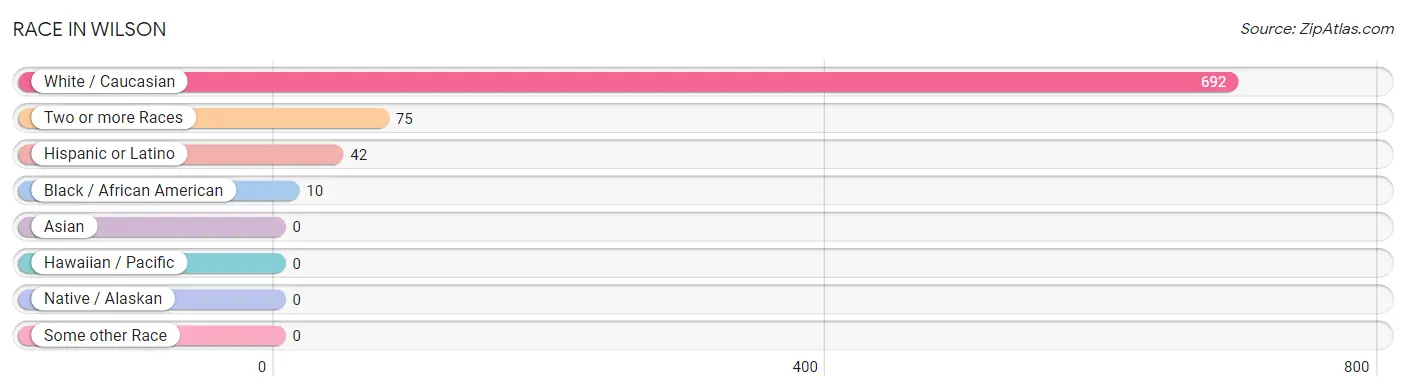
| Race | # Population | % Population |
| Asian | 0 | 0.0% |
| Black / African American | 10 | 1.3% |
| Hawaiian / Pacific | 0 | 0.0% |
| Hispanic or Latino | 42 | 5.4% |
| Native / Alaskan | 0 | 0.0% |
| White / Caucasian | 692 | 89.1% |
| Two or more Races | 75 | 9.7% |
| Some other Race | 0 | 0.0% |
| Total | 777 | 100.0% |
Ancestry in Wilson
The most populous ancestries reported in Wilson are German (243 | 31.3%), Czech (118 | 15.2%), American (69 | 8.9%), English (48 | 6.2%), and Irish (48 | 6.2%), together accounting for 67.7% of all Wilson residents.
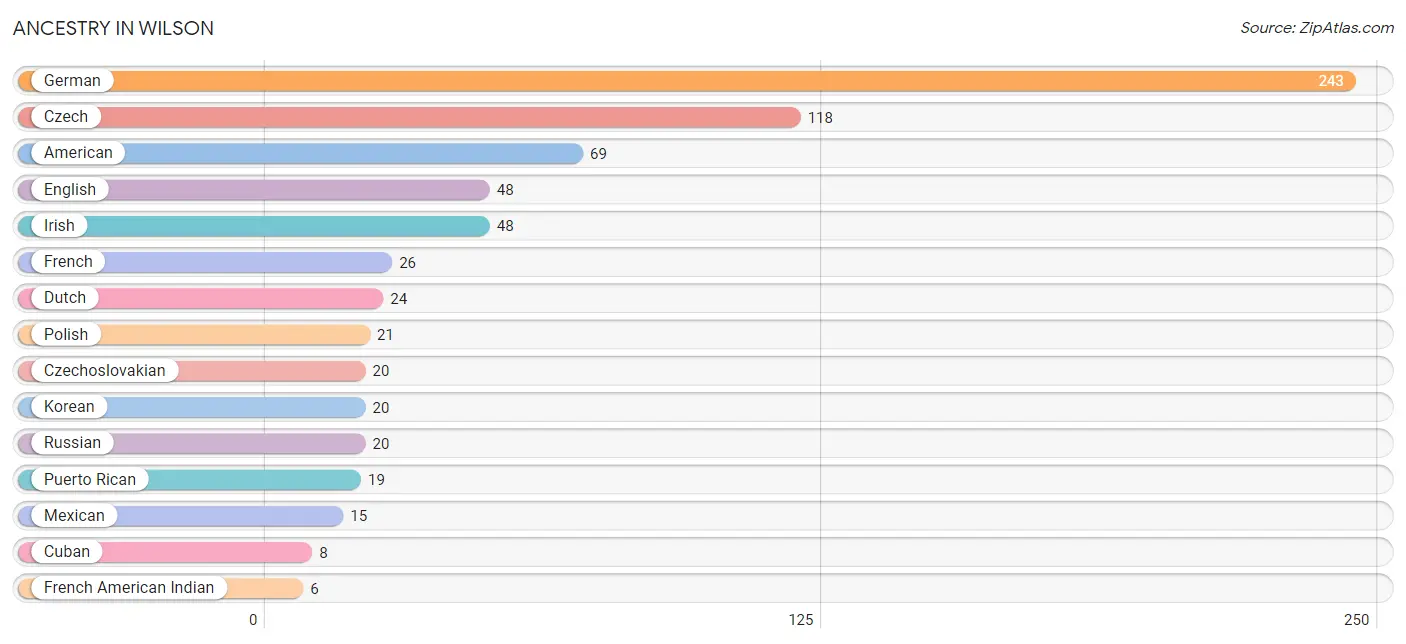
| Ancestry | # Population | % Population |
| American | 69 | 8.9% |
| British | 2 | 0.3% |
| Cherokee | 1 | 0.1% |
| Chickasaw | 3 | 0.4% |
| Cuban | 8 | 1.0% |
| Czech | 118 | 15.2% |
| Czechoslovakian | 20 | 2.6% |
| Danish | 2 | 0.3% |
| Dutch | 24 | 3.1% |
| English | 48 | 6.2% |
| French | 26 | 3.4% |
| French American Indian | 6 | 0.8% |
| French Canadian | 3 | 0.4% |
| German | 243 | 31.3% |
| German Russian | 3 | 0.4% |
| Irish | 48 | 6.2% |
| Italian | 5 | 0.6% |
| Korean | 20 | 2.6% |
| Luxembourger | 2 | 0.3% |
| Mexican | 15 | 1.9% |
| Norwegian | 1 | 0.1% |
| Polish | 21 | 2.7% |
| Puerto Rican | 19 | 2.5% |
| Russian | 20 | 2.6% |
| Scotch-Irish | 4 | 0.5% |
| Scottish | 2 | 0.3% |
| Shoshone | 1 | 0.1% |
| Swedish | 6 | 0.8% | View All 28 Rows |
Immigrants in Wilson
The most numerous immigrant groups reported in Wilson came from , and Canada (2 | 0.3%), together accounting for 0.3% of all Wilson residents.

| Immigration Origin | # Population | % Population |
| Canada | 2 | 0.3% | View All 1 Rows |
Sex and Age in Wilson
Sex and Age in Wilson
The most populous age groups in Wilson are 75 to 79 Years (45 | 10.7%) for men and 65 to 69 Years (46 | 12.9%) for women.
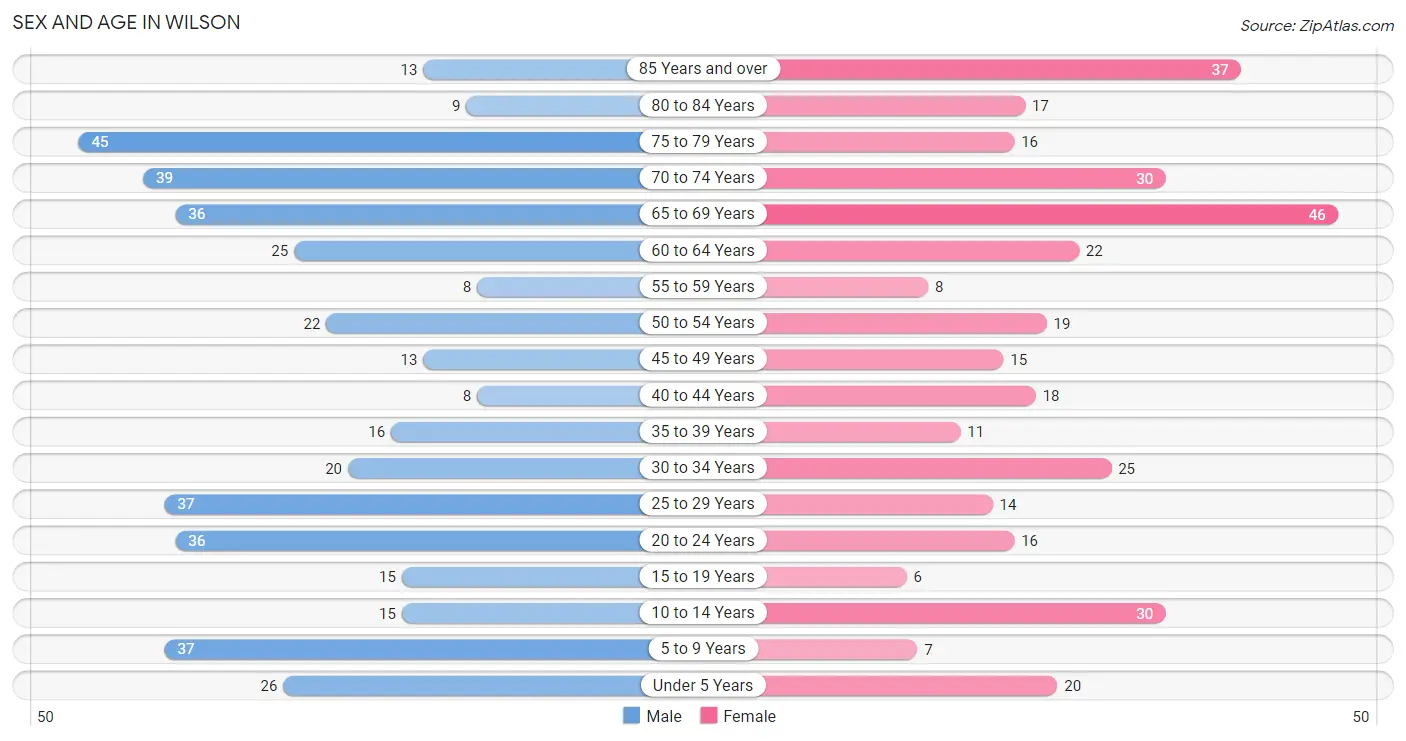
| Age Bracket | Male | Female |
| Under 5 Years | 26 (6.2%) | 20 (5.6%) |
| 5 to 9 Years | 37 (8.8%) | 7 (2.0%) |
| 10 to 14 Years | 15 (3.6%) | 30 (8.4%) |
| 15 to 19 Years | 15 (3.6%) | 6 (1.7%) |
| 20 to 24 Years | 36 (8.6%) | 16 (4.5%) |
| 25 to 29 Years | 37 (8.8%) | 14 (3.9%) |
| 30 to 34 Years | 20 (4.8%) | 25 (7.0%) |
| 35 to 39 Years | 16 (3.8%) | 11 (3.1%) |
| 40 to 44 Years | 8 (1.9%) | 18 (5.0%) |
| 45 to 49 Years | 13 (3.1%) | 15 (4.2%) |
| 50 to 54 Years | 22 (5.2%) | 19 (5.3%) |
| 55 to 59 Years | 8 (1.9%) | 8 (2.2%) |
| 60 to 64 Years | 25 (5.9%) | 22 (6.2%) |
| 65 to 69 Years | 36 (8.6%) | 46 (12.9%) |
| 70 to 74 Years | 39 (9.3%) | 30 (8.4%) |
| 75 to 79 Years | 45 (10.7%) | 16 (4.5%) |
| 80 to 84 Years | 9 (2.1%) | 17 (4.8%) |
| 85 Years and over | 13 (3.1%) | 37 (10.4%) |
| Total | 420 (100.0%) | 357 (100.0%) |
Families and Households in Wilson
Median Family Size in Wilson
The median family size in Wilson is 3.44 persons per family, with single male/father families (12 | 7.5%) accounting for the largest median family size of 3.75 persons per family. On the other hand, single female/mother families (23 | 14.4%) represent the smallest median family size with 2.87 persons per family.
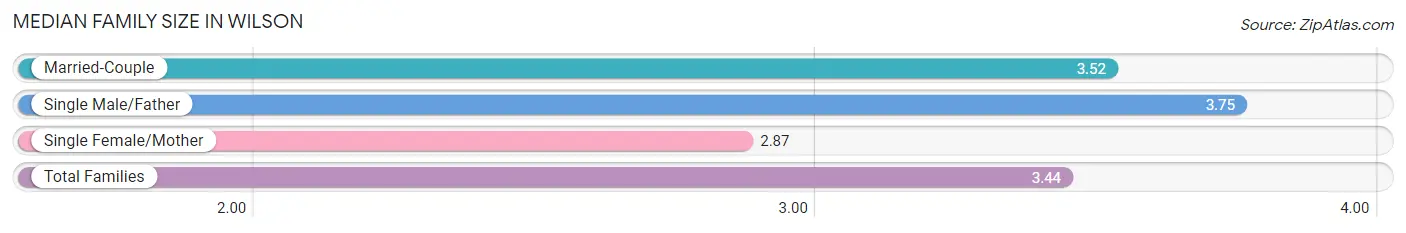
| Family Type | # Families | Family Size |
| Married-Couple | 125 (78.1%) | 3.52 |
| Single Male/Father | 12 (7.5%) | 3.75 |
| Single Female/Mother | 23 (14.4%) | 2.87 |
| Total Families | 160 (100.0%) | 3.44 |
Median Household Size in Wilson
The median household size in Wilson is 2.63 persons per household, with single male/father households (12 | 4.4%) accounting for the largest median household size of 3.75 persons per household. non-family households (110 | 40.7%) represent the smallest median household size with 1.35 persons per household.
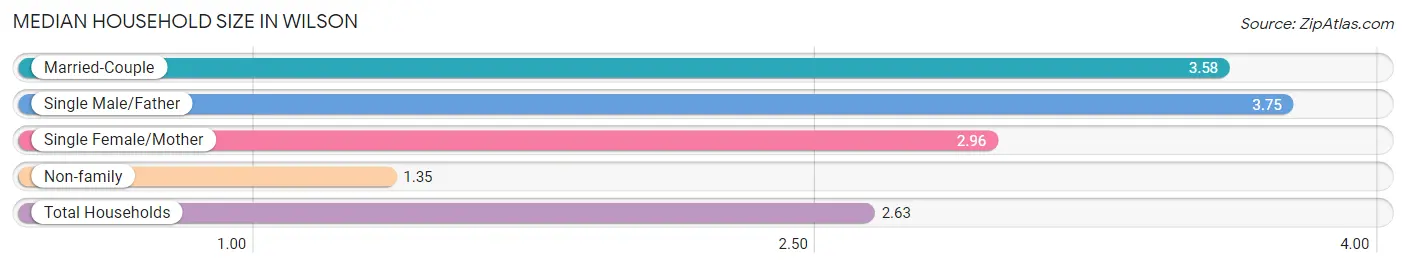
| Household Type | # Households | Household Size |
| Married-Couple | 125 (46.3%) | 3.58 |
| Single Male/Father | 12 (4.4%) | 3.75 |
| Single Female/Mother | 23 (8.5%) | 2.96 |
| Non-family | 110 (40.7%) | 1.35 |
| Total Households | 270 (100.0%) | 2.63 |
Household Size by Marriage Status in Wilson
Out of a total of 270 households in Wilson, 160 (59.3%) are family households, while 110 (40.7%) are nonfamily households. The most numerous type of family households are 2-person households, comprising 91, and the most common type of nonfamily households are 1-person households, comprising 83.
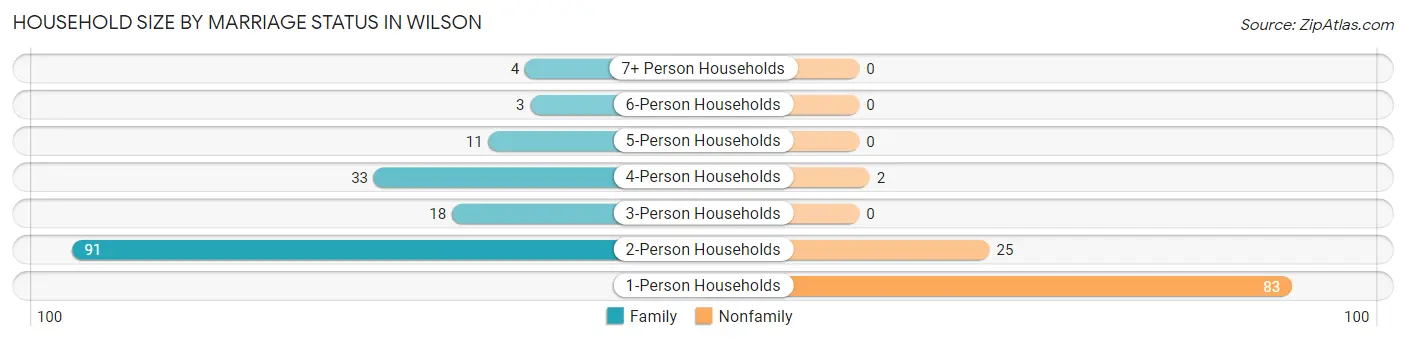
| Household Size | Family Households | Nonfamily Households |
| 1-Person Households | - | 83 (30.7%) |
| 2-Person Households | 91 (33.7%) | 25 (9.3%) |
| 3-Person Households | 18 (6.7%) | 0 (0.0%) |
| 4-Person Households | 33 (12.2%) | 2 (0.7%) |
| 5-Person Households | 11 (4.1%) | 0 (0.0%) |
| 6-Person Households | 3 (1.1%) | 0 (0.0%) |
| 7+ Person Households | 4 (1.5%) | 0 (0.0%) |
| Total | 160 (59.3%) | 110 (40.7%) |
Female Fertility in Wilson
Fertility by Age in Wilson
Average fertility rate in Wilson is 133.0 births per 1,000 women. Women in the age bracket of 20 to 34 years have the highest fertility rate with 255.0 births per 1,000 women. Women in the age bracket of 20 to 34 years acount for 100.0% of all women with births.
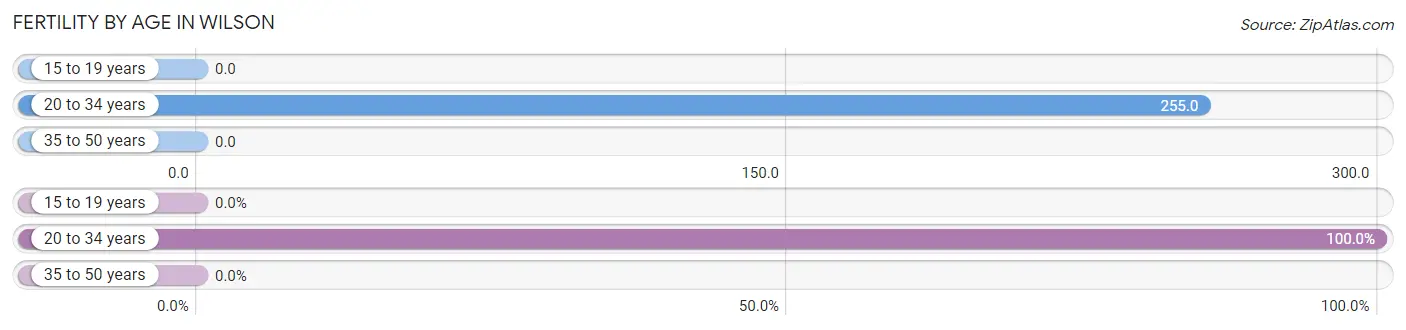
| Age Bracket | Women with Births | Births / 1,000 Women |
| 15 to 19 years | 0 (0.0%) | 0.0 |
| 20 to 34 years | 14 (100.0%) | 255.0 |
| 35 to 50 years | 0 (0.0%) | 0.0 |
| Total | 14 (100.0%) | 133.0 |
Fertility by Age by Marriage Status in Wilson
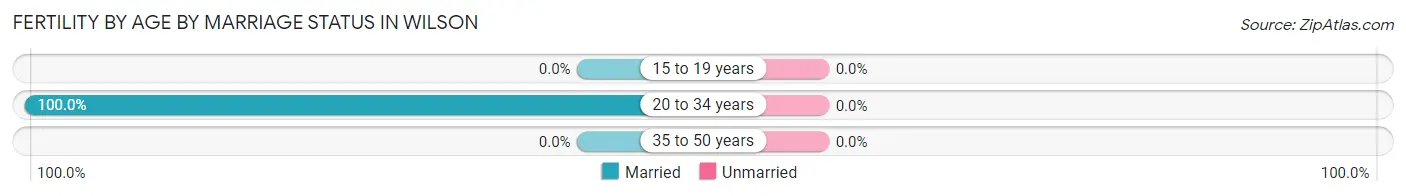
| Age Bracket | Married | Unmarried |
| 15 to 19 years | 0 (0.0%) | 0 (0.0%) |
| 20 to 34 years | 14 (100.0%) | 0 (0.0%) |
| 35 to 50 years | 0 (0.0%) | 0 (0.0%) |
| Total | 14 (100.0%) | 0 (0.0%) |
Fertility by Education in Wilson
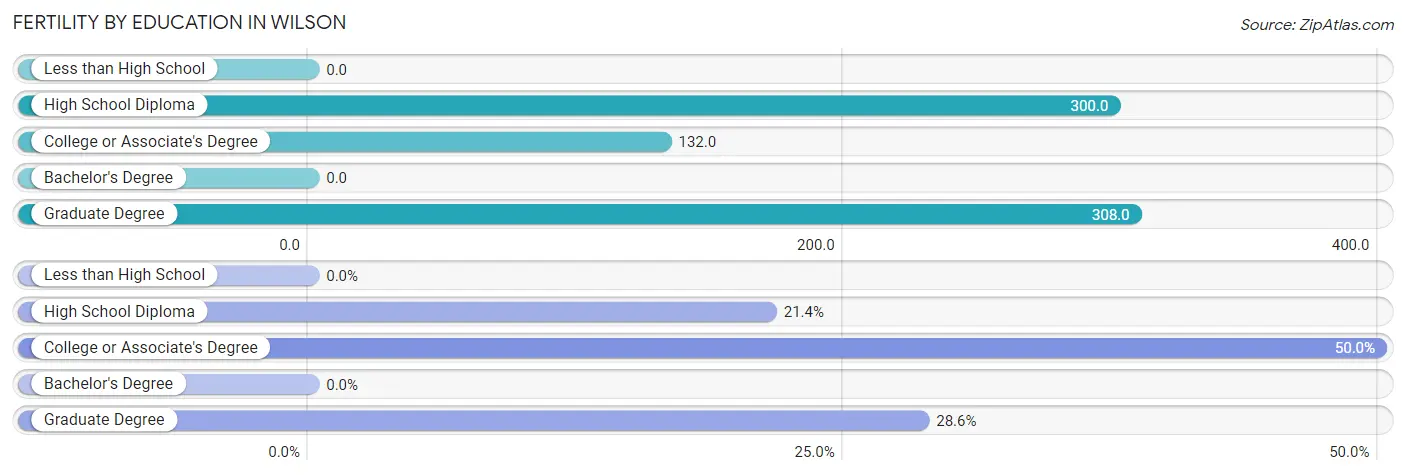
| Educational Attainment | Women with Births | Births / 1,000 Women |
| Less than High School | 0 (0.0%) | 0.0 |
| High School Diploma | 3 (21.4%) | 300.0 |
| College or Associate's Degree | 7 (50.0%) | 132.0 |
| Bachelor's Degree | 0 (0.0%) | 0.0 |
| Graduate Degree | 4 (28.6%) | 308.0 |
| Total | 14 (100.0%) | 133.0 |
Fertility by Education by Marriage Status in Wilson
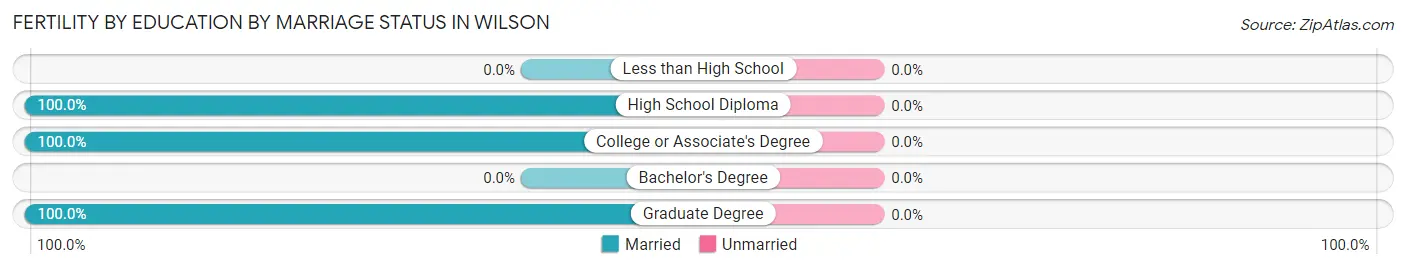
| Educational Attainment | Married | Unmarried |
| Less than High School | 0 (0.0%) | 0 (0.0%) |
| High School Diploma | 3 (100.0%) | 0 (0.0%) |
| College or Associate's Degree | 7 (100.0%) | 0 (0.0%) |
| Bachelor's Degree | 0 (0.0%) | 0 (0.0%) |
| Graduate Degree | 4 (100.0%) | 0 (0.0%) |
| Total | 14 (100.0%) | 0 (0.0%) |
Employment Characteristics in Wilson
Employment by Class of Employer in Wilson
Among the 300 employed individuals in Wilson, private company employees (177 | 59.0%), local government employees (37 | 12.3%), and state government employees (34 | 11.3%) make up the most common classes of employment.
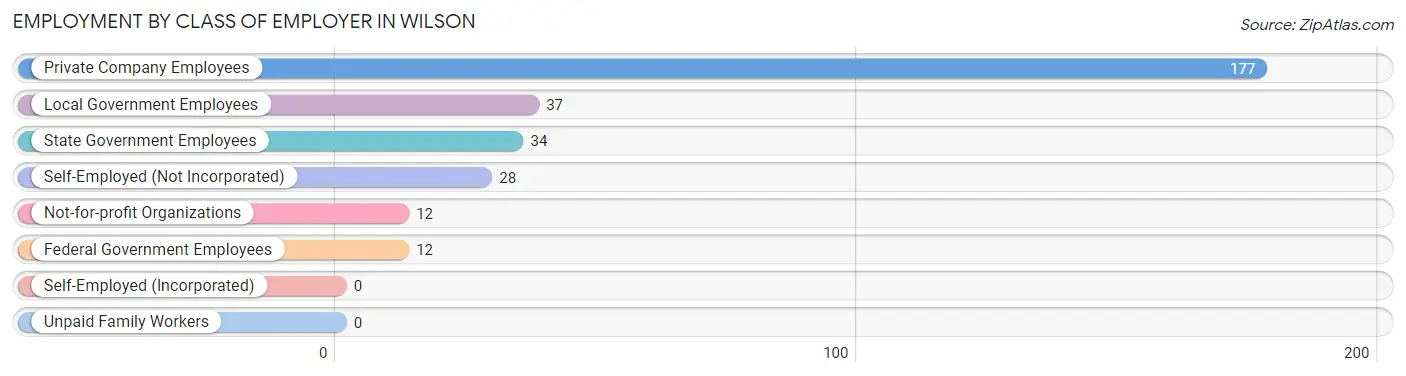
| Employer Class | # Employees | % Employees |
| Private Company Employees | 177 | 59.0% |
| Self-Employed (Incorporated) | 0 | 0.0% |
| Self-Employed (Not Incorporated) | 28 | 9.3% |
| Not-for-profit Organizations | 12 | 4.0% |
| Local Government Employees | 37 | 12.3% |
| State Government Employees | 34 | 11.3% |
| Federal Government Employees | 12 | 4.0% |
| Unpaid Family Workers | 0 | 0.0% |
| Total | 300 | 100.0% |
Employment Status by Age in Wilson
According to the labor force statistics for Wilson, out of the total population over 16 years of age (640), 47.8% or 306 individuals are in the labor force, with 2.0% or 6 of them unemployed. The age group with the highest labor force participation rate is 30 to 34 years, with 100.0% or 45 individuals in the labor force. Within the labor force, the 35 to 44 years age range has the highest percentage of unemployed individuals, with 10.0% or 4 of them being unemployed.
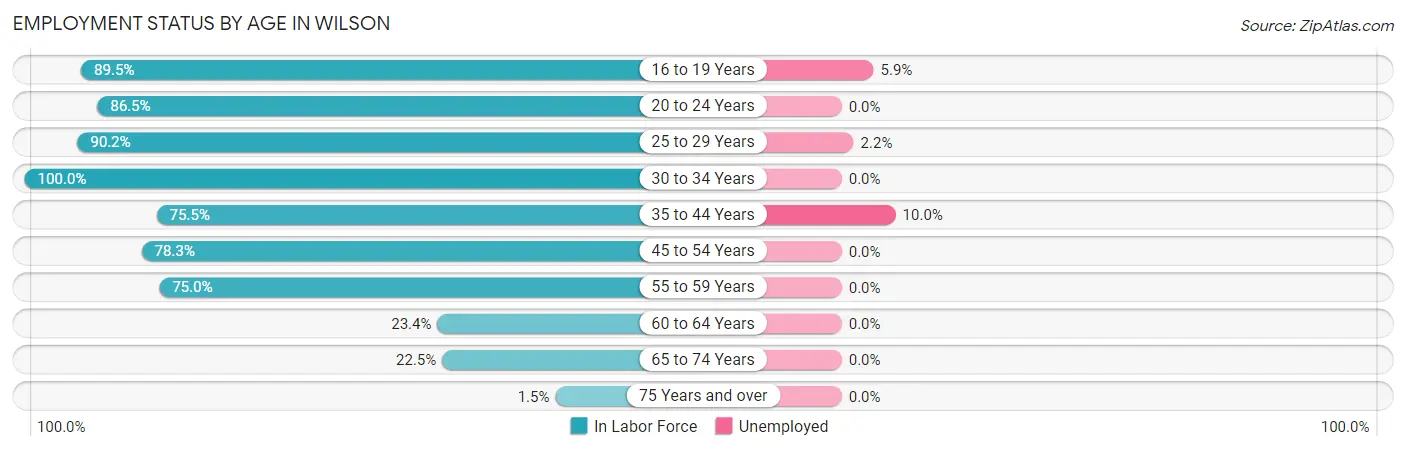
| Age Bracket | In Labor Force | Unemployed |
| 16 to 19 Years | 17 (89.5%) | 1 (5.9%) |
| 20 to 24 Years | 45 (86.5%) | 0 (0.0%) |
| 25 to 29 Years | 46 (90.2%) | 1 (2.2%) |
| 30 to 34 Years | 45 (100.0%) | 0 (0.0%) |
| 35 to 44 Years | 40 (75.5%) | 4 (10.0%) |
| 45 to 54 Years | 54 (78.3%) | 0 (0.0%) |
| 55 to 59 Years | 12 (75.0%) | 0 (0.0%) |
| 60 to 64 Years | 11 (23.4%) | 0 (0.0%) |
| 65 to 74 Years | 34 (22.5%) | 0 (0.0%) |
| 75 Years and over | 2 (1.5%) | 0 (0.0%) |
| Total | 306 (47.8%) | 6 (2.0%) |
Employment Status by Educational Attainment in Wilson
According to labor force statistics for Wilson, 74.0% of individuals (208) out of the total population between 25 and 64 years of age (281) are in the labor force, with 2.4% or 5 of them being unemployed. The group with the highest labor force participation rate are those with the educational attainment of bachelor's degree or higher, with 87.3% or 55 individuals in the labor force. Within the labor force, individuals with less than high school education have the highest percentage of unemployment, with 57.1% or 4 of them being unemployed.
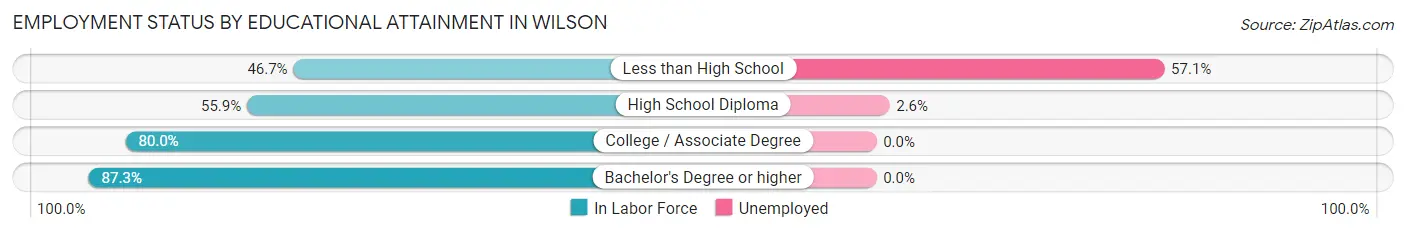
| Educational Attainment | In Labor Force | Unemployed |
| Less than High School | 7 (46.7%) | 9 (57.1%) |
| High School Diploma | 38 (55.9%) | 2 (2.6%) |
| College / Associate Degree | 108 (80.0%) | 0 (0.0%) |
| Bachelor's Degree or higher | 55 (87.3%) | 0 (0.0%) |
| Total | 208 (74.0%) | 7 (2.4%) |
Employment Occupations by Sex in Wilson
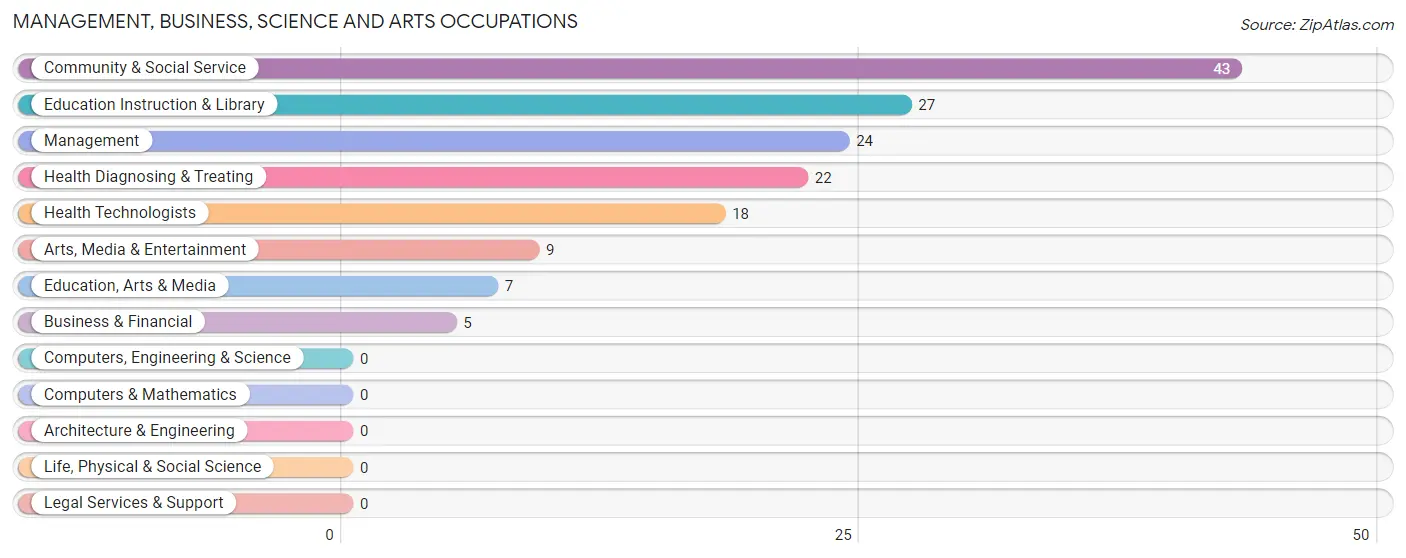
Management, Business, Science and Arts Occupations
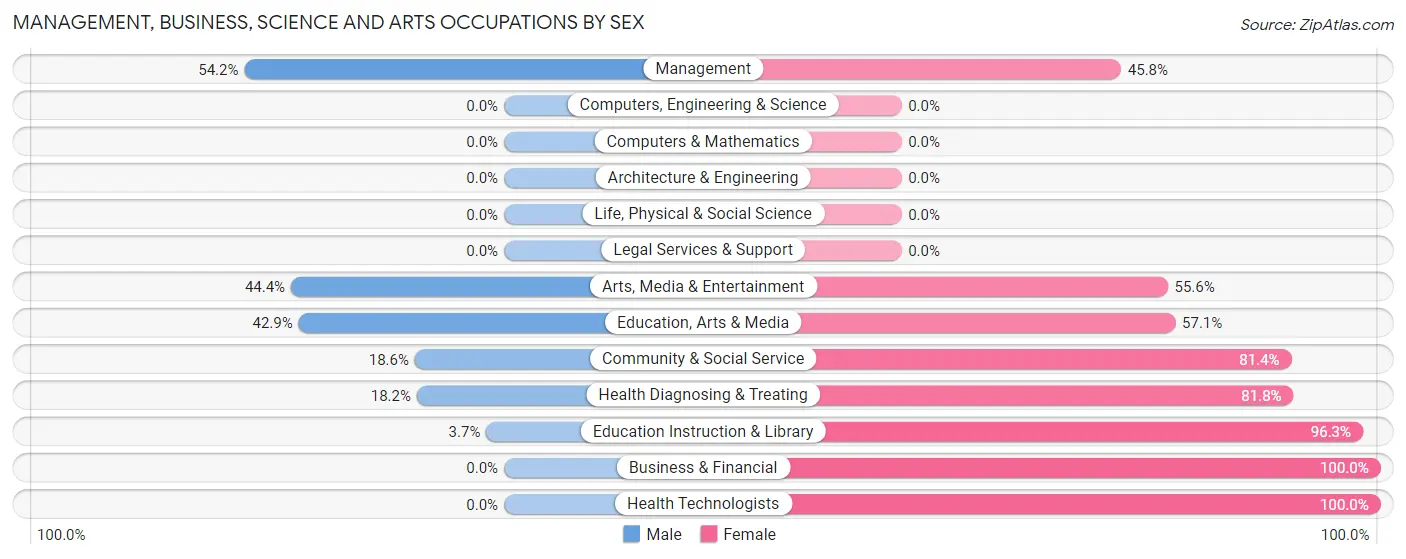
The most common Management, Business, Science and Arts occupations in Wilson are Community & Social Service (43 | 14.5%), Education Instruction & Library (27 | 9.1%), Management (24 | 8.1%), Health Diagnosing & Treating (22 | 7.4%), and Health Technologists (18 | 6.1%).
Management, Business, Science and Arts Occupations by Sex
Within the Management, Business, Science and Arts occupations in Wilson, the most male-oriented occupations are Management (54.2%), Arts, Media & Entertainment (44.4%), and Education, Arts & Media (42.9%), while the most female-oriented occupations are Business & Financial (100.0%), Health Technologists (100.0%), and Education Instruction & Library (96.3%).
| Occupation | Male | Female |
| Management | 13 (54.2%) | 11 (45.8%) |
| Business & Financial | 0 (0.0%) | 5 (100.0%) |
| Computers, Engineering & Science | 0 (0.0%) | 0 (0.0%) |
| Computers & Mathematics | 0 (0.0%) | 0 (0.0%) |
| Architecture & Engineering | 0 (0.0%) | 0 (0.0%) |
| Life, Physical & Social Science | 0 (0.0%) | 0 (0.0%) |
| Community & Social Service | 8 (18.6%) | 35 (81.4%) |
| Education, Arts & Media | 3 (42.9%) | 4 (57.1%) |
| Legal Services & Support | 0 (0.0%) | 0 (0.0%) |
| Education Instruction & Library | 1 (3.7%) | 26 (96.3%) |
| Arts, Media & Entertainment | 4 (44.4%) | 5 (55.6%) |
| Health Diagnosing & Treating | 4 (18.2%) | 18 (81.8%) |
| Health Technologists | 0 (0.0%) | 18 (100.0%) |
| Total (Category) | 25 (26.6%) | 69 (73.4%) |
| Total (Overall) | 179 (60.3%) | 118 (39.7%) |
Services Occupations
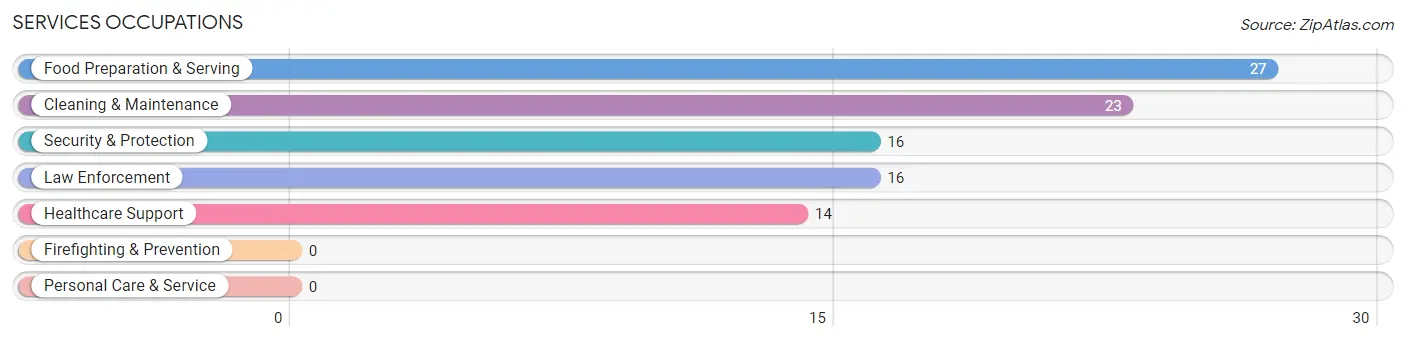
The most common Services occupations in Wilson are Food Preparation & Serving (27 | 9.1%), Cleaning & Maintenance (23 | 7.7%), Security & Protection (16 | 5.4%), Law Enforcement (16 | 5.4%), and Healthcare Support (14 | 4.7%).
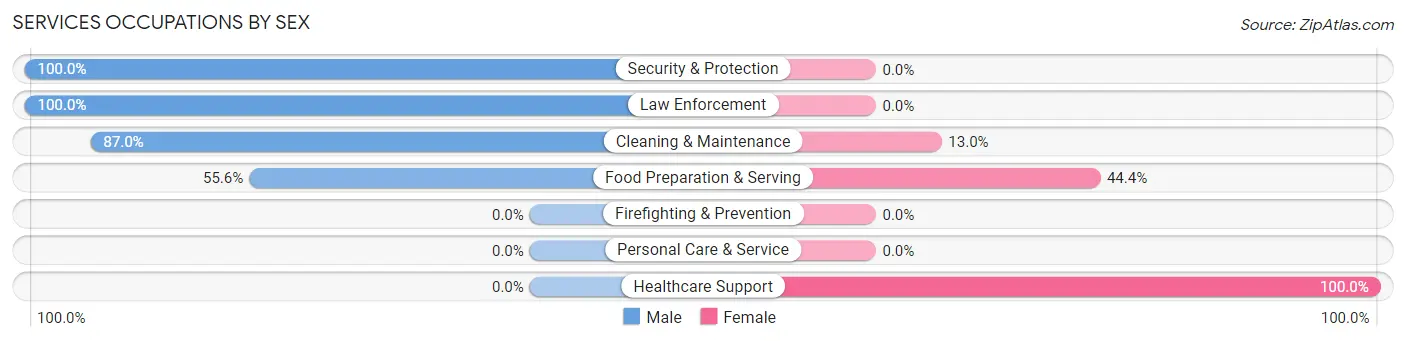
Services Occupations by Sex
Within the Services occupations in Wilson, the most male-oriented occupations are Security & Protection (100.0%), Law Enforcement (100.0%), and Cleaning & Maintenance (87.0%), while the most female-oriented occupations are Healthcare Support (100.0%), Food Preparation & Serving (44.4%), and Cleaning & Maintenance (13.0%).
| Occupation | Male | Female |
| Healthcare Support | 0 (0.0%) | 14 (100.0%) |
| Security & Protection | 16 (100.0%) | 0 (0.0%) |
| Firefighting & Prevention | 0 (0.0%) | 0 (0.0%) |
| Law Enforcement | 16 (100.0%) | 0 (0.0%) |
| Food Preparation & Serving | 15 (55.6%) | 12 (44.4%) |
| Cleaning & Maintenance | 20 (87.0%) | 3 (13.0%) |
| Personal Care & Service | 0 (0.0%) | 0 (0.0%) |
| Total (Category) | 51 (63.7%) | 29 (36.2%) |
| Total (Overall) | 179 (60.3%) | 118 (39.7%) |
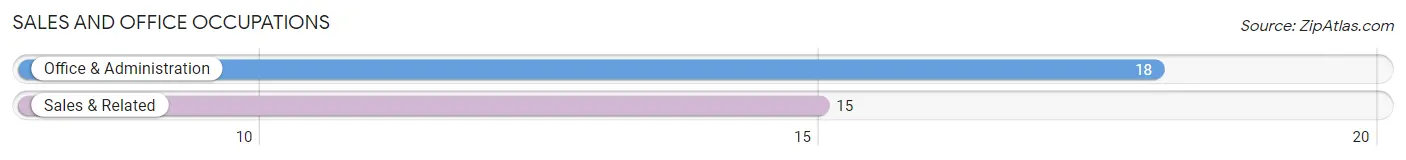
Sales and Office Occupations
The most common Sales and Office occupations in Wilson are Office & Administration (18 | 6.1%), and Sales & Related (15 | 5.1%).
Sales and Office Occupations by Sex
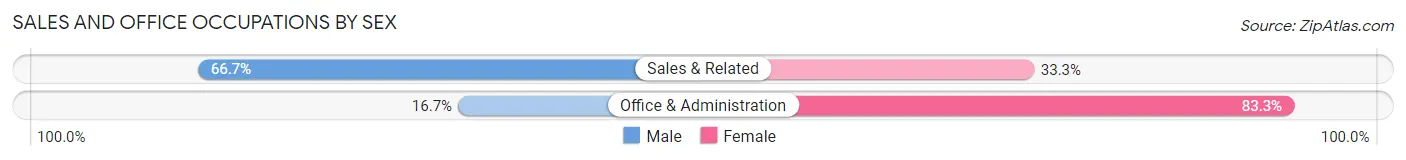
| Occupation | Male | Female |
| Sales & Related | 10 (66.7%) | 5 (33.3%) |
| Office & Administration | 3 (16.7%) | 15 (83.3%) |
| Total (Category) | 13 (39.4%) | 20 (60.6%) |
| Total (Overall) | 179 (60.3%) | 118 (39.7%) |
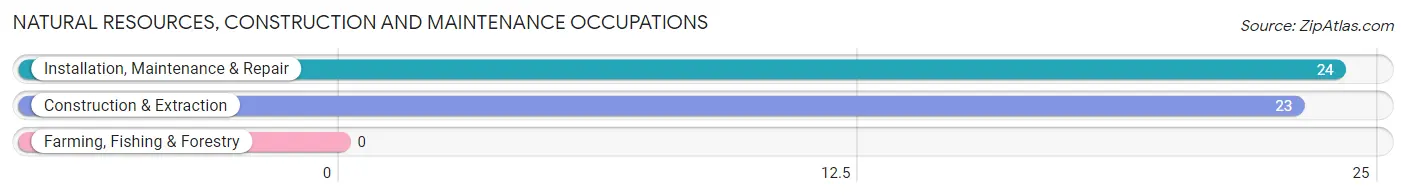
Natural Resources, Construction and Maintenance Occupations
The most common Natural Resources, Construction and Maintenance occupations in Wilson are Installation, Maintenance & Repair (24 | 8.1%), and Construction & Extraction (23 | 7.7%).
Natural Resources, Construction and Maintenance Occupations by Sex
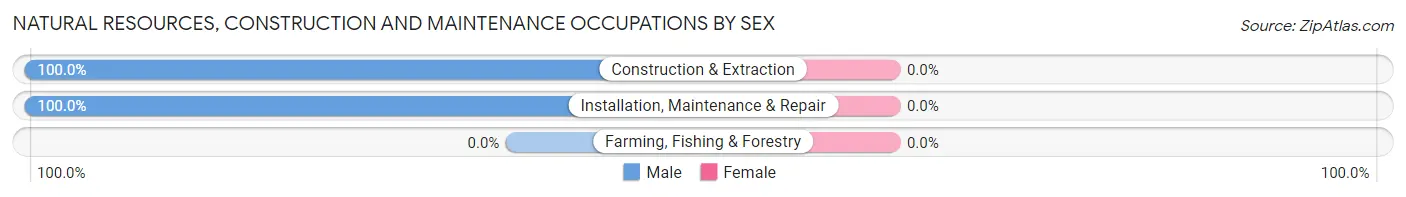
| Occupation | Male | Female |
| Farming, Fishing & Forestry | 0 (0.0%) | 0 (0.0%) |
| Construction & Extraction | 23 (100.0%) | 0 (0.0%) |
| Installation, Maintenance & Repair | 24 (100.0%) | 0 (0.0%) |
| Total (Category) | 47 (100.0%) | 0 (0.0%) |
| Total (Overall) | 179 (60.3%) | 118 (39.7%) |
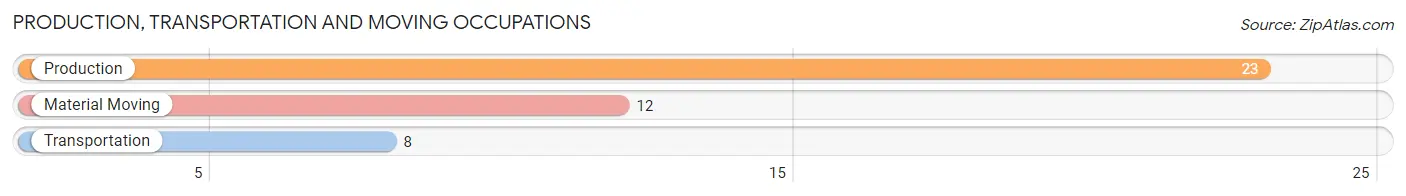
Production, Transportation and Moving Occupations
The most common Production, Transportation and Moving occupations in Wilson are Production (23 | 7.7%), Material Moving (12 | 4.0%), and Transportation (8 | 2.7%).
Production, Transportation and Moving Occupations by Sex
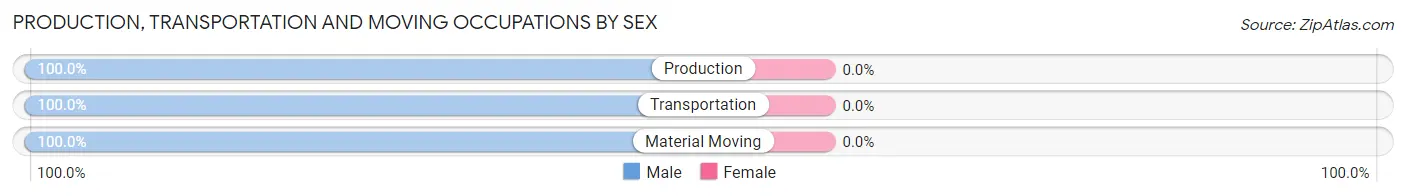
| Occupation | Male | Female |
| Production | 23 (100.0%) | 0 (0.0%) |
| Transportation | 8 (100.0%) | 0 (0.0%) |
| Material Moving | 12 (100.0%) | 0 (0.0%) |
| Total (Category) | 43 (100.0%) | 0 (0.0%) |
| Total (Overall) | 179 (60.3%) | 118 (39.7%) |
Employment Industries by Sex in Wilson
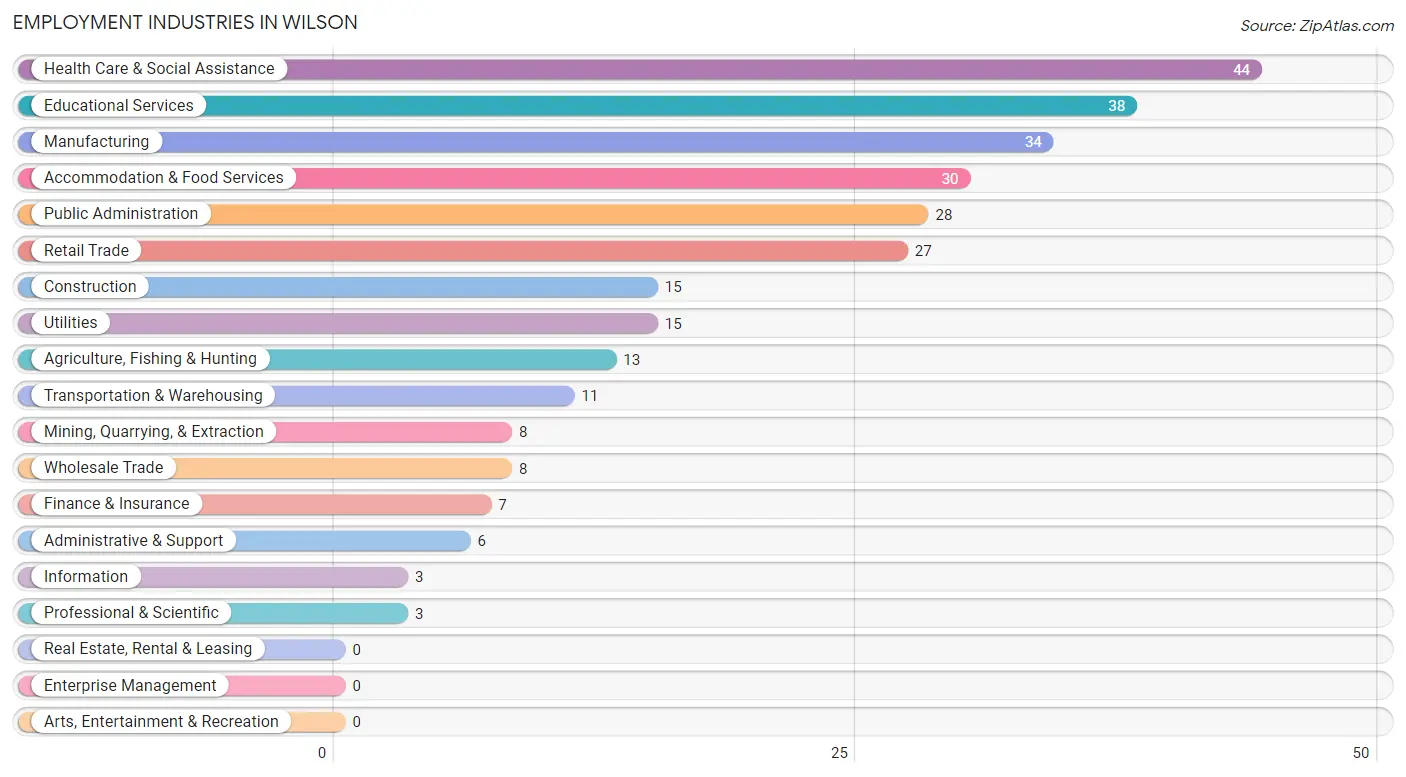
Employment Industries in Wilson
The major employment industries in Wilson include Health Care & Social Assistance (44 | 14.8%), Educational Services (38 | 12.8%), Manufacturing (34 | 11.5%), Accommodation & Food Services (30 | 10.1%), and Public Administration (28 | 9.4%).
Employment Industries by Sex in Wilson
The Wilson industries that see more men than women are Agriculture, Fishing & Hunting (100.0%), Mining, Quarrying, & Extraction (100.0%), and Construction (100.0%), whereas the industries that tend to have a higher number of women are Finance & Insurance (100.0%), Professional & Scientific (100.0%), and Educational Services (86.8%).
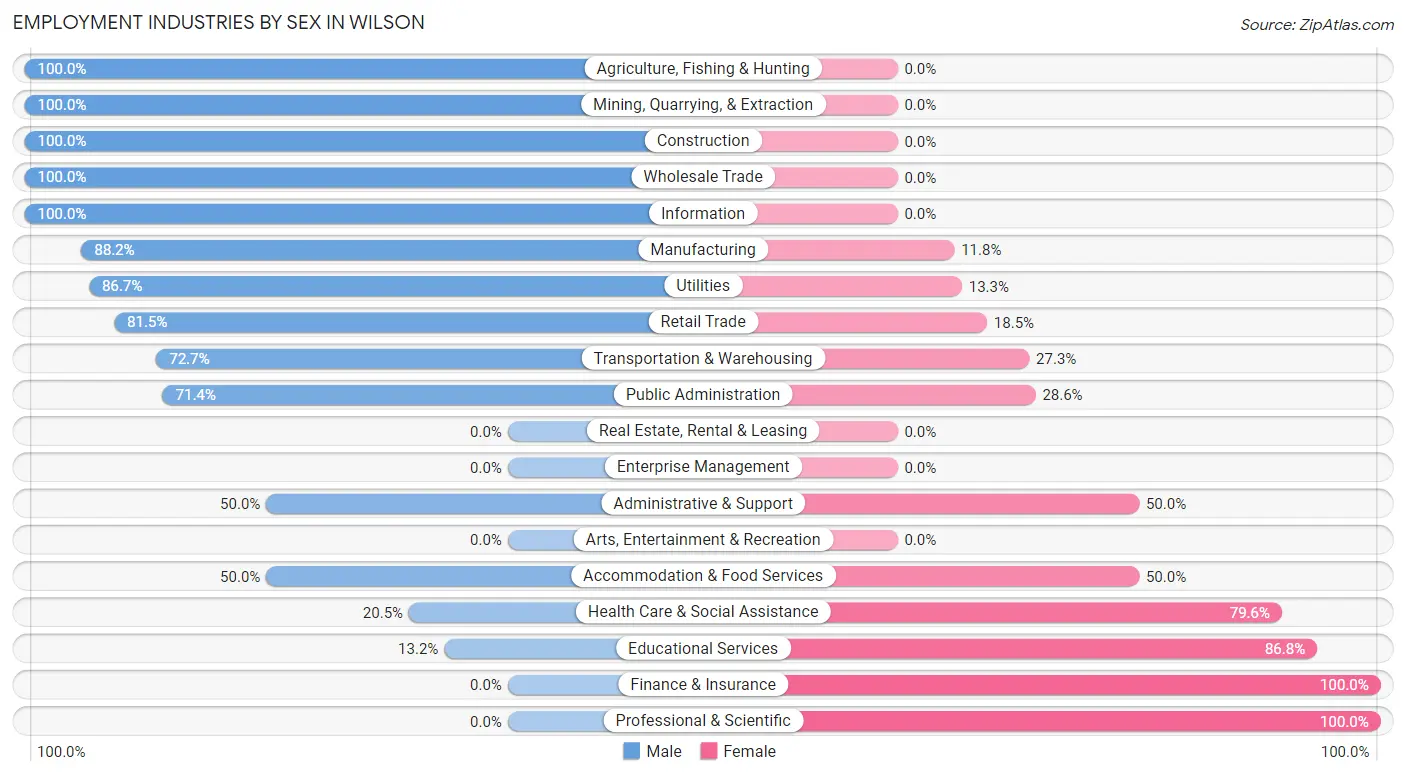
| Industry | Male | Female |
| Agriculture, Fishing & Hunting | 13 (100.0%) | 0 (0.0%) |
| Mining, Quarrying, & Extraction | 8 (100.0%) | 0 (0.0%) |
| Construction | 15 (100.0%) | 0 (0.0%) |
| Manufacturing | 30 (88.2%) | 4 (11.8%) |
| Wholesale Trade | 8 (100.0%) | 0 (0.0%) |
| Retail Trade | 22 (81.5%) | 5 (18.5%) |
| Transportation & Warehousing | 8 (72.7%) | 3 (27.3%) |
| Utilities | 13 (86.7%) | 2 (13.3%) |
| Information | 3 (100.0%) | 0 (0.0%) |
| Finance & Insurance | 0 (0.0%) | 7 (100.0%) |
| Real Estate, Rental & Leasing | 0 (0.0%) | 0 (0.0%) |
| Professional & Scientific | 0 (0.0%) | 3 (100.0%) |
| Enterprise Management | 0 (0.0%) | 0 (0.0%) |
| Administrative & Support | 3 (50.0%) | 3 (50.0%) |
| Educational Services | 5 (13.2%) | 33 (86.8%) |
| Health Care & Social Assistance | 9 (20.4%) | 35 (79.5%) |
| Arts, Entertainment & Recreation | 0 (0.0%) | 0 (0.0%) |
| Accommodation & Food Services | 15 (50.0%) | 15 (50.0%) |
| Public Administration | 20 (71.4%) | 8 (28.6%) |
| Total | 179 (60.3%) | 118 (39.7%) |
Education in Wilson
School Enrollment in Wilson
The most common levels of schooling among the 133 students in Wilson are elementary school (45 | 33.8%), middle school (31 | 23.3%), and college / undergraduate (18 | 13.5%).
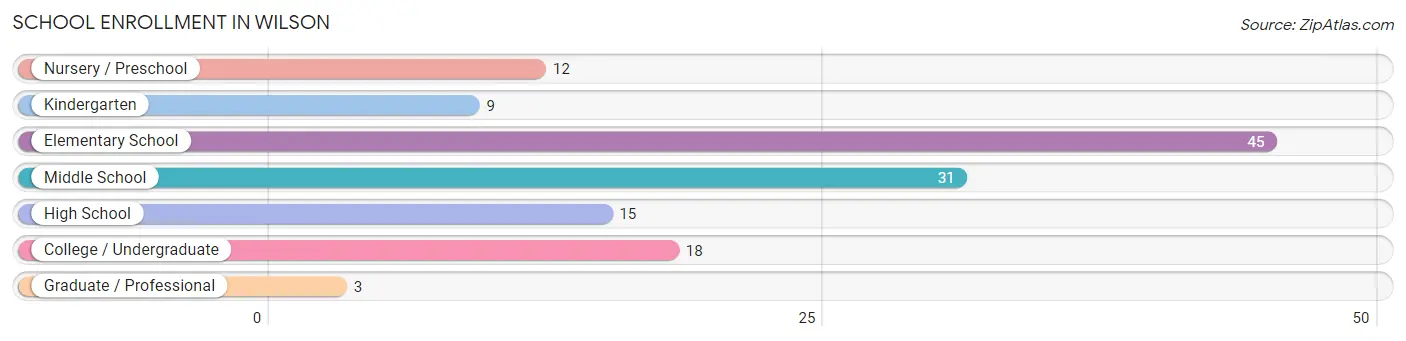
| School Level | # Students | % Students |
| Nursery / Preschool | 12 | 9.0% |
| Kindergarten | 9 | 6.8% |
| Elementary School | 45 | 33.8% |
| Middle School | 31 | 23.3% |
| High School | 15 | 11.3% |
| College / Undergraduate | 18 | 13.5% |
| Graduate / Professional | 3 | 2.3% |
| Total | 133 | 100.0% |
School Enrollment by Age by Funding Source in Wilson
Out of a total of 133 students who are enrolled in schools in Wilson, 3 (2.3%) attend a private institution, while the remaining 130 (97.7%) are enrolled in public schools. The age group of 15 to 17 year olds has the highest likelihood of being enrolled in private schools, with 2 (28.6% in the age bracket) enrolled. Conversely, the age group of 3 to 4 year olds has the lowest likelihood of being enrolled in a private school, with 12 (100.0% in the age bracket) attending a public institution.
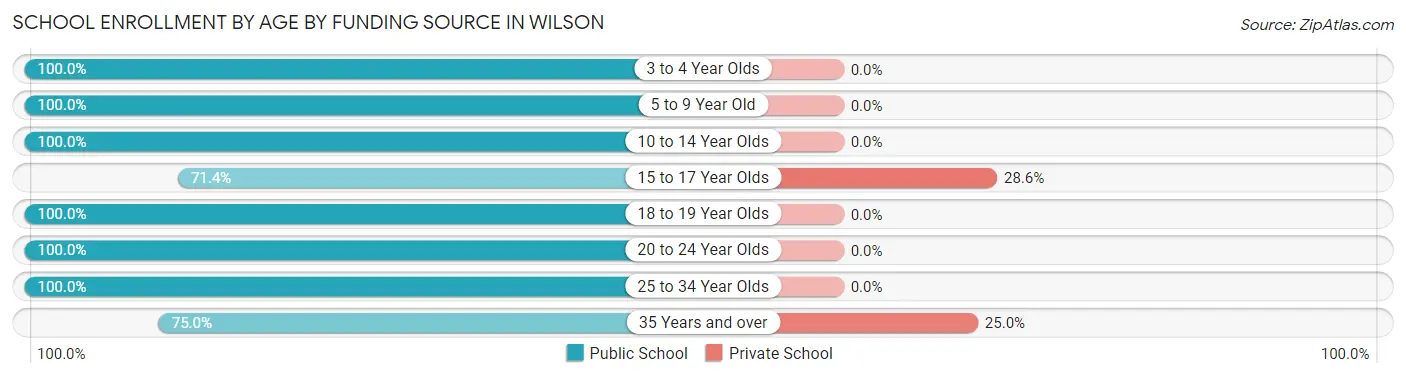
| Age Bracket | Public School | Private School |
| 3 to 4 Year Olds | 12 (100.0%) | 0 (0.0%) |
| 5 to 9 Year Old | 44 (100.0%) | 0 (0.0%) |
| 10 to 14 Year Olds | 45 (100.0%) | 0 (0.0%) |
| 15 to 17 Year Olds | 5 (71.4%) | 2 (28.6%) |
| 18 to 19 Year Olds | 4 (100.0%) | 0 (0.0%) |
| 20 to 24 Year Olds | 9 (100.0%) | 0 (0.0%) |
| 25 to 34 Year Olds | 8 (100.0%) | 0 (0.0%) |
| 35 Years and over | 3 (75.0%) | 1 (25.0%) |
| Total | 130 (97.7%) | 3 (2.3%) |
Educational Attainment by Field of Study in Wilson
Bio, nature & agricultural (25 | 22.1%), science & technology (22 | 19.5%), education (20 | 17.7%), business (11 | 9.7%), and visual & performing arts (9 | 8.0%) are the most common fields of study among 113 individuals in Wilson who have obtained a bachelor's degree or higher.
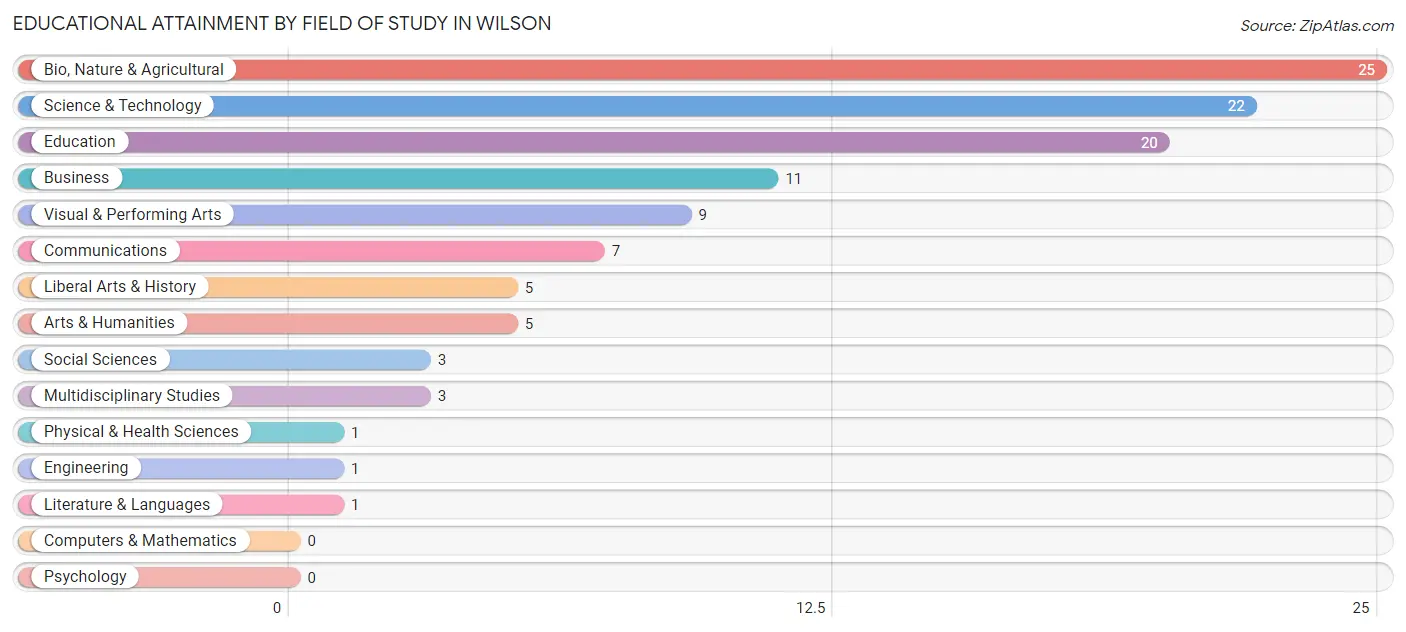
| Field of Study | # Graduates | % Graduates |
| Computers & Mathematics | 0 | 0.0% |
| Bio, Nature & Agricultural | 25 | 22.1% |
| Physical & Health Sciences | 1 | 0.9% |
| Psychology | 0 | 0.0% |
| Social Sciences | 3 | 2.6% |
| Engineering | 1 | 0.9% |
| Multidisciplinary Studies | 3 | 2.6% |
| Science & Technology | 22 | 19.5% |
| Business | 11 | 9.7% |
| Education | 20 | 17.7% |
| Literature & Languages | 1 | 0.9% |
| Liberal Arts & History | 5 | 4.4% |
| Visual & Performing Arts | 9 | 8.0% |
| Communications | 7 | 6.2% |
| Arts & Humanities | 5 | 4.4% |
| Total | 113 | 100.0% |
Transportation & Commute in Wilson
Vehicle Availability by Sex in Wilson
The most prevalent vehicle ownership categories in Wilson are males with 3 vehicles (66, accounting for 36.3%) and females with 3 vehicles (50, making up 55.9%).
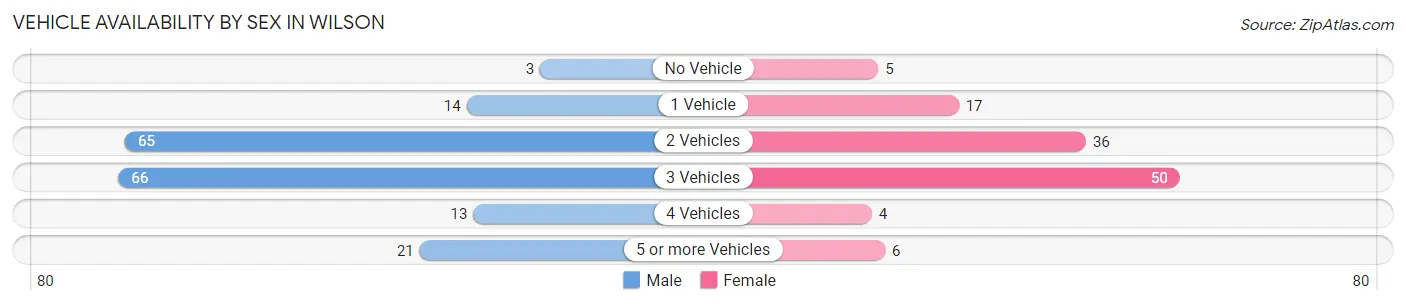
| Vehicles Available | Male | Female |
| No Vehicle | 3 (1.7%) | 5 (4.2%) |
| 1 Vehicle | 14 (7.7%) | 17 (14.4%) |
| 2 Vehicles | 65 (35.7%) | 36 (30.5%) |
| 3 Vehicles | 66 (36.3%) | 50 (42.4%) |
| 4 Vehicles | 13 (7.1%) | 4 (3.4%) |
| 5 or more Vehicles | 21 (11.5%) | 6 (5.1%) |
| Total | 182 (100.0%) | 118 (100.0%) |
Commute Time in Wilson
The most frequently occuring commute durations in Wilson are 5 to 9 minutes (65 commuters, 22.2%), 20 to 24 minutes (45 commuters, 15.4%), and less than 5 minutes (44 commuters, 15.0%).
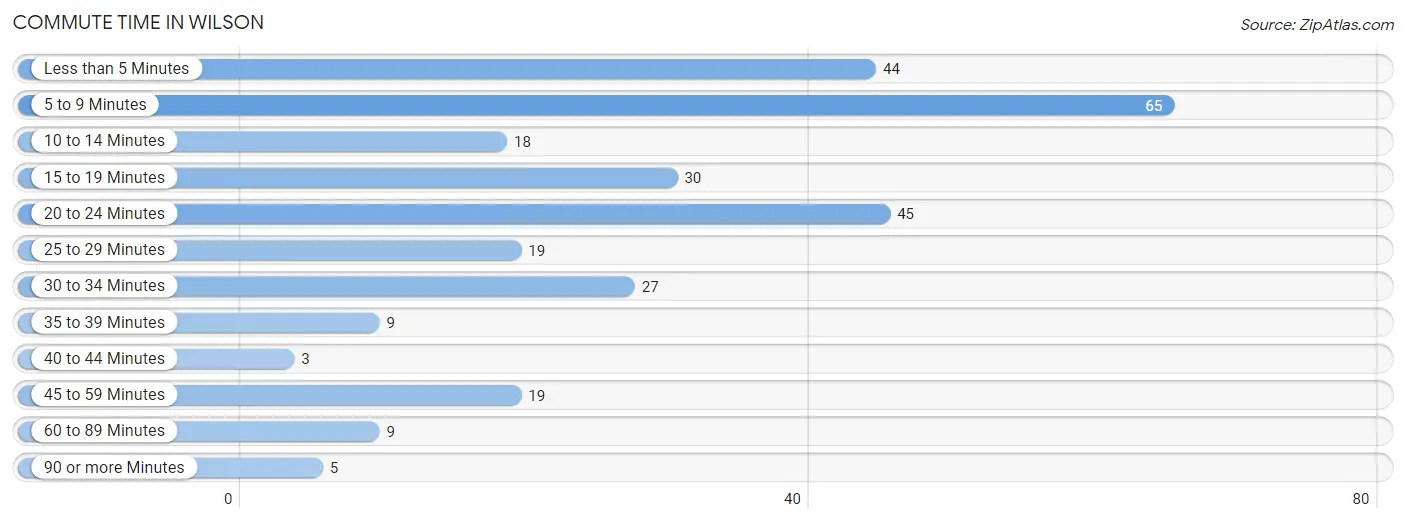
| Commute Time | # Commuters | % Commuters |
| Less than 5 Minutes | 44 | 15.0% |
| 5 to 9 Minutes | 65 | 22.2% |
| 10 to 14 Minutes | 18 | 6.1% |
| 15 to 19 Minutes | 30 | 10.2% |
| 20 to 24 Minutes | 45 | 15.4% |
| 25 to 29 Minutes | 19 | 6.5% |
| 30 to 34 Minutes | 27 | 9.2% |
| 35 to 39 Minutes | 9 | 3.1% |
| 40 to 44 Minutes | 3 | 1.0% |
| 45 to 59 Minutes | 19 | 6.5% |
| 60 to 89 Minutes | 9 | 3.1% |
| 90 or more Minutes | 5 | 1.7% |
Commute Time by Sex in Wilson
The most common commute times in Wilson are 5 to 9 minutes (54 commuters, 30.3%) for males and less than 5 minutes (37 commuters, 32.2%) for females.
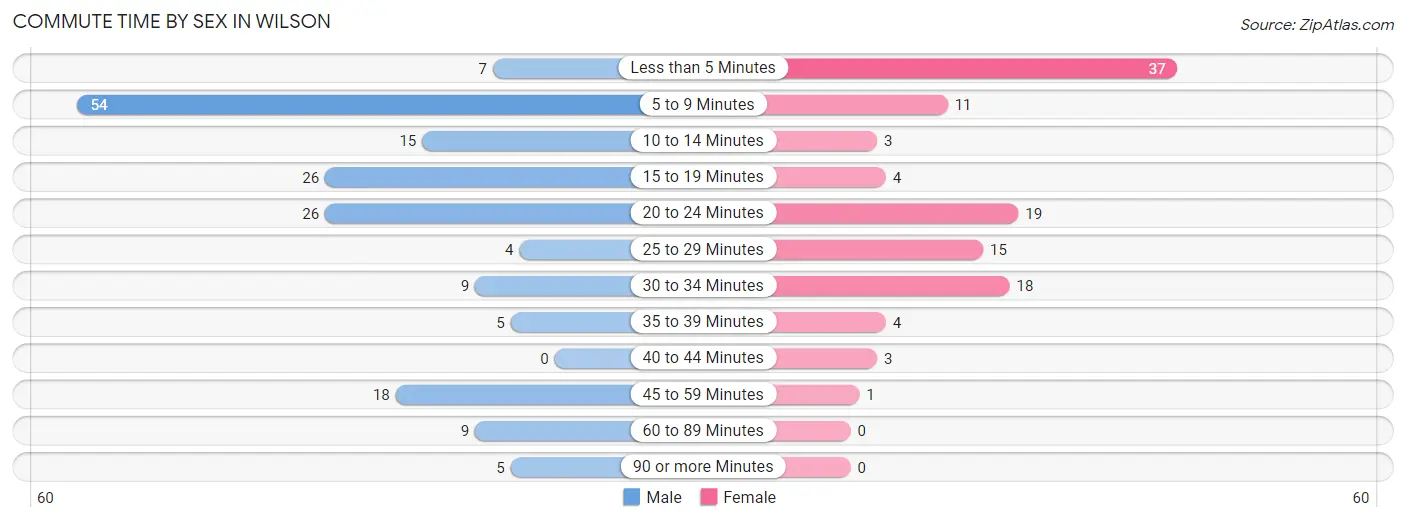
| Commute Time | Male | Female |
| Less than 5 Minutes | 7 (3.9%) | 37 (32.2%) |
| 5 to 9 Minutes | 54 (30.3%) | 11 (9.6%) |
| 10 to 14 Minutes | 15 (8.4%) | 3 (2.6%) |
| 15 to 19 Minutes | 26 (14.6%) | 4 (3.5%) |
| 20 to 24 Minutes | 26 (14.6%) | 19 (16.5%) |
| 25 to 29 Minutes | 4 (2.2%) | 15 (13.0%) |
| 30 to 34 Minutes | 9 (5.1%) | 18 (15.7%) |
| 35 to 39 Minutes | 5 (2.8%) | 4 (3.5%) |
| 40 to 44 Minutes | 0 (0.0%) | 3 (2.6%) |
| 45 to 59 Minutes | 18 (10.1%) | 1 (0.9%) |
| 60 to 89 Minutes | 9 (5.1%) | 0 (0.0%) |
| 90 or more Minutes | 5 (2.8%) | 0 (0.0%) |
Time of Departure to Work by Sex in Wilson
The most frequent times of departure to work in Wilson are 7:00 AM to 7:29 AM (32, 18.0%) for males and 7:30 AM to 7:59 AM (31, 27.0%) for females.
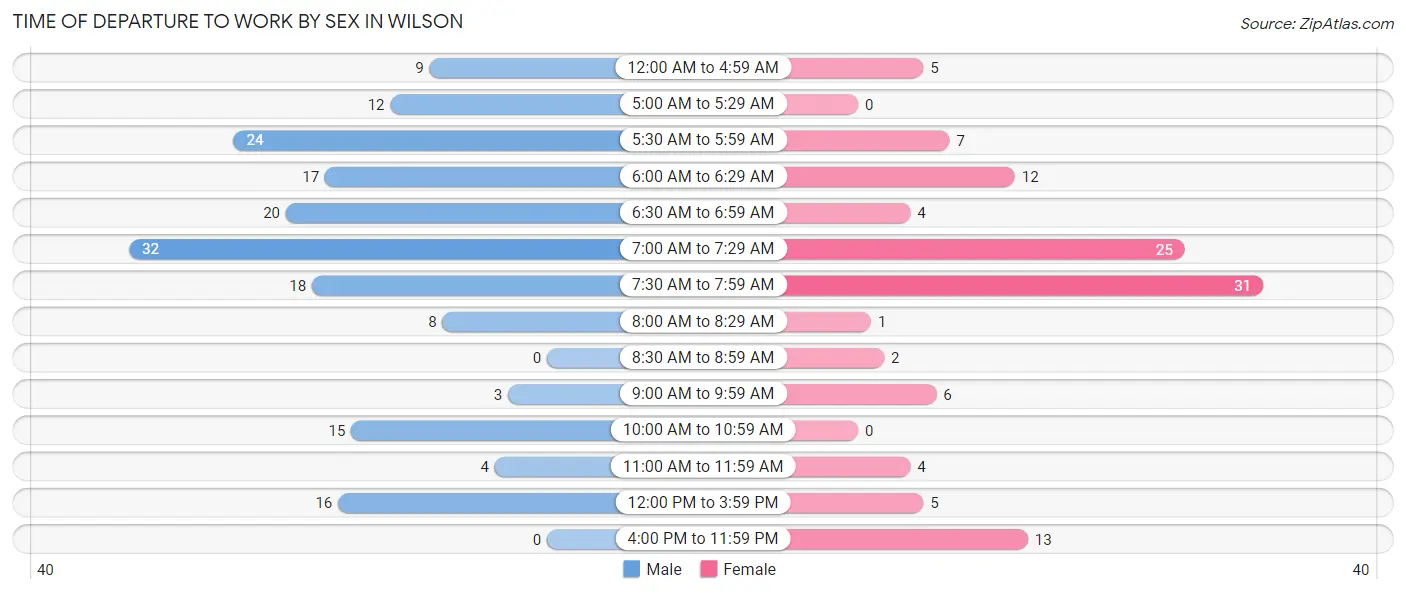
| Time of Departure | Male | Female |
| 12:00 AM to 4:59 AM | 9 (5.1%) | 5 (4.3%) |
| 5:00 AM to 5:29 AM | 12 (6.7%) | 0 (0.0%) |
| 5:30 AM to 5:59 AM | 24 (13.5%) | 7 (6.1%) |
| 6:00 AM to 6:29 AM | 17 (9.6%) | 12 (10.4%) |
| 6:30 AM to 6:59 AM | 20 (11.2%) | 4 (3.5%) |
| 7:00 AM to 7:29 AM | 32 (18.0%) | 25 (21.7%) |
| 7:30 AM to 7:59 AM | 18 (10.1%) | 31 (27.0%) |
| 8:00 AM to 8:29 AM | 8 (4.5%) | 1 (0.9%) |
| 8:30 AM to 8:59 AM | 0 (0.0%) | 2 (1.7%) |
| 9:00 AM to 9:59 AM | 3 (1.7%) | 6 (5.2%) |
| 10:00 AM to 10:59 AM | 15 (8.4%) | 0 (0.0%) |
| 11:00 AM to 11:59 AM | 4 (2.2%) | 4 (3.5%) |
| 12:00 PM to 3:59 PM | 16 (9.0%) | 5 (4.3%) |
| 4:00 PM to 11:59 PM | 0 (0.0%) | 13 (11.3%) |
| Total | 178 (100.0%) | 115 (100.0%) |
Housing Occupancy in Wilson
Occupancy by Ownership in Wilson
Of the total 270 dwellings in Wilson, owner-occupied units account for 219 (81.1%), while renter-occupied units make up 51 (18.9%).
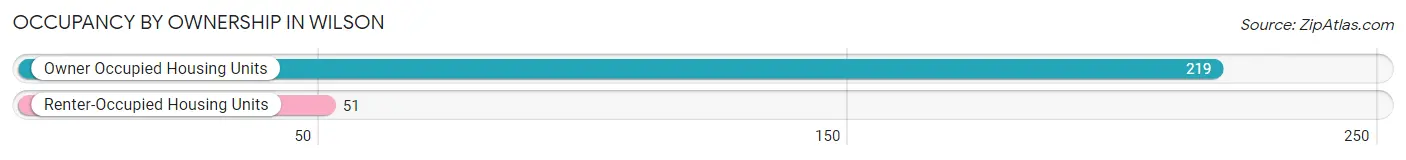
| Occupancy | # Housing Units | % Housing Units |
| Owner Occupied Housing Units | 219 | 81.1% |
| Renter-Occupied Housing Units | 51 | 18.9% |
| Total Occupied Housing Units | 270 | 100.0% |
Occupancy by Household Size in Wilson
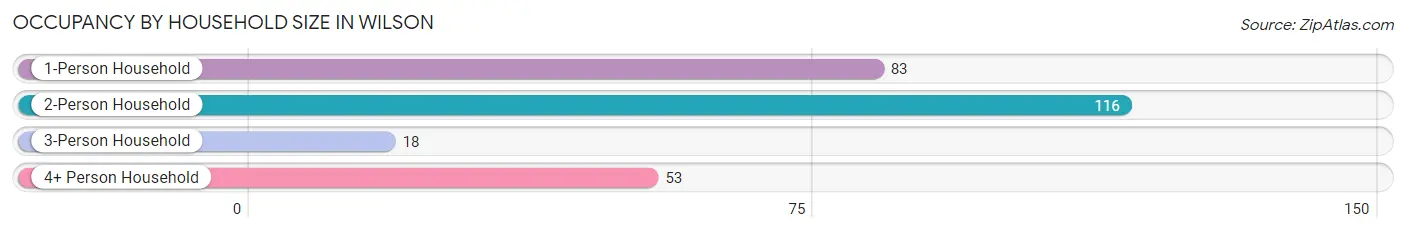
| Household Size | # Housing Units | % Housing Units |
| 1-Person Household | 83 | 30.7% |
| 2-Person Household | 116 | 43.0% |
| 3-Person Household | 18 | 6.7% |
| 4+ Person Household | 53 | 19.6% |
| Total Housing Units | 270 | 100.0% |
Occupancy by Ownership by Household Size in Wilson
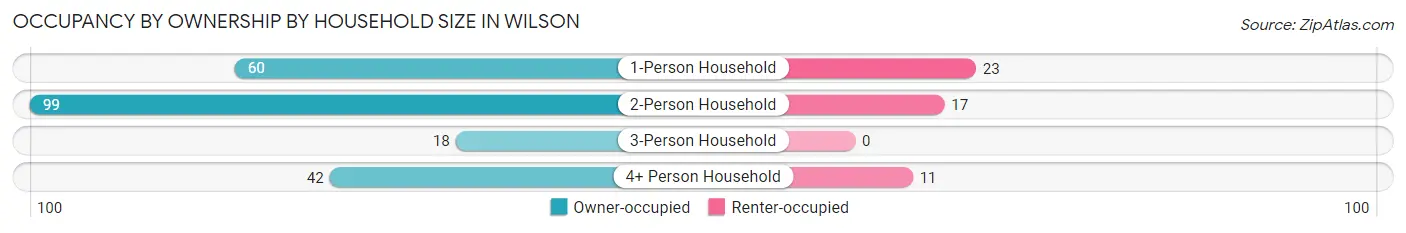
| Household Size | Owner-occupied | Renter-occupied |
| 1-Person Household | 60 (72.3%) | 23 (27.7%) |
| 2-Person Household | 99 (85.3%) | 17 (14.7%) |
| 3-Person Household | 18 (100.0%) | 0 (0.0%) |
| 4+ Person Household | 42 (79.2%) | 11 (20.7%) |
| Total Housing Units | 219 (81.1%) | 51 (18.9%) |
Occupancy by Educational Attainment in Wilson
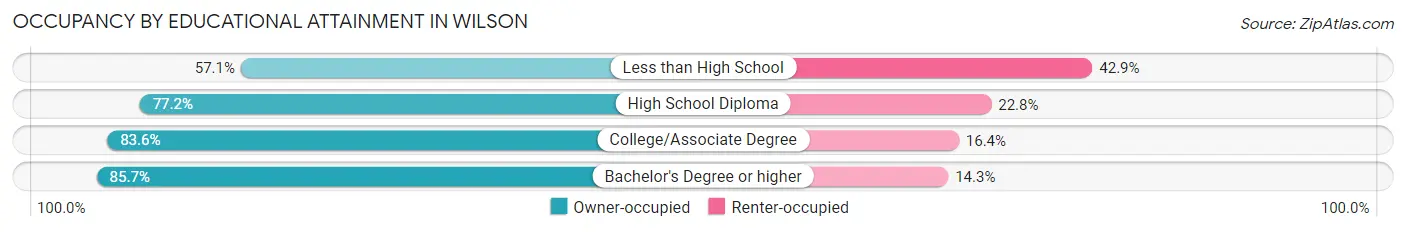
| Household Size | Owner-occupied | Renter-occupied |
| Less than High School | 4 (57.1%) | 3 (42.9%) |
| High School Diploma | 71 (77.2%) | 21 (22.8%) |
| College/Associate Degree | 102 (83.6%) | 20 (16.4%) |
| Bachelor's Degree or higher | 42 (85.7%) | 7 (14.3%) |
Occupancy by Age of Householder in Wilson
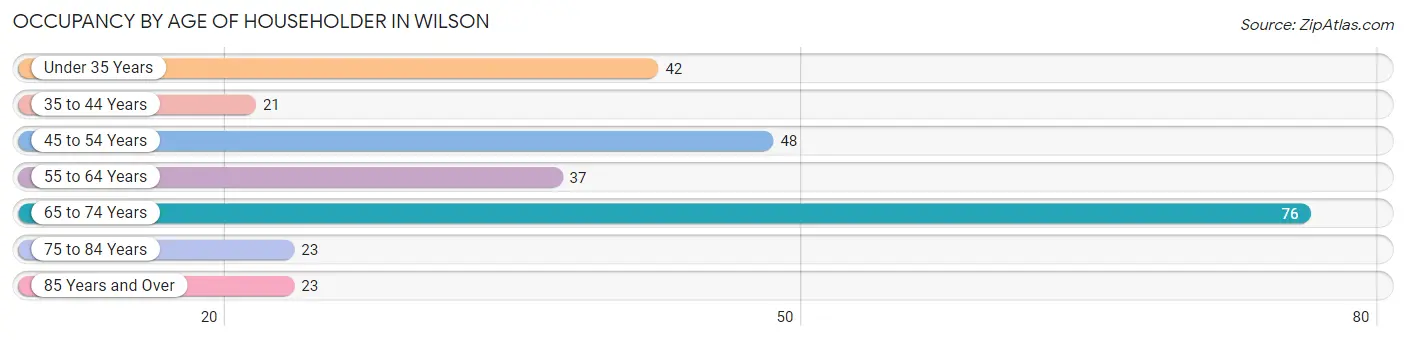
| Age Bracket | # Households | % Households |
| Under 35 Years | 42 | 15.6% |
| 35 to 44 Years | 21 | 7.8% |
| 45 to 54 Years | 48 | 17.8% |
| 55 to 64 Years | 37 | 13.7% |
| 65 to 74 Years | 76 | 28.1% |
| 75 to 84 Years | 23 | 8.5% |
| 85 Years and Over | 23 | 8.5% |
| Total | 270 | 100.0% |
Housing Finances in Wilson
Median Income by Occupancy in Wilson
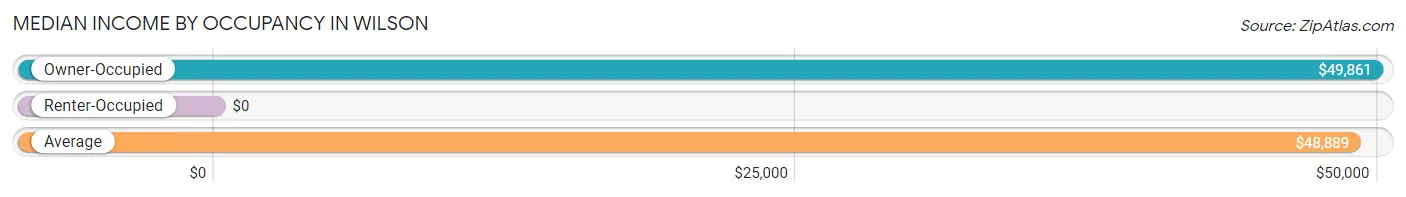
| Occupancy Type | # Households | Median Income |
| Owner-Occupied | 219 (81.1%) | $49,861 |
| Renter-Occupied | 51 (18.9%) | $0 |
| Average | 270 (100.0%) | $48,889 |
Occupancy by Householder Income Bracket in Wilson
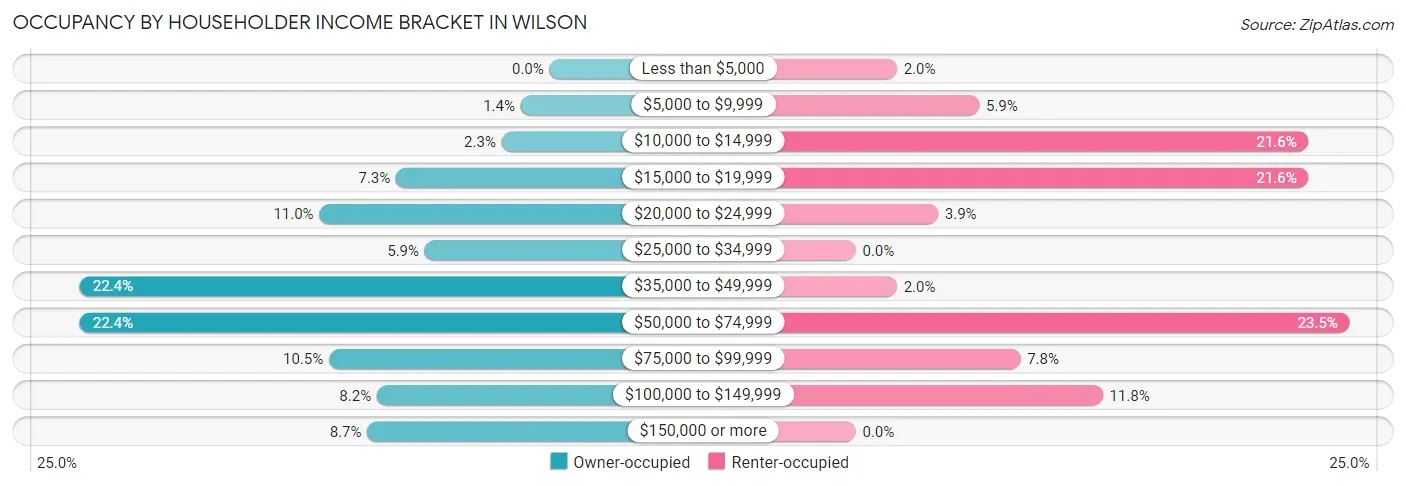
| Income Bracket | Owner-occupied | Renter-occupied |
| Less than $5,000 | 0 (0.0%) | 1 (2.0%) |
| $5,000 to $9,999 | 3 (1.4%) | 3 (5.9%) |
| $10,000 to $14,999 | 5 (2.3%) | 11 (21.6%) |
| $15,000 to $19,999 | 16 (7.3%) | 11 (21.6%) |
| $20,000 to $24,999 | 24 (11.0%) | 2 (3.9%) |
| $25,000 to $34,999 | 13 (5.9%) | 0 (0.0%) |
| $35,000 to $49,999 | 49 (22.4%) | 1 (2.0%) |
| $50,000 to $74,999 | 49 (22.4%) | 12 (23.5%) |
| $75,000 to $99,999 | 23 (10.5%) | 4 (7.8%) |
| $100,000 to $149,999 | 18 (8.2%) | 6 (11.8%) |
| $150,000 or more | 19 (8.7%) | 0 (0.0%) |
| Total | 219 (100.0%) | 51 (100.0%) |
Monthly Housing Cost Tiers in Wilson
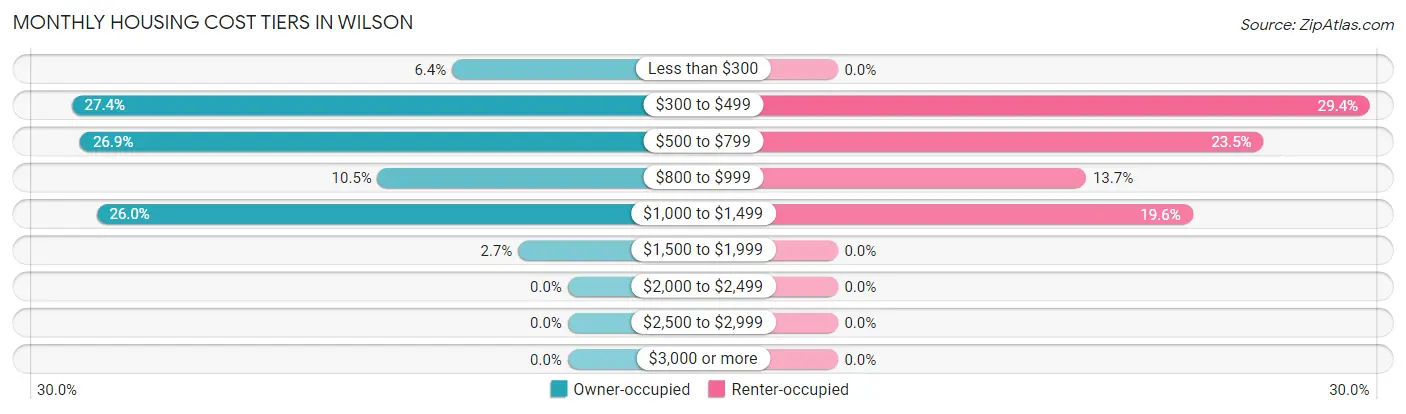
| Monthly Cost | Owner-occupied | Renter-occupied |
| Less than $300 | 14 (6.4%) | 0 (0.0%) |
| $300 to $499 | 60 (27.4%) | 15 (29.4%) |
| $500 to $799 | 59 (26.9%) | 12 (23.5%) |
| $800 to $999 | 23 (10.5%) | 7 (13.7%) |
| $1,000 to $1,499 | 57 (26.0%) | 10 (19.6%) |
| $1,500 to $1,999 | 6 (2.7%) | 0 (0.0%) |
| $2,000 to $2,499 | 0 (0.0%) | 0 (0.0%) |
| $2,500 to $2,999 | 0 (0.0%) | 0 (0.0%) |
| $3,000 or more | 0 (0.0%) | 0 (0.0%) |
| Total | 219 (100.0%) | 51 (100.0%) |
Physical Housing Characteristics in Wilson
Housing Structures in Wilson
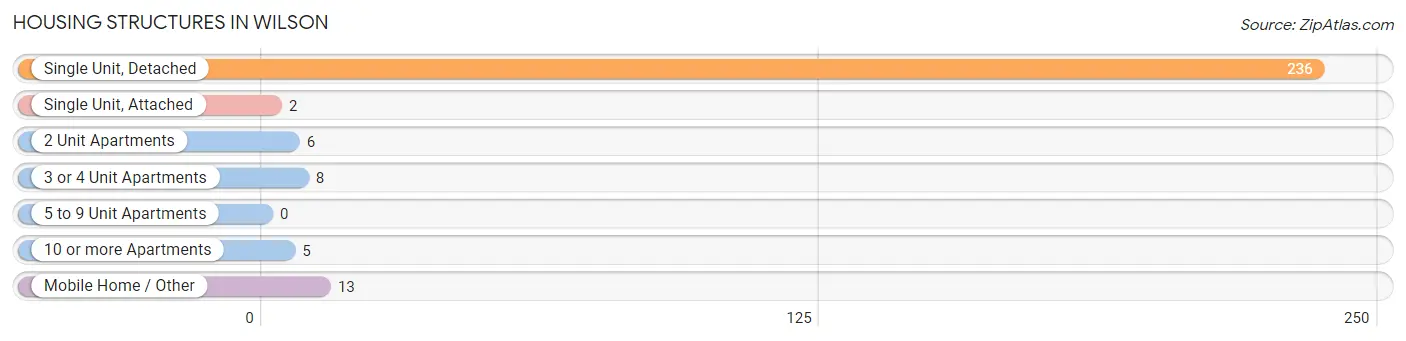
| Structure Type | # Housing Units | % Housing Units |
| Single Unit, Detached | 236 | 87.4% |
| Single Unit, Attached | 2 | 0.7% |
| 2 Unit Apartments | 6 | 2.2% |
| 3 or 4 Unit Apartments | 8 | 3.0% |
| 5 to 9 Unit Apartments | 0 | 0.0% |
| 10 or more Apartments | 5 | 1.8% |
| Mobile Home / Other | 13 | 4.8% |
| Total | 270 | 100.0% |
Housing Structures by Occupancy in Wilson
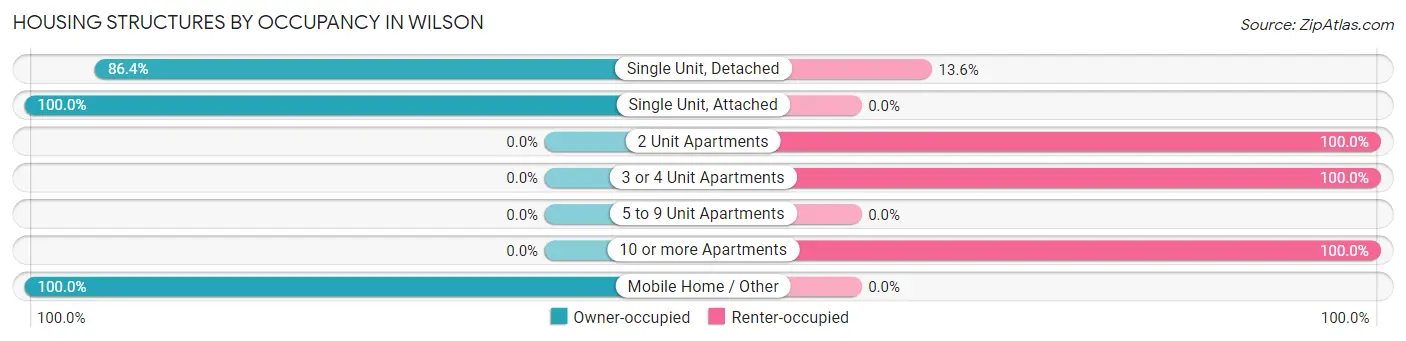
| Structure Type | Owner-occupied | Renter-occupied |
| Single Unit, Detached | 204 (86.4%) | 32 (13.6%) |
| Single Unit, Attached | 2 (100.0%) | 0 (0.0%) |
| 2 Unit Apartments | 0 (0.0%) | 6 (100.0%) |
| 3 or 4 Unit Apartments | 0 (0.0%) | 8 (100.0%) |
| 5 to 9 Unit Apartments | 0 (0.0%) | 0 (0.0%) |
| 10 or more Apartments | 0 (0.0%) | 5 (100.0%) |
| Mobile Home / Other | 13 (100.0%) | 0 (0.0%) |
| Total | 219 (81.1%) | 51 (18.9%) |
Housing Structures by Number of Rooms in Wilson
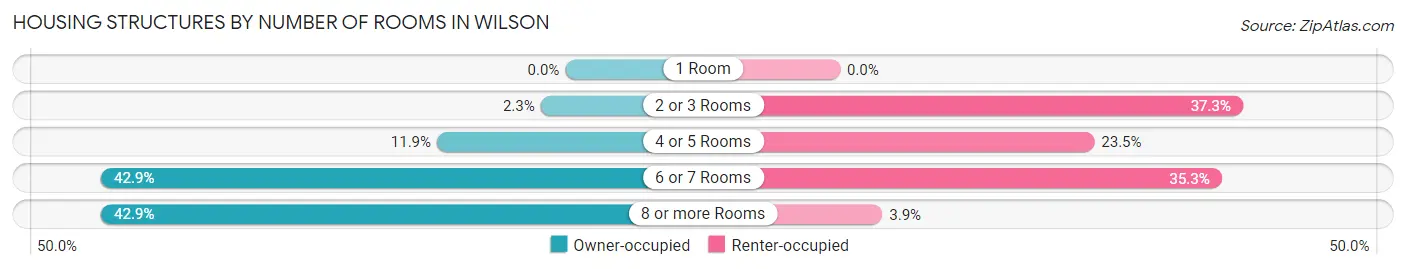
| Number of Rooms | Owner-occupied | Renter-occupied |
| 1 Room | 0 (0.0%) | 0 (0.0%) |
| 2 or 3 Rooms | 5 (2.3%) | 19 (37.2%) |
| 4 or 5 Rooms | 26 (11.9%) | 12 (23.5%) |
| 6 or 7 Rooms | 94 (42.9%) | 18 (35.3%) |
| 8 or more Rooms | 94 (42.9%) | 2 (3.9%) |
| Total | 219 (100.0%) | 51 (100.0%) |
Housing Structure by Heating Type in Wilson
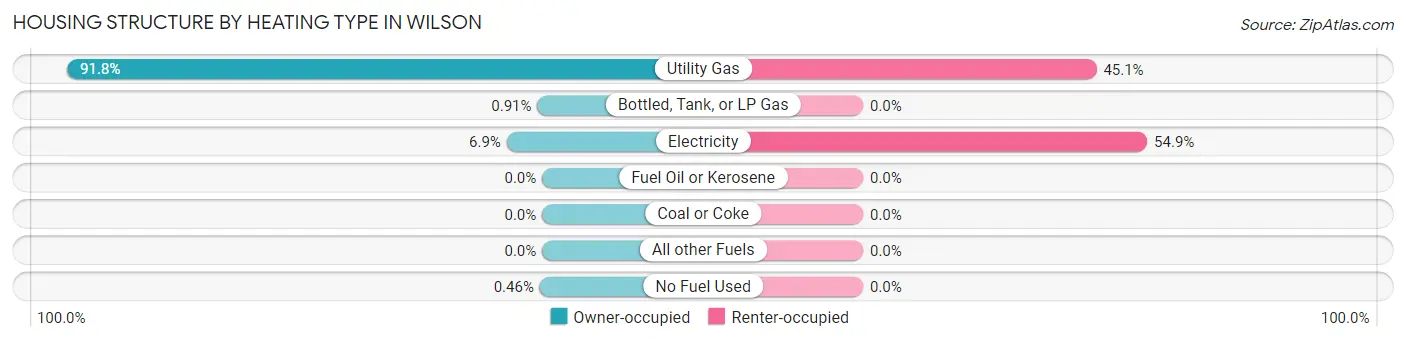
| Heating Type | Owner-occupied | Renter-occupied |
| Utility Gas | 201 (91.8%) | 23 (45.1%) |
| Bottled, Tank, or LP Gas | 2 (0.9%) | 0 (0.0%) |
| Electricity | 15 (6.9%) | 28 (54.9%) |
| Fuel Oil or Kerosene | 0 (0.0%) | 0 (0.0%) |
| Coal or Coke | 0 (0.0%) | 0 (0.0%) |
| All other Fuels | 0 (0.0%) | 0 (0.0%) |
| No Fuel Used | 1 (0.5%) | 0 (0.0%) |
| Total | 219 (100.0%) | 51 (100.0%) |
Household Vehicle Usage in Wilson
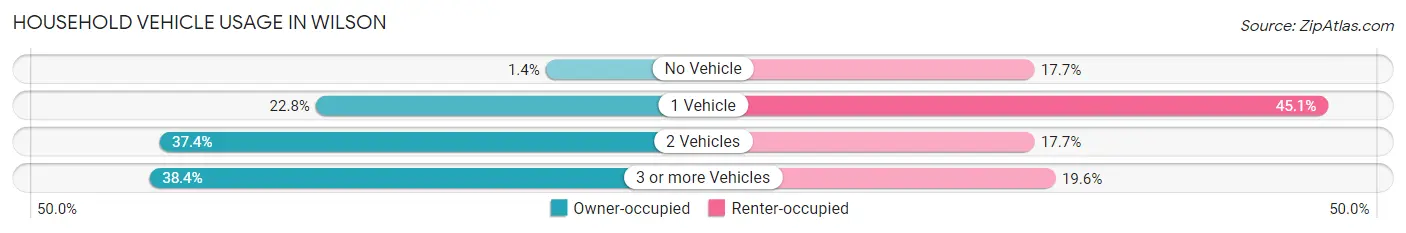
| Vehicles per Household | Owner-occupied | Renter-occupied |
| No Vehicle | 3 (1.4%) | 9 (17.6%) |
| 1 Vehicle | 50 (22.8%) | 23 (45.1%) |
| 2 Vehicles | 82 (37.4%) | 9 (17.6%) |
| 3 or more Vehicles | 84 (38.4%) | 10 (19.6%) |
| Total | 219 (100.0%) | 51 (100.0%) |
Real Estate & Mortgages in Wilson
Real Estate and Mortgage Overview in Wilson
| Characteristic | Without Mortgage | With Mortgage |
| Housing Units | 115 | 104 |
| Median Property Value | $68,400 | $80,000 |
| Median Household Income | $40,139 | $8 |
| Monthly Housing Costs | $433 | $0 |
| Real Estate Taxes | $1,139 | $0 |
Property Value by Mortgage Status in Wilson
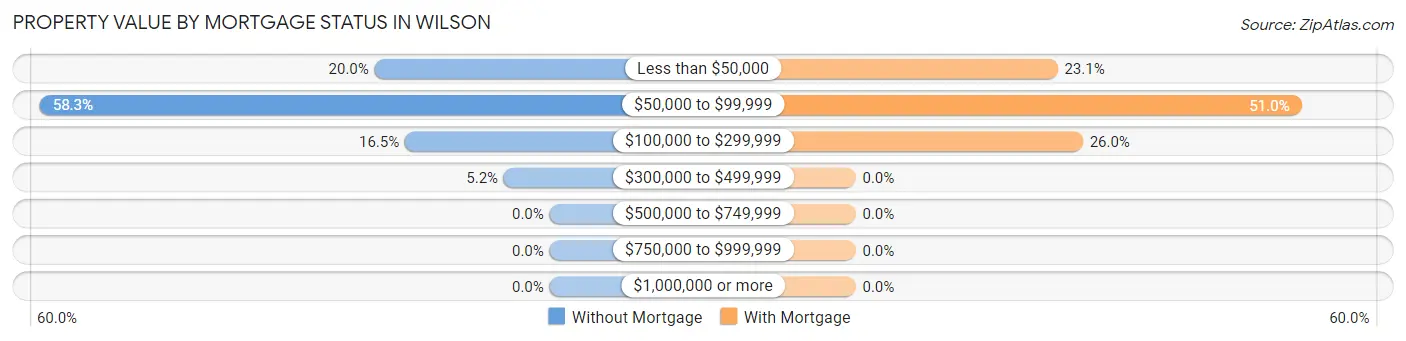
| Property Value | Without Mortgage | With Mortgage |
| Less than $50,000 | 23 (20.0%) | 24 (23.1%) |
| $50,000 to $99,999 | 67 (58.3%) | 53 (51.0%) |
| $100,000 to $299,999 | 19 (16.5%) | 27 (26.0%) |
| $300,000 to $499,999 | 6 (5.2%) | 0 (0.0%) |
| $500,000 to $749,999 | 0 (0.0%) | 0 (0.0%) |
| $750,000 to $999,999 | 0 (0.0%) | 0 (0.0%) |
| $1,000,000 or more | 0 (0.0%) | 0 (0.0%) |
| Total | 115 (100.0%) | 104 (100.0%) |
Household Income by Mortgage Status in Wilson
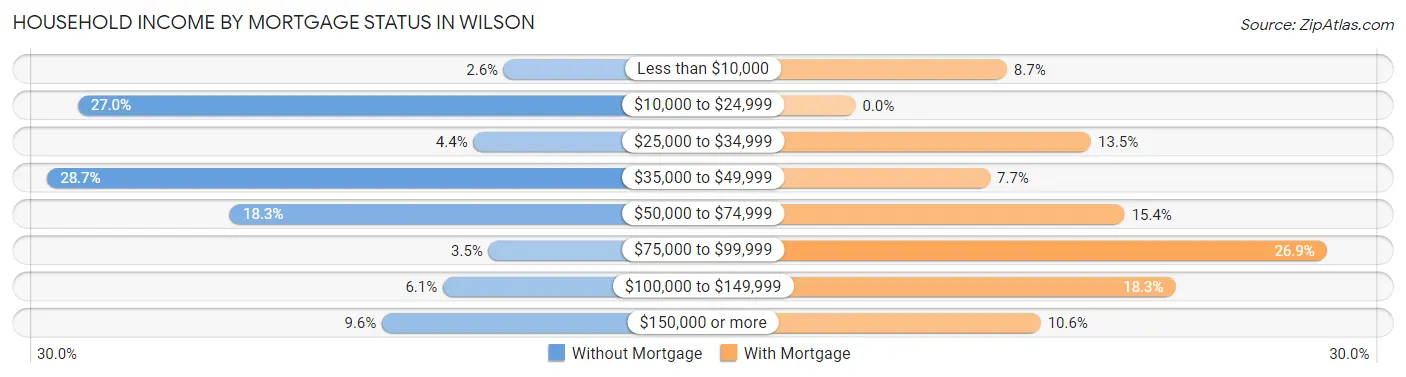
| Household Income | Without Mortgage | With Mortgage |
| Less than $10,000 | 3 (2.6%) | 9 (8.6%) |
| $10,000 to $24,999 | 31 (27.0%) | 0 (0.0%) |
| $25,000 to $34,999 | 5 (4.3%) | 14 (13.5%) |
| $35,000 to $49,999 | 33 (28.7%) | 8 (7.7%) |
| $50,000 to $74,999 | 21 (18.3%) | 16 (15.4%) |
| $75,000 to $99,999 | 4 (3.5%) | 28 (26.9%) |
| $100,000 to $149,999 | 7 (6.1%) | 19 (18.3%) |
| $150,000 or more | 11 (9.6%) | 11 (10.6%) |
| Total | 115 (100.0%) | 104 (100.0%) |
Property Value to Household Income Ratio in Wilson
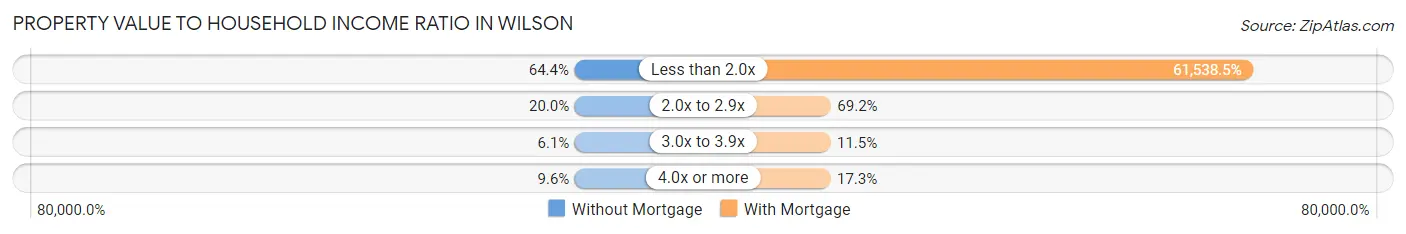
| Value-to-Income Ratio | Without Mortgage | With Mortgage |
| Less than 2.0x | 74 (64.3%) | 64,000 (61,538.5%) |
| 2.0x to 2.9x | 23 (20.0%) | 72 (69.2%) |
| 3.0x to 3.9x | 7 (6.1%) | 12 (11.5%) |
| 4.0x or more | 11 (9.6%) | 18 (17.3%) |
| Total | 115 (100.0%) | 104 (100.0%) |
Real Estate Taxes by Mortgage Status in Wilson
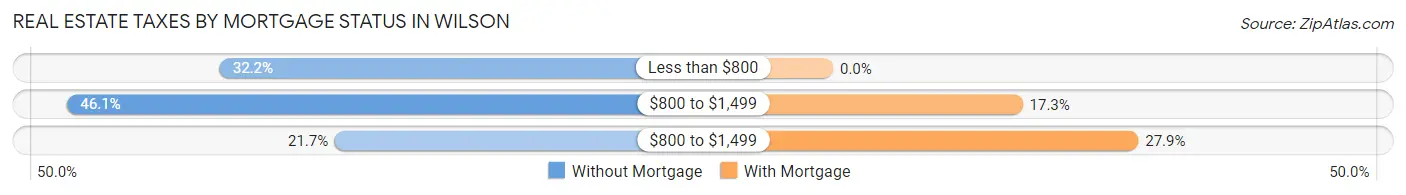
| Property Taxes | Without Mortgage | With Mortgage |
| Less than $800 | 37 (32.2%) | 0 (0.0%) |
| $800 to $1,499 | 53 (46.1%) | 18 (17.3%) |
| $800 to $1,499 | 25 (21.7%) | 29 (27.9%) |
| Total | 115 (100.0%) | 104 (100.0%) |
Health & Disability in Wilson
Health Insurance Coverage by Age in Wilson
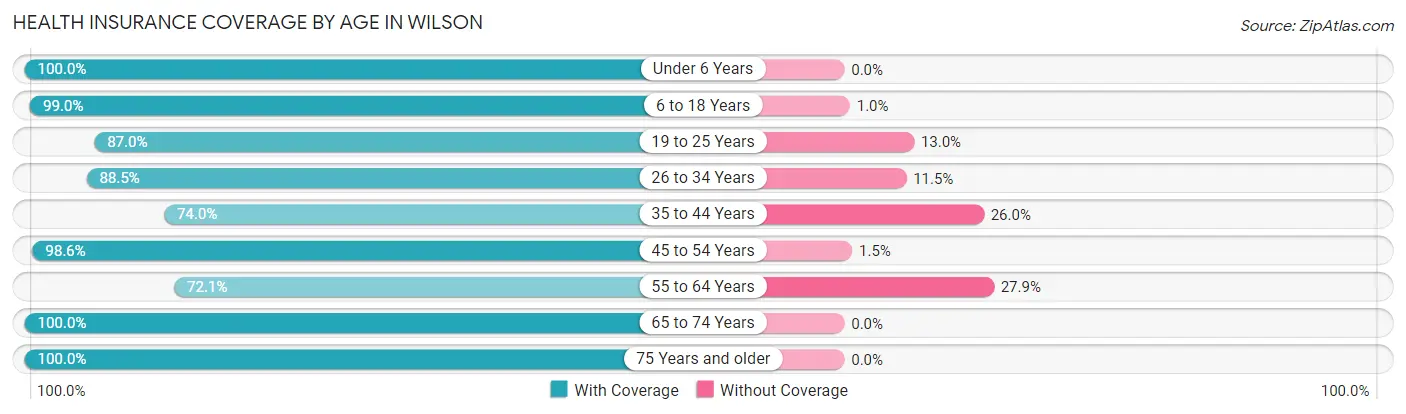
| Age Bracket | With Coverage | Without Coverage |
| Under 6 Years | 48 (100.0%) | 0 (0.0%) |
| 6 to 18 Years | 97 (99.0%) | 1 (1.0%) |
| 19 to 25 Years | 67 (87.0%) | 10 (13.0%) |
| 26 to 34 Years | 69 (88.5%) | 9 (11.5%) |
| 35 to 44 Years | 37 (74.0%) | 13 (26.0%) |
| 45 to 54 Years | 68 (98.6%) | 1 (1.5%) |
| 55 to 64 Years | 44 (72.1%) | 17 (27.9%) |
| 65 to 74 Years | 120 (100.0%) | 0 (0.0%) |
| 75 Years and older | 105 (100.0%) | 0 (0.0%) |
| Total | 655 (92.8%) | 51 (7.2%) |
Health Insurance Coverage by Citizenship Status in Wilson
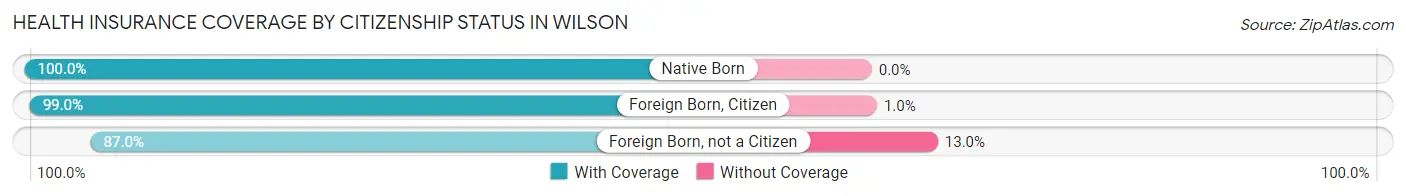
| Citizenship Status | With Coverage | Without Coverage |
| Native Born | 48 (100.0%) | 0 (0.0%) |
| Foreign Born, Citizen | 97 (99.0%) | 1 (1.0%) |
| Foreign Born, not a Citizen | 67 (87.0%) | 10 (13.0%) |
Health Insurance Coverage by Household Income in Wilson
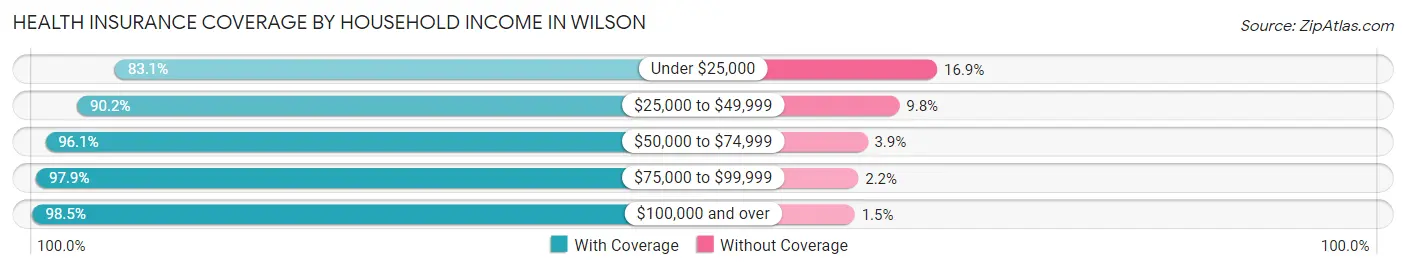
| Household Income | With Coverage | Without Coverage |
| Under $25,000 | 108 (83.1%) | 22 (16.9%) |
| $25,000 to $49,999 | 174 (90.2%) | 19 (9.8%) |
| $50,000 to $74,999 | 149 (96.1%) | 6 (3.9%) |
| $75,000 to $99,999 | 91 (97.9%) | 2 (2.1%) |
| $100,000 and over | 133 (98.5%) | 2 (1.5%) |
Public vs Private Health Insurance Coverage by Age in Wilson
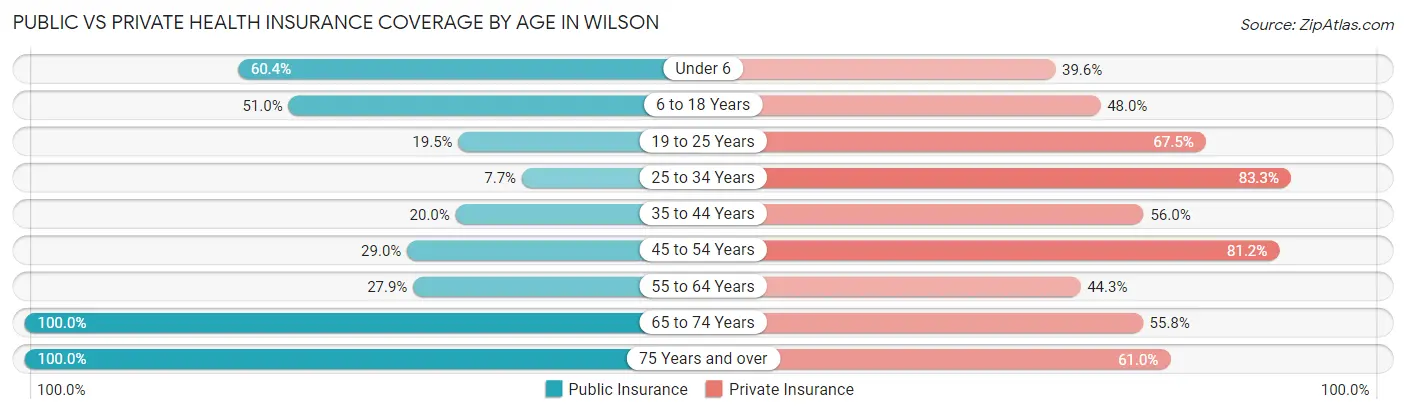
| Age Bracket | Public Insurance | Private Insurance |
| Under 6 | 29 (60.4%) | 19 (39.6%) |
| 6 to 18 Years | 50 (51.0%) | 47 (48.0%) |
| 19 to 25 Years | 15 (19.5%) | 52 (67.5%) |
| 25 to 34 Years | 6 (7.7%) | 65 (83.3%) |
| 35 to 44 Years | 10 (20.0%) | 28 (56.0%) |
| 45 to 54 Years | 20 (29.0%) | 56 (81.2%) |
| 55 to 64 Years | 17 (27.9%) | 27 (44.3%) |
| 65 to 74 Years | 120 (100.0%) | 67 (55.8%) |
| 75 Years and over | 105 (100.0%) | 64 (61.0%) |
| Total | 372 (52.7%) | 425 (60.2%) |
Disability Status by Sex by Age in Wilson
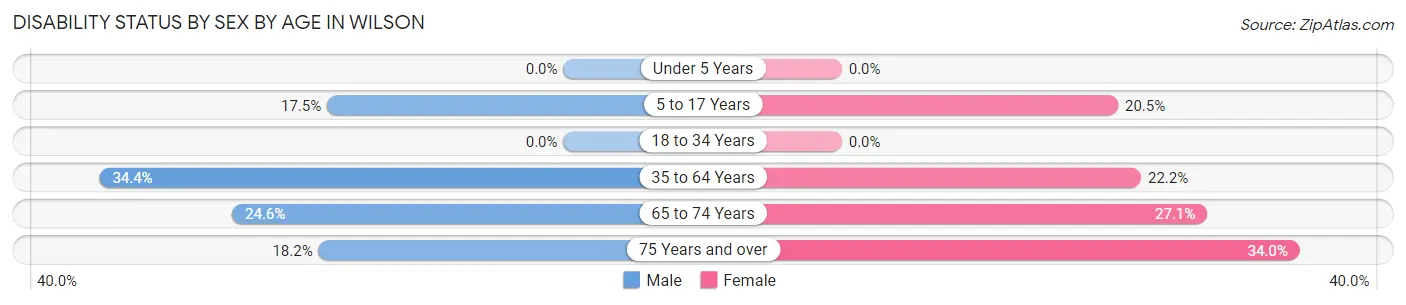
| Age Bracket | Male | Female |
| Under 5 Years | 0 (0.0%) | 0 (0.0%) |
| 5 to 17 Years | 10 (17.5%) | 8 (20.5%) |
| 18 to 34 Years | 0 (0.0%) | 0 (0.0%) |
| 35 to 64 Years | 31 (34.4%) | 20 (22.2%) |
| 65 to 74 Years | 15 (24.6%) | 16 (27.1%) |
| 75 Years and over | 10 (18.2%) | 17 (34.0%) |
Disability Class by Sex by Age in Wilson
Disability Class: Hearing Difficulty
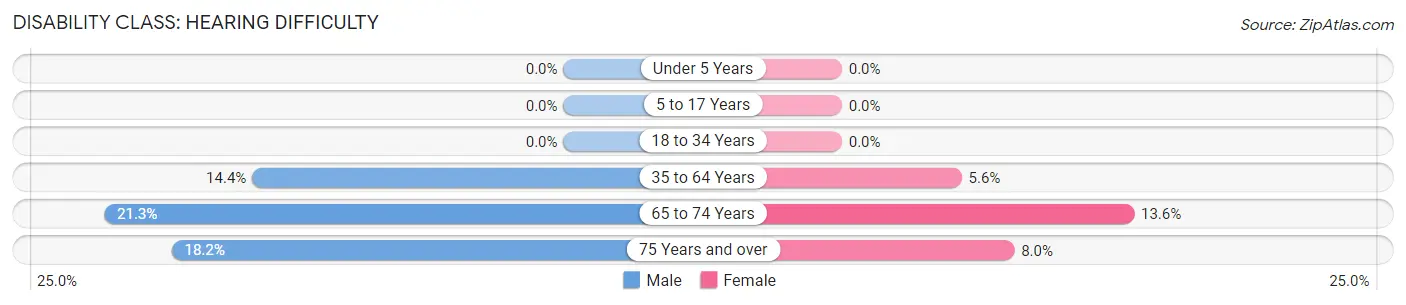
| Age Bracket | Male | Female |
| Under 5 Years | 0 (0.0%) | 0 (0.0%) |
| 5 to 17 Years | 0 (0.0%) | 0 (0.0%) |
| 18 to 34 Years | 0 (0.0%) | 0 (0.0%) |
| 35 to 64 Years | 13 (14.4%) | 5 (5.6%) |
| 65 to 74 Years | 13 (21.3%) | 8 (13.6%) |
| 75 Years and over | 10 (18.2%) | 4 (8.0%) |
Disability Class: Vision Difficulty
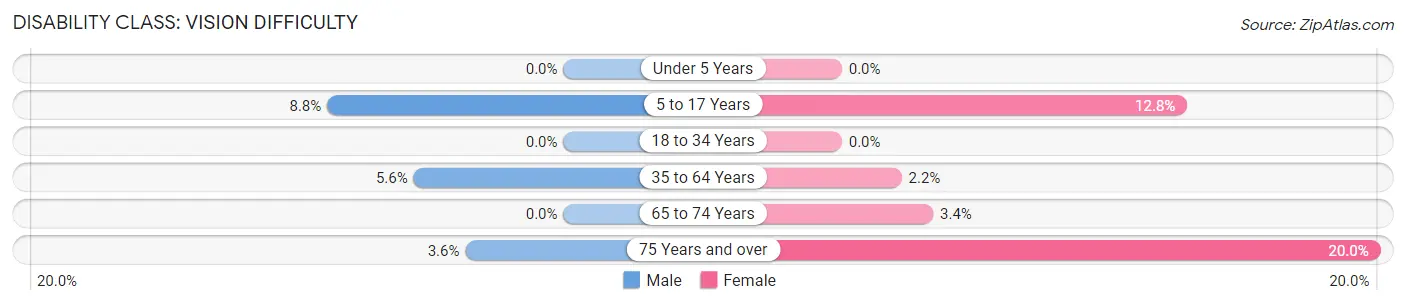
| Age Bracket | Male | Female |
| Under 5 Years | 0 (0.0%) | 0 (0.0%) |
| 5 to 17 Years | 5 (8.8%) | 5 (12.8%) |
| 18 to 34 Years | 0 (0.0%) | 0 (0.0%) |
| 35 to 64 Years | 5 (5.6%) | 2 (2.2%) |
| 65 to 74 Years | 0 (0.0%) | 2 (3.4%) |
| 75 Years and over | 2 (3.6%) | 10 (20.0%) |
Disability Class: Cognitive Difficulty
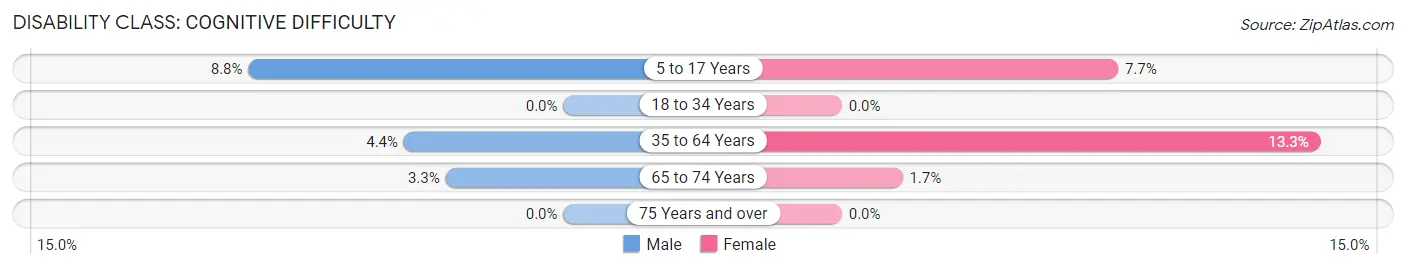
| Age Bracket | Male | Female |
| 5 to 17 Years | 5 (8.8%) | 3 (7.7%) |
| 18 to 34 Years | 0 (0.0%) | 0 (0.0%) |
| 35 to 64 Years | 4 (4.4%) | 12 (13.3%) |
| 65 to 74 Years | 2 (3.3%) | 1 (1.7%) |
| 75 Years and over | 0 (0.0%) | 0 (0.0%) |
Disability Class: Ambulatory Difficulty
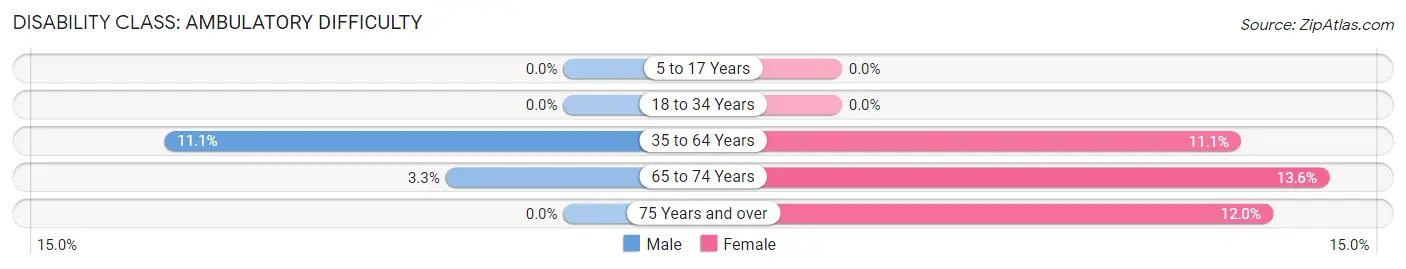
| Age Bracket | Male | Female |
| 5 to 17 Years | 0 (0.0%) | 0 (0.0%) |
| 18 to 34 Years | 0 (0.0%) | 0 (0.0%) |
| 35 to 64 Years | 10 (11.1%) | 10 (11.1%) |
| 65 to 74 Years | 2 (3.3%) | 8 (13.6%) |
| 75 Years and over | 0 (0.0%) | 6 (12.0%) |
Disability Class: Self-Care Difficulty
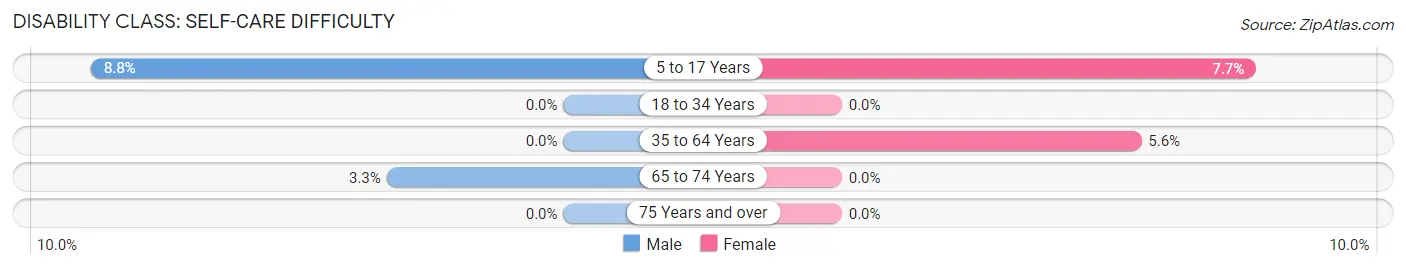
| Age Bracket | Male | Female |
| 5 to 17 Years | 5 (8.8%) | 3 (7.7%) |
| 18 to 34 Years | 0 (0.0%) | 0 (0.0%) |
| 35 to 64 Years | 0 (0.0%) | 5 (5.6%) |
| 65 to 74 Years | 2 (3.3%) | 0 (0.0%) |
| 75 Years and over | 0 (0.0%) | 0 (0.0%) |
Technology Access in Wilson
Computing Device Access in Wilson
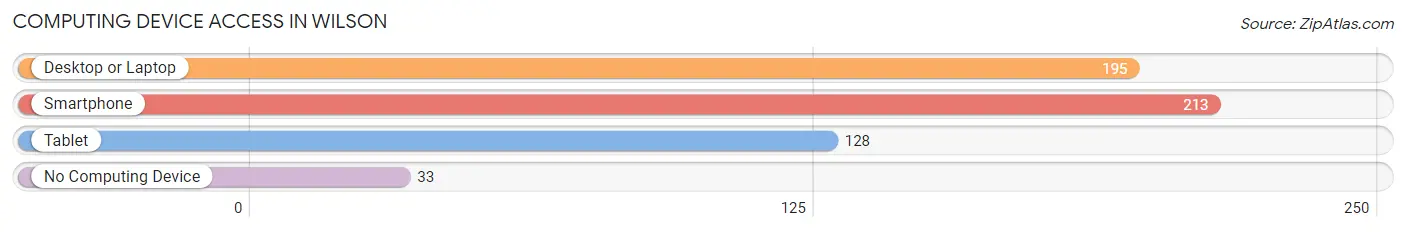
| Device Type | # Households | % Households |
| Desktop or Laptop | 195 | 72.2% |
| Smartphone | 213 | 78.9% |
| Tablet | 128 | 47.4% |
| No Computing Device | 33 | 12.2% |
| Total | 270 | 100.0% |
Internet Access in Wilson
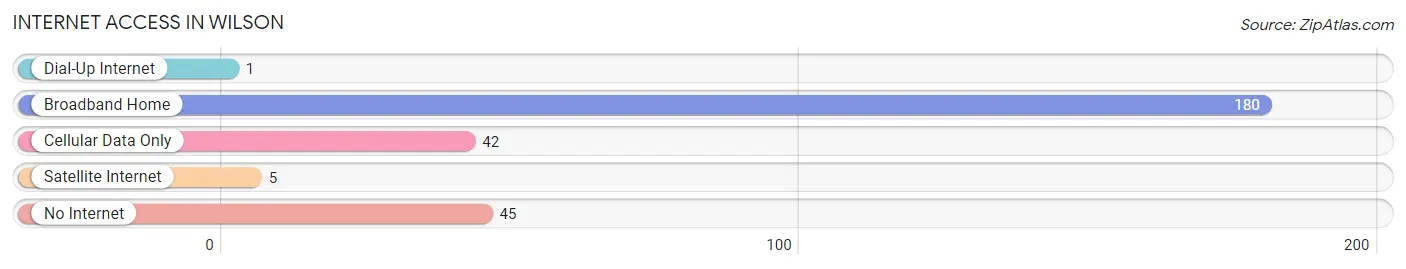
| Internet Type | # Households | % Households |
| Dial-Up Internet | 1 | 0.4% |
| Broadband Home | 180 | 66.7% |
| Cellular Data Only | 42 | 15.6% |
| Satellite Internet | 5 | 1.8% |
| No Internet | 45 | 16.7% |
| Total | 270 | 100.0% |
Wilson Summary
Wilson, Kansas is a small town located in the central part of the state, in Ellsworth County. It is situated on the banks of the Smoky Hill River, and is surrounded by rolling hills and farmland. The town was founded in 1872, and has a population of approximately 1,000 people.
History
Wilson was founded in 1872 by a group of settlers from Ohio. The town was named after the first settler, William Wilson. The town was originally a farming community, and the settlers grew wheat, corn, and other crops. The town was also home to a number of businesses, including a general store, a blacksmith shop, and a hotel.
In the late 1800s, Wilson began to grow and prosper. The town was home to a number of churches, schools, and businesses. The town also had a newspaper, the Wilson Herald, which was published from 1883 to 1895.
In the early 1900s, Wilson experienced a period of growth and prosperity. The town was home to a number of businesses, including a bank, a lumberyard, a hardware store, and a movie theater. The town also had a number of churches, including the Methodist, Presbyterian, and Baptist churches.
In the mid-1900s, Wilson began to decline. The town's population began to decline, and many of the businesses closed. The town was also hit hard by the Great Depression, and many of the businesses that had been in the town for years closed their doors.
Geography
Wilson is located in the central part of Kansas, in Ellsworth County. The town is situated on the banks of the Smoky Hill River, and is surrounded by rolling hills and farmland. The town is located approximately 30 miles south of Salina, and is about an hour and a half drive from Wichita.
The climate in Wilson is generally mild, with hot summers and cold winters. The average temperature in the summer is around 80 degrees Fahrenheit, and the average temperature in the winter is around 30 degrees Fahrenheit.
Economy
The economy of Wilson is largely based on agriculture. The town is home to a number of farms, and the surrounding area is used for growing wheat, corn, and other crops. The town is also home to a number of businesses, including a bank, a lumberyard, a hardware store, and a movie theater.
Demographics
As of the 2010 census, the population of Wilson was 1,000 people. The town is predominantly white, with a small Hispanic population. The median household income in the town is $37,000, and the median home value is $90,000. The town has a low unemployment rate, and the majority of the population is employed in the agricultural sector.
Common Questions
What is Per Capita Income in Wilson?
Per Capita income in Wilson is $25,440.
What is the Median Family Income in Wilson?
Median Family Income in Wilson is $52,500.
What is the Median Household income in Wilson?
Median Household Income in Wilson is $48,889.
What is Income or Wage Gap in Wilson?
Income or Wage Gap in Wilson is 33.3%.
Women in Wilson earn 66.7 cents for every dollar earned by a man.
What is Inequality or Gini Index in Wilson?
Inequality or Gini Index in Wilson is 0.42.
What is the Total Population of Wilson?
Total Population of Wilson is 777.
What is the Total Male Population of Wilson?
Total Male Population of Wilson is 420.
What is the Total Female Population of Wilson?
Total Female Population of Wilson is 357.
What is the Ratio of Males per 100 Females in Wilson?
There are 117.65 Males per 100 Females in Wilson.
What is the Ratio of Females per 100 Males in Wilson?
There are 85.00 Females per 100 Males in Wilson.
What is the Median Population Age in Wilson?
Median Population Age in Wilson is 51.4 Years.
What is the Average Family Size in Wilson
Average Family Size in Wilson is 3.4 People.
What is the Average Household Size in Wilson
Average Household Size in Wilson is 2.6 People.
How Large is the Labor Force in Wilson?
There are 306 People in the Labor Forcein in Wilson.
What is the Percentage of People in the Labor Force in Wilson?
47.8% of People are in the Labor Force in Wilson.
What is the Unemployment Rate in Wilson?
Unemployment Rate in Wilson is 2.0%.