Weskan, KS Map & Demographics
Weskan Map
Weskan Overview
$25,445
PER CAPITA INCOME
$62,500
AVG FAMILY INCOME
3.8%
WAGE / INCOME GAP [ % ]
96.2¢/ $1
WAGE / INCOME GAP [ $ ]
0.34
INEQUALITY / GINI INDEX
123
TOTAL POPULATION
67
MALE POPULATION
56
FEMALE POPULATION
119.64
MALES / 100 FEMALES
83.58
FEMALES / 100 MALES
30.5
MEDIAN AGE
2.8
AVG FAMILY SIZE
2.3
AVG HOUSEHOLD SIZE
78
LABOR FORCE [ PEOPLE ]
83.9%
PERCENT IN LABOR FORCE
Weskan Zip Codes
Weskan Area Codes
Income in Weskan
Income Overview in Weskan
| Characteristic | Number | Measure |
| Per Capita Income | 123 | $25,445 |
| Median Family Income | 34 | $62,500 |
| Mean Family Income | 34 | $59,982 |
| Median Household Income | 54 | $0 |
| Mean Household Income | 54 | $54,089 |
| Income Deficit | 34 | $0 |
| Wage / Income Gap (%) | 123 | 3.77% |
| Wage / Income Gap ($) | 123 | 96.23¢ per $1 |
| Gini / Inequality Index | 123 | 0.34 |
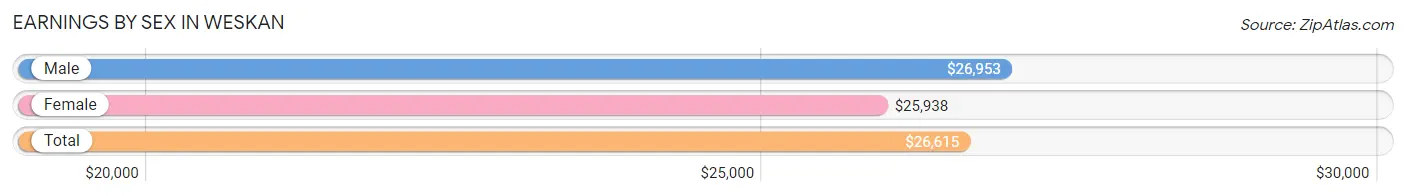
Earnings by Sex in Weskan
Average Earnings in Weskan are $26,615, $26,953 for men and $25,938 for women, a difference of 3.8%.
| Sex | Number | Average Earnings |
| Male | 51 (63.0%) | $26,953 |
| Female | 30 (37.0%) | $25,938 |
| Total | 81 (100.0%) | $26,615 |
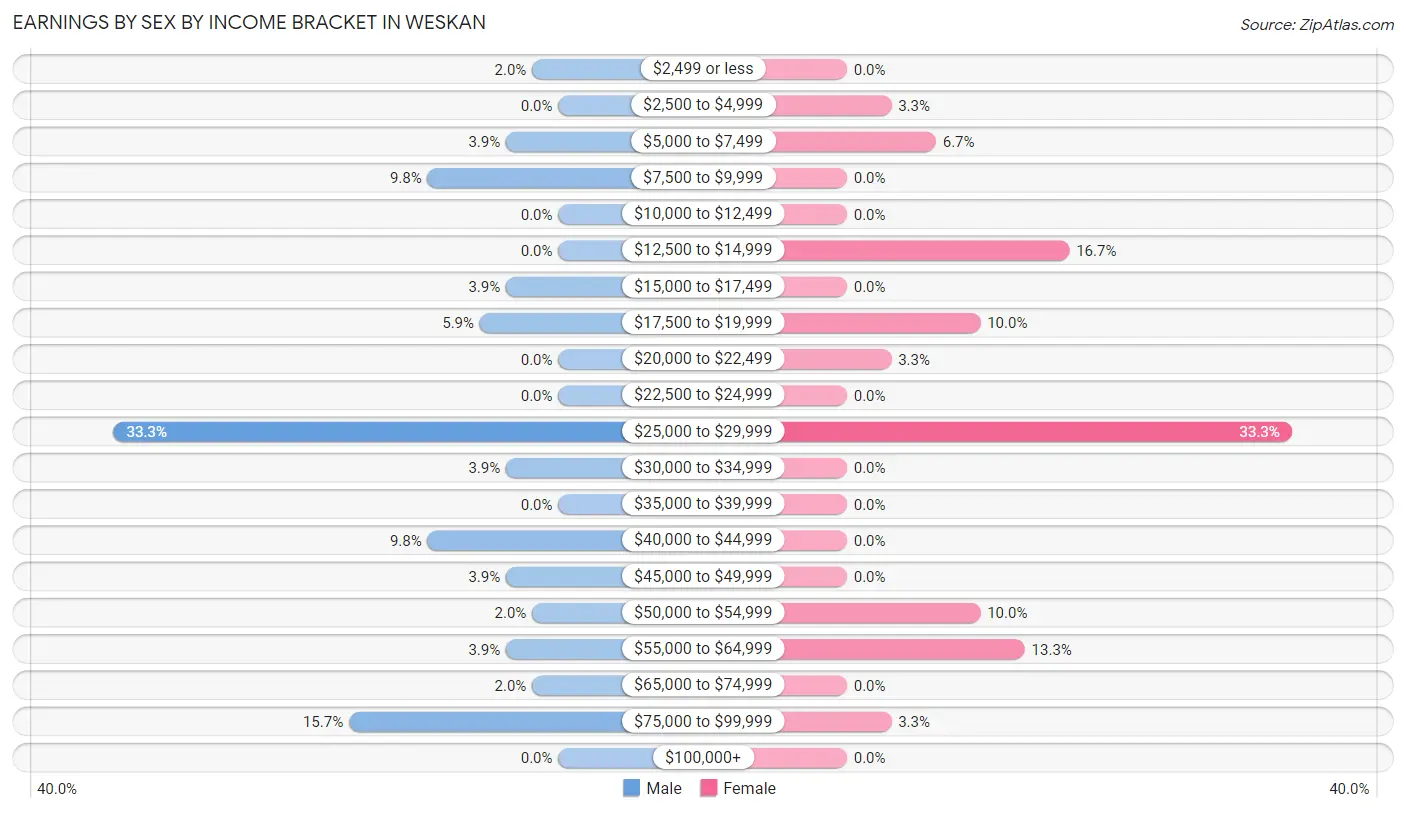
Earnings by Sex by Income Bracket in Weskan
The most common earnings brackets in Weskan are $25,000 to $29,999 for men (17 | 33.3%) and $25,000 to $29,999 for women (10 | 33.3%).
| Income | Male | Female |
| $2,499 or less | 1 (2.0%) | 0 (0.0%) |
| $2,500 to $4,999 | 0 (0.0%) | 1 (3.3%) |
| $5,000 to $7,499 | 2 (3.9%) | 2 (6.7%) |
| $7,500 to $9,999 | 5 (9.8%) | 0 (0.0%) |
| $10,000 to $12,499 | 0 (0.0%) | 0 (0.0%) |
| $12,500 to $14,999 | 0 (0.0%) | 5 (16.7%) |
| $15,000 to $17,499 | 2 (3.9%) | 0 (0.0%) |
| $17,500 to $19,999 | 3 (5.9%) | 3 (10.0%) |
| $20,000 to $22,499 | 0 (0.0%) | 1 (3.3%) |
| $22,500 to $24,999 | 0 (0.0%) | 0 (0.0%) |
| $25,000 to $29,999 | 17 (33.3%) | 10 (33.3%) |
| $30,000 to $34,999 | 2 (3.9%) | 0 (0.0%) |
| $35,000 to $39,999 | 0 (0.0%) | 0 (0.0%) |
| $40,000 to $44,999 | 5 (9.8%) | 0 (0.0%) |
| $45,000 to $49,999 | 2 (3.9%) | 0 (0.0%) |
| $50,000 to $54,999 | 1 (2.0%) | 3 (10.0%) |
| $55,000 to $64,999 | 2 (3.9%) | 4 (13.3%) |
| $65,000 to $74,999 | 1 (2.0%) | 0 (0.0%) |
| $75,000 to $99,999 | 8 (15.7%) | 1 (3.3%) |
| $100,000+ | 0 (0.0%) | 0 (0.0%) |
| Total | 51 (100.0%) | 30 (100.0%) |
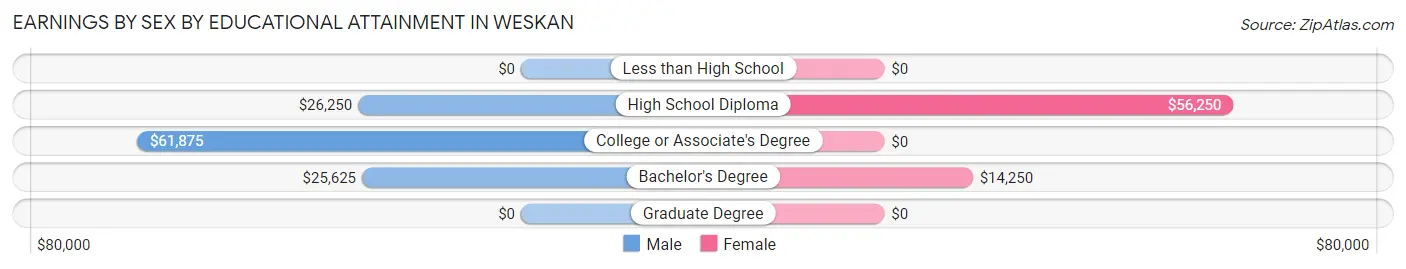
Earnings by Sex by Educational Attainment in Weskan
Average earnings in Weskan are $26,563 for men and $18,750 for women, a difference of 29.4%. Men with an educational attainment of college or associate's degree enjoy the highest average annual earnings of $61,875, while those with bachelor's degree education earn the least with $25,625. Women with an educational attainment of high school diploma earn the most with the average annual earnings of $56,250, while those with bachelor's degree education have the smallest earnings of $14,250.
| Educational Attainment | Male Income | Female Income |
| Less than High School | - | - |
| High School Diploma | $26,250 | $56,250 |
| College or Associate's Degree | $61,875 | $0 |
| Bachelor's Degree | $25,625 | $14,250 |
| Graduate Degree | - | - |
| Total | $26,563 | $18,750 |
Family Income in Weskan
Family Income Brackets in Weskan
According to the Weskan family income data, there are 8 families falling into the $25,000 to $34,999 income range, which is the most common income bracket and makes up 23.5% of all families.
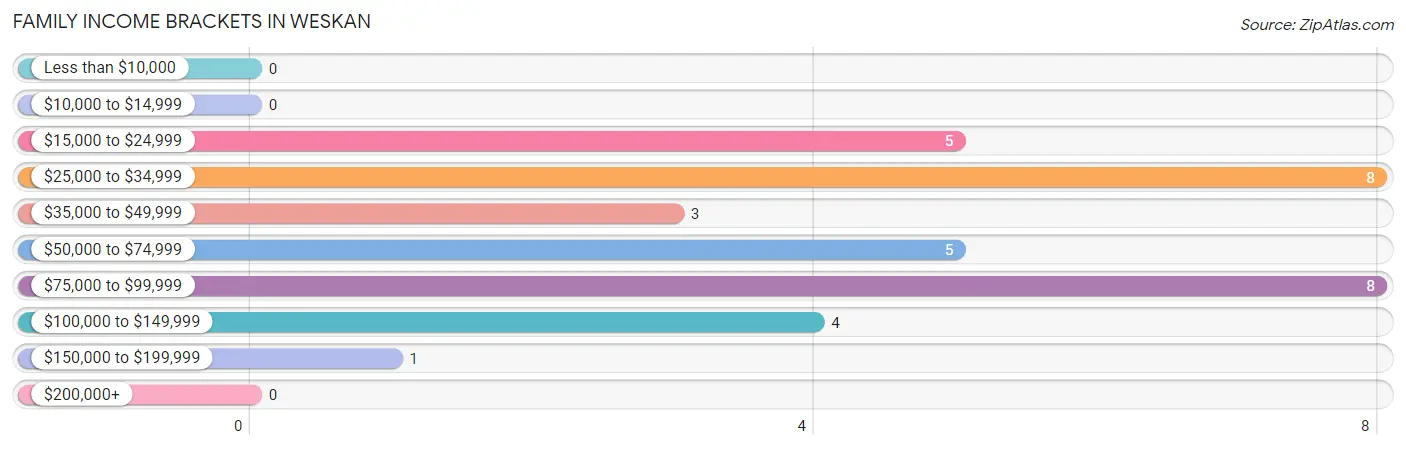
| Income Bracket | # Families | % Families |
| Less than $10,000 | 0 | 0.0% |
| $10,000 to $14,999 | 0 | 0.0% |
| $15,000 to $24,999 | 5 | 14.7% |
| $25,000 to $34,999 | 8 | 23.5% |
| $35,000 to $49,999 | 3 | 8.8% |
| $50,000 to $74,999 | 5 | 14.7% |
| $75,000 to $99,999 | 8 | 23.5% |
| $100,000 to $149,999 | 4 | 11.8% |
| $150,000 to $199,999 | 1 | 2.9% |
| $200,000+ | 0 | 0.0% |
Family Income by Famaliy Size in Weskan
3-person families (8 | 23.5%) account for the highest median family income in Weskan with $66,250 per family, while 3-person families (8 | 23.5%) have the highest median income of $22,083 per family member.
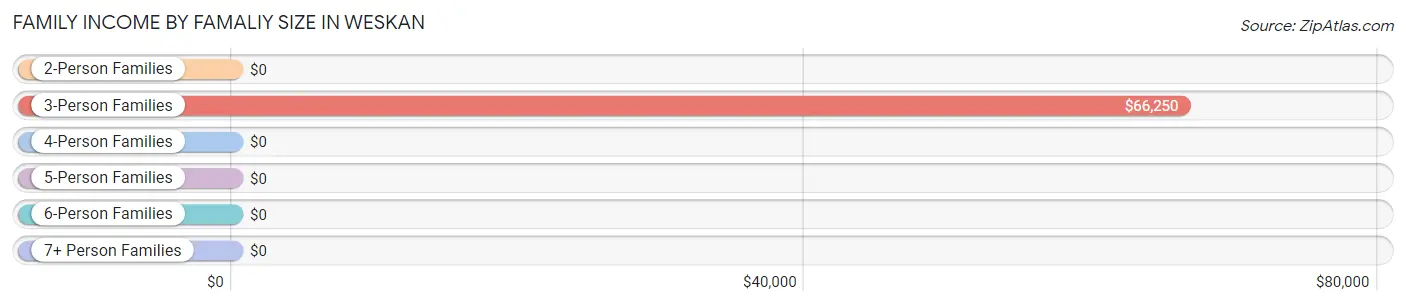
| Income Bracket | # Families | Median Income |
| 2-Person Families | 22 (64.7%) | $0 |
| 3-Person Families | 8 (23.5%) | $66,250 |
| 4-Person Families | 1 (2.9%) | $0 |
| 5-Person Families | 3 (8.8%) | $0 |
| 6-Person Families | 0 (0.0%) | $0 |
| 7+ Person Families | 0 (0.0%) | $0 |
| Total | 34 (100.0%) | $62,500 |
Family Income by Number of Earners in Weskan
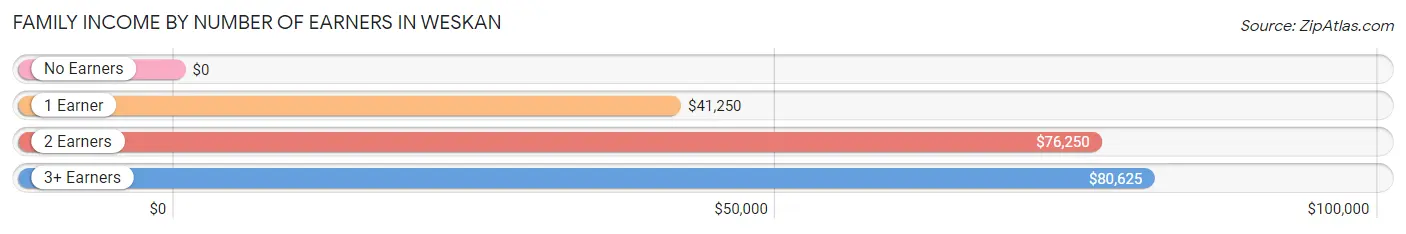
| Number of Earners | # Families | Median Income |
| No Earners | 2 (5.9%) | $0 |
| 1 Earner | 14 (41.2%) | $41,250 |
| 2 Earners | 13 (38.2%) | $76,250 |
| 3+ Earners | 5 (14.7%) | $80,625 |
| Total | 34 (100.0%) | $62,500 |
Household Income in Weskan
Household Income Brackets in Weskan
With 22 households falling in the category, the $25,000 to $34,999 income range is the most frequent in Weskan, accounting for 40.7% of all households.
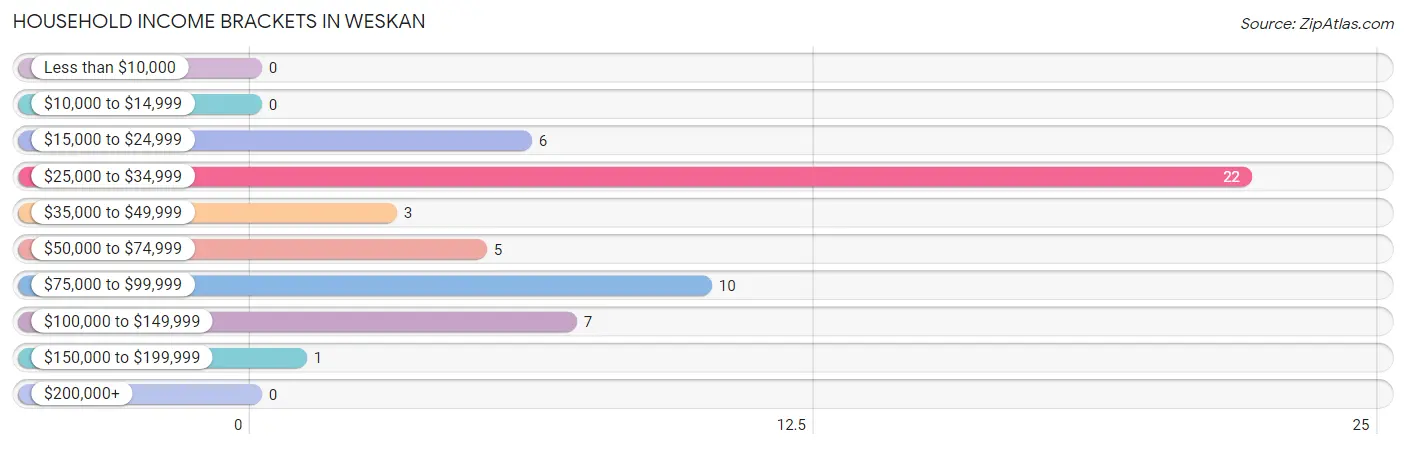
| Income Bracket | # Households | % Households |
| Less than $10,000 | 0 | 0.0% |
| $10,000 to $14,999 | 0 | 0.0% |
| $15,000 to $24,999 | 6 | 11.1% |
| $25,000 to $34,999 | 22 | 40.7% |
| $35,000 to $49,999 | 3 | 5.6% |
| $50,000 to $74,999 | 5 | 9.3% |
| $75,000 to $99,999 | 10 | 18.5% |
| $100,000 to $149,999 | 7 | 13.0% |
| $150,000 to $199,999 | 1 | 1.9% |
| $200,000+ | 0 | 0.0% |
Household Income by Householder Age in Weskan
The median household income in Weskan is $0, with the highest median household income of $73,125 found in the 45 to 64 years age bracket for the primary householder. A total of 19 households (35.2%) fall into this category. Meanwhile, the 15 to 24 years age bracket for the primary householder has the lowest median household income of $0, with 8 households (14.8%) in this group.
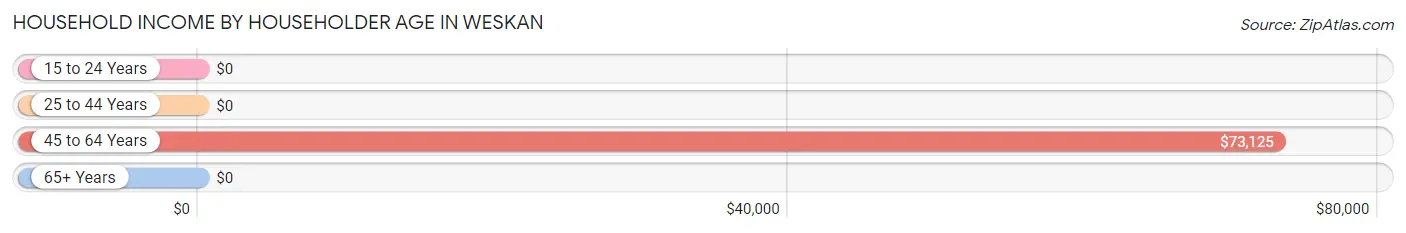
| Income Bracket | # Households | Median Income |
| 15 to 24 Years | 8 (14.8%) | $0 |
| 25 to 44 Years | 21 (38.9%) | $0 |
| 45 to 64 Years | 19 (35.2%) | $73,125 |
| 65+ Years | 6 (11.1%) | $0 |
| Total | 54 (100.0%) | $0 |
Poverty in Weskan
Income Below Poverty by Sex and Age in Weskan
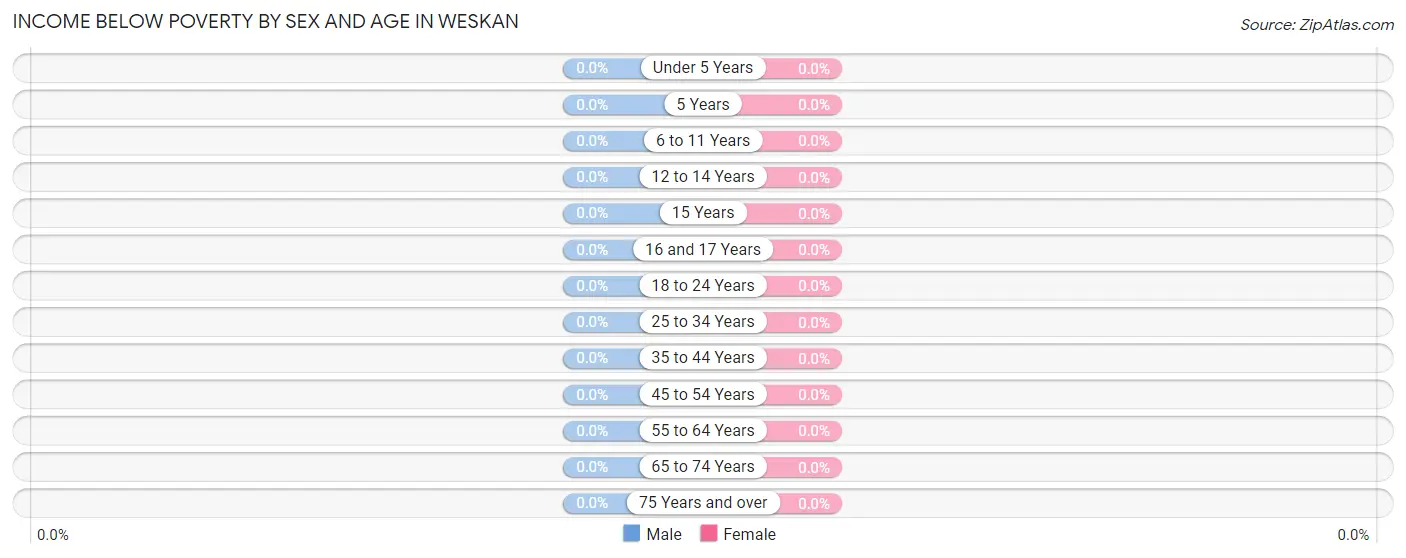
| Age Bracket | Male | Female |
| Under 5 Years | 0 (0.0%) | 0 (0.0%) |
| 5 Years | 0 (0.0%) | 0 (0.0%) |
| 6 to 11 Years | 0 (0.0%) | 0 (0.0%) |
| 12 to 14 Years | 0 (0.0%) | 0 (0.0%) |
| 15 Years | 0 (0.0%) | 0 (0.0%) |
| 16 and 17 Years | 0 (0.0%) | 0 (0.0%) |
| 18 to 24 Years | 0 (0.0%) | 0 (0.0%) |
| 25 to 34 Years | 0 (0.0%) | 0 (0.0%) |
| 35 to 44 Years | 0 (0.0%) | 0 (0.0%) |
| 45 to 54 Years | 0 (0.0%) | 0 (0.0%) |
| 55 to 64 Years | 0 (0.0%) | 0 (0.0%) |
| 65 to 74 Years | 0 (0.0%) | 0 (0.0%) |
| 75 Years and over | 0 (0.0%) | 0 (0.0%) |
| Total | 0 (0.0%) | 0 (0.0%) |
Income Above Poverty by Sex and Age in Weskan
According to the poverty statistics in Weskan, males aged under 5 years and females aged under 5 years are the age groups that are most secure financially, with 100.0% of males and 100.0% of females in these age groups living above the poverty line.

| Age Bracket | Male | Female |
| Under 5 Years | 11 (100.0%) | 9 (100.0%) |
| 5 Years | 0 (0.0%) | 0 (0.0%) |
| 6 to 11 Years | 1 (100.0%) | 5 (100.0%) |
| 12 to 14 Years | 0 (0.0%) | 4 (100.0%) |
| 15 Years | 0 (0.0%) | 0 (0.0%) |
| 16 and 17 Years | 0 (0.0%) | 0 (0.0%) |
| 18 to 24 Years | 5 (100.0%) | 11 (100.0%) |
| 25 to 34 Years | 22 (100.0%) | 5 (100.0%) |
| 35 to 44 Years | 2 (100.0%) | 1 (100.0%) |
| 45 to 54 Years | 6 (100.0%) | 5 (100.0%) |
| 55 to 64 Years | 13 (100.0%) | 11 (100.0%) |
| 65 to 74 Years | 5 (100.0%) | 3 (100.0%) |
| 75 Years and over | 2 (100.0%) | 2 (100.0%) |
| Total | 67 (100.0%) | 56 (100.0%) |
Income Below Poverty Among Married-Couple Families in Weskan
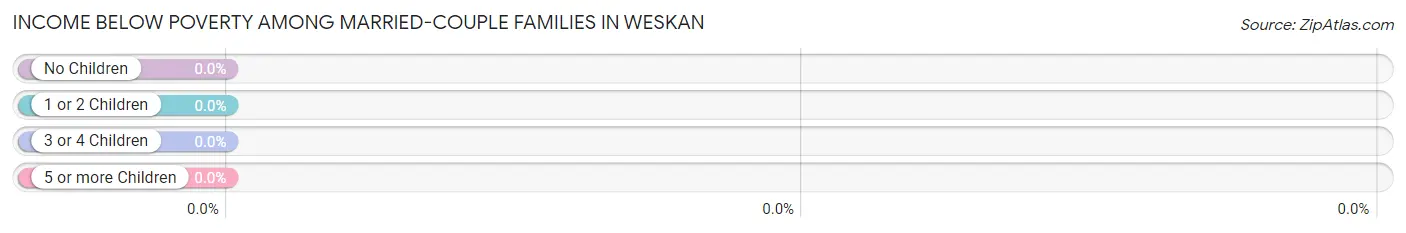
| Children | Above Poverty | Below Poverty |
| No Children | 22 (100.0%) | 0 (0.0%) |
| 1 or 2 Children | 2 (100.0%) | 0 (0.0%) |
| 3 or 4 Children | 3 (100.0%) | 0 (0.0%) |
| 5 or more Children | 0 (0.0%) | 0 (0.0%) |
| Total | 27 (100.0%) | 0 (0.0%) |
Income Below Poverty Among Single-Parent Households in Weskan
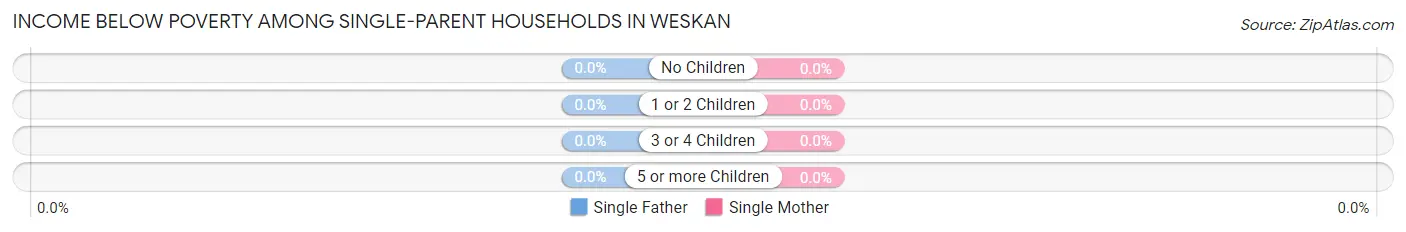
| Children | Single Father | Single Mother |
| No Children | 0 (0.0%) | 0 (0.0%) |
| 1 or 2 Children | 0 (0.0%) | 0 (0.0%) |
| 3 or 4 Children | 0 (0.0%) | 0 (0.0%) |
| 5 or more Children | 0 (0.0%) | 0 (0.0%) |
| Total | 0 (0.0%) | 0 (0.0%) |
Income Below Poverty Among Married-Couple vs Single-Parent Households in Weskan
| Children | Married-Couple Families | Single-Parent Households |
| No Children | 0 (0.0%) | 0 (0.0%) |
| 1 or 2 Children | 0 (0.0%) | 0 (0.0%) |
| 3 or 4 Children | 0 (0.0%) | 0 (0.0%) |
| 5 or more Children | 0 (0.0%) | 0 (0.0%) |
| Total | 0 (0.0%) | 0 (0.0%) |
Race in Weskan
The most populous races in Weskan are White / Caucasian (109 | 88.6%), Hispanic or Latino (8 | 6.5%), and Native / Alaskan (7 | 5.7%).
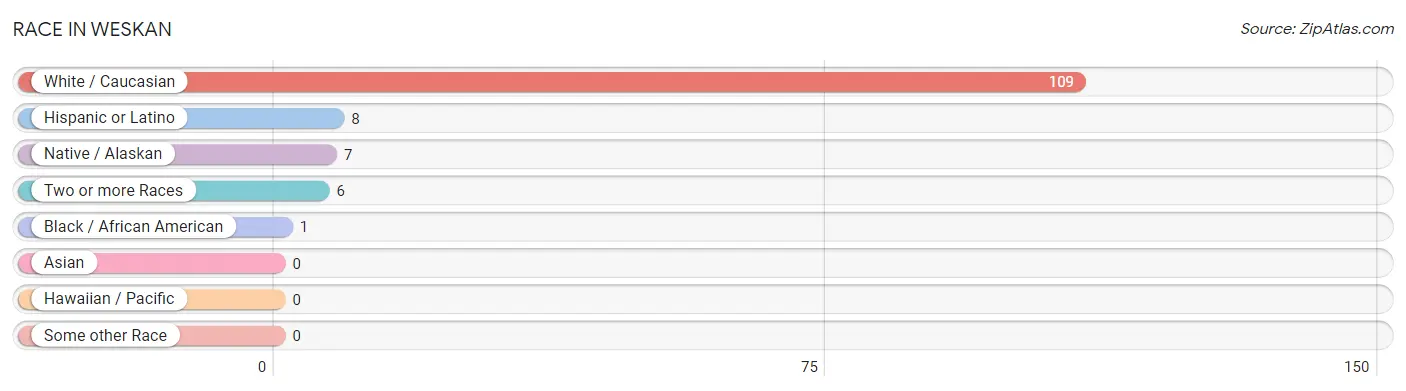
| Race | # Population | % Population |
| Asian | 0 | 0.0% |
| Black / African American | 1 | 0.8% |
| Hawaiian / Pacific | 0 | 0.0% |
| Hispanic or Latino | 8 | 6.5% |
| Native / Alaskan | 7 | 5.7% |
| White / Caucasian | 109 | 88.6% |
| Two or more Races | 6 | 4.9% |
| Some other Race | 0 | 0.0% |
| Total | 123 | 100.0% |
Ancestry in Weskan
The most populous ancestries reported in Weskan are German (51 | 41.5%), English (11 | 8.9%), Mexican (8 | 6.5%), Irish (7 | 5.7%), and French (4 | 3.3%), together accounting for 65.8% of all Weskan residents.
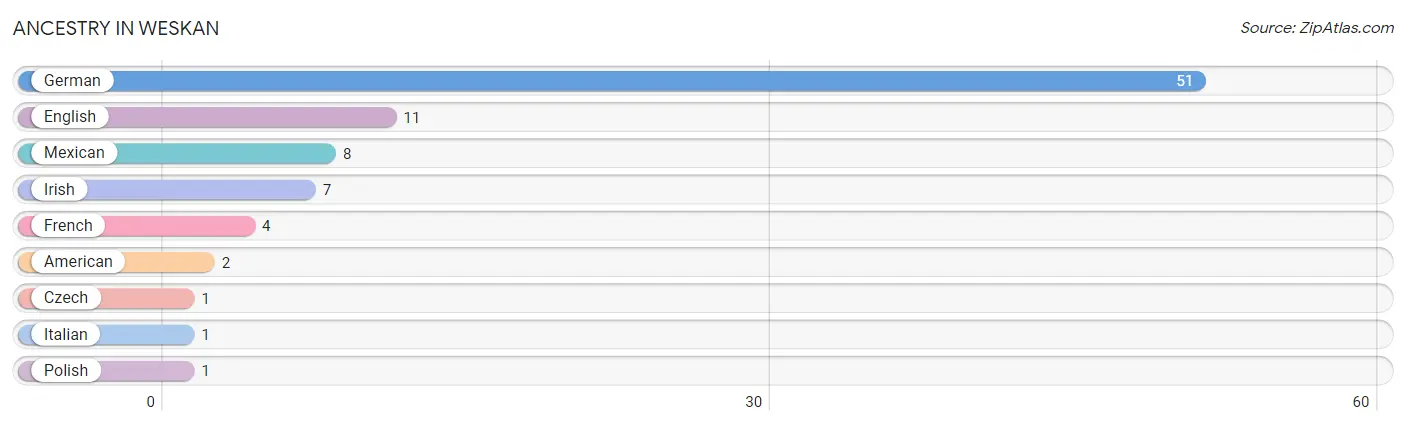
| Ancestry | # Population | % Population |
| American | 2 | 1.6% |
| Czech | 1 | 0.8% |
| English | 11 | 8.9% |
| French | 4 | 3.3% |
| German | 51 | 41.5% |
| Irish | 7 | 5.7% |
| Italian | 1 | 0.8% |
| Mexican | 8 | 6.5% |
| Polish | 1 | 0.8% | View All 9 Rows |
Immigrants in Weskan
The most numerous immigrant groups reported in Weskan came from Central America (3 | 2.4%), Latin America (3 | 2.4%), and Mexico (3 | 2.4%), together accounting for 7.3% of all Weskan residents.
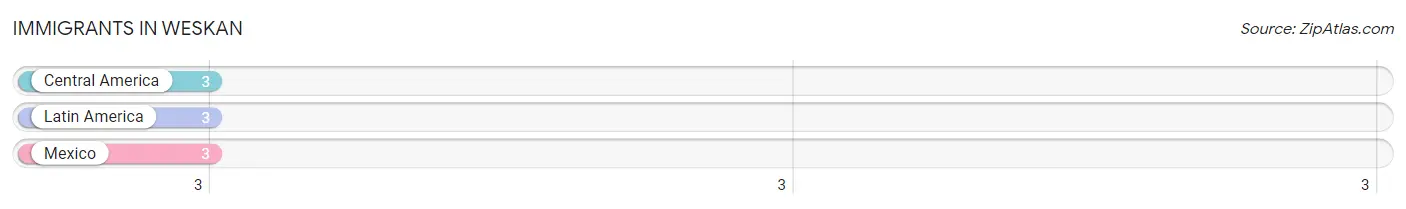
| Immigration Origin | # Population | % Population |
| Central America | 3 | 2.4% |
| Latin America | 3 | 2.4% |
| Mexico | 3 | 2.4% | View All 3 Rows |
Sex and Age in Weskan
Sex and Age in Weskan
The most populous age groups in Weskan are 30 to 34 Years (17 | 25.4%) for men and 20 to 24 Years (11 | 19.6%) for women.
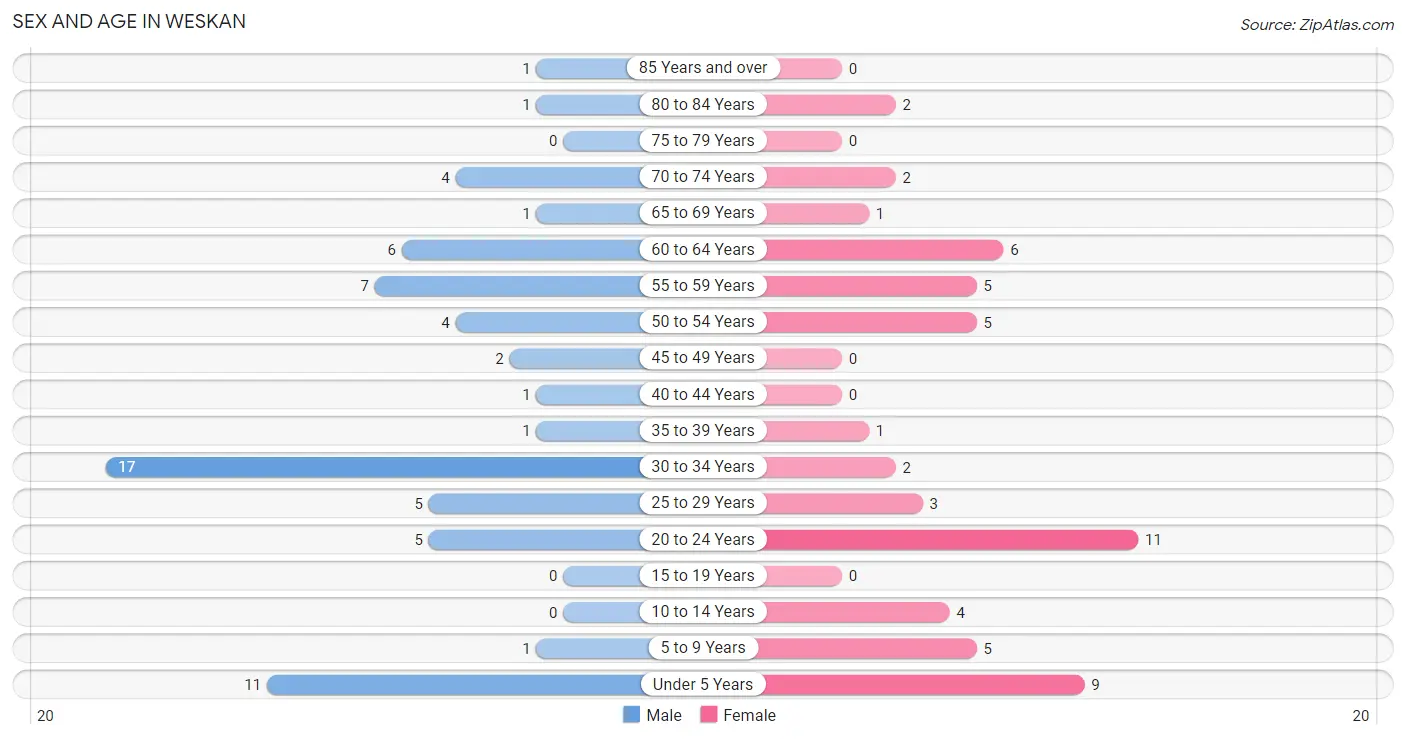
| Age Bracket | Male | Female |
| Under 5 Years | 11 (16.4%) | 9 (16.1%) |
| 5 to 9 Years | 1 (1.5%) | 5 (8.9%) |
| 10 to 14 Years | 0 (0.0%) | 4 (7.1%) |
| 15 to 19 Years | 0 (0.0%) | 0 (0.0%) |
| 20 to 24 Years | 5 (7.5%) | 11 (19.6%) |
| 25 to 29 Years | 5 (7.5%) | 3 (5.4%) |
| 30 to 34 Years | 17 (25.4%) | 2 (3.6%) |
| 35 to 39 Years | 1 (1.5%) | 1 (1.8%) |
| 40 to 44 Years | 1 (1.5%) | 0 (0.0%) |
| 45 to 49 Years | 2 (3.0%) | 0 (0.0%) |
| 50 to 54 Years | 4 (6.0%) | 5 (8.9%) |
| 55 to 59 Years | 7 (10.4%) | 5 (8.9%) |
| 60 to 64 Years | 6 (9.0%) | 6 (10.7%) |
| 65 to 69 Years | 1 (1.5%) | 1 (1.8%) |
| 70 to 74 Years | 4 (6.0%) | 2 (3.6%) |
| 75 to 79 Years | 0 (0.0%) | 0 (0.0%) |
| 80 to 84 Years | 1 (1.5%) | 2 (3.6%) |
| 85 Years and over | 1 (1.5%) | 0 (0.0%) |
| Total | 67 (100.0%) | 56 (100.0%) |
Families and Households in Weskan
Median Family Size in Weskan
The median family size in Weskan is 2.79 persons per family, with married-couple families (27 | 79.4%) accounting for the largest median family size of 2.96 persons per family. On the other hand, single female/mother families (3 | 8.8%) represent the smallest median family size with 1.67 persons per family.
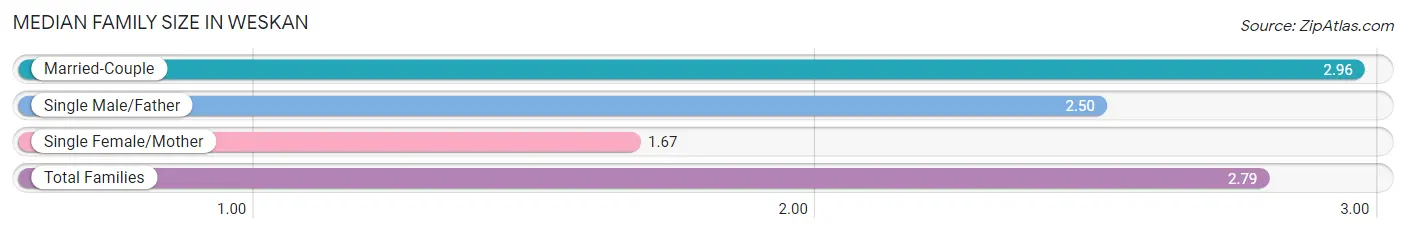
| Family Type | # Families | Family Size |
| Married-Couple | 27 (79.4%) | 2.96 |
| Single Male/Father | 4 (11.8%) | 2.50 |
| Single Female/Mother | 3 (8.8%) | 1.67 |
| Total Families | 34 (100.0%) | 2.79 |
Median Household Size in Weskan
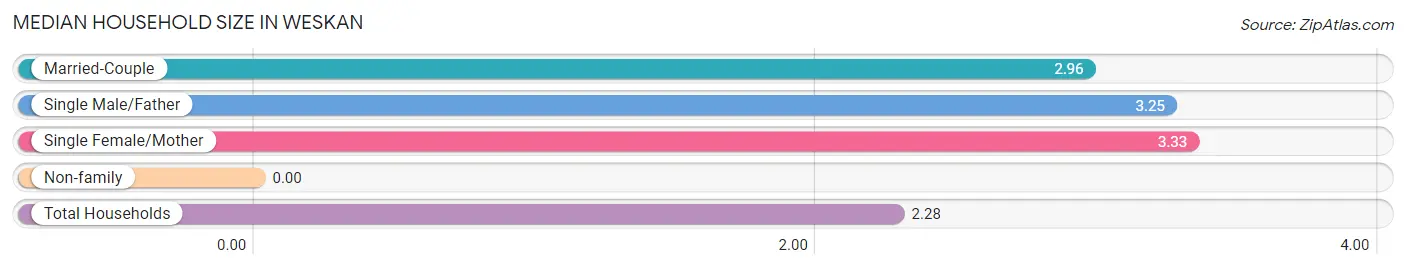
| Household Type | # Households | Household Size |
| Married-Couple | 27 (50.0%) | 2.96 |
| Single Male/Father | 4 (7.4%) | 3.25 |
| Single Female/Mother | 3 (5.6%) | 3.33 |
| Non-family | 20 (37.0%) | - |
| Total Households | 54 (100.0%) | 2.28 |
Household Size by Marriage Status in Weskan
Out of a total of 54 households in Weskan, 34 (63.0%) are family households, while 20 (37.0%) are nonfamily households. The most numerous type of family households are 2-person households, comprising 19, and the most common type of nonfamily households are 1-person households, comprising 20.
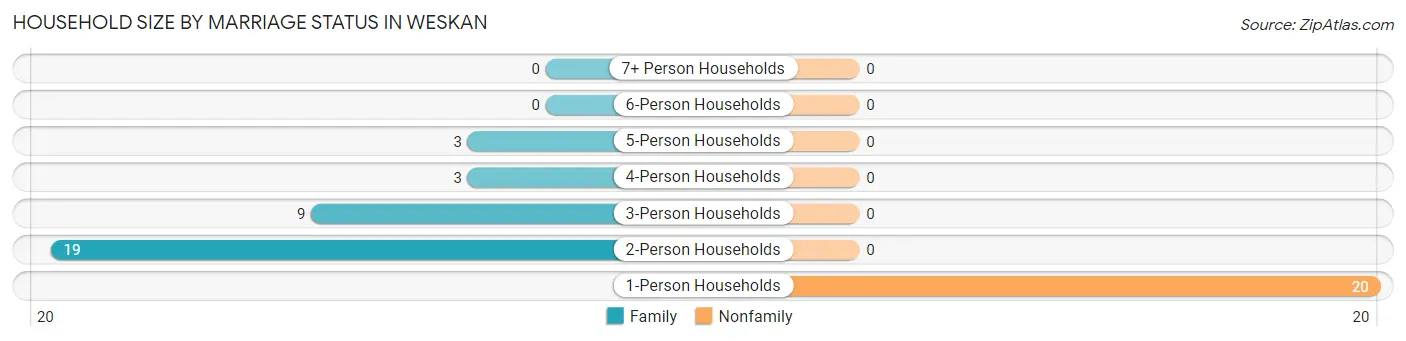
| Household Size | Family Households | Nonfamily Households |
| 1-Person Households | - | 20 (37.0%) |
| 2-Person Households | 19 (35.2%) | 0 (0.0%) |
| 3-Person Households | 9 (16.7%) | 0 (0.0%) |
| 4-Person Households | 3 (5.6%) | 0 (0.0%) |
| 5-Person Households | 3 (5.6%) | 0 (0.0%) |
| 6-Person Households | 0 (0.0%) | 0 (0.0%) |
| 7+ Person Households | 0 (0.0%) | 0 (0.0%) |
| Total | 34 (63.0%) | 20 (37.0%) |
Female Fertility in Weskan
Fertility by Age in Weskan
Average fertility rate in Weskan is 294.0 births per 1,000 women. Women in the age bracket of 20 to 34 years have the highest fertility rate with 313.0 births per 1,000 women. Women in the age bracket of 20 to 34 years acount for 100.0% of all women with births.
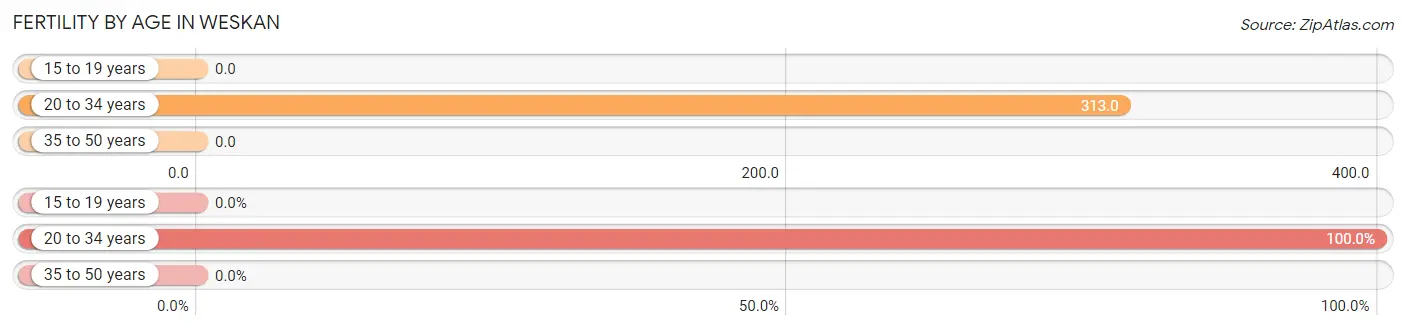
| Age Bracket | Women with Births | Births / 1,000 Women |
| 15 to 19 years | 0 (0.0%) | 0.0 |
| 20 to 34 years | 5 (100.0%) | 313.0 |
| 35 to 50 years | 0 (0.0%) | 0.0 |
| Total | 5 (100.0%) | 294.0 |
Fertility by Age by Marriage Status in Weskan
40.0% of women with births (5) in Weskan are married. The highest percentage of unmarried women with births falls into 20 to 34 years age bracket with 60.0% of them unmarried at the time of birth, while the lowest percentage of unmarried women with births belong to 20 to 34 years age bracket with 60.0% of them unmarried.
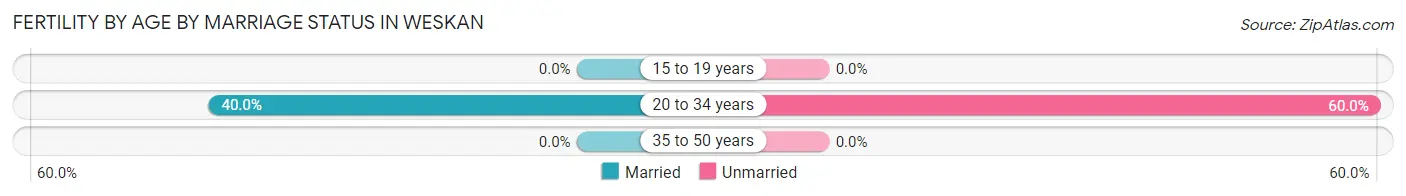
| Age Bracket | Married | Unmarried |
| 15 to 19 years | 0 (0.0%) | 0 (0.0%) |
| 20 to 34 years | 2 (40.0%) | 3 (60.0%) |
| 35 to 50 years | 0 (0.0%) | 0 (0.0%) |
| Total | 2 (40.0%) | 3 (60.0%) |
Fertility by Education in Weskan
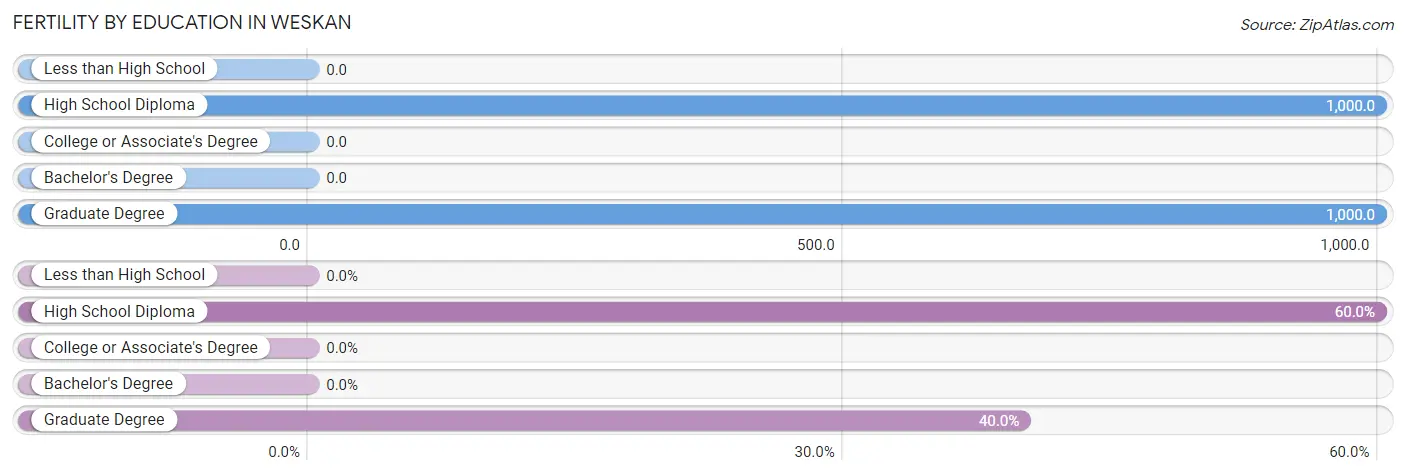
| Educational Attainment | Women with Births | Births / 1,000 Women |
| Less than High School | 0 (0.0%) | 0.0 |
| High School Diploma | 3 (60.0%) | 1,000.0 |
| College or Associate's Degree | 0 (0.0%) | 0.0 |
| Bachelor's Degree | 0 (0.0%) | 0.0 |
| Graduate Degree | 2 (40.0%) | 1,000.0 |
| Total | 5 (100.0%) | 294.0 |
Fertility by Education by Marriage Status in Weskan
60.0% of women with births in Weskan are unmarried. Women with the educational attainment of graduate degree are most likely to be married with 100.0% of them married at childbirth, while women with the educational attainment of high school diploma are least likely to be married with 100.0% of them unmarried at childbirth.
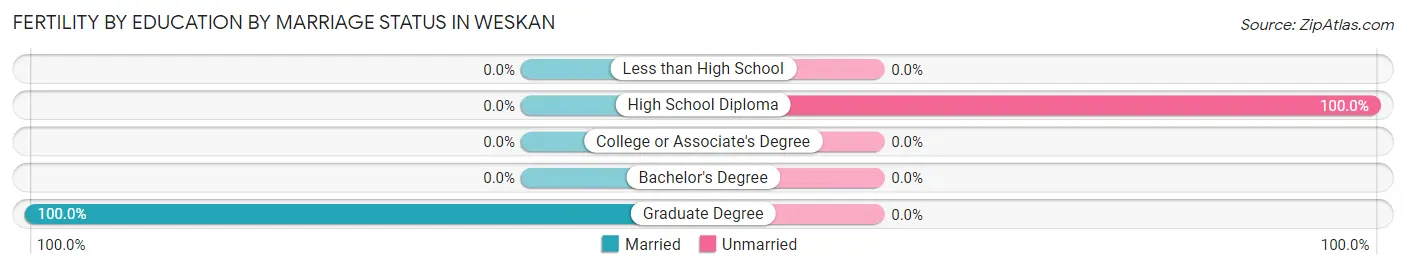
| Educational Attainment | Married | Unmarried |
| Less than High School | 0 (0.0%) | 0 (0.0%) |
| High School Diploma | 0 (0.0%) | 3 (100.0%) |
| College or Associate's Degree | 0 (0.0%) | 0 (0.0%) |
| Bachelor's Degree | 0 (0.0%) | 0 (0.0%) |
| Graduate Degree | 2 (100.0%) | 0 (0.0%) |
| Total | 2 (40.0%) | 3 (60.0%) |
Employment Characteristics in Weskan
Employment by Class of Employer in Weskan
Among the 78 employed individuals in Weskan, private company employees (39 | 50.0%), not-for-profit organizations (12 | 15.4%), and local government employees (12 | 15.4%) make up the most common classes of employment.
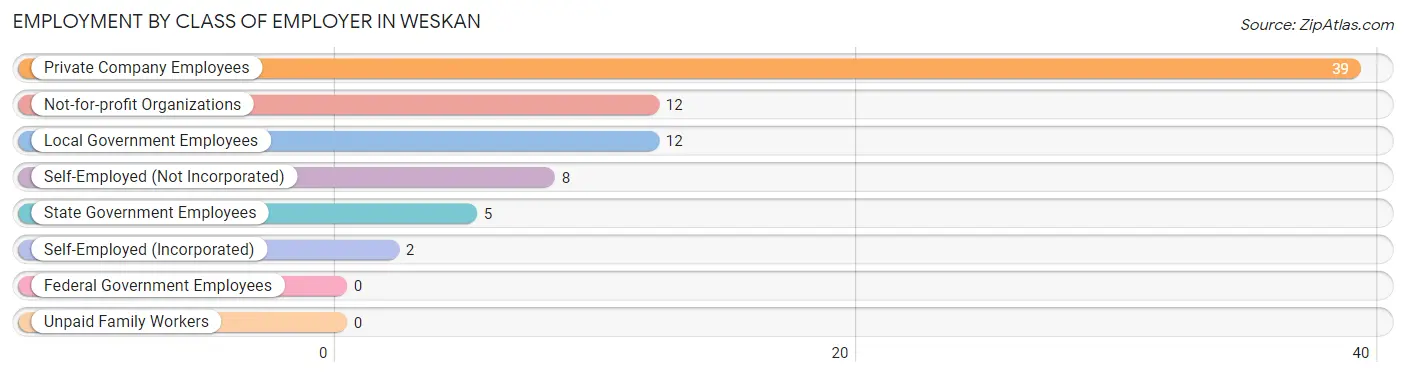
| Employer Class | # Employees | % Employees |
| Private Company Employees | 39 | 50.0% |
| Self-Employed (Incorporated) | 2 | 2.6% |
| Self-Employed (Not Incorporated) | 8 | 10.3% |
| Not-for-profit Organizations | 12 | 15.4% |
| Local Government Employees | 12 | 15.4% |
| State Government Employees | 5 | 6.4% |
| Federal Government Employees | 0 | 0.0% |
| Unpaid Family Workers | 0 | 0.0% |
| Total | 78 | 100.0% |
Employment Status by Age in Weskan
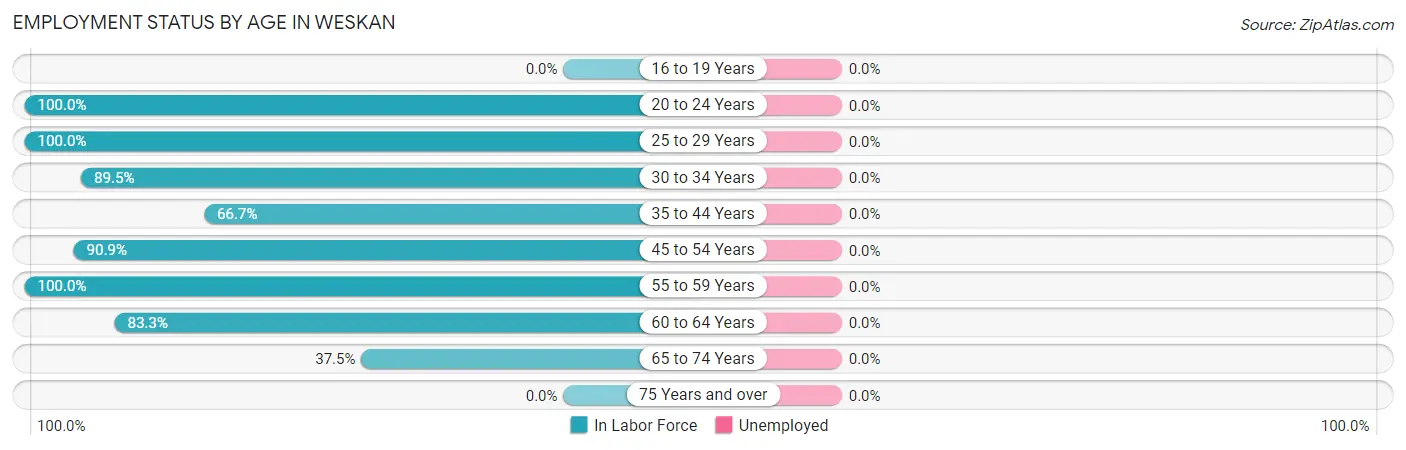
| Age Bracket | In Labor Force | Unemployed |
| 16 to 19 Years | 0 (0.0%) | 0 (0.0%) |
| 20 to 24 Years | 16 (100.0%) | 0 (0.0%) |
| 25 to 29 Years | 8 (100.0%) | 0 (0.0%) |
| 30 to 34 Years | 17 (89.5%) | 0 (0.0%) |
| 35 to 44 Years | 2 (66.7%) | 0 (0.0%) |
| 45 to 54 Years | 10 (90.9%) | 0 (0.0%) |
| 55 to 59 Years | 12 (100.0%) | 0 (0.0%) |
| 60 to 64 Years | 10 (83.3%) | 0 (0.0%) |
| 65 to 74 Years | 3 (37.5%) | 0 (0.0%) |
| 75 Years and over | 0 (0.0%) | 0 (0.0%) |
| Total | 78 (83.9%) | 0 (0.0%) |
Employment Status by Educational Attainment in Weskan
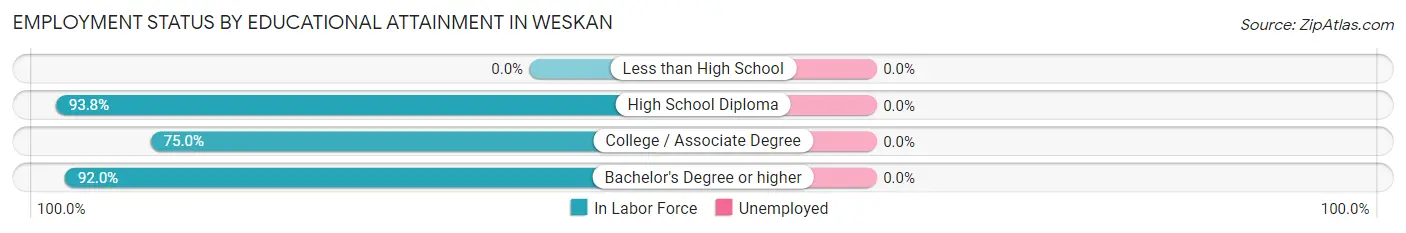
| Educational Attainment | In Labor Force | Unemployed |
| Less than High School | 0 (0.0%) | 0 (0.0%) |
| High School Diploma | 30 (93.8%) | 0 (0.0%) |
| College / Associate Degree | 6 (75.0%) | 0 (0.0%) |
| Bachelor's Degree or higher | 23 (92.0%) | 0 (0.0%) |
| Total | 59 (90.8%) | 0 (0.0%) |
Employment Occupations by Sex in Weskan
Management, Business, Science and Arts Occupations
The most common Management, Business, Science and Arts occupations in Weskan are Community & Social Service (21 | 26.9%), Education Instruction & Library (16 | 20.5%), Management (4 | 5.1%), Education, Arts & Media (4 | 5.1%), and Arts, Media & Entertainment (1 | 1.3%).
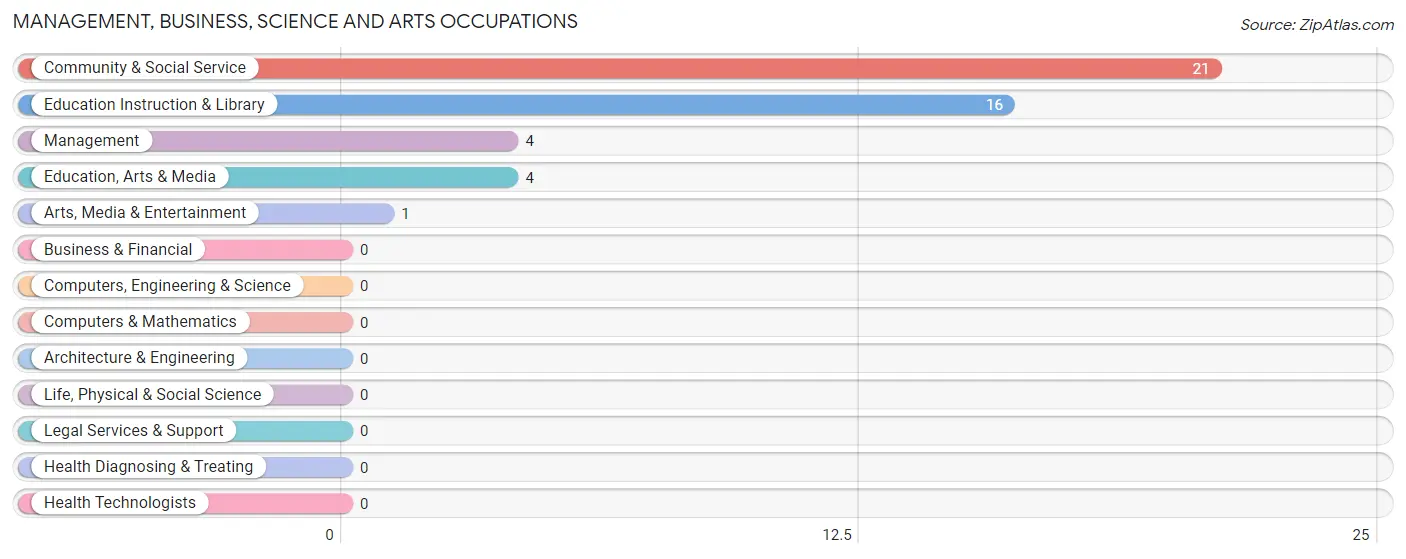
Management, Business, Science and Arts Occupations by Sex
Within the Management, Business, Science and Arts occupations in Weskan, the most male-oriented occupations are Management (100.0%), Education, Arts & Media (100.0%), and Community & Social Service (33.3%), while the most female-oriented occupations are Arts, Media & Entertainment (100.0%), Education Instruction & Library (81.2%), and Community & Social Service (66.7%).
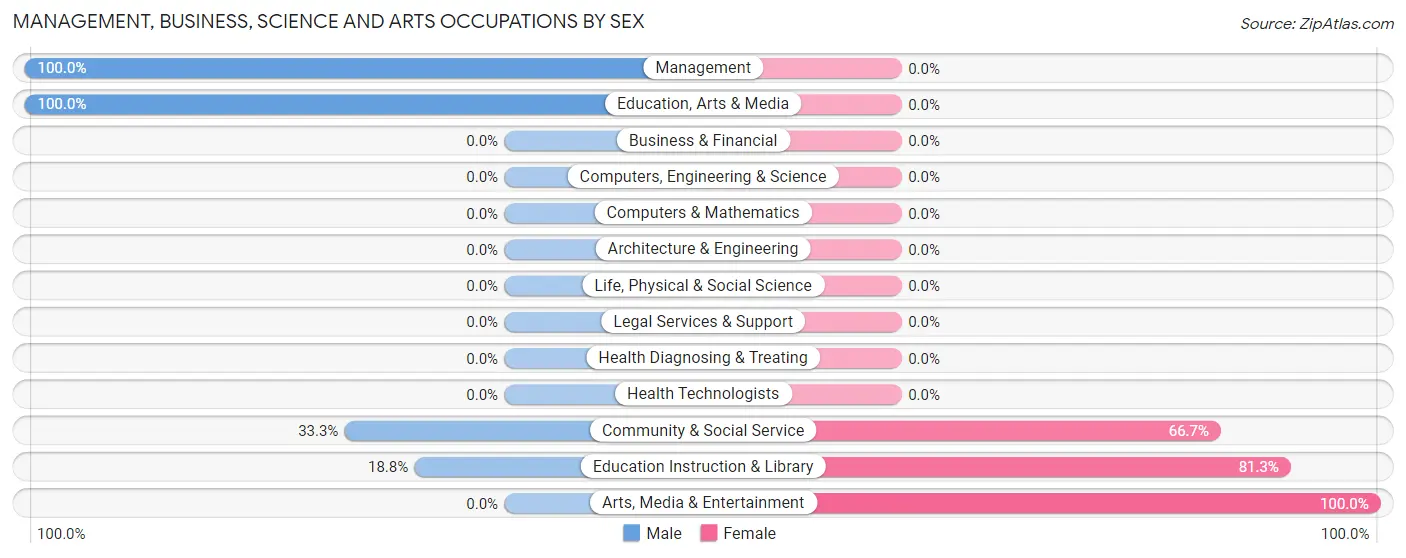
| Occupation | Male | Female |
| Management | 4 (100.0%) | 0 (0.0%) |
| Business & Financial | 0 (0.0%) | 0 (0.0%) |
| Computers, Engineering & Science | 0 (0.0%) | 0 (0.0%) |
| Computers & Mathematics | 0 (0.0%) | 0 (0.0%) |
| Architecture & Engineering | 0 (0.0%) | 0 (0.0%) |
| Life, Physical & Social Science | 0 (0.0%) | 0 (0.0%) |
| Community & Social Service | 7 (33.3%) | 14 (66.7%) |
| Education, Arts & Media | 4 (100.0%) | 0 (0.0%) |
| Legal Services & Support | 0 (0.0%) | 0 (0.0%) |
| Education Instruction & Library | 3 (18.8%) | 13 (81.2%) |
| Arts, Media & Entertainment | 0 (0.0%) | 1 (100.0%) |
| Health Diagnosing & Treating | 0 (0.0%) | 0 (0.0%) |
| Health Technologists | 0 (0.0%) | 0 (0.0%) |
| Total (Category) | 11 (44.0%) | 14 (56.0%) |
| Total (Overall) | 48 (61.5%) | 30 (38.5%) |
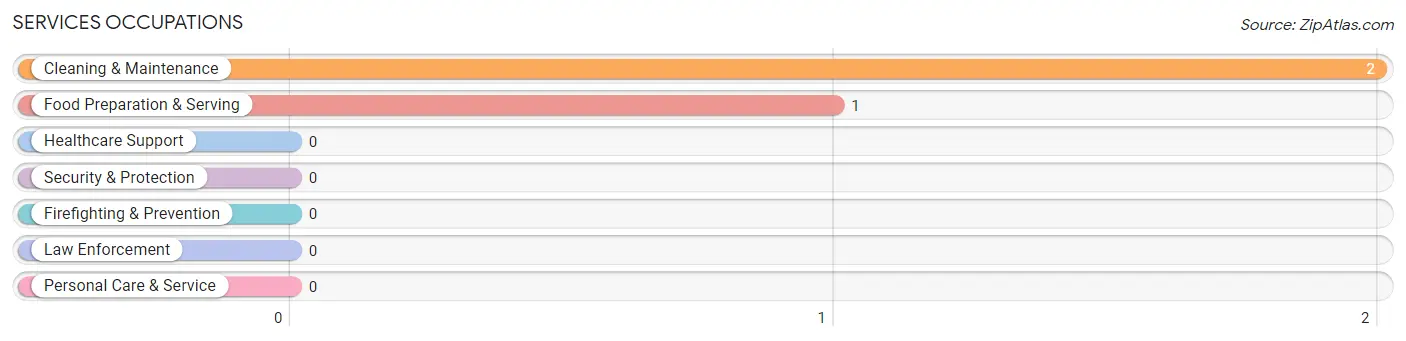
Services Occupations
The most common Services occupations in Weskan are Cleaning & Maintenance (2 | 2.6%), and Food Preparation & Serving (1 | 1.3%).
Services Occupations by Sex
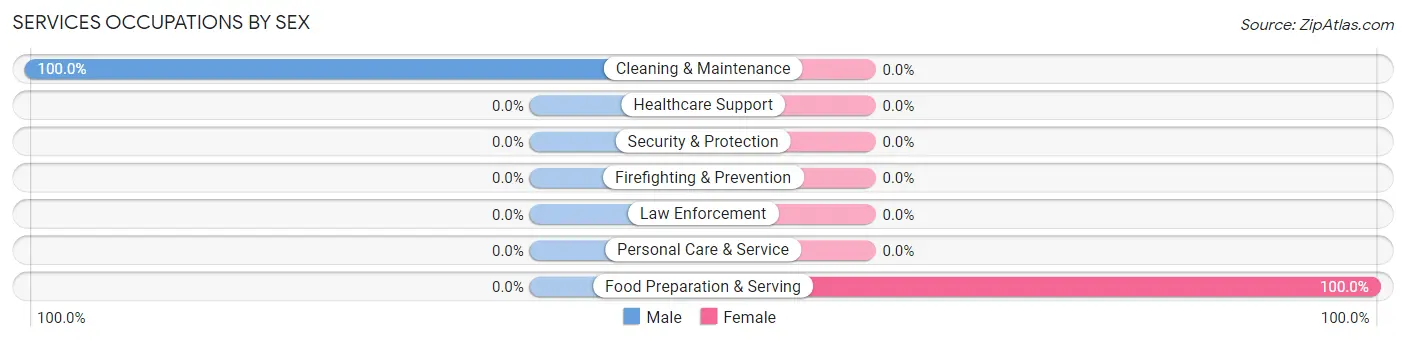
| Occupation | Male | Female |
| Healthcare Support | 0 (0.0%) | 0 (0.0%) |
| Security & Protection | 0 (0.0%) | 0 (0.0%) |
| Firefighting & Prevention | 0 (0.0%) | 0 (0.0%) |
| Law Enforcement | 0 (0.0%) | 0 (0.0%) |
| Food Preparation & Serving | 0 (0.0%) | 1 (100.0%) |
| Cleaning & Maintenance | 2 (100.0%) | 0 (0.0%) |
| Personal Care & Service | 0 (0.0%) | 0 (0.0%) |
| Total (Category) | 2 (66.7%) | 1 (33.3%) |
| Total (Overall) | 48 (61.5%) | 30 (38.5%) |
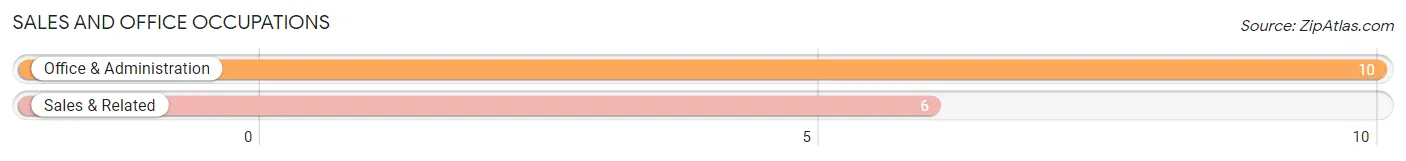
Sales and Office Occupations
The most common Sales and Office occupations in Weskan are Office & Administration (10 | 12.8%), and Sales & Related (6 | 7.7%).
Sales and Office Occupations by Sex
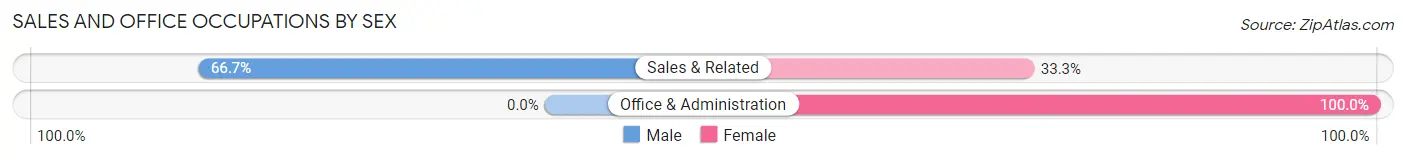
| Occupation | Male | Female |
| Sales & Related | 4 (66.7%) | 2 (33.3%) |
| Office & Administration | 0 (0.0%) | 10 (100.0%) |
| Total (Category) | 4 (25.0%) | 12 (75.0%) |
| Total (Overall) | 48 (61.5%) | 30 (38.5%) |
Natural Resources, Construction and Maintenance Occupations
The most common Natural Resources, Construction and Maintenance occupations in Weskan are Construction & Extraction (24 | 30.8%), and Farming, Fishing & Forestry (2 | 2.6%).
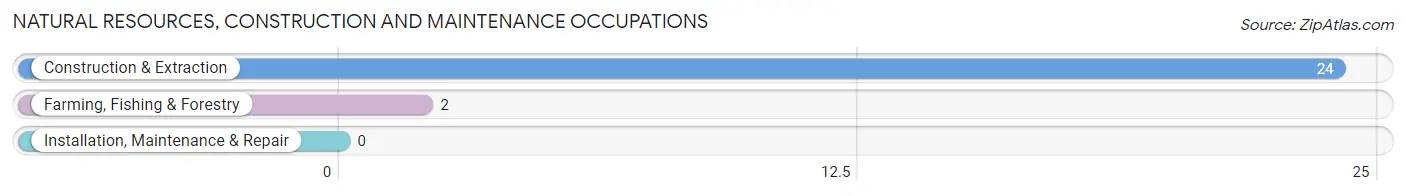
Natural Resources, Construction and Maintenance Occupations by Sex
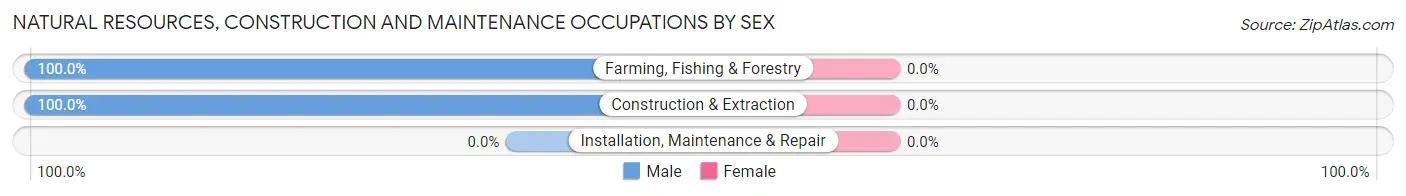
| Occupation | Male | Female |
| Farming, Fishing & Forestry | 2 (100.0%) | 0 (0.0%) |
| Construction & Extraction | 24 (100.0%) | 0 (0.0%) |
| Installation, Maintenance & Repair | 0 (0.0%) | 0 (0.0%) |
| Total (Category) | 26 (100.0%) | 0 (0.0%) |
| Total (Overall) | 48 (61.5%) | 30 (38.5%) |
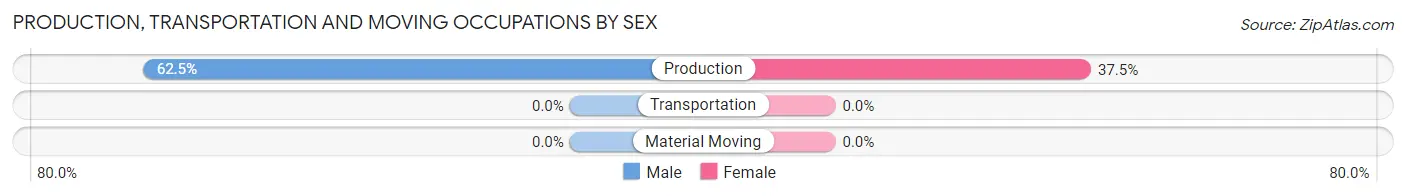
Production, Transportation and Moving Occupations
The most common Production, Transportation and Moving occupations in Weskan are , and Production (8 | 10.3%).
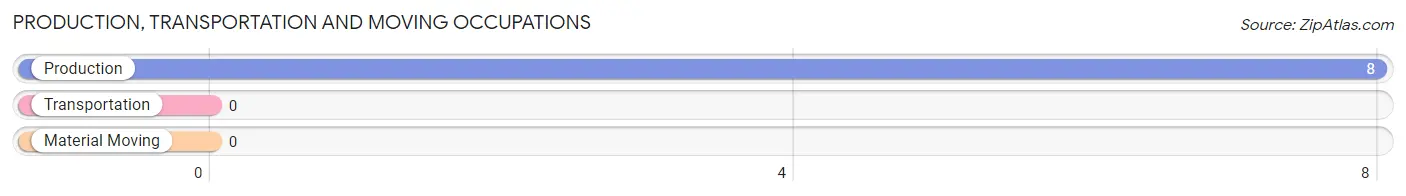
Production, Transportation and Moving Occupations by Sex
| Occupation | Male | Female |
| Production | 5 (62.5%) | 3 (37.5%) |
| Transportation | 0 (0.0%) | 0 (0.0%) |
| Material Moving | 0 (0.0%) | 0 (0.0%) |
| Total (Category) | 5 (62.5%) | 3 (37.5%) |
| Total (Overall) | 48 (61.5%) | 30 (38.5%) |
Employment Industries by Sex in Weskan
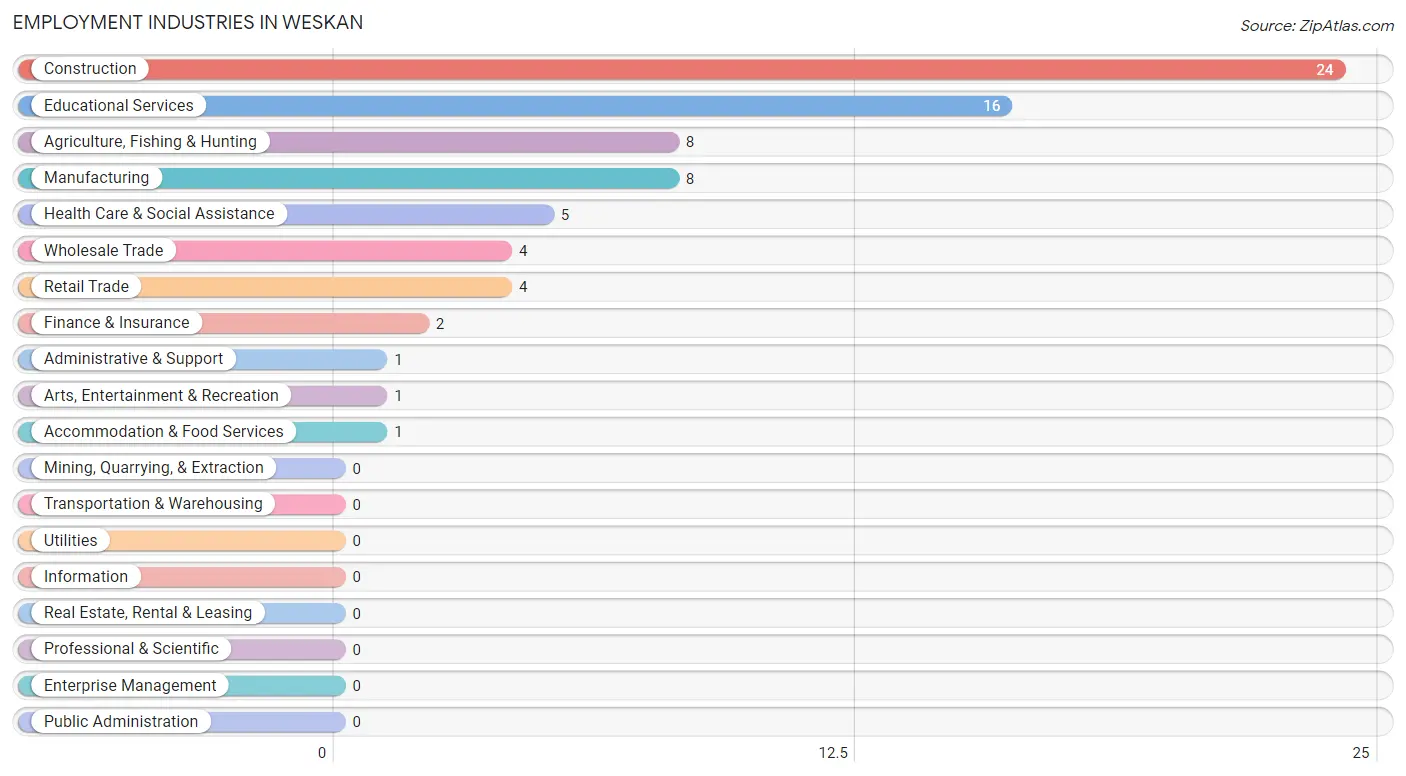
Employment Industries in Weskan
The major employment industries in Weskan include Construction (24 | 30.8%), Educational Services (16 | 20.5%), Agriculture, Fishing & Hunting (8 | 10.3%), Manufacturing (8 | 10.3%), and Health Care & Social Assistance (5 | 6.4%).
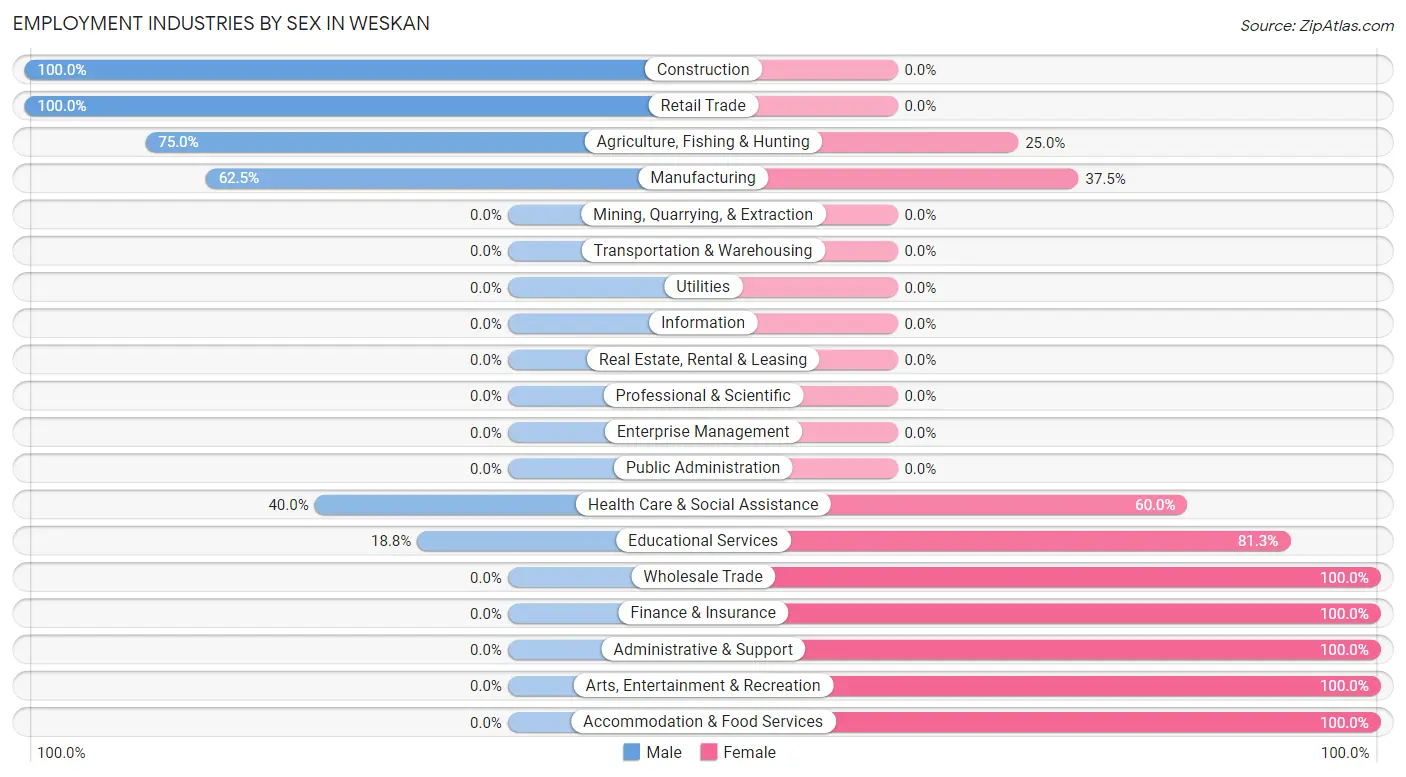
Employment Industries by Sex in Weskan
The Weskan industries that see more men than women are Construction (100.0%), Retail Trade (100.0%), and Agriculture, Fishing & Hunting (75.0%), whereas the industries that tend to have a higher number of women are Wholesale Trade (100.0%), Finance & Insurance (100.0%), and Administrative & Support (100.0%).
| Industry | Male | Female |
| Agriculture, Fishing & Hunting | 6 (75.0%) | 2 (25.0%) |
| Mining, Quarrying, & Extraction | 0 (0.0%) | 0 (0.0%) |
| Construction | 24 (100.0%) | 0 (0.0%) |
| Manufacturing | 5 (62.5%) | 3 (37.5%) |
| Wholesale Trade | 0 (0.0%) | 4 (100.0%) |
| Retail Trade | 4 (100.0%) | 0 (0.0%) |
| Transportation & Warehousing | 0 (0.0%) | 0 (0.0%) |
| Utilities | 0 (0.0%) | 0 (0.0%) |
| Information | 0 (0.0%) | 0 (0.0%) |
| Finance & Insurance | 0 (0.0%) | 2 (100.0%) |
| Real Estate, Rental & Leasing | 0 (0.0%) | 0 (0.0%) |
| Professional & Scientific | 0 (0.0%) | 0 (0.0%) |
| Enterprise Management | 0 (0.0%) | 0 (0.0%) |
| Administrative & Support | 0 (0.0%) | 1 (100.0%) |
| Educational Services | 3 (18.8%) | 13 (81.2%) |
| Health Care & Social Assistance | 2 (40.0%) | 3 (60.0%) |
| Arts, Entertainment & Recreation | 0 (0.0%) | 1 (100.0%) |
| Accommodation & Food Services | 0 (0.0%) | 1 (100.0%) |
| Public Administration | 0 (0.0%) | 0 (0.0%) |
| Total | 48 (61.5%) | 30 (38.5%) |
Education in Weskan
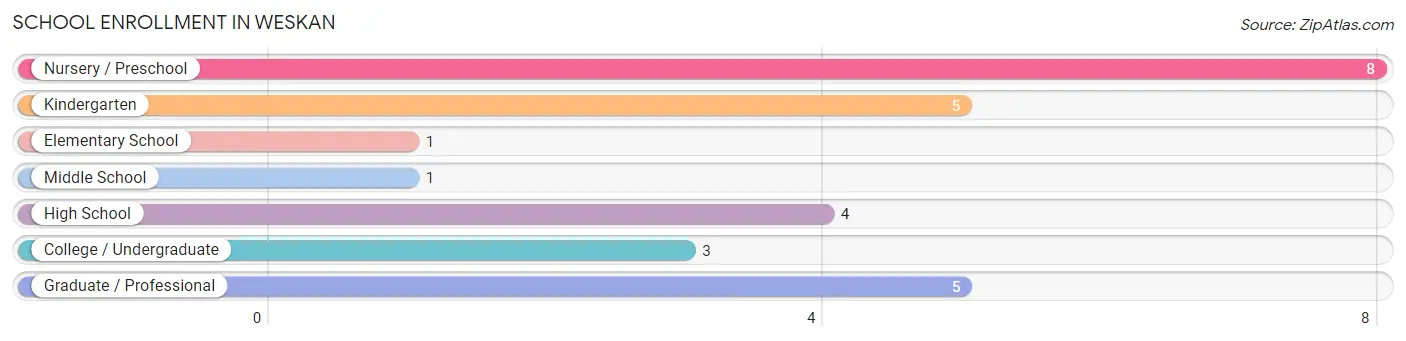
School Enrollment in Weskan
The most common levels of schooling among the 27 students in Weskan are nursery / preschool (8 | 29.6%), kindergarten (5 | 18.5%), and graduate / professional (5 | 18.5%).
| School Level | # Students | % Students |
| Nursery / Preschool | 8 | 29.6% |
| Kindergarten | 5 | 18.5% |
| Elementary School | 1 | 3.7% |
| Middle School | 1 | 3.7% |
| High School | 4 | 14.8% |
| College / Undergraduate | 3 | 11.1% |
| Graduate / Professional | 5 | 18.5% |
| Total | 27 | 100.0% |
School Enrollment by Age by Funding Source in Weskan
Out of a total of 27 students who are enrolled in schools in Weskan, 6 (22.2%) attend a private institution, while the remaining 21 (77.8%) are enrolled in public schools. The age group of 3 to 4 year olds has the highest likelihood of being enrolled in private schools, with 6 (75.0% in the age bracket) enrolled. Conversely, the age group of 5 to 9 year old has the lowest likelihood of being enrolled in a private school, with 6 (100.0% in the age bracket) attending a public institution.
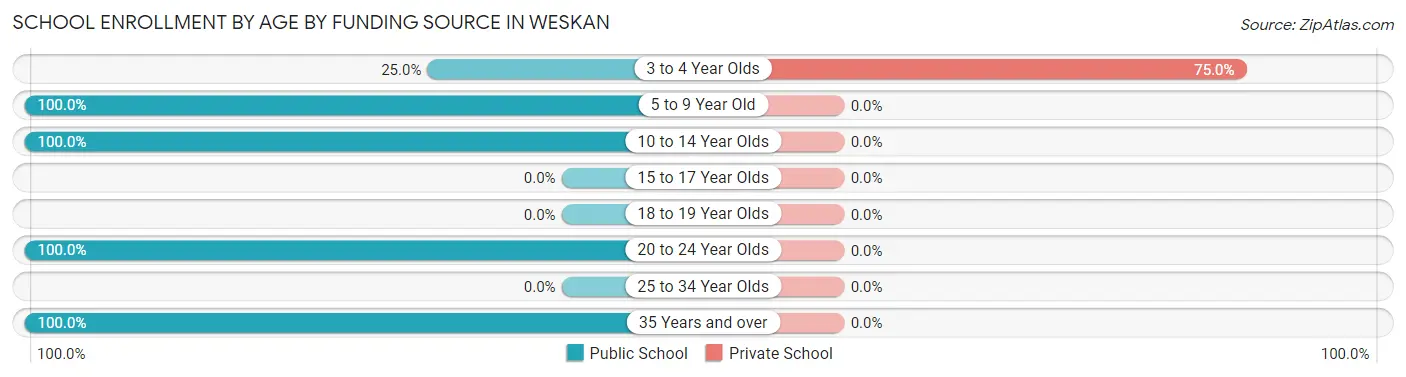
| Age Bracket | Public School | Private School |
| 3 to 4 Year Olds | 2 (25.0%) | 6 (75.0%) |
| 5 to 9 Year Old | 6 (100.0%) | 0 (0.0%) |
| 10 to 14 Year Olds | 4 (100.0%) | 0 (0.0%) |
| 15 to 17 Year Olds | 0 (0.0%) | 0 (0.0%) |
| 18 to 19 Year Olds | 0 (0.0%) | 0 (0.0%) |
| 20 to 24 Year Olds | 8 (100.0%) | 0 (0.0%) |
| 25 to 34 Year Olds | 0 (0.0%) | 0 (0.0%) |
| 35 Years and over | 1 (100.0%) | 0 (0.0%) |
| Total | 21 (77.8%) | 6 (22.2%) |
Educational Attainment by Field of Study in Weskan
Education (8 | 28.6%), business (7 | 25.0%), bio, nature & agricultural (5 | 17.9%), social sciences (4 | 14.3%), and liberal arts & history (2 | 7.1%) are the most common fields of study among 28 individuals in Weskan who have obtained a bachelor's degree or higher.
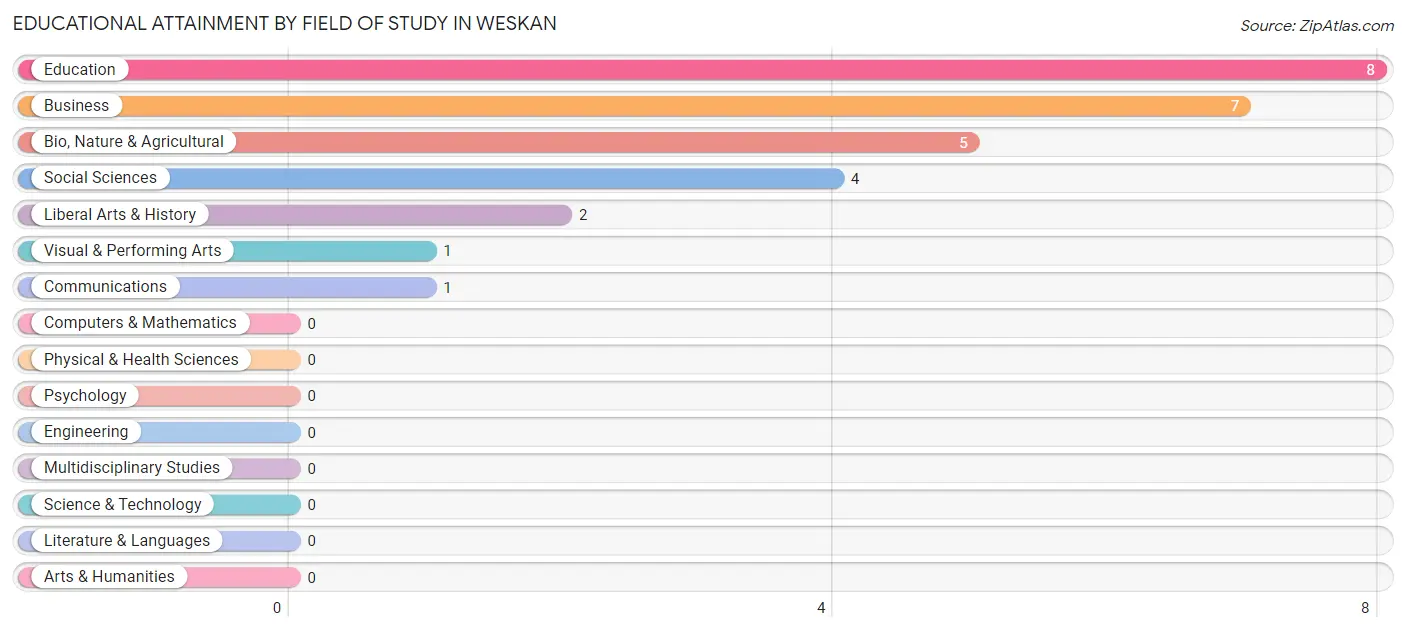
| Field of Study | # Graduates | % Graduates |
| Computers & Mathematics | 0 | 0.0% |
| Bio, Nature & Agricultural | 5 | 17.9% |
| Physical & Health Sciences | 0 | 0.0% |
| Psychology | 0 | 0.0% |
| Social Sciences | 4 | 14.3% |
| Engineering | 0 | 0.0% |
| Multidisciplinary Studies | 0 | 0.0% |
| Science & Technology | 0 | 0.0% |
| Business | 7 | 25.0% |
| Education | 8 | 28.6% |
| Literature & Languages | 0 | 0.0% |
| Liberal Arts & History | 2 | 7.1% |
| Visual & Performing Arts | 1 | 3.6% |
| Communications | 1 | 3.6% |
| Arts & Humanities | 0 | 0.0% |
| Total | 28 | 100.0% |
Transportation & Commute in Weskan
Vehicle Availability by Sex in Weskan
The most prevalent vehicle ownership categories in Weskan are males with 1 vehicle (16, accounting for 33.3%) and females with 1 vehicle (8, making up 53.3%).
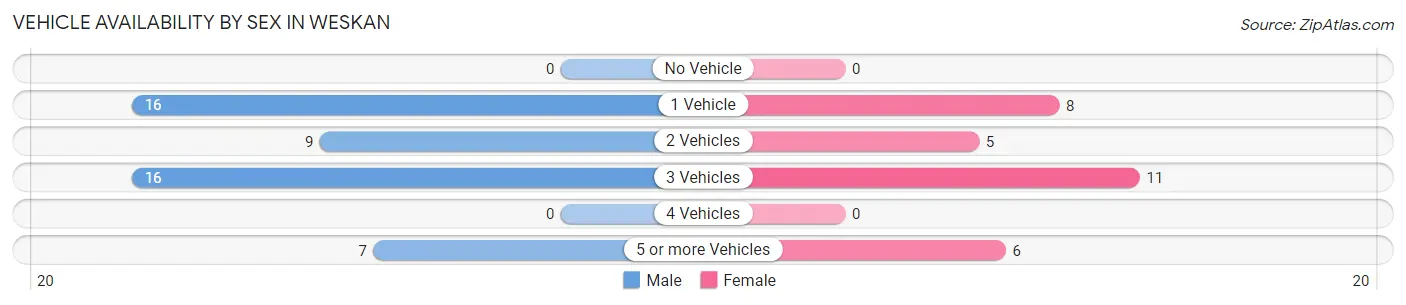
| Vehicles Available | Male | Female |
| No Vehicle | 0 (0.0%) | 0 (0.0%) |
| 1 Vehicle | 16 (33.3%) | 8 (26.7%) |
| 2 Vehicles | 9 (18.8%) | 5 (16.7%) |
| 3 Vehicles | 16 (33.3%) | 11 (36.7%) |
| 4 Vehicles | 0 (0.0%) | 0 (0.0%) |
| 5 or more Vehicles | 7 (14.6%) | 6 (20.0%) |
| Total | 48 (100.0%) | 30 (100.0%) |
Commute Time in Weskan
The most frequently occuring commute durations in Weskan are 5 to 9 minutes (22 commuters, 31.0%), 20 to 24 minutes (16 commuters, 22.5%), and less than 5 minutes (13 commuters, 18.3%).
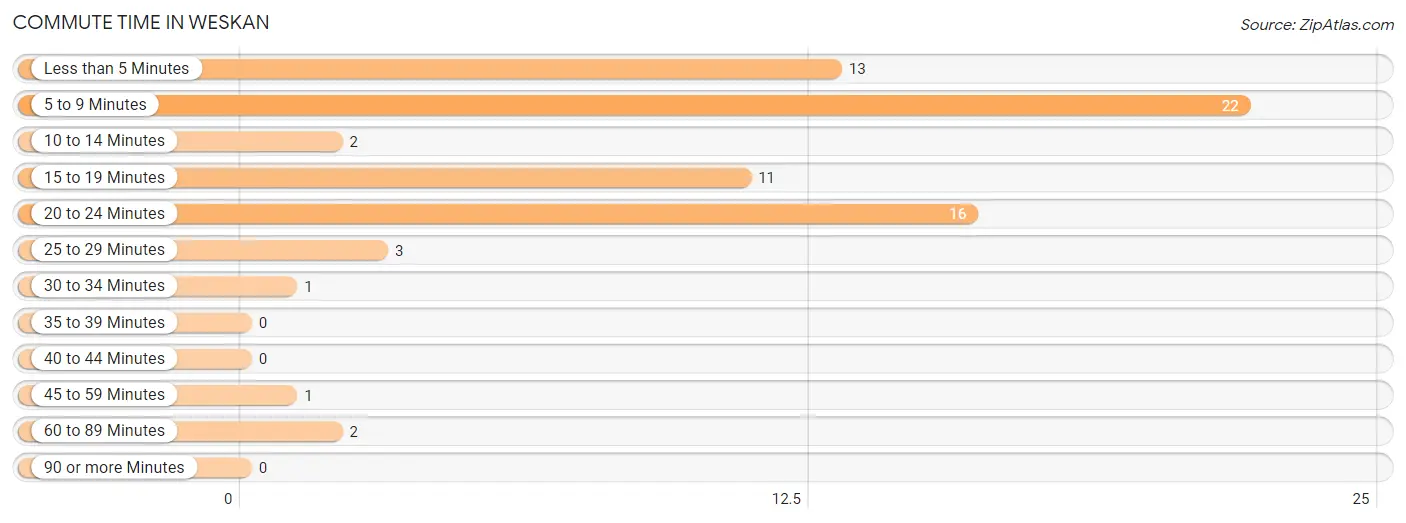
| Commute Time | # Commuters | % Commuters |
| Less than 5 Minutes | 13 | 18.3% |
| 5 to 9 Minutes | 22 | 31.0% |
| 10 to 14 Minutes | 2 | 2.8% |
| 15 to 19 Minutes | 11 | 15.5% |
| 20 to 24 Minutes | 16 | 22.5% |
| 25 to 29 Minutes | 3 | 4.2% |
| 30 to 34 Minutes | 1 | 1.4% |
| 35 to 39 Minutes | 0 | 0.0% |
| 40 to 44 Minutes | 0 | 0.0% |
| 45 to 59 Minutes | 1 | 1.4% |
| 60 to 89 Minutes | 2 | 2.8% |
| 90 or more Minutes | 0 | 0.0% |
Commute Time by Sex in Weskan
The most common commute times in Weskan are 20 to 24 minutes (16 commuters, 39.0%) for males and 5 to 9 minutes (14 commuters, 46.7%) for females.
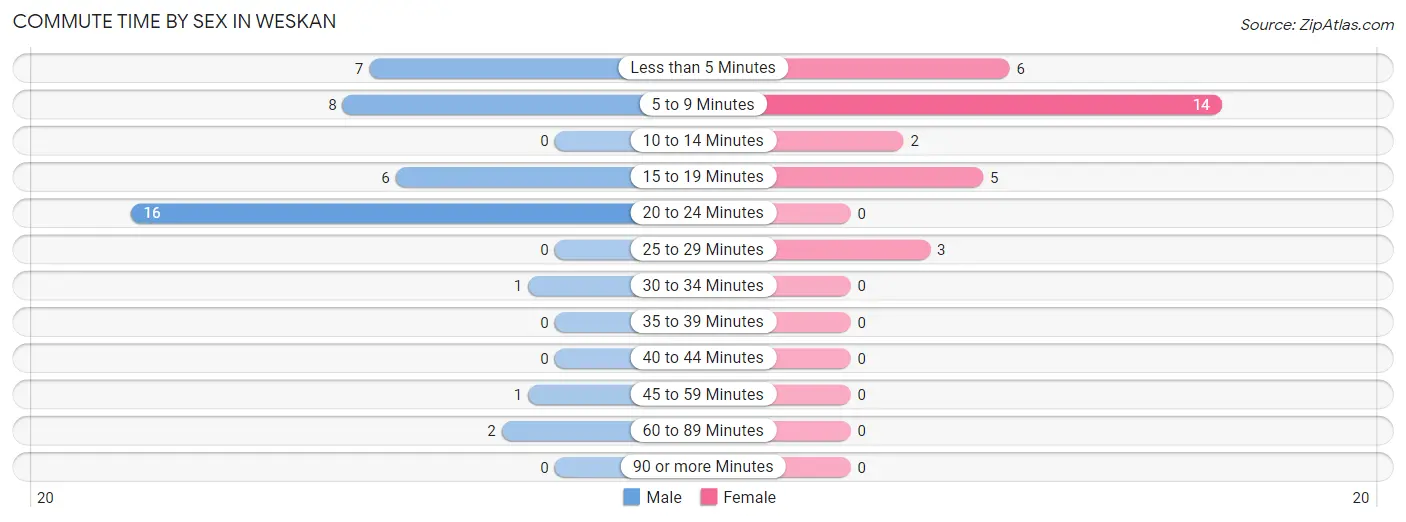
| Commute Time | Male | Female |
| Less than 5 Minutes | 7 (17.1%) | 6 (20.0%) |
| 5 to 9 Minutes | 8 (19.5%) | 14 (46.7%) |
| 10 to 14 Minutes | 0 (0.0%) | 2 (6.7%) |
| 15 to 19 Minutes | 6 (14.6%) | 5 (16.7%) |
| 20 to 24 Minutes | 16 (39.0%) | 0 (0.0%) |
| 25 to 29 Minutes | 0 (0.0%) | 3 (10.0%) |
| 30 to 34 Minutes | 1 (2.4%) | 0 (0.0%) |
| 35 to 39 Minutes | 0 (0.0%) | 0 (0.0%) |
| 40 to 44 Minutes | 0 (0.0%) | 0 (0.0%) |
| 45 to 59 Minutes | 1 (2.4%) | 0 (0.0%) |
| 60 to 89 Minutes | 2 (4.9%) | 0 (0.0%) |
| 90 or more Minutes | 0 (0.0%) | 0 (0.0%) |
Time of Departure to Work by Sex in Weskan
The most frequent times of departure to work in Weskan are 12:00 AM to 4:59 AM (14, 34.2%) for males and 7:00 AM to 7:29 AM (19, 63.3%) for females.
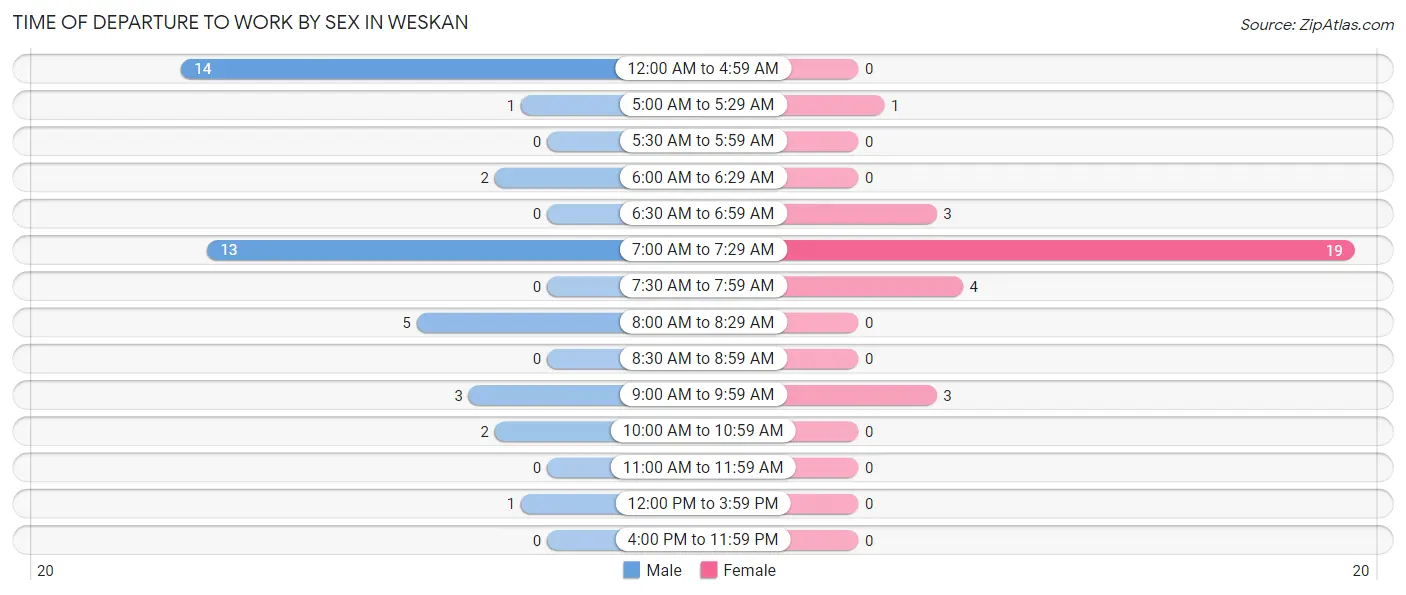
| Time of Departure | Male | Female |
| 12:00 AM to 4:59 AM | 14 (34.2%) | 0 (0.0%) |
| 5:00 AM to 5:29 AM | 1 (2.4%) | 1 (3.3%) |
| 5:30 AM to 5:59 AM | 0 (0.0%) | 0 (0.0%) |
| 6:00 AM to 6:29 AM | 2 (4.9%) | 0 (0.0%) |
| 6:30 AM to 6:59 AM | 0 (0.0%) | 3 (10.0%) |
| 7:00 AM to 7:29 AM | 13 (31.7%) | 19 (63.3%) |
| 7:30 AM to 7:59 AM | 0 (0.0%) | 4 (13.3%) |
| 8:00 AM to 8:29 AM | 5 (12.2%) | 0 (0.0%) |
| 8:30 AM to 8:59 AM | 0 (0.0%) | 0 (0.0%) |
| 9:00 AM to 9:59 AM | 3 (7.3%) | 3 (10.0%) |
| 10:00 AM to 10:59 AM | 2 (4.9%) | 0 (0.0%) |
| 11:00 AM to 11:59 AM | 0 (0.0%) | 0 (0.0%) |
| 12:00 PM to 3:59 PM | 1 (2.4%) | 0 (0.0%) |
| 4:00 PM to 11:59 PM | 0 (0.0%) | 0 (0.0%) |
| Total | 41 (100.0%) | 30 (100.0%) |
Housing Occupancy in Weskan
Occupancy by Ownership in Weskan
Of the total 54 dwellings in Weskan, owner-occupied units account for 24 (44.4%), while renter-occupied units make up 30 (55.6%).
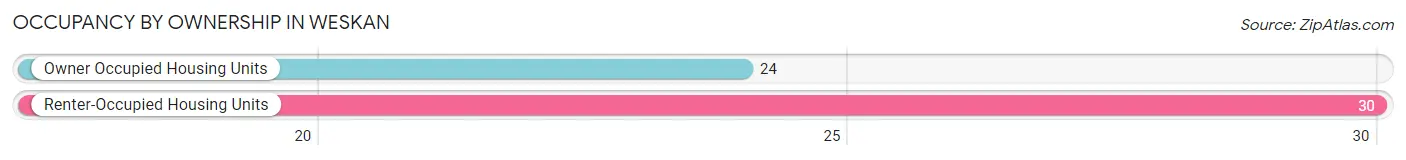
| Occupancy | # Housing Units | % Housing Units |
| Owner Occupied Housing Units | 24 | 44.4% |
| Renter-Occupied Housing Units | 30 | 55.6% |
| Total Occupied Housing Units | 54 | 100.0% |
Occupancy by Household Size in Weskan
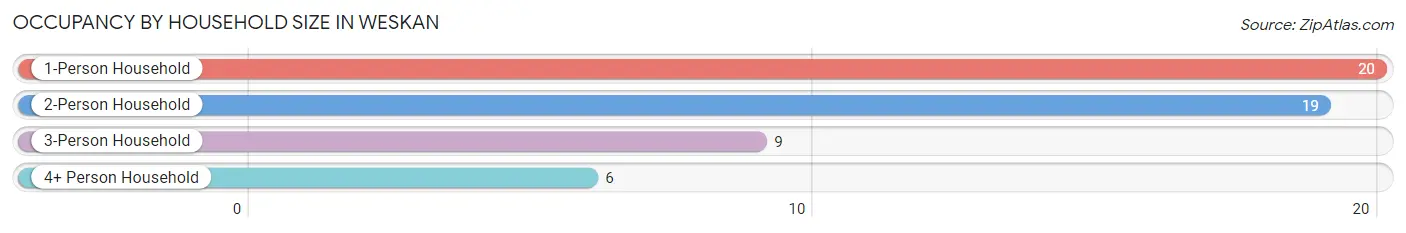
| Household Size | # Housing Units | % Housing Units |
| 1-Person Household | 20 | 37.0% |
| 2-Person Household | 19 | 35.2% |
| 3-Person Household | 9 | 16.7% |
| 4+ Person Household | 6 | 11.1% |
| Total Housing Units | 54 | 100.0% |
Occupancy by Ownership by Household Size in Weskan
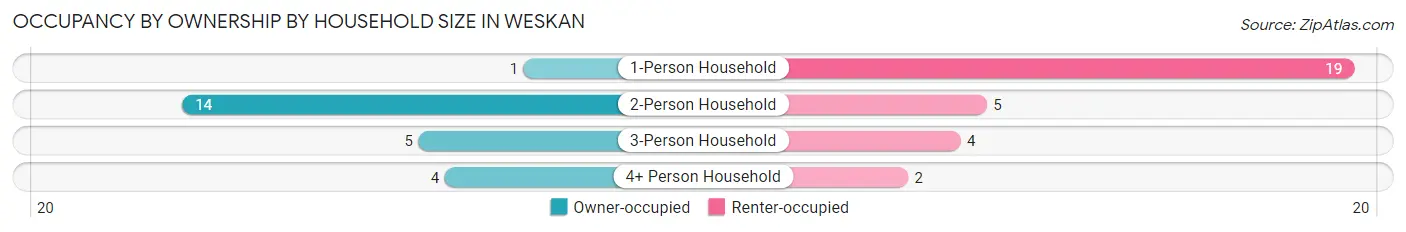
| Household Size | Owner-occupied | Renter-occupied |
| 1-Person Household | 1 (5.0%) | 19 (95.0%) |
| 2-Person Household | 14 (73.7%) | 5 (26.3%) |
| 3-Person Household | 5 (55.6%) | 4 (44.4%) |
| 4+ Person Household | 4 (66.7%) | 2 (33.3%) |
| Total Housing Units | 24 (44.4%) | 30 (55.6%) |
Occupancy by Educational Attainment in Weskan
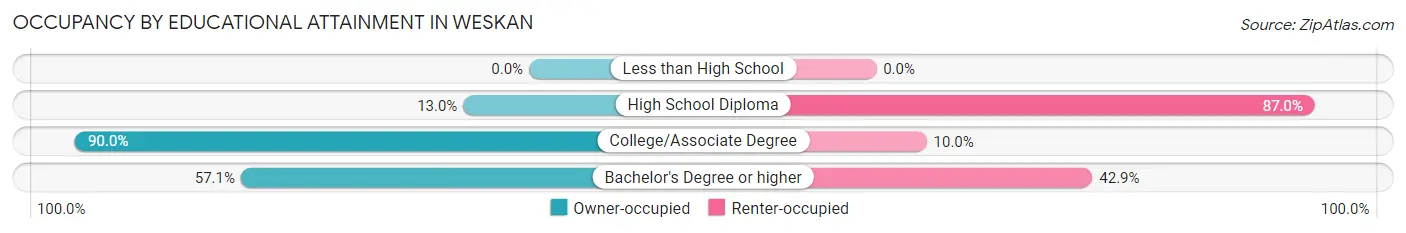
| Household Size | Owner-occupied | Renter-occupied |
| Less than High School | 0 (0.0%) | 0 (0.0%) |
| High School Diploma | 3 (13.0%) | 20 (87.0%) |
| College/Associate Degree | 9 (90.0%) | 1 (10.0%) |
| Bachelor's Degree or higher | 12 (57.1%) | 9 (42.9%) |
Occupancy by Age of Householder in Weskan
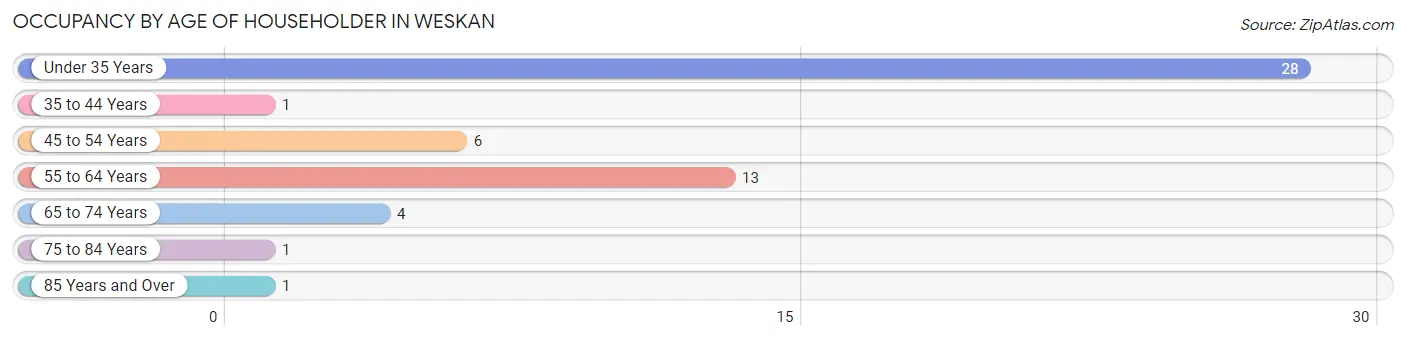
| Age Bracket | # Households | % Households |
| Under 35 Years | 28 | 51.8% |
| 35 to 44 Years | 1 | 1.8% |
| 45 to 54 Years | 6 | 11.1% |
| 55 to 64 Years | 13 | 24.1% |
| 65 to 74 Years | 4 | 7.4% |
| 75 to 84 Years | 1 | 1.8% |
| 85 Years and Over | 1 | 1.8% |
| Total | 54 | 100.0% |
Housing Finances in Weskan
Median Income by Occupancy in Weskan
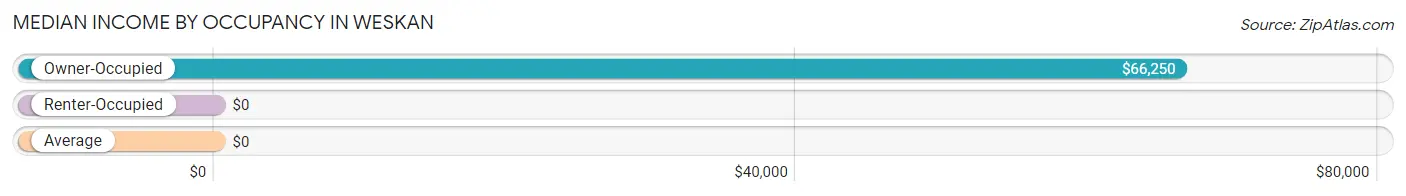
| Occupancy Type | # Households | Median Income |
| Owner-Occupied | 24 (44.4%) | $66,250 |
| Renter-Occupied | 30 (55.6%) | $0 |
| Average | 54 (100.0%) | $0 |
Occupancy by Householder Income Bracket in Weskan
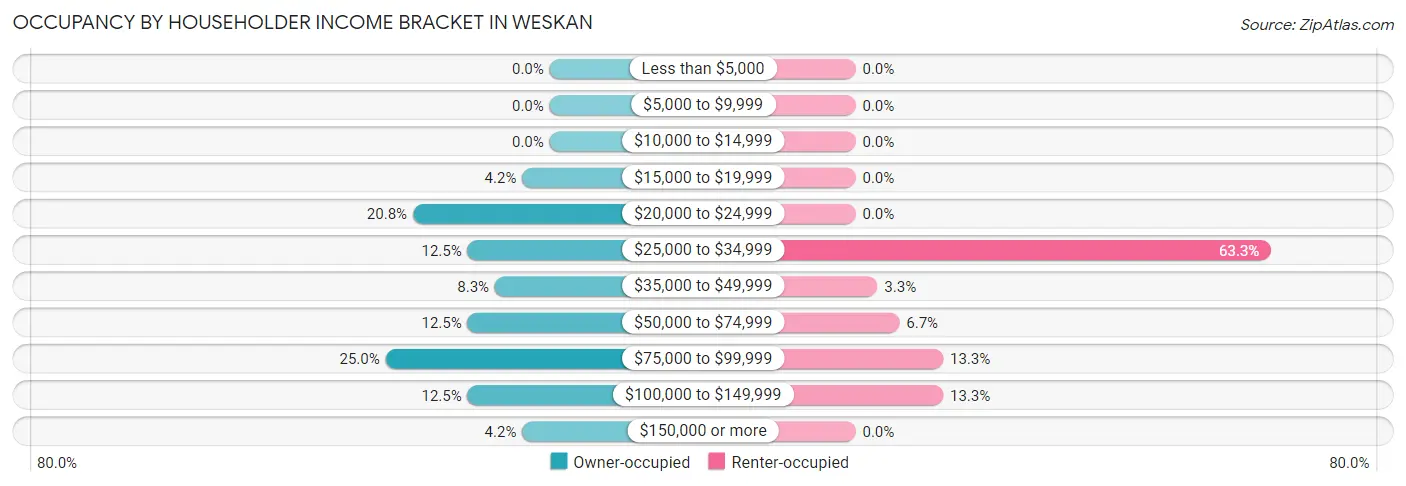
| Income Bracket | Owner-occupied | Renter-occupied |
| Less than $5,000 | 0 (0.0%) | 0 (0.0%) |
| $5,000 to $9,999 | 0 (0.0%) | 0 (0.0%) |
| $10,000 to $14,999 | 0 (0.0%) | 0 (0.0%) |
| $15,000 to $19,999 | 1 (4.2%) | 0 (0.0%) |
| $20,000 to $24,999 | 5 (20.8%) | 0 (0.0%) |
| $25,000 to $34,999 | 3 (12.5%) | 19 (63.3%) |
| $35,000 to $49,999 | 2 (8.3%) | 1 (3.3%) |
| $50,000 to $74,999 | 3 (12.5%) | 2 (6.7%) |
| $75,000 to $99,999 | 6 (25.0%) | 4 (13.3%) |
| $100,000 to $149,999 | 3 (12.5%) | 4 (13.3%) |
| $150,000 or more | 1 (4.2%) | 0 (0.0%) |
| Total | 24 (100.0%) | 30 (100.0%) |
Monthly Housing Cost Tiers in Weskan
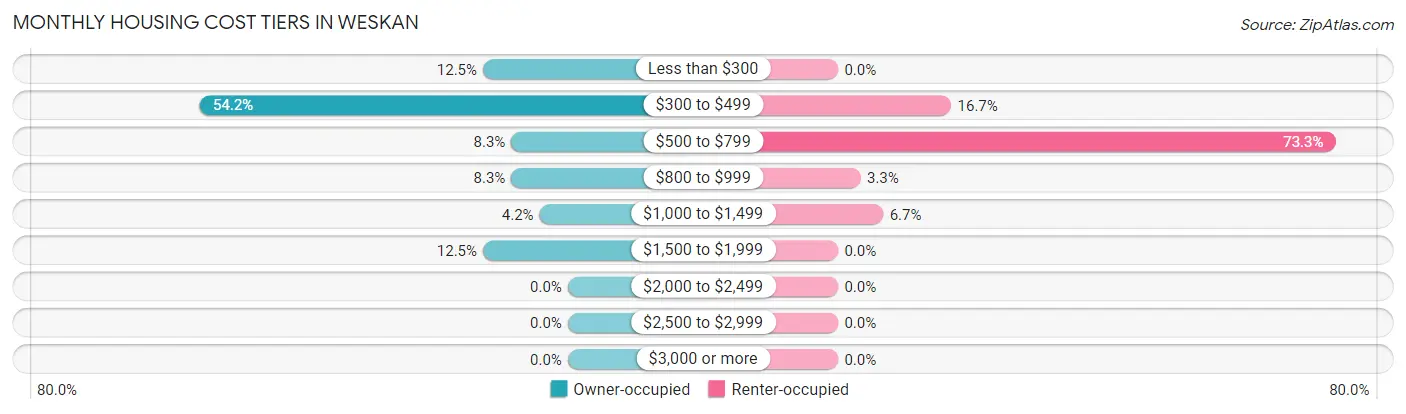
| Monthly Cost | Owner-occupied | Renter-occupied |
| Less than $300 | 3 (12.5%) | 0 (0.0%) |
| $300 to $499 | 13 (54.2%) | 5 (16.7%) |
| $500 to $799 | 2 (8.3%) | 22 (73.3%) |
| $800 to $999 | 2 (8.3%) | 1 (3.3%) |
| $1,000 to $1,499 | 1 (4.2%) | 2 (6.7%) |
| $1,500 to $1,999 | 3 (12.5%) | 0 (0.0%) |
| $2,000 to $2,499 | 0 (0.0%) | 0 (0.0%) |
| $2,500 to $2,999 | 0 (0.0%) | 0 (0.0%) |
| $3,000 or more | 0 (0.0%) | 0 (0.0%) |
| Total | 24 (100.0%) | 30 (100.0%) |
Physical Housing Characteristics in Weskan
Housing Structures in Weskan
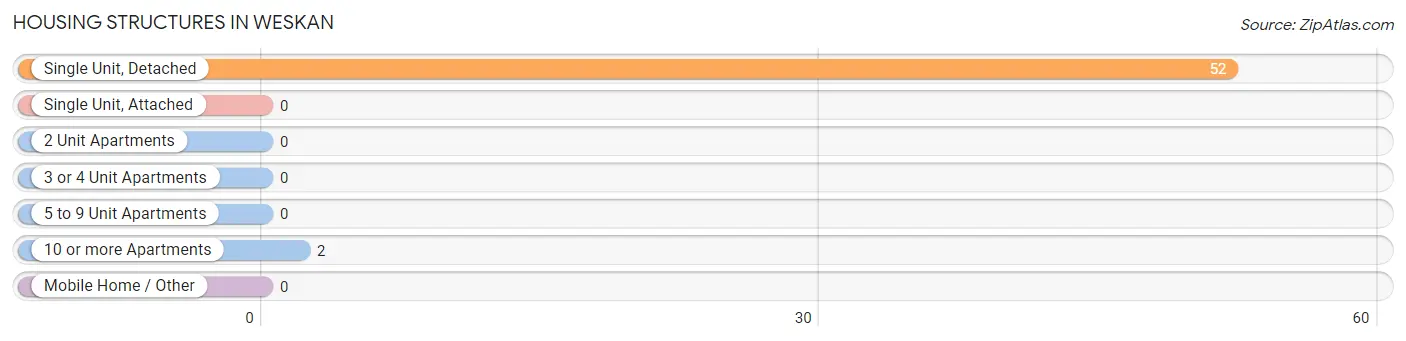
| Structure Type | # Housing Units | % Housing Units |
| Single Unit, Detached | 52 | 96.3% |
| Single Unit, Attached | 0 | 0.0% |
| 2 Unit Apartments | 0 | 0.0% |
| 3 or 4 Unit Apartments | 0 | 0.0% |
| 5 to 9 Unit Apartments | 0 | 0.0% |
| 10 or more Apartments | 2 | 3.7% |
| Mobile Home / Other | 0 | 0.0% |
| Total | 54 | 100.0% |
Housing Structures by Occupancy in Weskan
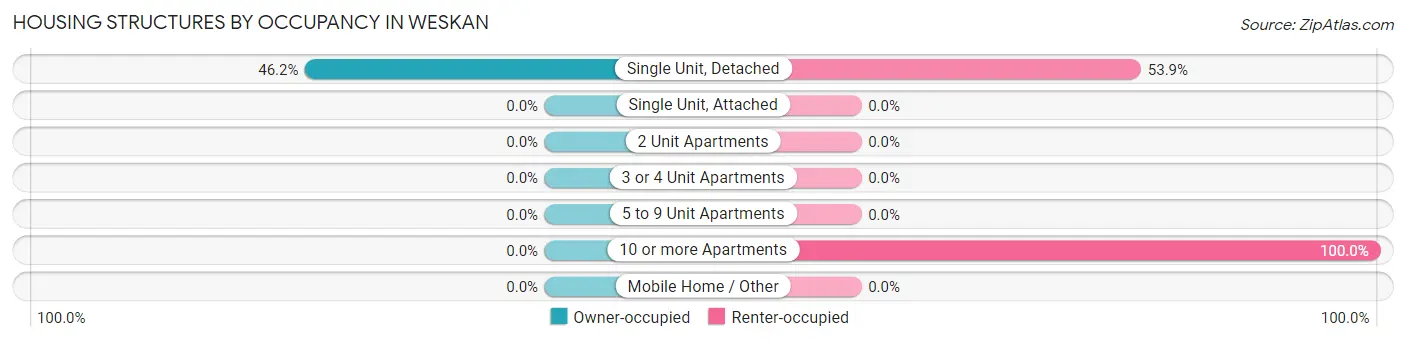
| Structure Type | Owner-occupied | Renter-occupied |
| Single Unit, Detached | 24 (46.2%) | 28 (53.8%) |
| Single Unit, Attached | 0 (0.0%) | 0 (0.0%) |
| 2 Unit Apartments | 0 (0.0%) | 0 (0.0%) |
| 3 or 4 Unit Apartments | 0 (0.0%) | 0 (0.0%) |
| 5 to 9 Unit Apartments | 0 (0.0%) | 0 (0.0%) |
| 10 or more Apartments | 0 (0.0%) | 2 (100.0%) |
| Mobile Home / Other | 0 (0.0%) | 0 (0.0%) |
| Total | 24 (44.4%) | 30 (55.6%) |
Housing Structures by Number of Rooms in Weskan
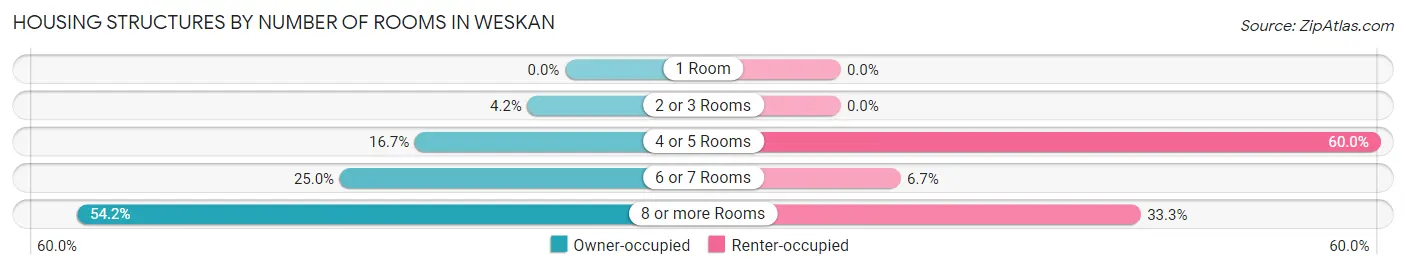
| Number of Rooms | Owner-occupied | Renter-occupied |
| 1 Room | 0 (0.0%) | 0 (0.0%) |
| 2 or 3 Rooms | 1 (4.2%) | 0 (0.0%) |
| 4 or 5 Rooms | 4 (16.7%) | 18 (60.0%) |
| 6 or 7 Rooms | 6 (25.0%) | 2 (6.7%) |
| 8 or more Rooms | 13 (54.2%) | 10 (33.3%) |
| Total | 24 (100.0%) | 30 (100.0%) |
Housing Structure by Heating Type in Weskan
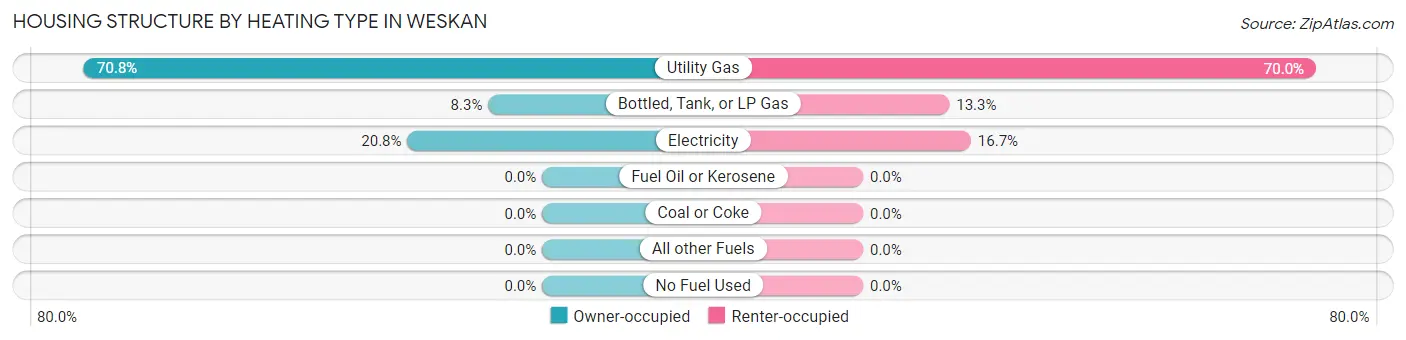
| Heating Type | Owner-occupied | Renter-occupied |
| Utility Gas | 17 (70.8%) | 21 (70.0%) |
| Bottled, Tank, or LP Gas | 2 (8.3%) | 4 (13.3%) |
| Electricity | 5 (20.8%) | 5 (16.7%) |
| Fuel Oil or Kerosene | 0 (0.0%) | 0 (0.0%) |
| Coal or Coke | 0 (0.0%) | 0 (0.0%) |
| All other Fuels | 0 (0.0%) | 0 (0.0%) |
| No Fuel Used | 0 (0.0%) | 0 (0.0%) |
| Total | 24 (100.0%) | 30 (100.0%) |
Household Vehicle Usage in Weskan
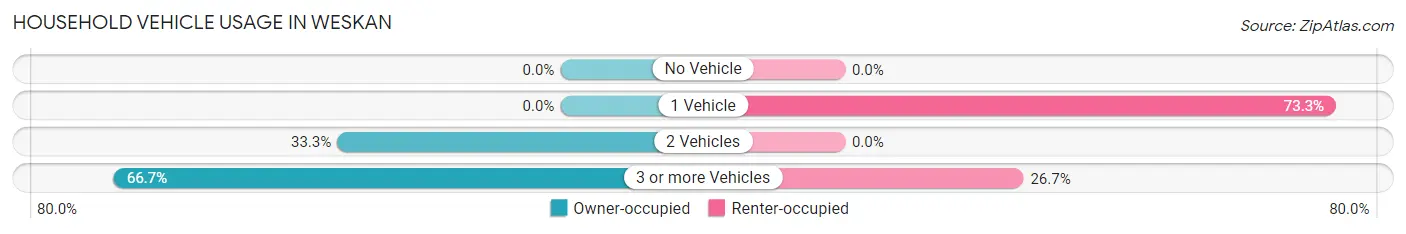
| Vehicles per Household | Owner-occupied | Renter-occupied |
| No Vehicle | 0 (0.0%) | 0 (0.0%) |
| 1 Vehicle | 0 (0.0%) | 22 (73.3%) |
| 2 Vehicles | 8 (33.3%) | 0 (0.0%) |
| 3 or more Vehicles | 16 (66.7%) | 8 (26.7%) |
| Total | 24 (100.0%) | 30 (100.0%) |
Real Estate & Mortgages in Weskan
Real Estate and Mortgage Overview in Weskan
| Characteristic | Without Mortgage | With Mortgage |
| Housing Units | 18 | 6 |
| Median Property Value | $92,200 | $137,500 |
| Median Household Income | - | - |
| Monthly Housing Costs | $436 | $0 |
| Real Estate Taxes | $1,308 | $0 |
Property Value by Mortgage Status in Weskan
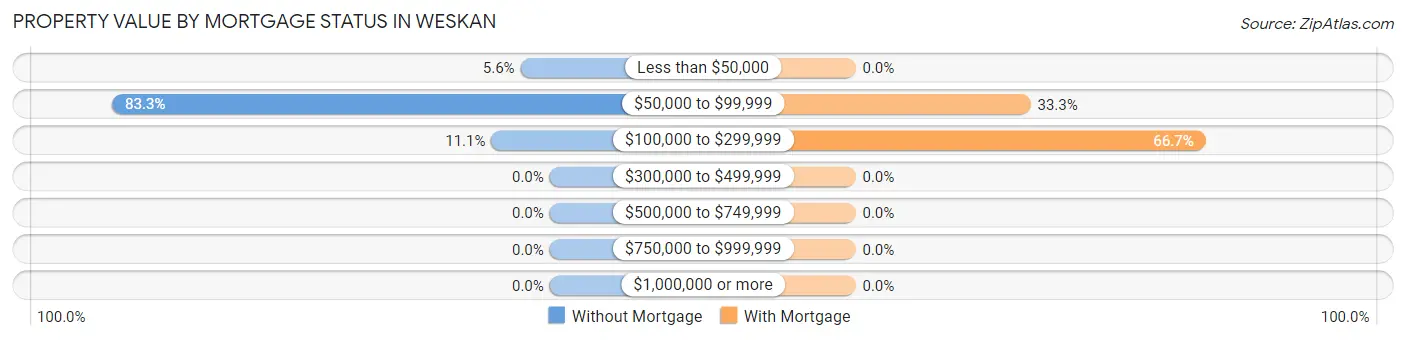
| Property Value | Without Mortgage | With Mortgage |
| Less than $50,000 | 1 (5.6%) | 0 (0.0%) |
| $50,000 to $99,999 | 15 (83.3%) | 2 (33.3%) |
| $100,000 to $299,999 | 2 (11.1%) | 4 (66.7%) |
| $300,000 to $499,999 | 0 (0.0%) | 0 (0.0%) |
| $500,000 to $749,999 | 0 (0.0%) | 0 (0.0%) |
| $750,000 to $999,999 | 0 (0.0%) | 0 (0.0%) |
| $1,000,000 or more | 0 (0.0%) | 0 (0.0%) |
| Total | 18 (100.0%) | 6 (100.0%) |
Household Income by Mortgage Status in Weskan
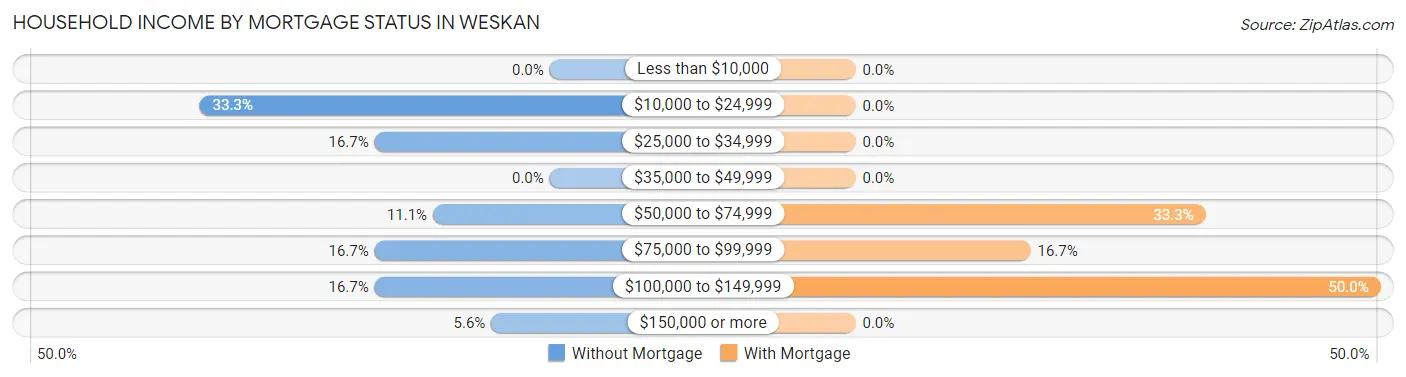
| Household Income | Without Mortgage | With Mortgage |
| Less than $10,000 | 0 (0.0%) | 0 (0.0%) |
| $10,000 to $24,999 | 6 (33.3%) | 0 (0.0%) |
| $25,000 to $34,999 | 3 (16.7%) | 0 (0.0%) |
| $35,000 to $49,999 | 0 (0.0%) | 0 (0.0%) |
| $50,000 to $74,999 | 2 (11.1%) | 2 (33.3%) |
| $75,000 to $99,999 | 3 (16.7%) | 1 (16.7%) |
| $100,000 to $149,999 | 3 (16.7%) | 3 (50.0%) |
| $150,000 or more | 1 (5.6%) | 0 (0.0%) |
| Total | 18 (100.0%) | 6 (100.0%) |
Property Value to Household Income Ratio in Weskan
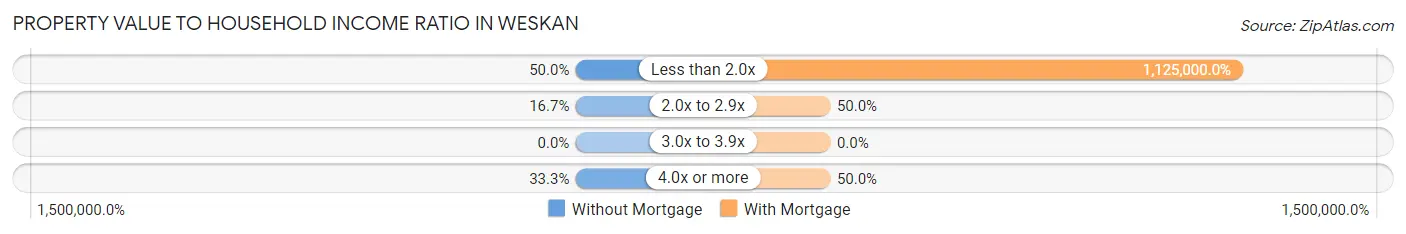
| Value-to-Income Ratio | Without Mortgage | With Mortgage |
| Less than 2.0x | 9 (50.0%) | 67,500 (1,125,000.0%) |
| 2.0x to 2.9x | 3 (16.7%) | 3 (50.0%) |
| 3.0x to 3.9x | 0 (0.0%) | 0 (0.0%) |
| 4.0x or more | 6 (33.3%) | 3 (50.0%) |
| Total | 18 (100.0%) | 6 (100.0%) |
Real Estate Taxes by Mortgage Status in Weskan
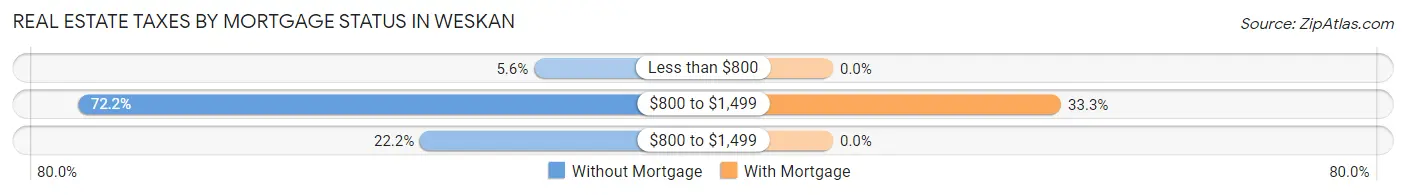
| Property Taxes | Without Mortgage | With Mortgage |
| Less than $800 | 1 (5.6%) | 0 (0.0%) |
| $800 to $1,499 | 13 (72.2%) | 2 (33.3%) |
| $800 to $1,499 | 4 (22.2%) | 0 (0.0%) |
| Total | 18 (100.0%) | 6 (100.0%) |
Health & Disability in Weskan
Health Insurance Coverage by Age in Weskan
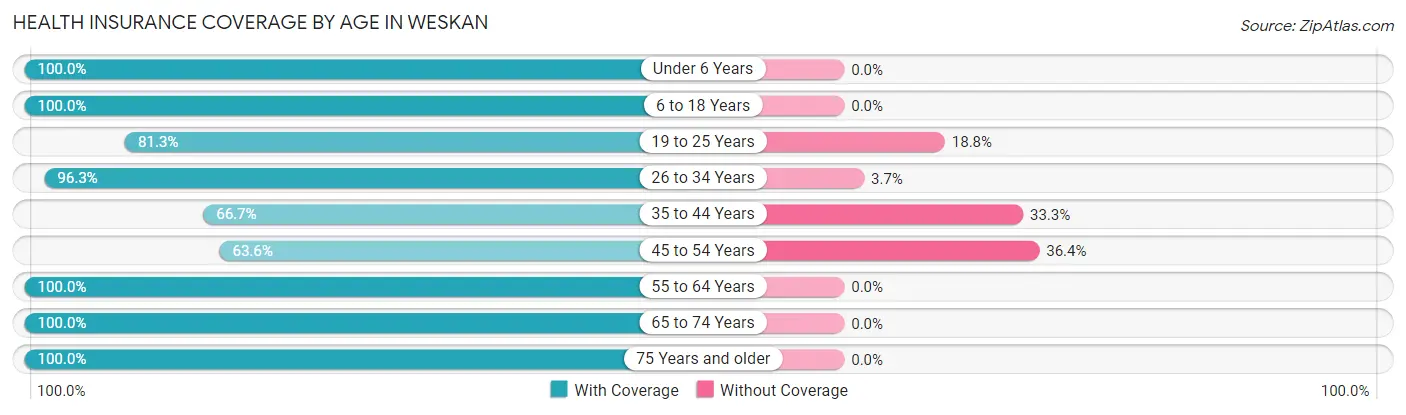
| Age Bracket | With Coverage | Without Coverage |
| Under 6 Years | 20 (100.0%) | 0 (0.0%) |
| 6 to 18 Years | 10 (100.0%) | 0 (0.0%) |
| 19 to 25 Years | 13 (81.2%) | 3 (18.8%) |
| 26 to 34 Years | 26 (96.3%) | 1 (3.7%) |
| 35 to 44 Years | 2 (66.7%) | 1 (33.3%) |
| 45 to 54 Years | 7 (63.6%) | 4 (36.4%) |
| 55 to 64 Years | 24 (100.0%) | 0 (0.0%) |
| 65 to 74 Years | 8 (100.0%) | 0 (0.0%) |
| 75 Years and older | 4 (100.0%) | 0 (0.0%) |
| Total | 114 (92.7%) | 9 (7.3%) |
Health Insurance Coverage by Citizenship Status in Weskan
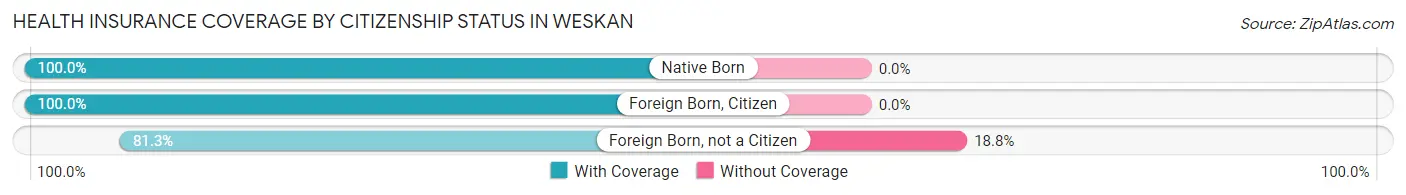
| Citizenship Status | With Coverage | Without Coverage |
| Native Born | 20 (100.0%) | 0 (0.0%) |
| Foreign Born, Citizen | 10 (100.0%) | 0 (0.0%) |
| Foreign Born, not a Citizen | 13 (81.2%) | 3 (18.8%) |
Health Insurance Coverage by Household Income in Weskan
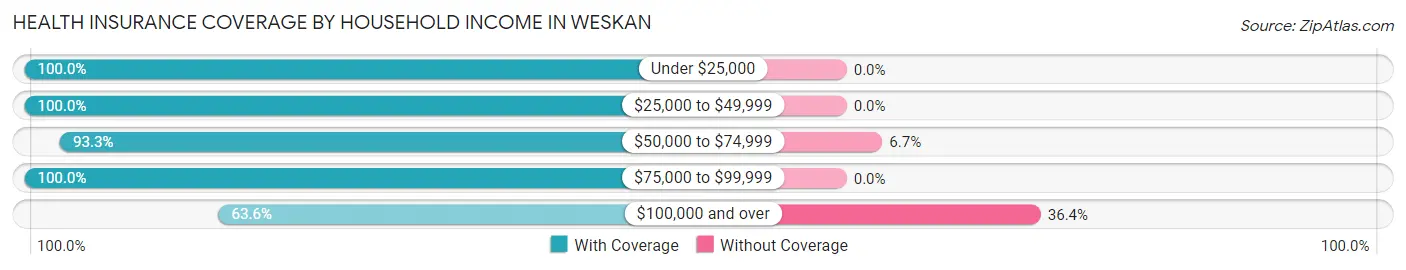
| Household Income | With Coverage | Without Coverage |
| Under $25,000 | 11 (100.0%) | 0 (0.0%) |
| $25,000 to $49,999 | 47 (100.0%) | 0 (0.0%) |
| $50,000 to $74,999 | 14 (93.3%) | 1 (6.7%) |
| $75,000 to $99,999 | 28 (100.0%) | 0 (0.0%) |
| $100,000 and over | 14 (63.6%) | 8 (36.4%) |
Public vs Private Health Insurance Coverage by Age in Weskan
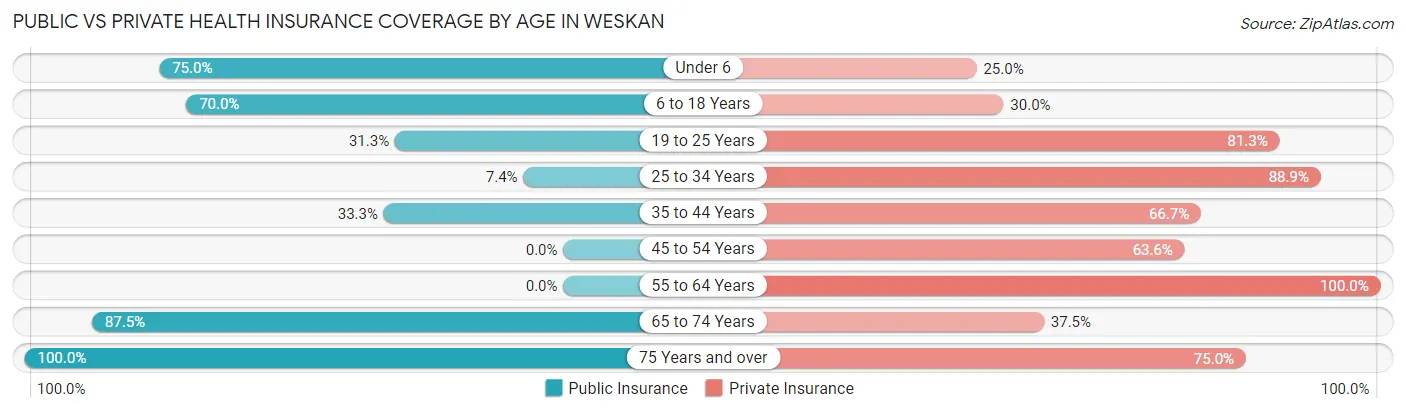
| Age Bracket | Public Insurance | Private Insurance |
| Under 6 | 15 (75.0%) | 5 (25.0%) |
| 6 to 18 Years | 7 (70.0%) | 3 (30.0%) |
| 19 to 25 Years | 5 (31.2%) | 13 (81.2%) |
| 25 to 34 Years | 2 (7.4%) | 24 (88.9%) |
| 35 to 44 Years | 1 (33.3%) | 2 (66.7%) |
| 45 to 54 Years | 0 (0.0%) | 7 (63.6%) |
| 55 to 64 Years | 0 (0.0%) | 24 (100.0%) |
| 65 to 74 Years | 7 (87.5%) | 3 (37.5%) |
| 75 Years and over | 4 (100.0%) | 3 (75.0%) |
| Total | 41 (33.3%) | 84 (68.3%) |
Disability Status by Sex by Age in Weskan
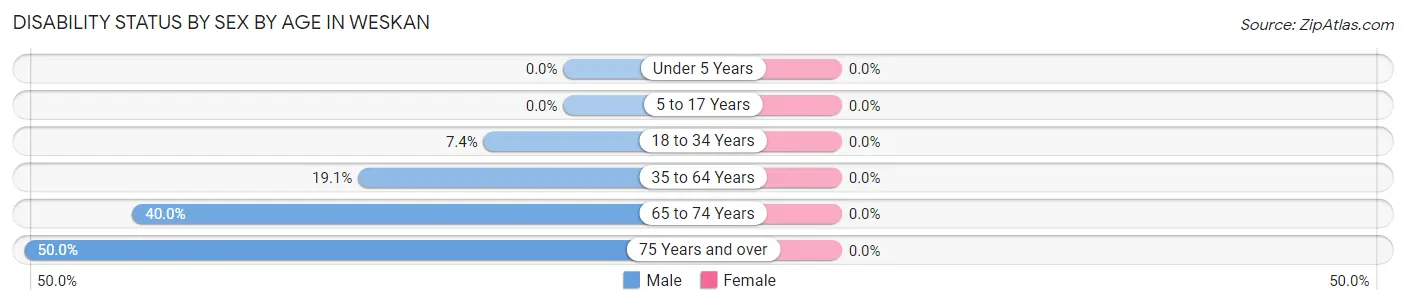
| Age Bracket | Male | Female |
| Under 5 Years | 0 (0.0%) | 0 (0.0%) |
| 5 to 17 Years | 0 (0.0%) | 0 (0.0%) |
| 18 to 34 Years | 2 (7.4%) | 0 (0.0%) |
| 35 to 64 Years | 4 (19.1%) | 0 (0.0%) |
| 65 to 74 Years | 2 (40.0%) | 0 (0.0%) |
| 75 Years and over | 1 (50.0%) | 0 (0.0%) |
Disability Class by Sex by Age in Weskan
Disability Class: Hearing Difficulty
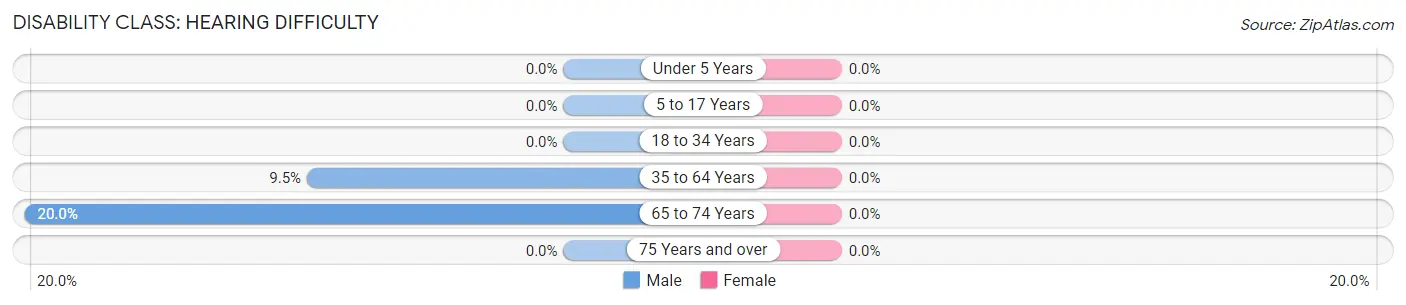
| Age Bracket | Male | Female |
| Under 5 Years | 0 (0.0%) | 0 (0.0%) |
| 5 to 17 Years | 0 (0.0%) | 0 (0.0%) |
| 18 to 34 Years | 0 (0.0%) | 0 (0.0%) |
| 35 to 64 Years | 2 (9.5%) | 0 (0.0%) |
| 65 to 74 Years | 1 (20.0%) | 0 (0.0%) |
| 75 Years and over | 0 (0.0%) | 0 (0.0%) |
Disability Class: Vision Difficulty
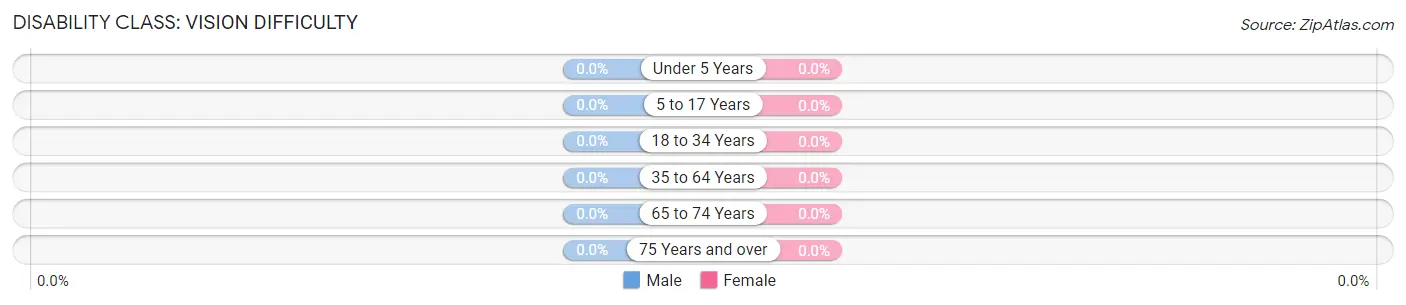
| Age Bracket | Male | Female |
| Under 5 Years | 0 (0.0%) | 0 (0.0%) |
| 5 to 17 Years | 0 (0.0%) | 0 (0.0%) |
| 18 to 34 Years | 0 (0.0%) | 0 (0.0%) |
| 35 to 64 Years | 0 (0.0%) | 0 (0.0%) |
| 65 to 74 Years | 0 (0.0%) | 0 (0.0%) |
| 75 Years and over | 0 (0.0%) | 0 (0.0%) |
Disability Class: Cognitive Difficulty
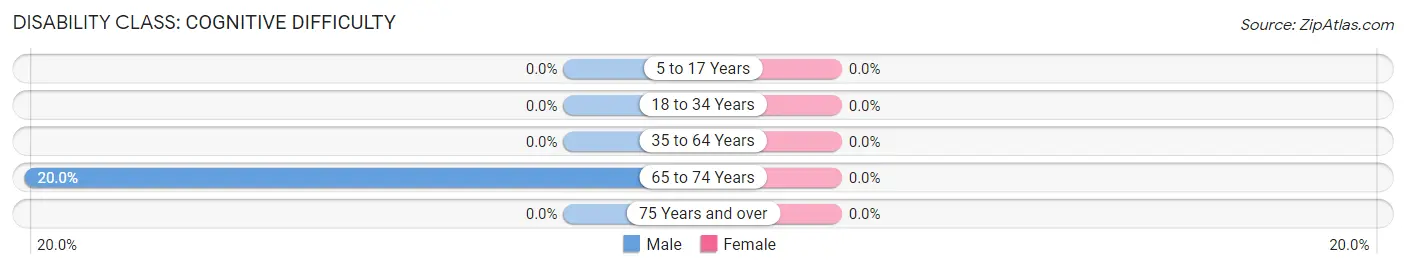
| Age Bracket | Male | Female |
| 5 to 17 Years | 0 (0.0%) | 0 (0.0%) |
| 18 to 34 Years | 0 (0.0%) | 0 (0.0%) |
| 35 to 64 Years | 0 (0.0%) | 0 (0.0%) |
| 65 to 74 Years | 1 (20.0%) | 0 (0.0%) |
| 75 Years and over | 0 (0.0%) | 0 (0.0%) |
Disability Class: Ambulatory Difficulty
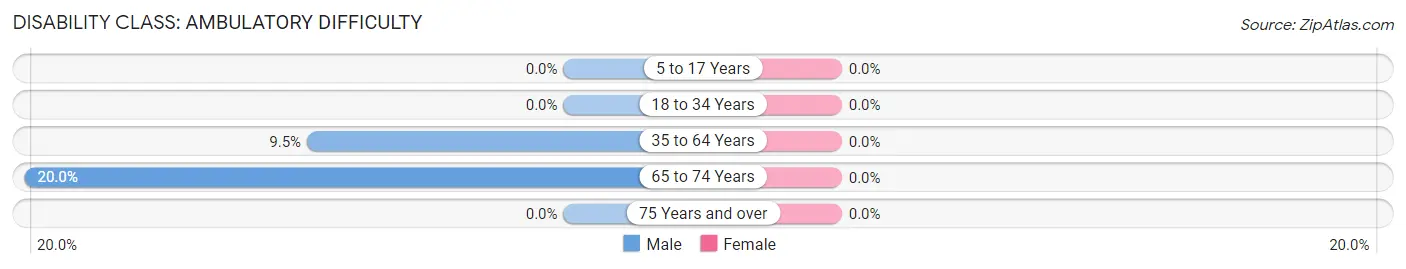
| Age Bracket | Male | Female |
| 5 to 17 Years | 0 (0.0%) | 0 (0.0%) |
| 18 to 34 Years | 0 (0.0%) | 0 (0.0%) |
| 35 to 64 Years | 2 (9.5%) | 0 (0.0%) |
| 65 to 74 Years | 1 (20.0%) | 0 (0.0%) |
| 75 Years and over | 0 (0.0%) | 0 (0.0%) |
Disability Class: Self-Care Difficulty

| Age Bracket | Male | Female |
| 5 to 17 Years | 0 (0.0%) | 0 (0.0%) |
| 18 to 34 Years | 0 (0.0%) | 0 (0.0%) |
| 35 to 64 Years | 0 (0.0%) | 0 (0.0%) |
| 65 to 74 Years | 1 (20.0%) | 0 (0.0%) |
| 75 Years and over | 0 (0.0%) | 0 (0.0%) |
Technology Access in Weskan
Computing Device Access in Weskan
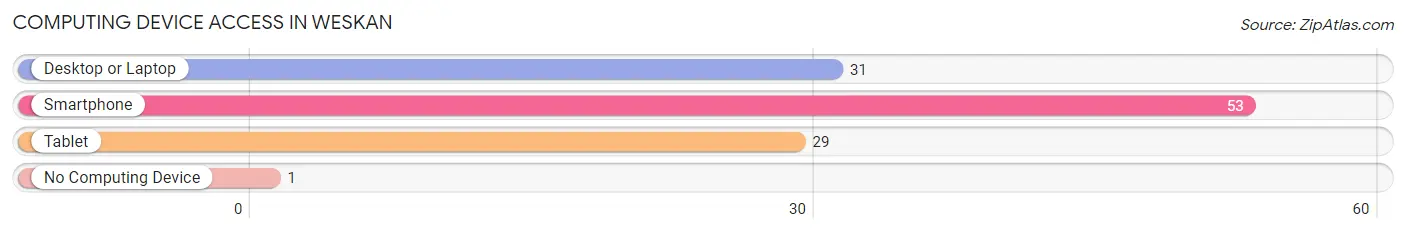
| Device Type | # Households | % Households |
| Desktop or Laptop | 31 | 57.4% |
| Smartphone | 53 | 98.2% |
| Tablet | 29 | 53.7% |
| No Computing Device | 1 | 1.8% |
| Total | 54 | 100.0% |
Internet Access in Weskan
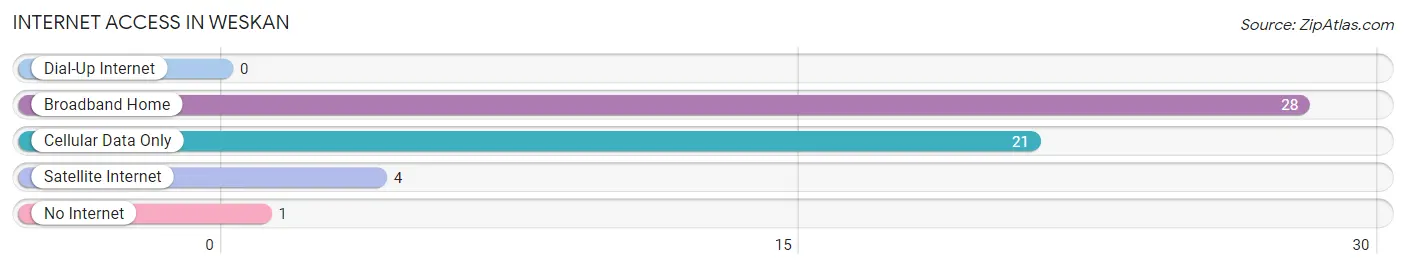
| Internet Type | # Households | % Households |
| Dial-Up Internet | 0 | 0.0% |
| Broadband Home | 28 | 51.8% |
| Cellular Data Only | 21 | 38.9% |
| Satellite Internet | 4 | 7.4% |
| No Internet | 1 | 1.8% |
| Total | 54 | 100.0% |
Weskan Summary
Weskan is a small town located in Wallace County, Kansas, United States. The population was estimated to be around 200 people in 2020. The town is located on the western edge of the state, near the Colorado border.
Geography
Weskan is located at 38°45'17" North, 101°45'17" West (38.754722, -101.754722). It is situated at an elevation of 3,845 feet (1,172 m).
The town is located in the High Plains region of the Great Plains. The area is characterized by flat to rolling terrain, with occasional hills and mesas. The climate is semi-arid, with hot summers and cold winters. The average annual precipitation is about 17 inches (430 mm).
Economy
The economy of Weskan is largely based on agriculture. The town is home to several farms and ranches, which produce wheat, corn, sorghum, and other crops. Cattle and sheep are also raised in the area.
In addition to agriculture, Weskan has a few small businesses, including a grocery store, a hardware store, and a gas station. The town also has a post office and a bank.
Demographics
As of the 2010 census, there were 199 people living in Weskan. The racial makeup of the town was 97.5% White, 0.5% Native American, 0.5% Asian, and 1.5% from two or more races. The median age was 44.2 years.
The median household income was $37,500, and the median family income was $41,250. The per capita income was $17,857. About 11.1% of families and 14.1% of the population were below the poverty line, including 18.2% of those under age 18 and none of those age 65 or over.
Conclusion
Weskan is a small town located in Wallace County, Kansas, United States. The population was estimated to be around 200 people in 2020. The town is located on the western edge of the state, near the Colorado border. The economy of Weskan is largely based on agriculture, with a few small businesses. The racial makeup of the town is predominantly White, with a small percentage of Native American and Asian residents. The median household income is $37,500, and the median family income is $41,250. About 11.1% of families and 14.1% of the population are below the poverty line.
Common Questions
What is Per Capita Income in Weskan?
Per Capita income in Weskan is $25,445.
What is the Median Family Income in Weskan?
Median Family Income in Weskan is $62,500.
What is Income or Wage Gap in Weskan?
Income or Wage Gap in Weskan is 3.8%.
Women in Weskan earn 96.2 cents for every dollar earned by a man.
What is Inequality or Gini Index in Weskan?
Inequality or Gini Index in Weskan is 0.34.
What is the Total Population of Weskan?
Total Population of Weskan is 123.
What is the Total Male Population of Weskan?
Total Male Population of Weskan is 67.
What is the Total Female Population of Weskan?
Total Female Population of Weskan is 56.
What is the Ratio of Males per 100 Females in Weskan?
There are 119.64 Males per 100 Females in Weskan.
What is the Ratio of Females per 100 Males in Weskan?
There are 83.58 Females per 100 Males in Weskan.
What is the Median Population Age in Weskan?
Median Population Age in Weskan is 30.5 Years.
What is the Average Family Size in Weskan
Average Family Size in Weskan is 2.8 People.
What is the Average Household Size in Weskan
Average Household Size in Weskan is 2.3 People.
How Large is the Labor Force in Weskan?
There are 78 People in the Labor Forcein in Weskan.
What is the Percentage of People in the Labor Force in Weskan?
83.9% of People are in the Labor Force in Weskan.