Victoria, KS Map & Demographics
Victoria Map
Victoria Overview
$36,548
PER CAPITA INCOME
$90,278
AVG FAMILY INCOME
$73,851
AVG HOUSEHOLD INCOME
28.2%
WAGE / INCOME GAP [ % ]
71.8¢/ $1
WAGE / INCOME GAP [ $ ]
$6,033
FAMILY INCOME DEFICIT
0.36
INEQUALITY / GINI INDEX
1,027
TOTAL POPULATION
514
MALE POPULATION
513
FEMALE POPULATION
100.19
MALES / 100 FEMALES
99.81
FEMALES / 100 MALES
38.5
MEDIAN AGE
2.7
AVG FAMILY SIZE
2.1
AVG HOUSEHOLD SIZE
652
LABOR FORCE [ PEOPLE ]
77.5%
PERCENT IN LABOR FORCE
1.7%
UNEMPLOYMENT RATE
Victoria Zip Codes
Victoria Area Codes
Income in Victoria
Income Overview in Victoria
Per Capita Income in Victoria is $36,548, while median incomes of families and households are $90,278 and $73,851 respectively.
| Characteristic | Number | Measure |
| Per Capita Income | 1,027 | $36,548 |
| Median Family Income | 300 | $90,278 |
| Mean Family Income | 300 | $97,998 |
| Median Household Income | 478 | $73,851 |
| Mean Household Income | 478 | $80,284 |
| Income Deficit | 300 | $6,033 |
| Wage / Income Gap (%) | 1,027 | 28.16% |
| Wage / Income Gap ($) | 1,027 | 71.84¢ per $1 |
| Gini / Inequality Index | 1,027 | 0.36 |
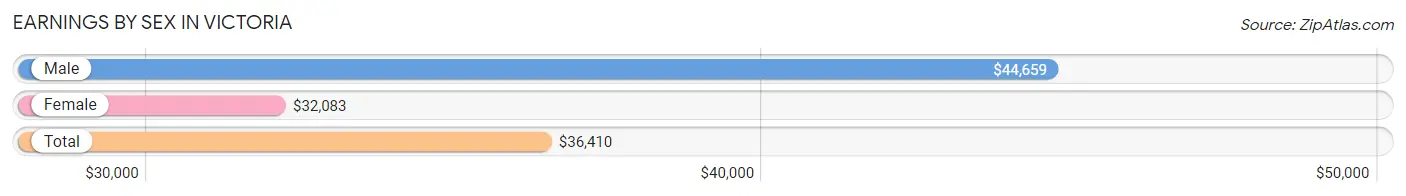
Earnings by Sex in Victoria
Average Earnings in Victoria are $36,410, $44,659 for men and $32,083 for women, a difference of 28.2%.
| Sex | Number | Average Earnings |
| Male | 379 (53.2%) | $44,659 |
| Female | 334 (46.8%) | $32,083 |
| Total | 713 (100.0%) | $36,410 |
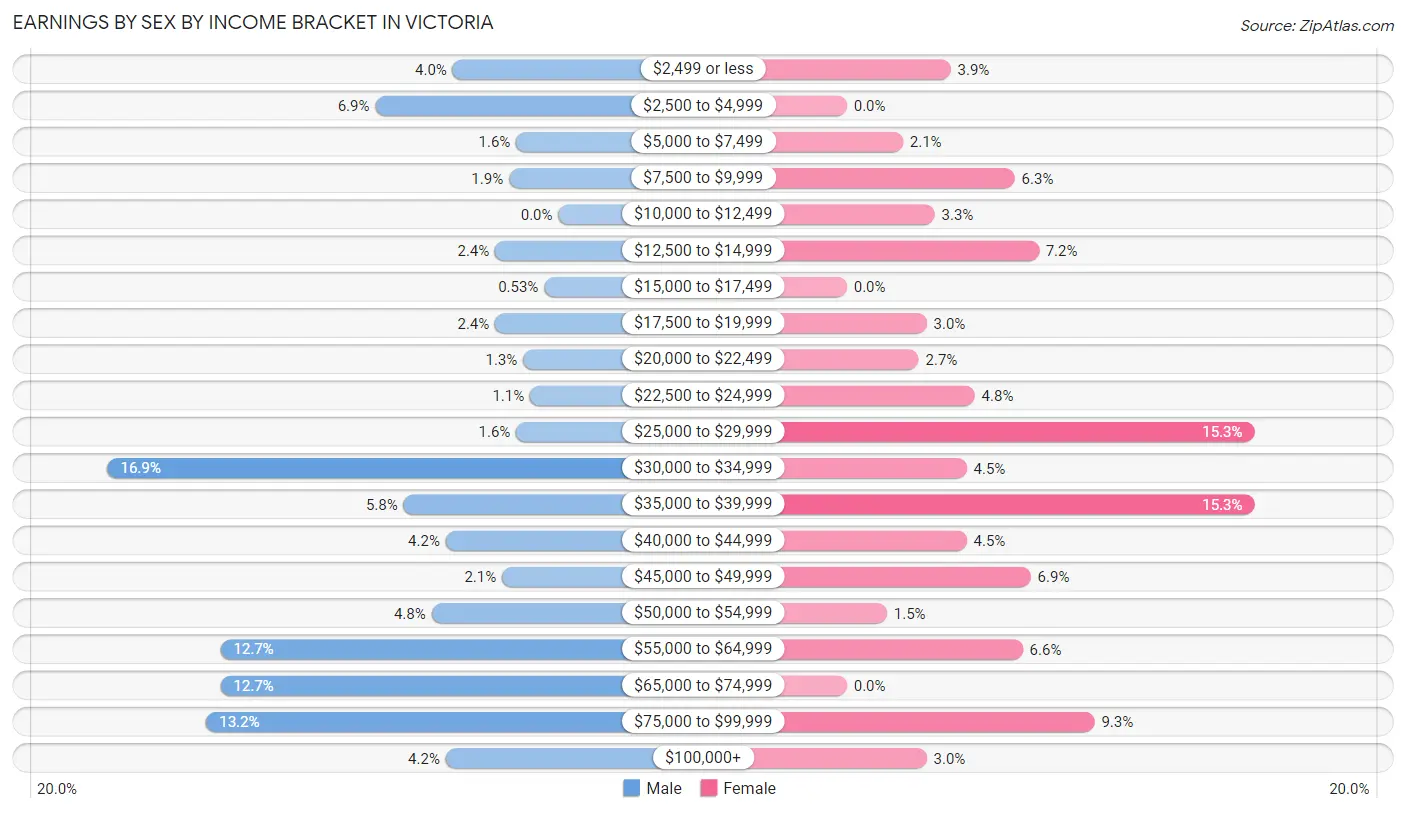
Earnings by Sex by Income Bracket in Victoria
The most common earnings brackets in Victoria are $30,000 to $34,999 for men (64 | 16.9%) and $25,000 to $29,999 for women (51 | 15.3%).
| Income | Male | Female |
| $2,499 or less | 15 (4.0%) | 13 (3.9%) |
| $2,500 to $4,999 | 26 (6.9%) | 0 (0.0%) |
| $5,000 to $7,499 | 6 (1.6%) | 7 (2.1%) |
| $7,500 to $9,999 | 7 (1.8%) | 21 (6.3%) |
| $10,000 to $12,499 | 0 (0.0%) | 11 (3.3%) |
| $12,500 to $14,999 | 9 (2.4%) | 24 (7.2%) |
| $15,000 to $17,499 | 2 (0.5%) | 0 (0.0%) |
| $17,500 to $19,999 | 9 (2.4%) | 10 (3.0%) |
| $20,000 to $22,499 | 5 (1.3%) | 9 (2.7%) |
| $22,500 to $24,999 | 4 (1.1%) | 16 (4.8%) |
| $25,000 to $29,999 | 6 (1.6%) | 51 (15.3%) |
| $30,000 to $34,999 | 64 (16.9%) | 15 (4.5%) |
| $35,000 to $39,999 | 22 (5.8%) | 51 (15.3%) |
| $40,000 to $44,999 | 16 (4.2%) | 15 (4.5%) |
| $45,000 to $49,999 | 8 (2.1%) | 23 (6.9%) |
| $50,000 to $54,999 | 18 (4.8%) | 5 (1.5%) |
| $55,000 to $64,999 | 48 (12.7%) | 22 (6.6%) |
| $65,000 to $74,999 | 48 (12.7%) | 0 (0.0%) |
| $75,000 to $99,999 | 50 (13.2%) | 31 (9.3%) |
| $100,000+ | 16 (4.2%) | 10 (3.0%) |
| Total | 379 (100.0%) | 334 (100.0%) |
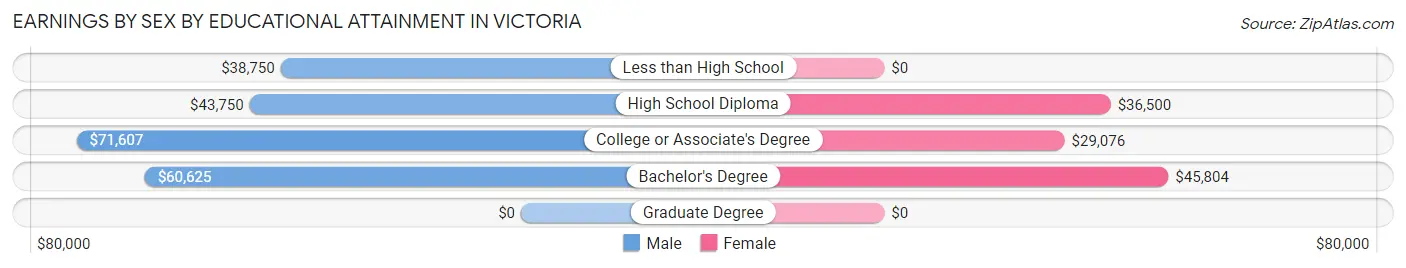
Earnings by Sex by Educational Attainment in Victoria
Average earnings in Victoria are $53,750 for men and $31,875 for women, a difference of 40.7%. Men with an educational attainment of college or associate's degree enjoy the highest average annual earnings of $71,607, while those with less than high school education earn the least with $38,750. Women with an educational attainment of bachelor's degree earn the most with the average annual earnings of $45,804, while those with college or associate's degree education have the smallest earnings of $29,076.
| Educational Attainment | Male Income | Female Income |
| Less than High School | $38,750 | $0 |
| High School Diploma | $43,750 | $36,500 |
| College or Associate's Degree | $71,607 | $29,076 |
| Bachelor's Degree | $60,625 | $45,804 |
| Graduate Degree | - | - |
| Total | $53,750 | $31,875 |
Family Income in Victoria
Family Income Brackets in Victoria
According to the Victoria family income data, there are 83 families falling into the $75,000 to $99,999 income range, which is the most common income bracket and makes up 27.7% of all families. Conversely, the less than $10,000 income bracket is the least frequent group with only 2 families (0.7%) belonging to this category.
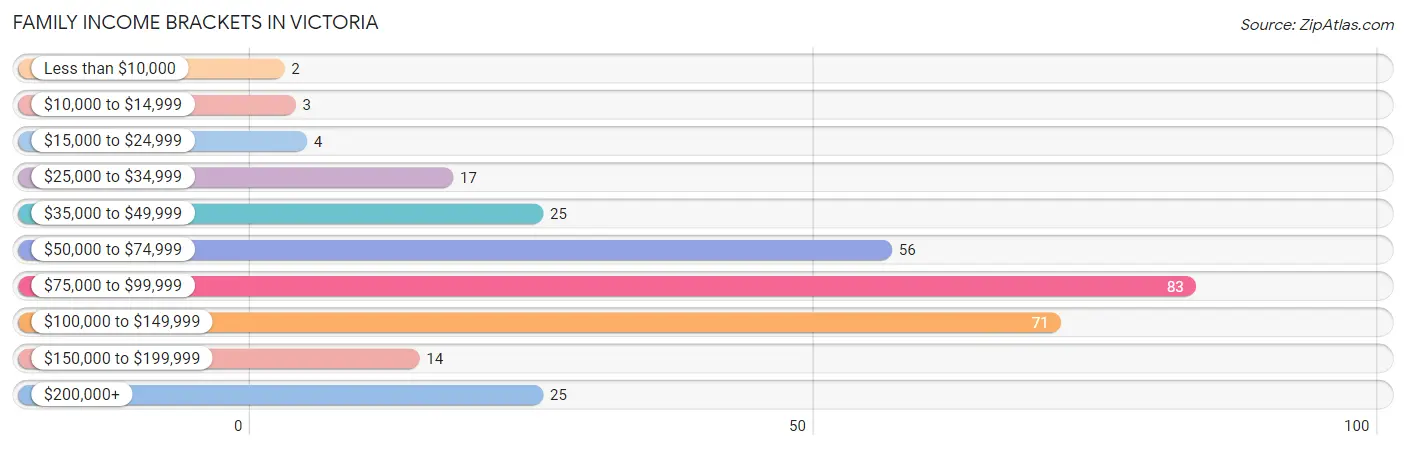
| Income Bracket | # Families | % Families |
| Less than $10,000 | 2 | 0.7% |
| $10,000 to $14,999 | 3 | 1.0% |
| $15,000 to $24,999 | 4 | 1.3% |
| $25,000 to $34,999 | 17 | 5.7% |
| $35,000 to $49,999 | 25 | 8.3% |
| $50,000 to $74,999 | 56 | 18.7% |
| $75,000 to $99,999 | 83 | 27.7% |
| $100,000 to $149,999 | 71 | 23.7% |
| $150,000 to $199,999 | 14 | 4.7% |
| $200,000+ | 25 | 8.3% |
Family Income by Famaliy Size in Victoria
4-person families (37 | 12.3%) account for the highest median family income in Victoria with $118,125 per family, while 2-person families (159 | 53.0%) have the highest median income of $39,018 per family member.
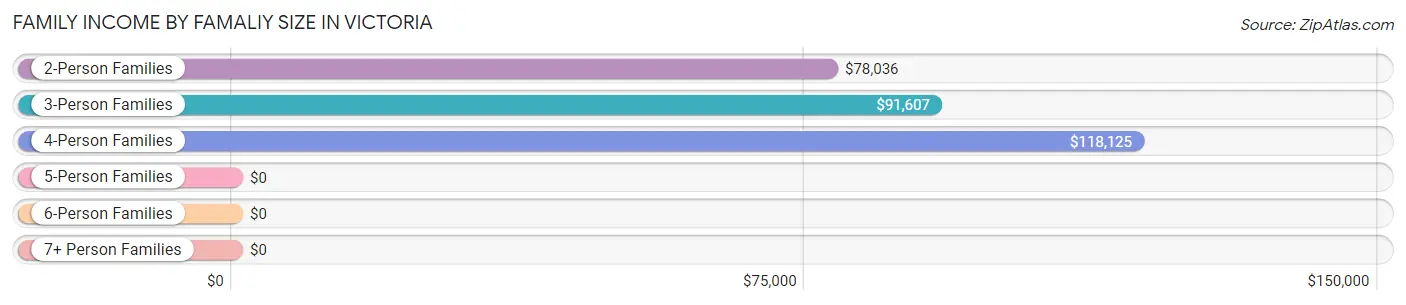
| Income Bracket | # Families | Median Income |
| 2-Person Families | 159 (53.0%) | $78,036 |
| 3-Person Families | 71 (23.7%) | $91,607 |
| 4-Person Families | 37 (12.3%) | $118,125 |
| 5-Person Families | 30 (10.0%) | $0 |
| 6-Person Families | 3 (1.0%) | $0 |
| 7+ Person Families | 0 (0.0%) | $0 |
| Total | 300 (100.0%) | $90,278 |
Family Income by Number of Earners in Victoria
The median family income in Victoria is $90,278, with families comprising 3+ earners (49) having the highest median family income of $132,188, while families with 1 earner (65) have the lowest median family income of $70,250, accounting for 16.3% and 21.7% of families, respectively.
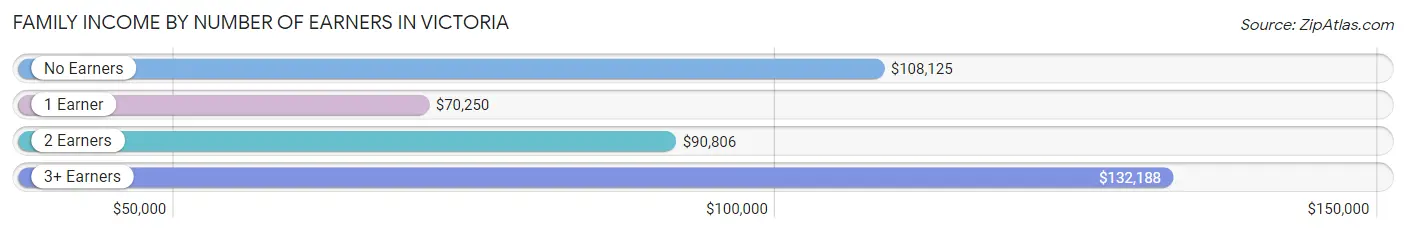
| Number of Earners | # Families | Median Income |
| No Earners | 9 (3.0%) | $108,125 |
| 1 Earner | 65 (21.7%) | $70,250 |
| 2 Earners | 177 (59.0%) | $90,806 |
| 3+ Earners | 49 (16.3%) | $132,188 |
| Total | 300 (100.0%) | $90,278 |
Household Income in Victoria
Household Income Brackets in Victoria
With 108 households falling in the category, the $50,000 to $74,999 income range is the most frequent in Victoria, accounting for 22.6% of all households. In contrast, only 5 households (1.1%) fall into the $10,000 to $14,999 income bracket, making it the least populous group.
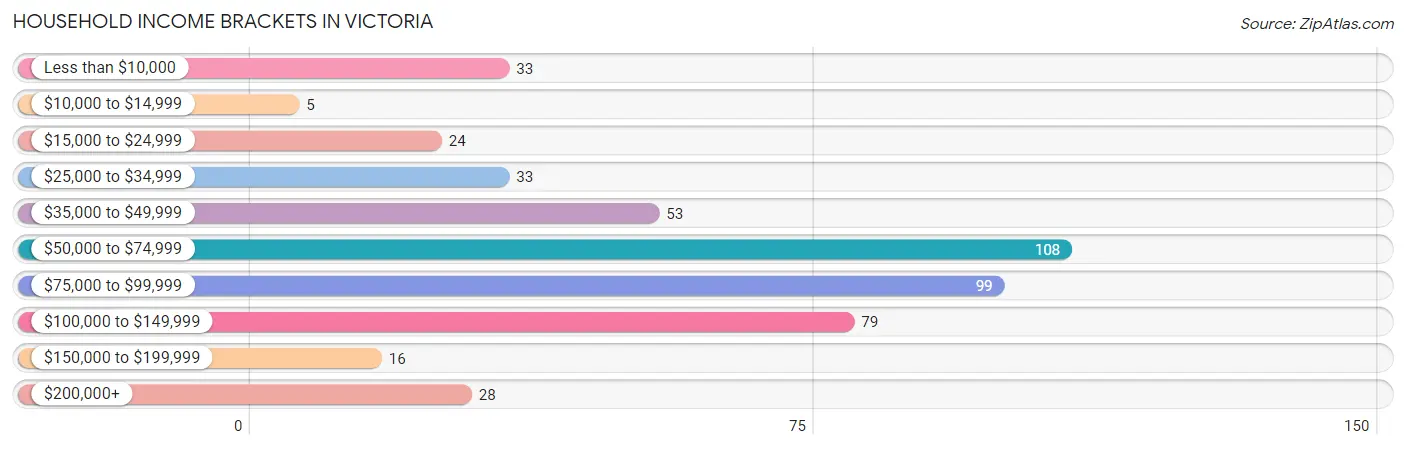
| Income Bracket | # Households | % Households |
| Less than $10,000 | 33 | 6.9% |
| $10,000 to $14,999 | 5 | 1.0% |
| $15,000 to $24,999 | 24 | 5.0% |
| $25,000 to $34,999 | 33 | 6.9% |
| $35,000 to $49,999 | 53 | 11.1% |
| $50,000 to $74,999 | 108 | 22.6% |
| $75,000 to $99,999 | 99 | 20.7% |
| $100,000 to $149,999 | 79 | 16.5% |
| $150,000 to $199,999 | 16 | 3.3% |
| $200,000+ | 28 | 5.9% |
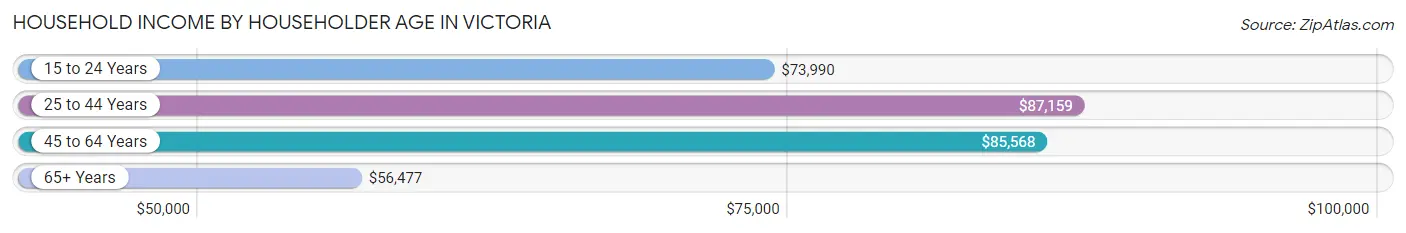
Household Income by Householder Age in Victoria
The median household income in Victoria is $73,851, with the highest median household income of $87,159 found in the 25 to 44 years age bracket for the primary householder. A total of 165 households (34.5%) fall into this category. Meanwhile, the 65+ years age bracket for the primary householder has the lowest median household income of $56,477, with 95 households (19.9%) in this group.
| Income Bracket | # Households | Median Income |
| 15 to 24 Years | 39 (8.2%) | $73,990 |
| 25 to 44 Years | 165 (34.5%) | $87,159 |
| 45 to 64 Years | 179 (37.4%) | $85,568 |
| 65+ Years | 95 (19.9%) | $56,477 |
| Total | 478 (100.0%) | $73,851 |
Poverty in Victoria
Income Below Poverty by Sex and Age in Victoria
With 3.2% poverty level for males and 7.0% for females among the residents of Victoria, 5 year old males and 55 to 64 year old females are the most vulnerable to poverty, with 2 males (28.6%) and 17 females (25.0%) in their respective age groups living below the poverty level.
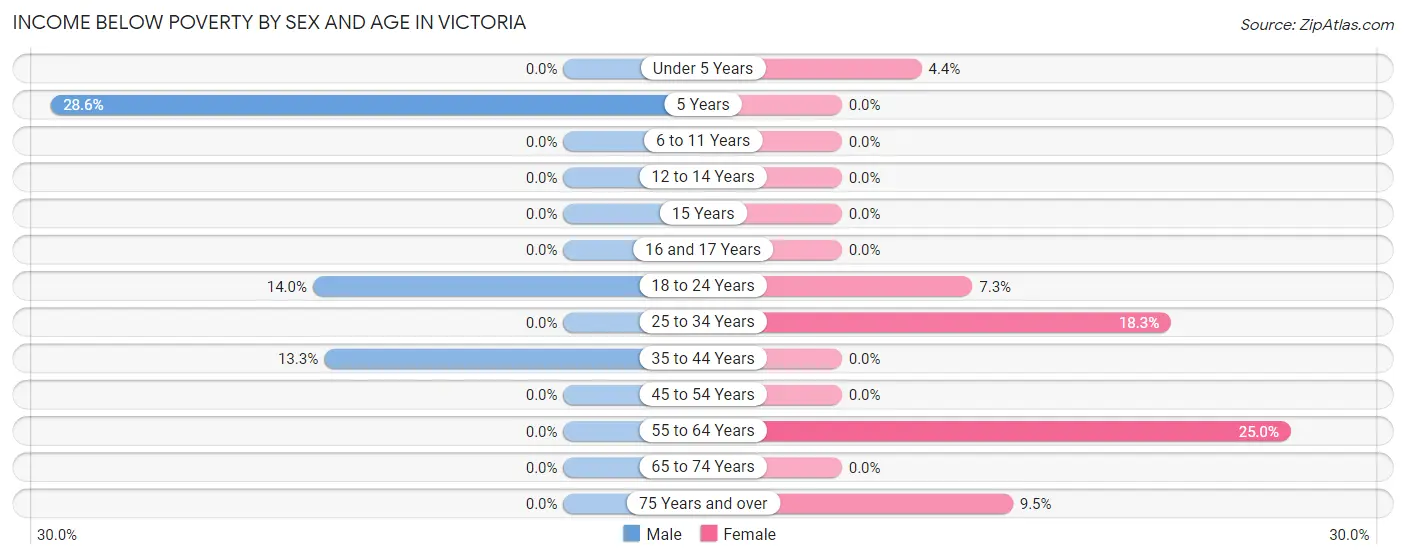
| Age Bracket | Male | Female |
| Under 5 Years | 0 (0.0%) | 2 (4.4%) |
| 5 Years | 2 (28.6%) | 0 (0.0%) |
| 6 to 11 Years | 0 (0.0%) | 0 (0.0%) |
| 12 to 14 Years | 0 (0.0%) | 0 (0.0%) |
| 15 Years | 0 (0.0%) | 0 (0.0%) |
| 16 and 17 Years | 0 (0.0%) | 0 (0.0%) |
| 18 to 24 Years | 6 (14.0%) | 4 (7.3%) |
| 25 to 34 Years | 0 (0.0%) | 11 (18.3%) |
| 35 to 44 Years | 8 (13.3%) | 0 (0.0%) |
| 45 to 54 Years | 0 (0.0%) | 0 (0.0%) |
| 55 to 64 Years | 0 (0.0%) | 17 (25.0%) |
| 65 to 74 Years | 0 (0.0%) | 0 (0.0%) |
| 75 Years and over | 0 (0.0%) | 2 (9.5%) |
| Total | 16 (3.2%) | 36 (7.0%) |
Income Above Poverty by Sex and Age in Victoria
According to the poverty statistics in Victoria, males aged under 5 years and females aged 5 years are the age groups that are most secure financially, with 100.0% of males and 100.0% of females in these age groups living above the poverty line.
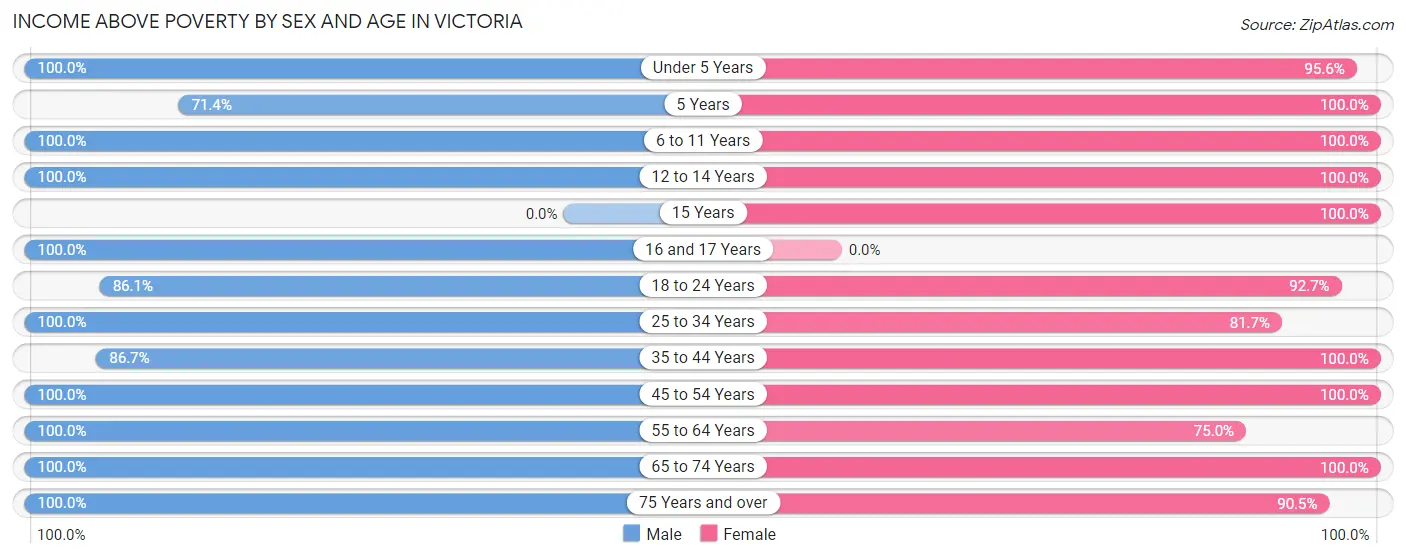
| Age Bracket | Male | Female |
| Under 5 Years | 29 (100.0%) | 43 (95.6%) |
| 5 Years | 5 (71.4%) | 2 (100.0%) |
| 6 to 11 Years | 5 (100.0%) | 41 (100.0%) |
| 12 to 14 Years | 40 (100.0%) | 6 (100.0%) |
| 15 Years | 0 (0.0%) | 11 (100.0%) |
| 16 and 17 Years | 14 (100.0%) | 0 (0.0%) |
| 18 to 24 Years | 37 (86.1%) | 51 (92.7%) |
| 25 to 34 Years | 102 (100.0%) | 49 (81.7%) |
| 35 to 44 Years | 52 (86.7%) | 72 (100.0%) |
| 45 to 54 Years | 72 (100.0%) | 87 (100.0%) |
| 55 to 64 Years | 64 (100.0%) | 51 (75.0%) |
| 65 to 74 Years | 55 (100.0%) | 45 (100.0%) |
| 75 Years and over | 8 (100.0%) | 19 (90.5%) |
| Total | 483 (96.8%) | 477 (93.0%) |
Income Below Poverty Among Married-Couple Families in Victoria
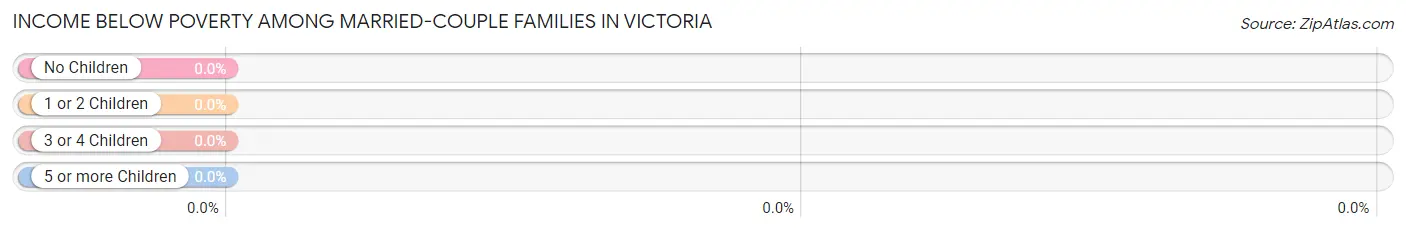
| Children | Above Poverty | Below Poverty |
| No Children | 159 (100.0%) | 0 (0.0%) |
| 1 or 2 Children | 94 (100.0%) | 0 (0.0%) |
| 3 or 4 Children | 11 (100.0%) | 0 (0.0%) |
| 5 or more Children | 0 (0.0%) | 0 (0.0%) |
| Total | 264 (100.0%) | 0 (0.0%) |
Income Below Poverty Among Single-Parent Households in Victoria
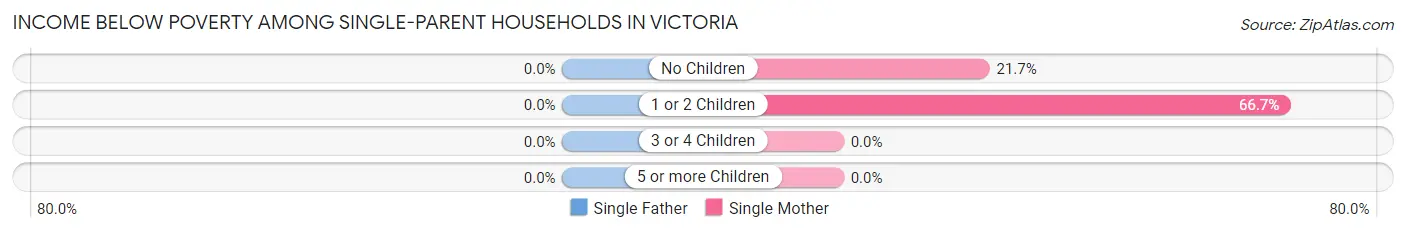
| Children | Single Father | Single Mother |
| No Children | 0 (0.0%) | 5 (21.7%) |
| 1 or 2 Children | 0 (0.0%) | 4 (66.7%) |
| 3 or 4 Children | 0 (0.0%) | 0 (0.0%) |
| 5 or more Children | 0 (0.0%) | 0 (0.0%) |
| Total | 0 (0.0%) | 9 (25.0%) |
Income Below Poverty Among Married-Couple vs Single-Parent Households in Victoria
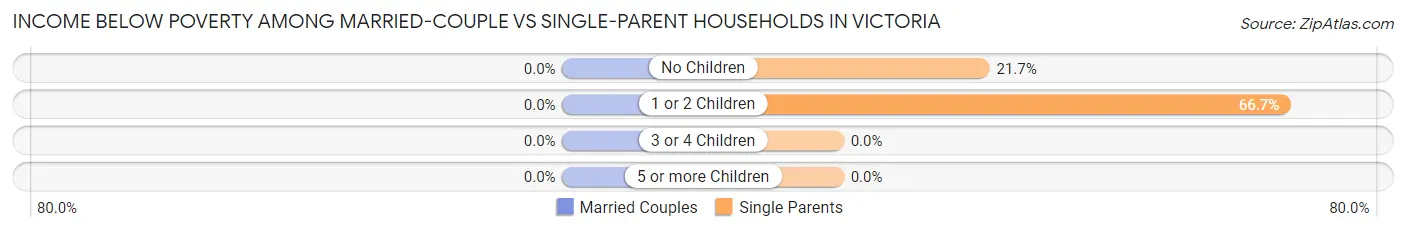
| Children | Married-Couple Families | Single-Parent Households |
| No Children | 0 (0.0%) | 5 (21.7%) |
| 1 or 2 Children | 0 (0.0%) | 4 (66.7%) |
| 3 or 4 Children | 0 (0.0%) | 0 (0.0%) |
| 5 or more Children | 0 (0.0%) | 0 (0.0%) |
| Total | 0 (0.0%) | 9 (25.0%) |
Race in Victoria
The most populous races in Victoria are White / Caucasian (925 | 90.1%), Two or more Races (92 | 9.0%), and Asian (10 | 1.0%).
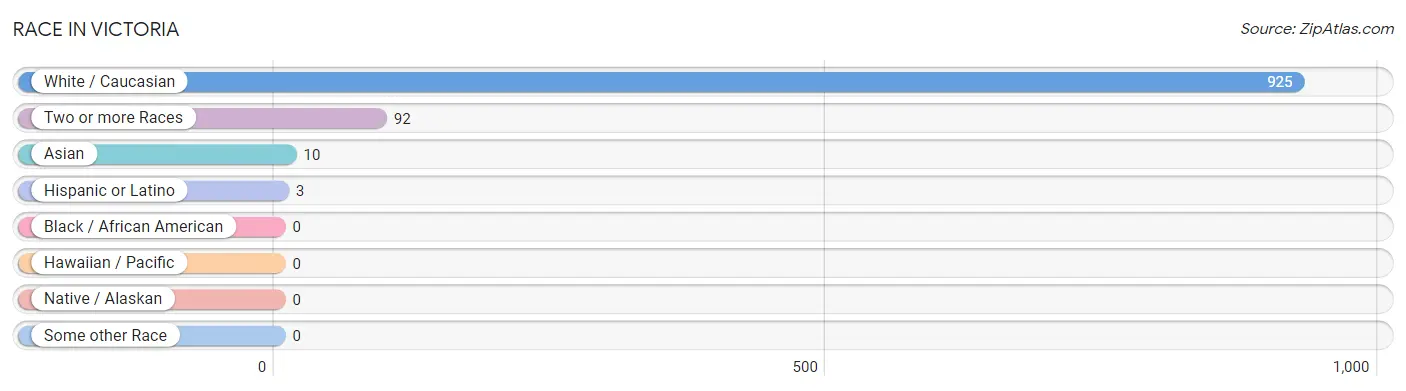
| Race | # Population | % Population |
| Asian | 10 | 1.0% |
| Black / African American | 0 | 0.0% |
| Hawaiian / Pacific | 0 | 0.0% |
| Hispanic or Latino | 3 | 0.3% |
| Native / Alaskan | 0 | 0.0% |
| White / Caucasian | 925 | 90.1% |
| Two or more Races | 92 | 9.0% |
| Some other Race | 0 | 0.0% |
| Total | 1,027 | 100.0% |
Ancestry in Victoria
The most populous ancestries reported in Victoria are German (685 | 66.7%), Irish (105 | 10.2%), English (86 | 8.4%), Russian (28 | 2.7%), and Italian (16 | 1.6%), together accounting for 89.6% of all Victoria residents.
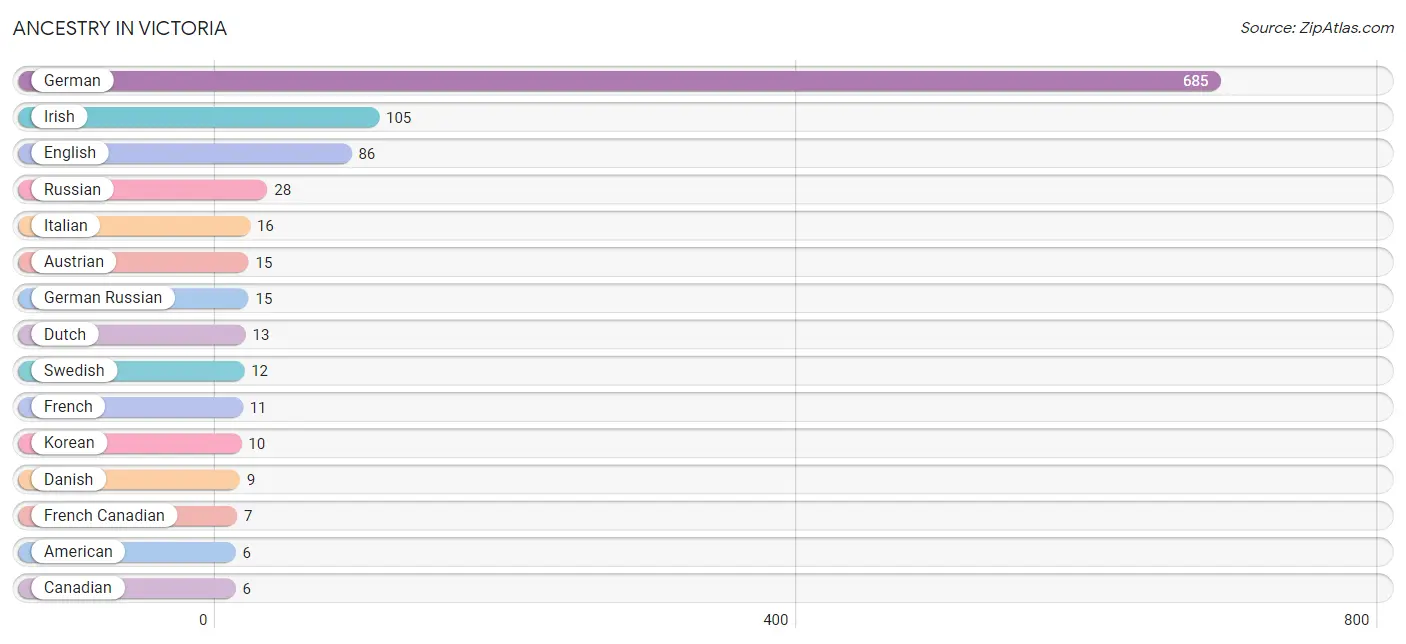
| Ancestry | # Population | % Population |
| American | 6 | 0.6% |
| Austrian | 15 | 1.5% |
| British | 2 | 0.2% |
| Canadian | 6 | 0.6% |
| Cuban | 3 | 0.3% |
| Czech | 2 | 0.2% |
| Danish | 9 | 0.9% |
| Dutch | 13 | 1.3% |
| English | 86 | 8.4% |
| French | 11 | 1.1% |
| French Canadian | 7 | 0.7% |
| German | 685 | 66.7% |
| German Russian | 15 | 1.5% |
| Irish | 105 | 10.2% |
| Italian | 16 | 1.6% |
| Korean | 10 | 1.0% |
| Russian | 28 | 2.7% |
| Scandinavian | 2 | 0.2% |
| Scottish | 4 | 0.4% |
| South African | 3 | 0.3% |
| Subsaharan African | 3 | 0.3% |
| Swedish | 12 | 1.2% |
| Ukrainian | 5 | 0.5% | View All 23 Rows |
Immigrants in Victoria
The most numerous immigrant groups reported in Victoria came from Asia (10 | 1.0%), Philippines (10 | 1.0%), South Eastern Asia (10 | 1.0%), Canada (4 | 0.4%), and Africa (3 | 0.3%), together accounting for 3.6% of all Victoria residents.
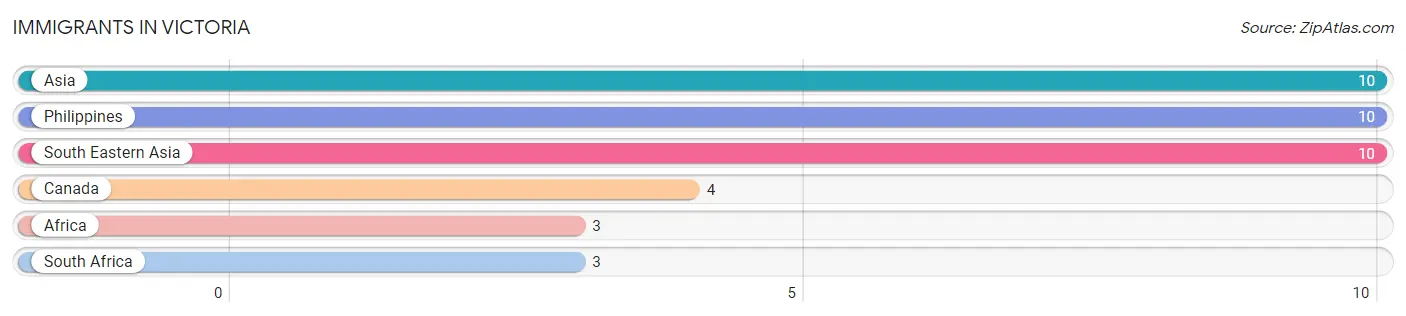
| Immigration Origin | # Population | % Population |
| Africa | 3 | 0.3% |
| Asia | 10 | 1.0% |
| Canada | 4 | 0.4% |
| Philippines | 10 | 1.0% |
| South Africa | 3 | 0.3% |
| South Eastern Asia | 10 | 1.0% | View All 6 Rows |
Sex and Age in Victoria
Sex and Age in Victoria
The most populous age groups in Victoria are 25 to 29 Years (60 | 11.7%) for men and 35 to 39 Years (65 | 12.7%) for women.
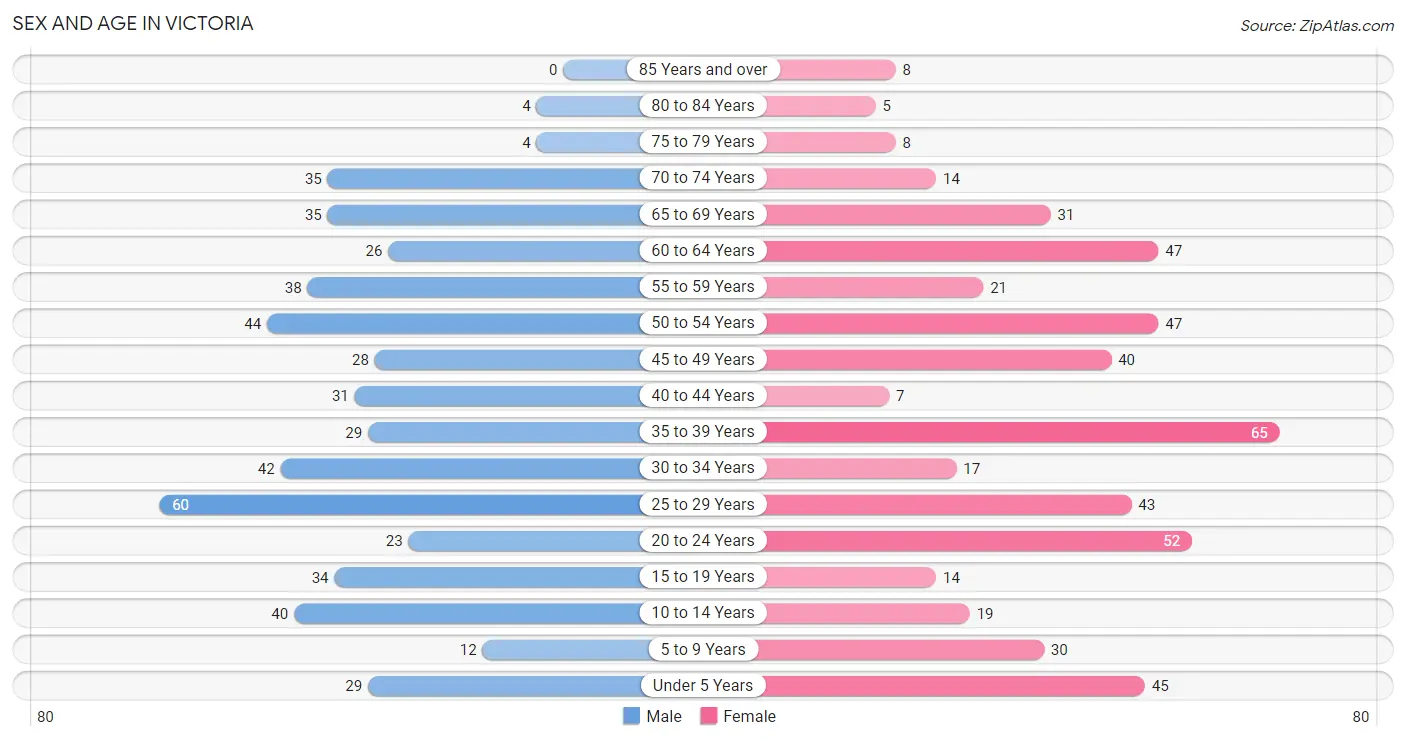
| Age Bracket | Male | Female |
| Under 5 Years | 29 (5.6%) | 45 (8.8%) |
| 5 to 9 Years | 12 (2.3%) | 30 (5.9%) |
| 10 to 14 Years | 40 (7.8%) | 19 (3.7%) |
| 15 to 19 Years | 34 (6.6%) | 14 (2.7%) |
| 20 to 24 Years | 23 (4.5%) | 52 (10.1%) |
| 25 to 29 Years | 60 (11.7%) | 43 (8.4%) |
| 30 to 34 Years | 42 (8.2%) | 17 (3.3%) |
| 35 to 39 Years | 29 (5.6%) | 65 (12.7%) |
| 40 to 44 Years | 31 (6.0%) | 7 (1.4%) |
| 45 to 49 Years | 28 (5.4%) | 40 (7.8%) |
| 50 to 54 Years | 44 (8.6%) | 47 (9.2%) |
| 55 to 59 Years | 38 (7.4%) | 21 (4.1%) |
| 60 to 64 Years | 26 (5.1%) | 47 (9.2%) |
| 65 to 69 Years | 35 (6.8%) | 31 (6.0%) |
| 70 to 74 Years | 35 (6.8%) | 14 (2.7%) |
| 75 to 79 Years | 4 (0.8%) | 8 (1.6%) |
| 80 to 84 Years | 4 (0.8%) | 5 (1.0%) |
| 85 Years and over | 0 (0.0%) | 8 (1.6%) |
| Total | 514 (100.0%) | 513 (100.0%) |
Families and Households in Victoria
Median Family Size in Victoria
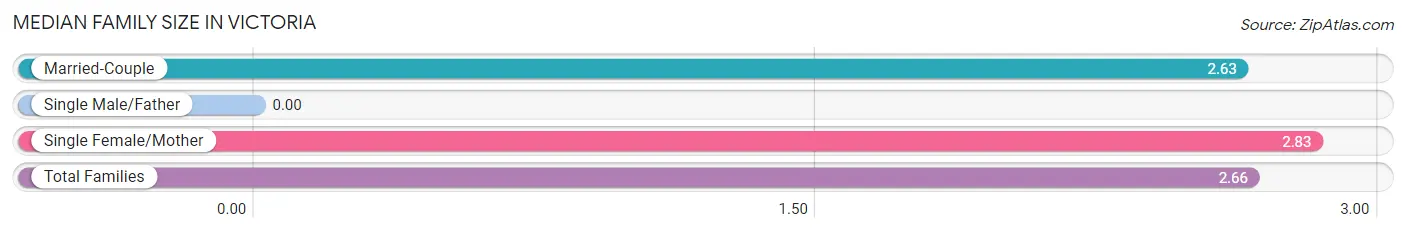
| Family Type | # Families | Family Size |
| Married-Couple | 264 (88.0%) | 2.63 |
| Single Male/Father | 0 (0.0%) | - |
| Single Female/Mother | 36 (12.0%) | 2.83 |
| Total Families | 300 (100.0%) | 2.66 |
Median Household Size in Victoria
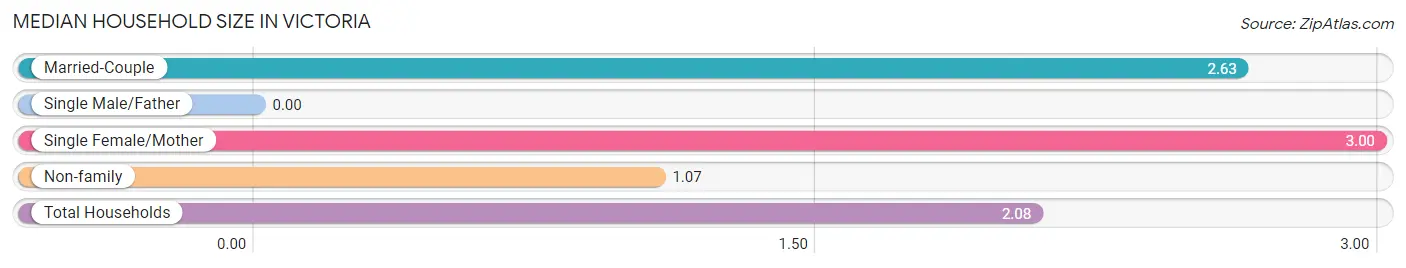
| Household Type | # Households | Household Size |
| Married-Couple | 264 (55.2%) | 2.63 |
| Single Male/Father | 0 (0.0%) | - |
| Single Female/Mother | 36 (7.5%) | 3.00 |
| Non-family | 178 (37.2%) | 1.07 |
| Total Households | 478 (100.0%) | 2.08 |
Household Size by Marriage Status in Victoria
Out of a total of 478 households in Victoria, 300 (62.8%) are family households, while 178 (37.2%) are nonfamily households. The most numerous type of family households are 2-person households, comprising 159, and the most common type of nonfamily households are 1-person households, comprising 167.
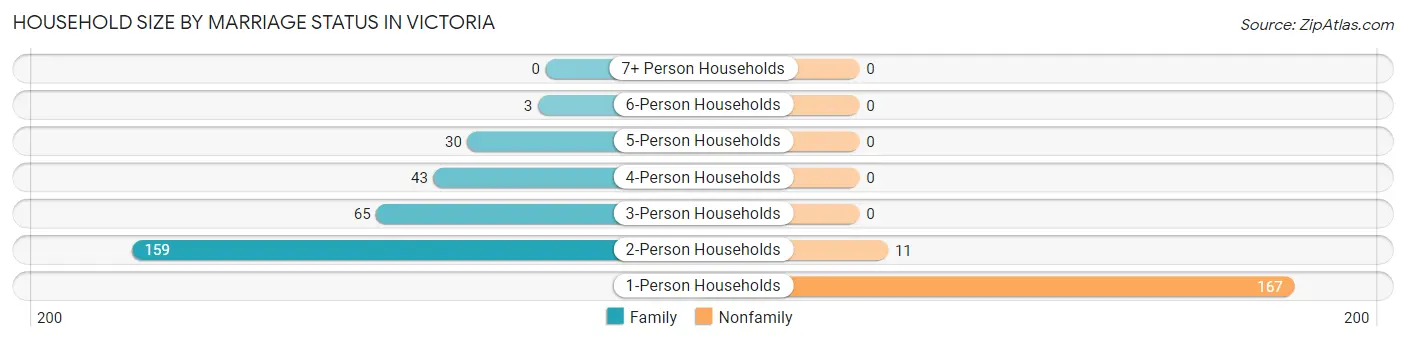
| Household Size | Family Households | Nonfamily Households |
| 1-Person Households | - | 167 (34.9%) |
| 2-Person Households | 159 (33.3%) | 11 (2.3%) |
| 3-Person Households | 65 (13.6%) | 0 (0.0%) |
| 4-Person Households | 43 (9.0%) | 0 (0.0%) |
| 5-Person Households | 30 (6.3%) | 0 (0.0%) |
| 6-Person Households | 3 (0.6%) | 0 (0.0%) |
| 7+ Person Households | 0 (0.0%) | 0 (0.0%) |
| Total | 300 (62.8%) | 178 (37.2%) |
Female Fertility in Victoria
Fertility by Age in Victoria
Average fertility rate in Victoria is 47.0 births per 1,000 women. Women in the age bracket of 35 to 50 years have the highest fertility rate with 55.0 births per 1,000 women. Women in the age bracket of 35 to 50 years acount for 58.3% of all women with births.
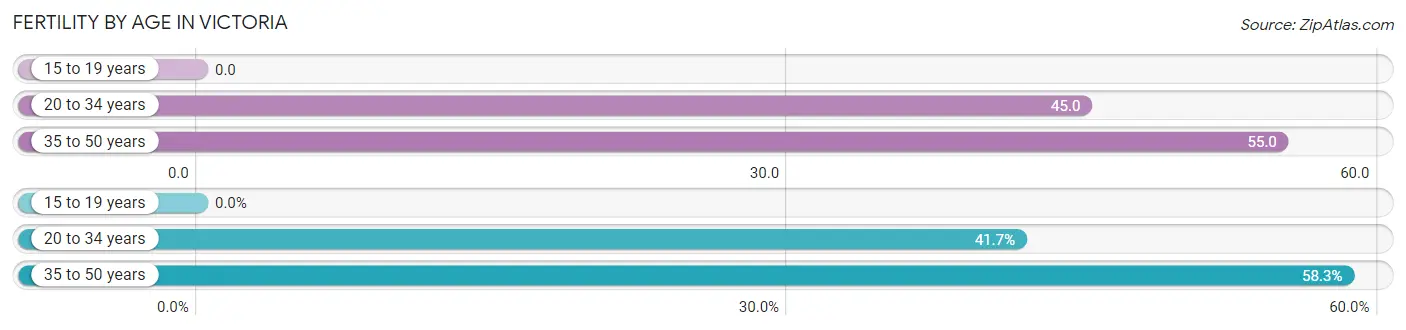
| Age Bracket | Women with Births | Births / 1,000 Women |
| 15 to 19 years | 0 (0.0%) | 0.0 |
| 20 to 34 years | 5 (41.7%) | 45.0 |
| 35 to 50 years | 7 (58.3%) | 55.0 |
| Total | 12 (100.0%) | 47.0 |
Fertility by Age by Marriage Status in Victoria
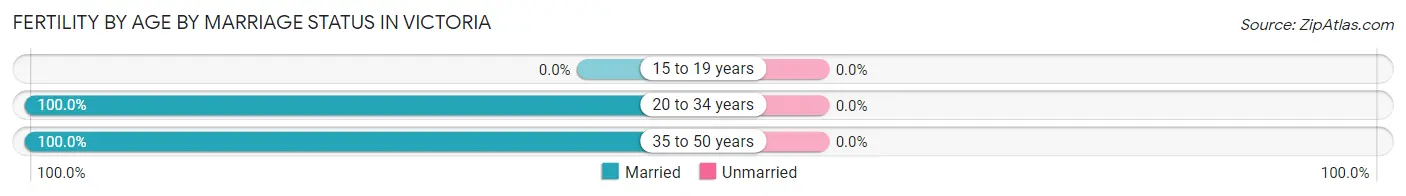
| Age Bracket | Married | Unmarried |
| 15 to 19 years | 0 (0.0%) | 0 (0.0%) |
| 20 to 34 years | 5 (100.0%) | 0 (0.0%) |
| 35 to 50 years | 7 (100.0%) | 0 (0.0%) |
| Total | 12 (100.0%) | 0 (0.0%) |
Fertility by Education in Victoria
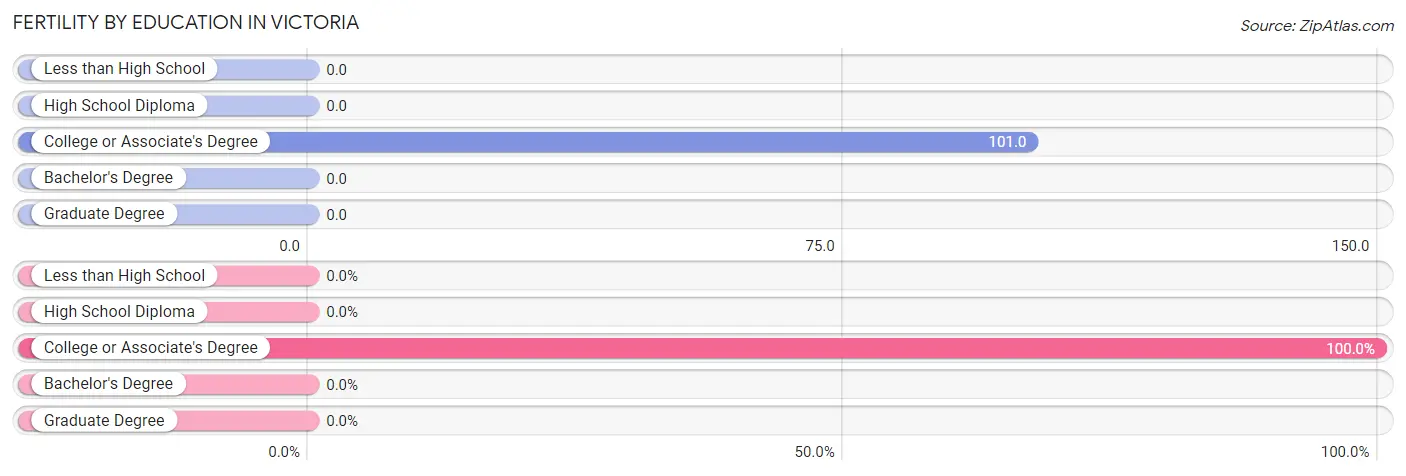
| Educational Attainment | Women with Births | Births / 1,000 Women |
| Less than High School | 0 (0.0%) | 0.0 |
| High School Diploma | 0 (0.0%) | 0.0 |
| College or Associate's Degree | 12 (100.0%) | 101.0 |
| Bachelor's Degree | 0 (0.0%) | 0.0 |
| Graduate Degree | 0 (0.0%) | 0.0 |
| Total | 12 (100.0%) | 47.0 |
Fertility by Education by Marriage Status in Victoria
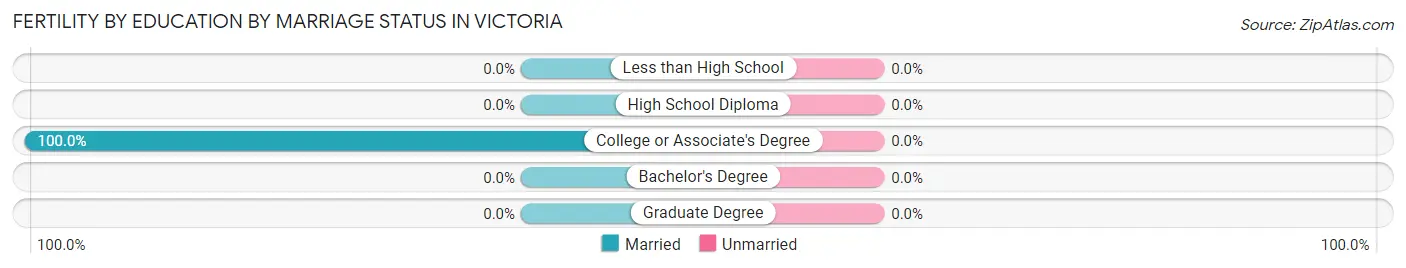
| Educational Attainment | Married | Unmarried |
| Less than High School | 0 (0.0%) | 0 (0.0%) |
| High School Diploma | 0 (0.0%) | 0 (0.0%) |
| College or Associate's Degree | 12 (100.0%) | 0 (0.0%) |
| Bachelor's Degree | 0 (0.0%) | 0 (0.0%) |
| Graduate Degree | 0 (0.0%) | 0 (0.0%) |
| Total | 12 (100.0%) | 0 (0.0%) |
Employment Characteristics in Victoria
Employment by Class of Employer in Victoria
Among the 635 employed individuals in Victoria, private company employees (436 | 68.7%), not-for-profit organizations (59 | 9.3%), and state government employees (38 | 6.0%) make up the most common classes of employment.
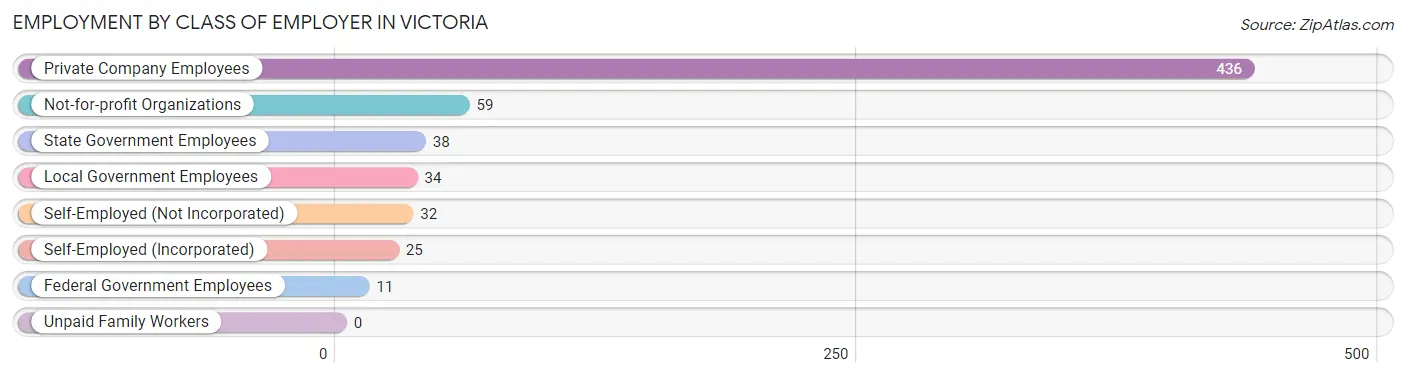
| Employer Class | # Employees | % Employees |
| Private Company Employees | 436 | 68.7% |
| Self-Employed (Incorporated) | 25 | 3.9% |
| Self-Employed (Not Incorporated) | 32 | 5.0% |
| Not-for-profit Organizations | 59 | 9.3% |
| Local Government Employees | 34 | 5.3% |
| State Government Employees | 38 | 6.0% |
| Federal Government Employees | 11 | 1.7% |
| Unpaid Family Workers | 0 | 0.0% |
| Total | 635 | 100.0% |
Employment Status by Age in Victoria
According to the labor force statistics for Victoria, out of the total population over 16 years of age (841), 77.5% or 652 individuals are in the labor force, with 1.7% or 11 of them unemployed. The age group with the highest labor force participation rate is 20 to 24 years, with 100.0% or 75 individuals in the labor force. Within the labor force, the 25 to 29 years age range has the highest percentage of unemployed individuals, with 12.4% or 11 of them being unemployed.
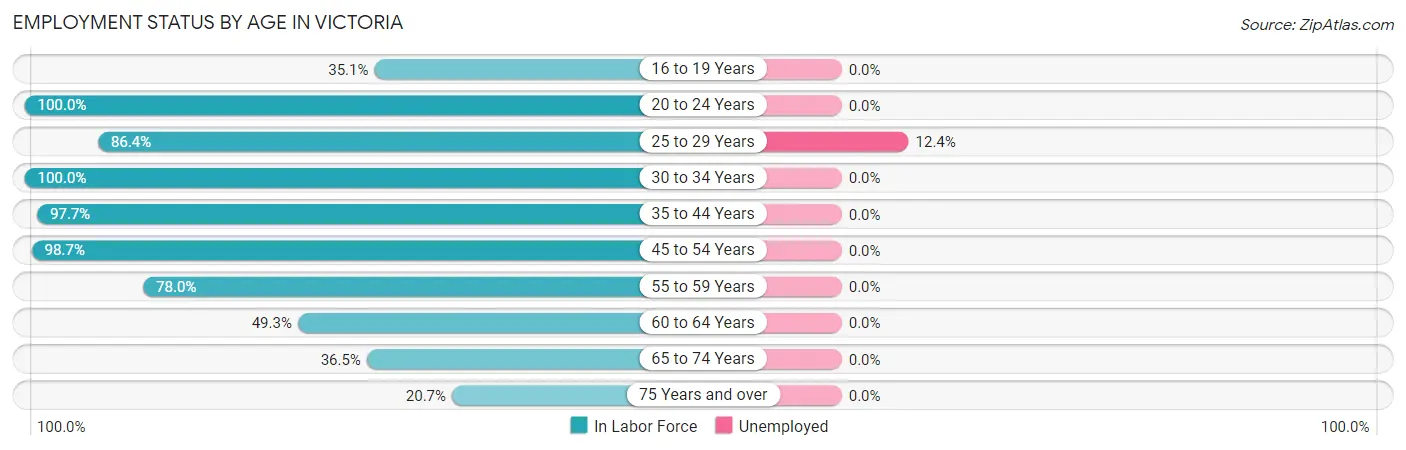
| Age Bracket | In Labor Force | Unemployed |
| 16 to 19 Years | 13 (35.1%) | 0 (0.0%) |
| 20 to 24 Years | 75 (100.0%) | 0 (0.0%) |
| 25 to 29 Years | 89 (86.4%) | 11 (12.4%) |
| 30 to 34 Years | 59 (100.0%) | 0 (0.0%) |
| 35 to 44 Years | 129 (97.7%) | 0 (0.0%) |
| 45 to 54 Years | 157 (98.7%) | 0 (0.0%) |
| 55 to 59 Years | 46 (78.0%) | 0 (0.0%) |
| 60 to 64 Years | 36 (49.3%) | 0 (0.0%) |
| 65 to 74 Years | 42 (36.5%) | 0 (0.0%) |
| 75 Years and over | 6 (20.7%) | 0 (0.0%) |
| Total | 652 (77.5%) | 11 (1.7%) |
Employment Status by Educational Attainment in Victoria
According to labor force statistics for Victoria, 88.2% of individuals (516) out of the total population between 25 and 64 years of age (585) are in the labor force, with 2.2% or 11 of them being unemployed. The group with the highest labor force participation rate are those with the educational attainment of less than high school, with 100.0% or 19 individuals in the labor force. Within the labor force, individuals with less than high school education have the highest percentage of unemployment, with 57.9% or 11 of them being unemployed.
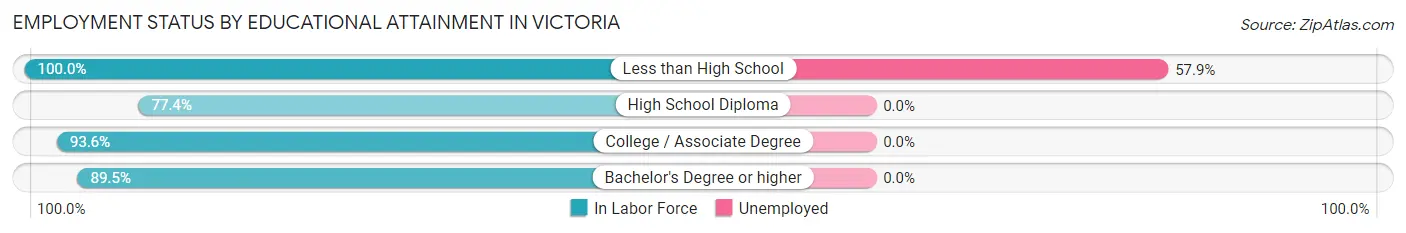
| Educational Attainment | In Labor Force | Unemployed |
| Less than High School | 19 (100.0%) | 11 (57.9%) |
| High School Diploma | 123 (77.4%) | 0 (0.0%) |
| College / Associate Degree | 220 (93.6%) | 0 (0.0%) |
| Bachelor's Degree or higher | 154 (89.5%) | 0 (0.0%) |
| Total | 516 (88.2%) | 13 (2.2%) |
Employment Occupations by Sex in Victoria
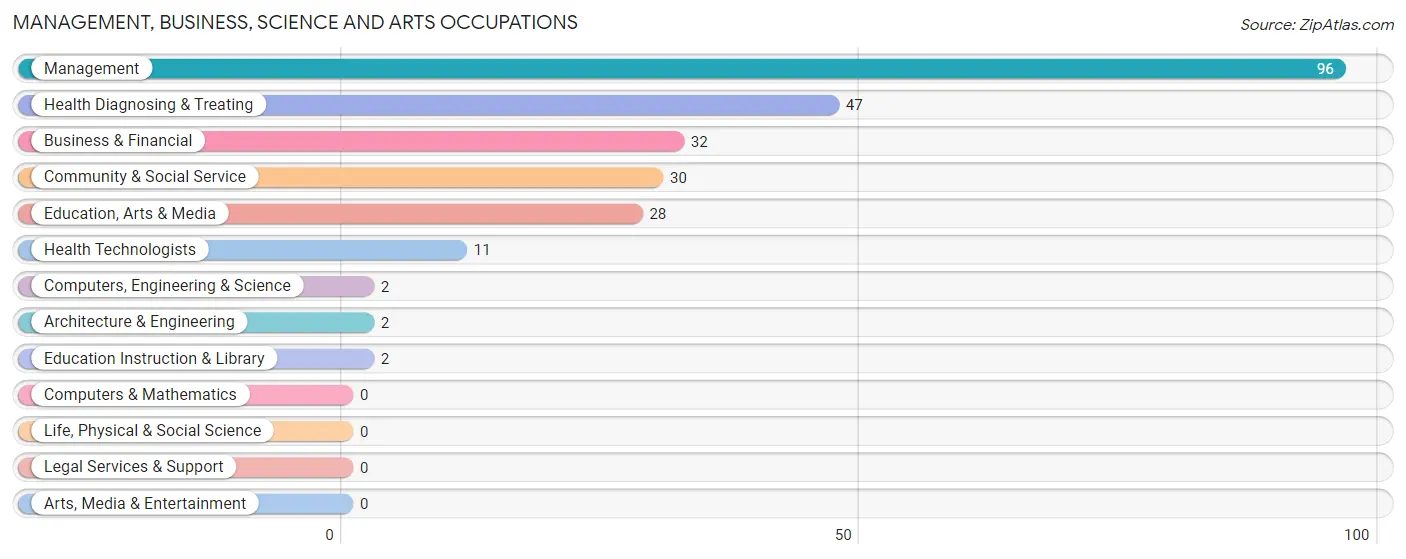
Management, Business, Science and Arts Occupations
The most common Management, Business, Science and Arts occupations in Victoria are Management (96 | 15.1%), Health Diagnosing & Treating (47 | 7.4%), Business & Financial (32 | 5.0%), Community & Social Service (30 | 4.7%), and Education, Arts & Media (28 | 4.4%).
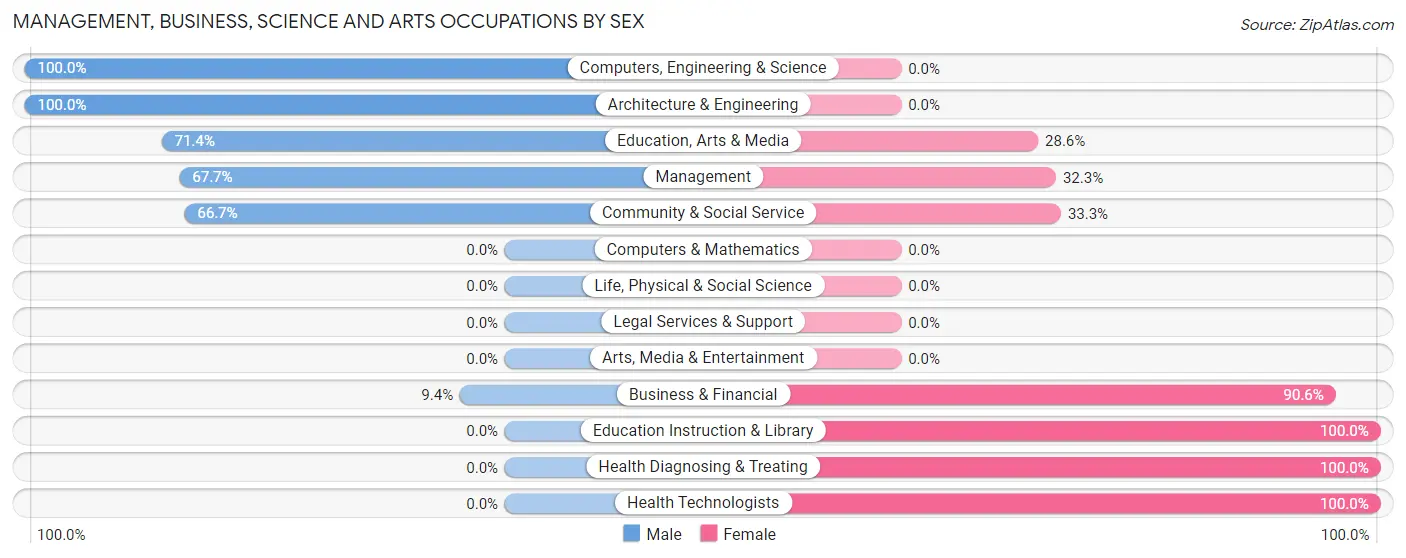
Management, Business, Science and Arts Occupations by Sex
Within the Management, Business, Science and Arts occupations in Victoria, the most male-oriented occupations are Computers, Engineering & Science (100.0%), Architecture & Engineering (100.0%), and Education, Arts & Media (71.4%), while the most female-oriented occupations are Education Instruction & Library (100.0%), Health Diagnosing & Treating (100.0%), and Health Technologists (100.0%).
| Occupation | Male | Female |
| Management | 65 (67.7%) | 31 (32.3%) |
| Business & Financial | 3 (9.4%) | 29 (90.6%) |
| Computers, Engineering & Science | 2 (100.0%) | 0 (0.0%) |
| Computers & Mathematics | 0 (0.0%) | 0 (0.0%) |
| Architecture & Engineering | 2 (100.0%) | 0 (0.0%) |
| Life, Physical & Social Science | 0 (0.0%) | 0 (0.0%) |
| Community & Social Service | 20 (66.7%) | 10 (33.3%) |
| Education, Arts & Media | 20 (71.4%) | 8 (28.6%) |
| Legal Services & Support | 0 (0.0%) | 0 (0.0%) |
| Education Instruction & Library | 0 (0.0%) | 2 (100.0%) |
| Arts, Media & Entertainment | 0 (0.0%) | 0 (0.0%) |
| Health Diagnosing & Treating | 0 (0.0%) | 47 (100.0%) |
| Health Technologists | 0 (0.0%) | 11 (100.0%) |
| Total (Category) | 90 (43.5%) | 117 (56.5%) |
| Total (Overall) | 325 (51.1%) | 311 (48.9%) |
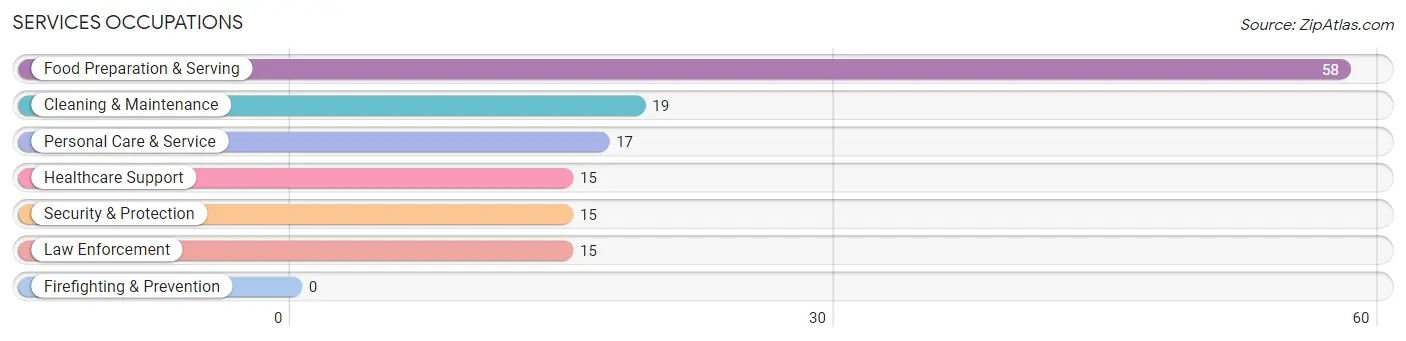
Services Occupations
The most common Services occupations in Victoria are Food Preparation & Serving (58 | 9.1%), Cleaning & Maintenance (19 | 3.0%), Personal Care & Service (17 | 2.7%), Healthcare Support (15 | 2.4%), and Security & Protection (15 | 2.4%).
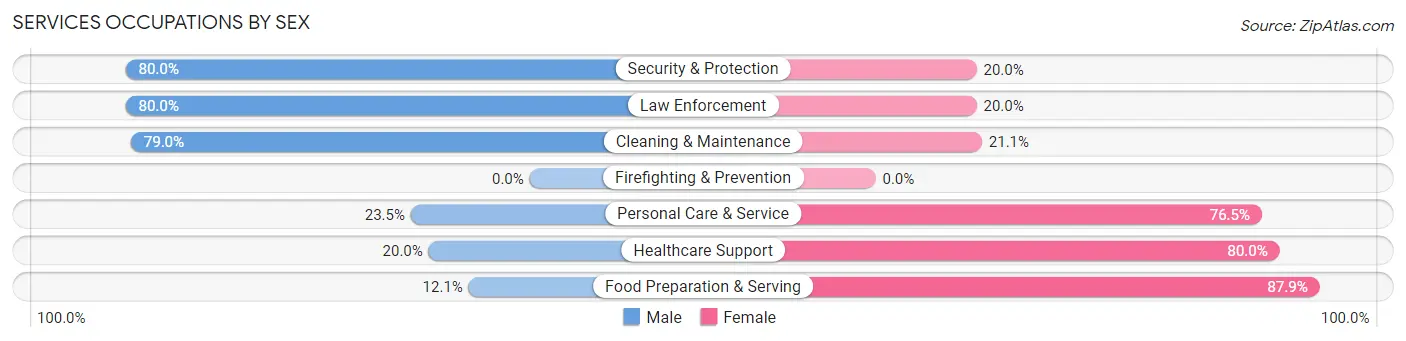
Services Occupations by Sex
Within the Services occupations in Victoria, the most male-oriented occupations are Security & Protection (80.0%), Law Enforcement (80.0%), and Cleaning & Maintenance (78.9%), while the most female-oriented occupations are Food Preparation & Serving (87.9%), Healthcare Support (80.0%), and Personal Care & Service (76.5%).
| Occupation | Male | Female |
| Healthcare Support | 3 (20.0%) | 12 (80.0%) |
| Security & Protection | 12 (80.0%) | 3 (20.0%) |
| Firefighting & Prevention | 0 (0.0%) | 0 (0.0%) |
| Law Enforcement | 12 (80.0%) | 3 (20.0%) |
| Food Preparation & Serving | 7 (12.1%) | 51 (87.9%) |
| Cleaning & Maintenance | 15 (78.9%) | 4 (21.0%) |
| Personal Care & Service | 4 (23.5%) | 13 (76.5%) |
| Total (Category) | 41 (33.1%) | 83 (66.9%) |
| Total (Overall) | 325 (51.1%) | 311 (48.9%) |
Sales and Office Occupations
The most common Sales and Office occupations in Victoria are Office & Administration (102 | 16.0%), and Sales & Related (38 | 6.0%).
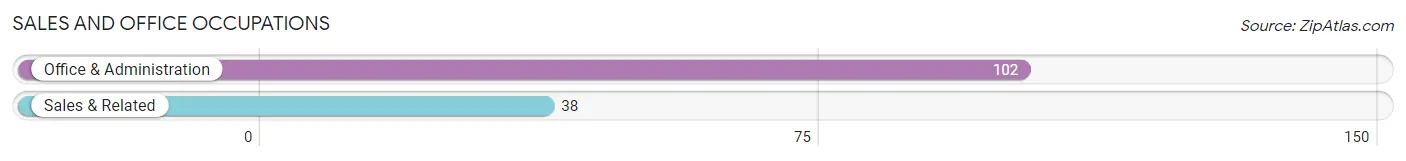
Sales and Office Occupations by Sex
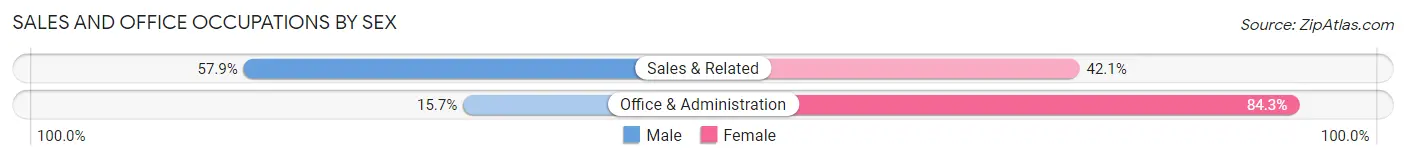
| Occupation | Male | Female |
| Sales & Related | 22 (57.9%) | 16 (42.1%) |
| Office & Administration | 16 (15.7%) | 86 (84.3%) |
| Total (Category) | 38 (27.1%) | 102 (72.9%) |
| Total (Overall) | 325 (51.1%) | 311 (48.9%) |
Natural Resources, Construction and Maintenance Occupations
The most common Natural Resources, Construction and Maintenance occupations in Victoria are Installation, Maintenance & Repair (46 | 7.2%), Construction & Extraction (27 | 4.3%), and Farming, Fishing & Forestry (18 | 2.8%).
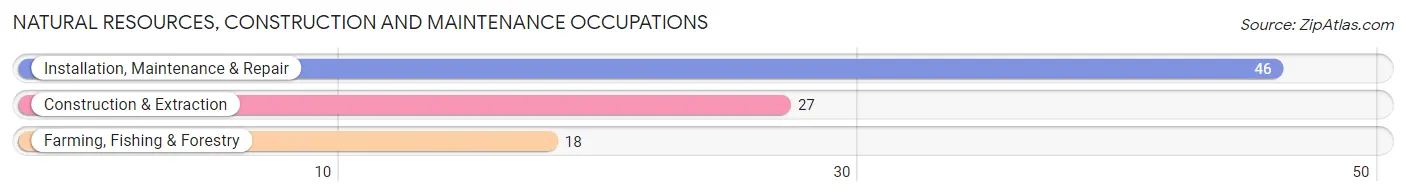
Natural Resources, Construction and Maintenance Occupations by Sex

| Occupation | Male | Female |
| Farming, Fishing & Forestry | 18 (100.0%) | 0 (0.0%) |
| Construction & Extraction | 27 (100.0%) | 0 (0.0%) |
| Installation, Maintenance & Repair | 44 (95.7%) | 2 (4.3%) |
| Total (Category) | 89 (97.8%) | 2 (2.2%) |
| Total (Overall) | 325 (51.1%) | 311 (48.9%) |
Production, Transportation and Moving Occupations
The most common Production, Transportation and Moving occupations in Victoria are Transportation (50 | 7.9%), Production (18 | 2.8%), and Material Moving (6 | 0.9%).
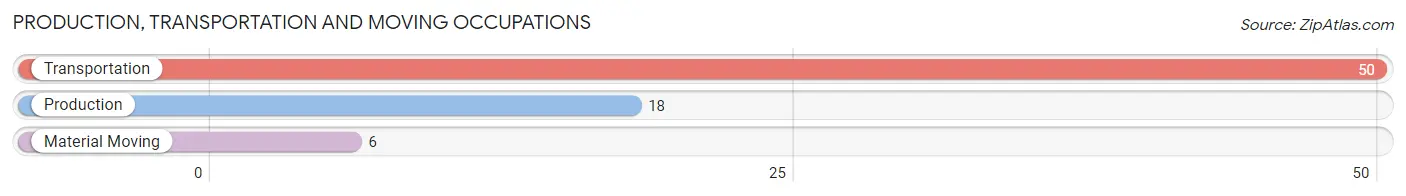
Production, Transportation and Moving Occupations by Sex
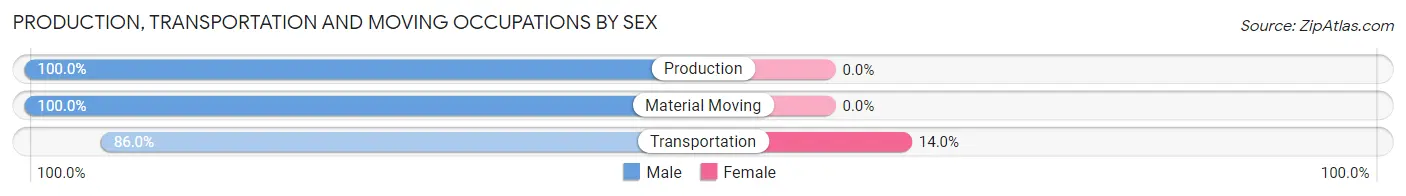
| Occupation | Male | Female |
| Production | 18 (100.0%) | 0 (0.0%) |
| Transportation | 43 (86.0%) | 7 (14.0%) |
| Material Moving | 6 (100.0%) | 0 (0.0%) |
| Total (Category) | 67 (90.5%) | 7 (9.5%) |
| Total (Overall) | 325 (51.1%) | 311 (48.9%) |
Employment Industries by Sex in Victoria
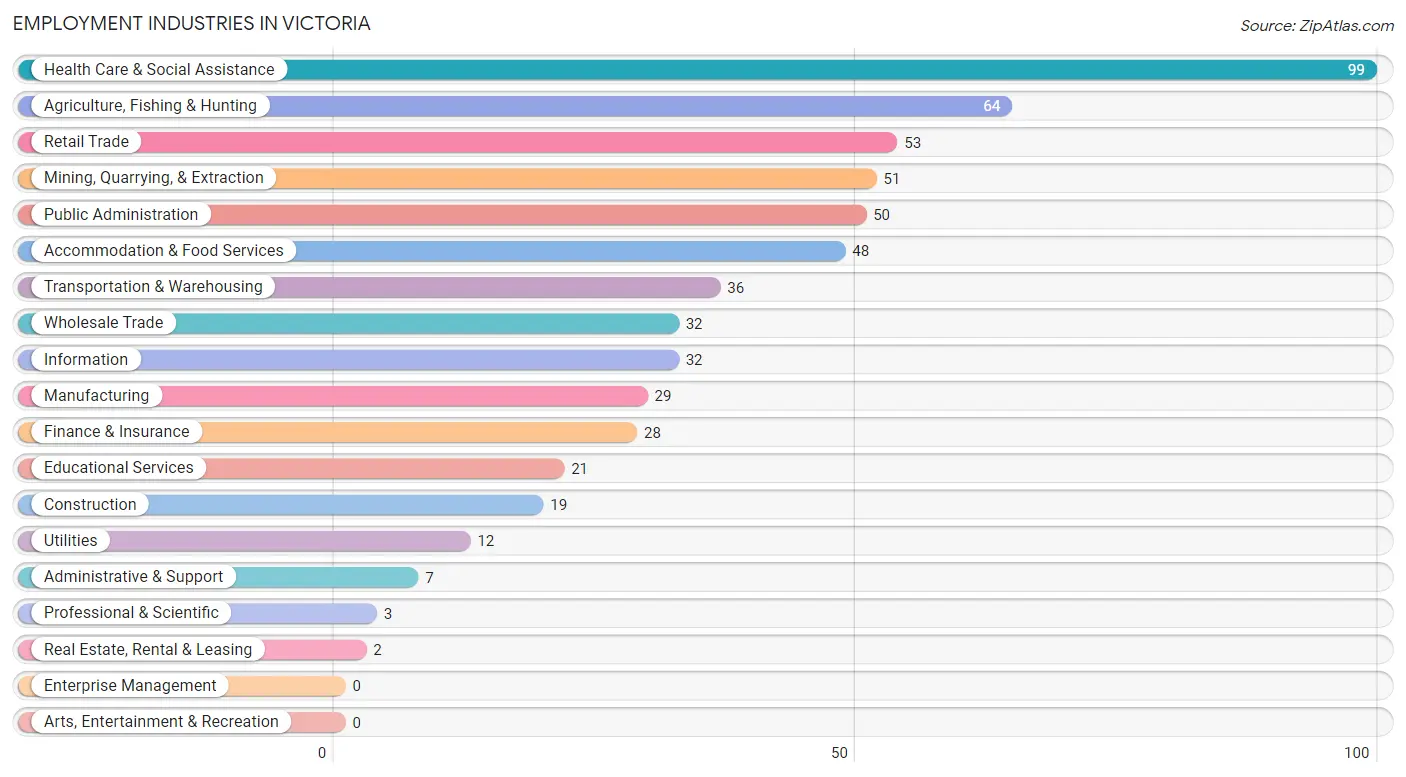
Employment Industries in Victoria
The major employment industries in Victoria include Health Care & Social Assistance (99 | 15.6%), Agriculture, Fishing & Hunting (64 | 10.1%), Retail Trade (53 | 8.3%), Mining, Quarrying, & Extraction (51 | 8.0%), and Public Administration (50 | 7.9%).
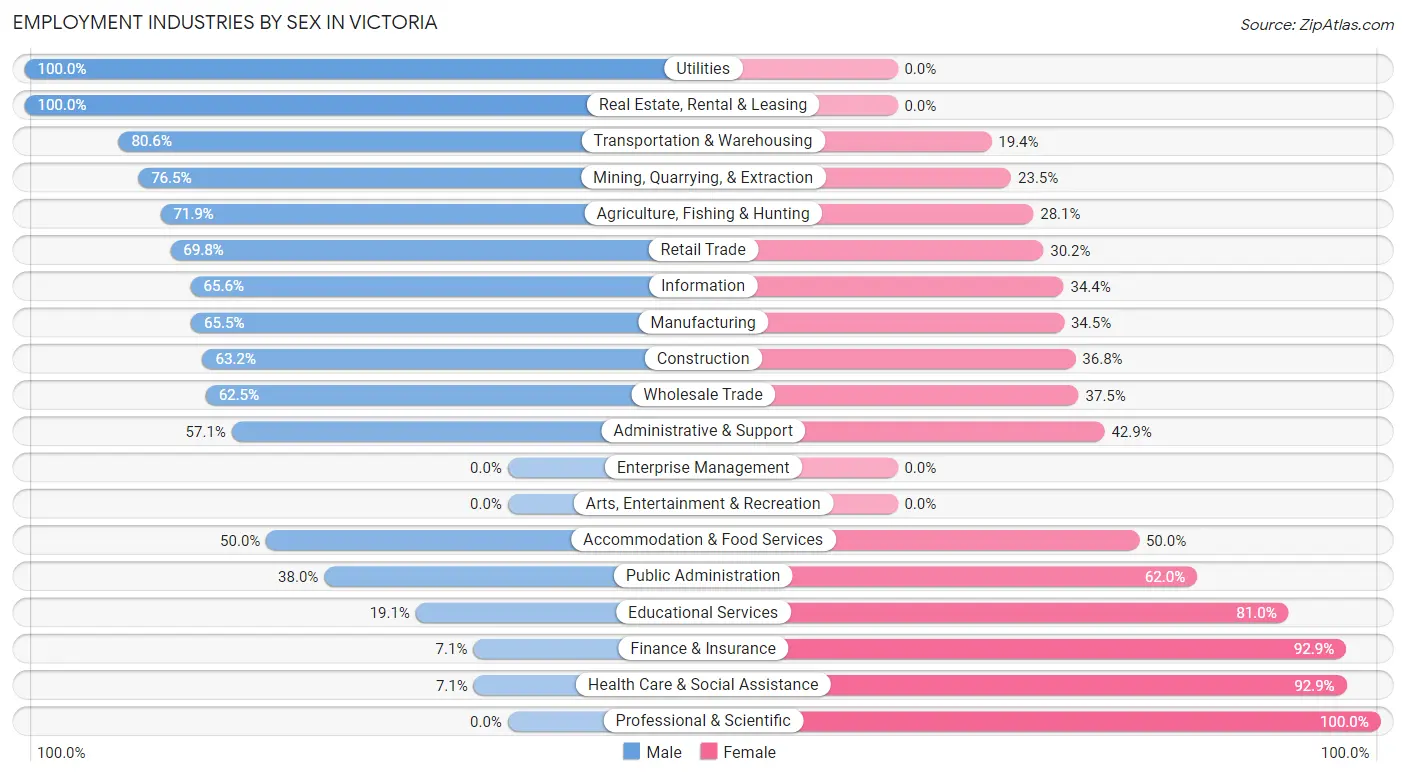
Employment Industries by Sex in Victoria
The Victoria industries that see more men than women are Utilities (100.0%), Real Estate, Rental & Leasing (100.0%), and Transportation & Warehousing (80.6%), whereas the industries that tend to have a higher number of women are Professional & Scientific (100.0%), Health Care & Social Assistance (92.9%), and Finance & Insurance (92.9%).
| Industry | Male | Female |
| Agriculture, Fishing & Hunting | 46 (71.9%) | 18 (28.1%) |
| Mining, Quarrying, & Extraction | 39 (76.5%) | 12 (23.5%) |
| Construction | 12 (63.2%) | 7 (36.8%) |
| Manufacturing | 19 (65.5%) | 10 (34.5%) |
| Wholesale Trade | 20 (62.5%) | 12 (37.5%) |
| Retail Trade | 37 (69.8%) | 16 (30.2%) |
| Transportation & Warehousing | 29 (80.6%) | 7 (19.4%) |
| Utilities | 12 (100.0%) | 0 (0.0%) |
| Information | 21 (65.6%) | 11 (34.4%) |
| Finance & Insurance | 2 (7.1%) | 26 (92.9%) |
| Real Estate, Rental & Leasing | 2 (100.0%) | 0 (0.0%) |
| Professional & Scientific | 0 (0.0%) | 3 (100.0%) |
| Enterprise Management | 0 (0.0%) | 0 (0.0%) |
| Administrative & Support | 4 (57.1%) | 3 (42.9%) |
| Educational Services | 4 (19.1%) | 17 (80.9%) |
| Health Care & Social Assistance | 7 (7.1%) | 92 (92.9%) |
| Arts, Entertainment & Recreation | 0 (0.0%) | 0 (0.0%) |
| Accommodation & Food Services | 24 (50.0%) | 24 (50.0%) |
| Public Administration | 19 (38.0%) | 31 (62.0%) |
| Total | 325 (51.1%) | 311 (48.9%) |
Education in Victoria
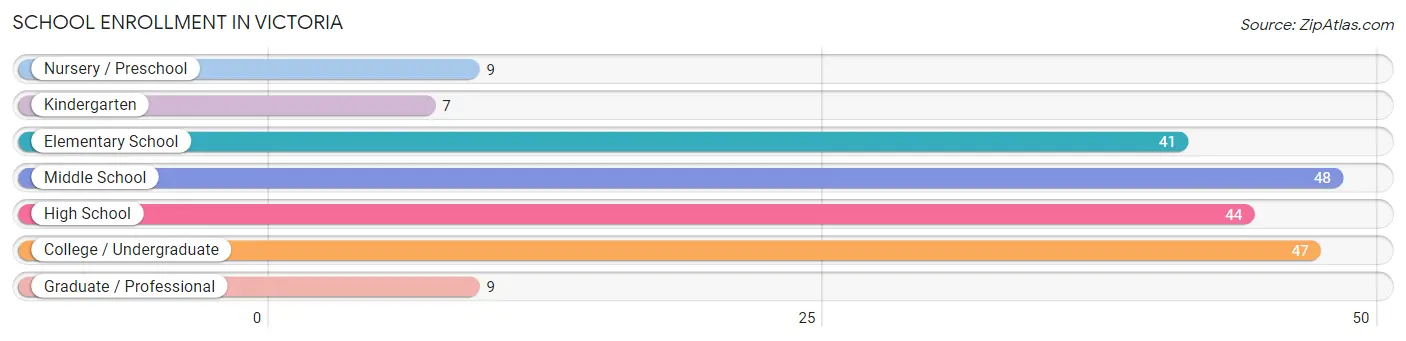
School Enrollment in Victoria
The most common levels of schooling among the 205 students in Victoria are middle school (48 | 23.4%), college / undergraduate (47 | 22.9%), and high school (44 | 21.5%).
| School Level | # Students | % Students |
| Nursery / Preschool | 9 | 4.4% |
| Kindergarten | 7 | 3.4% |
| Elementary School | 41 | 20.0% |
| Middle School | 48 | 23.4% |
| High School | 44 | 21.5% |
| College / Undergraduate | 47 | 22.9% |
| Graduate / Professional | 9 | 4.4% |
| Total | 205 | 100.0% |
School Enrollment by Age by Funding Source in Victoria
Out of a total of 205 students who are enrolled in schools in Victoria, 17 (8.3%) attend a private institution, while the remaining 188 (91.7%) are enrolled in public schools. The age group of 35 years and over has the highest likelihood of being enrolled in private schools, with 8 (32.0% in the age bracket) enrolled. Conversely, the age group of 3 to 4 year olds has the lowest likelihood of being enrolled in a private school, with 7 (100.0% in the age bracket) attending a public institution.
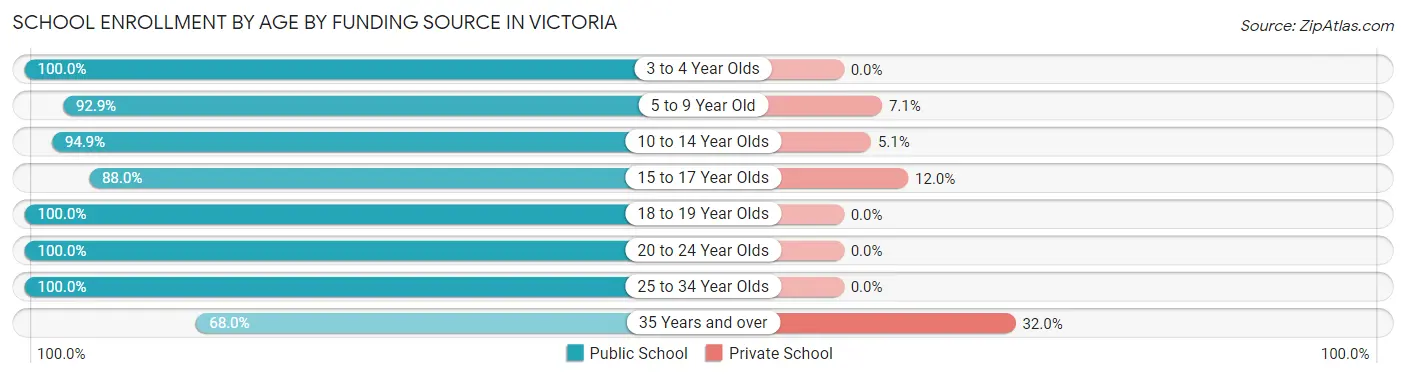
| Age Bracket | Public School | Private School |
| 3 to 4 Year Olds | 7 (100.0%) | 0 (0.0%) |
| 5 to 9 Year Old | 39 (92.9%) | 3 (7.1%) |
| 10 to 14 Year Olds | 56 (94.9%) | 3 (5.1%) |
| 15 to 17 Year Olds | 22 (88.0%) | 3 (12.0%) |
| 18 to 19 Year Olds | 20 (100.0%) | 0 (0.0%) |
| 20 to 24 Year Olds | 18 (100.0%) | 0 (0.0%) |
| 25 to 34 Year Olds | 9 (100.0%) | 0 (0.0%) |
| 35 Years and over | 17 (68.0%) | 8 (32.0%) |
| Total | 188 (91.7%) | 17 (8.3%) |
Educational Attainment by Field of Study in Victoria
Business (50 | 24.7%), education (31 | 15.3%), liberal arts & history (28 | 13.9%), arts & humanities (25 | 12.4%), and communications (16 | 7.9%) are the most common fields of study among 202 individuals in Victoria who have obtained a bachelor's degree or higher.
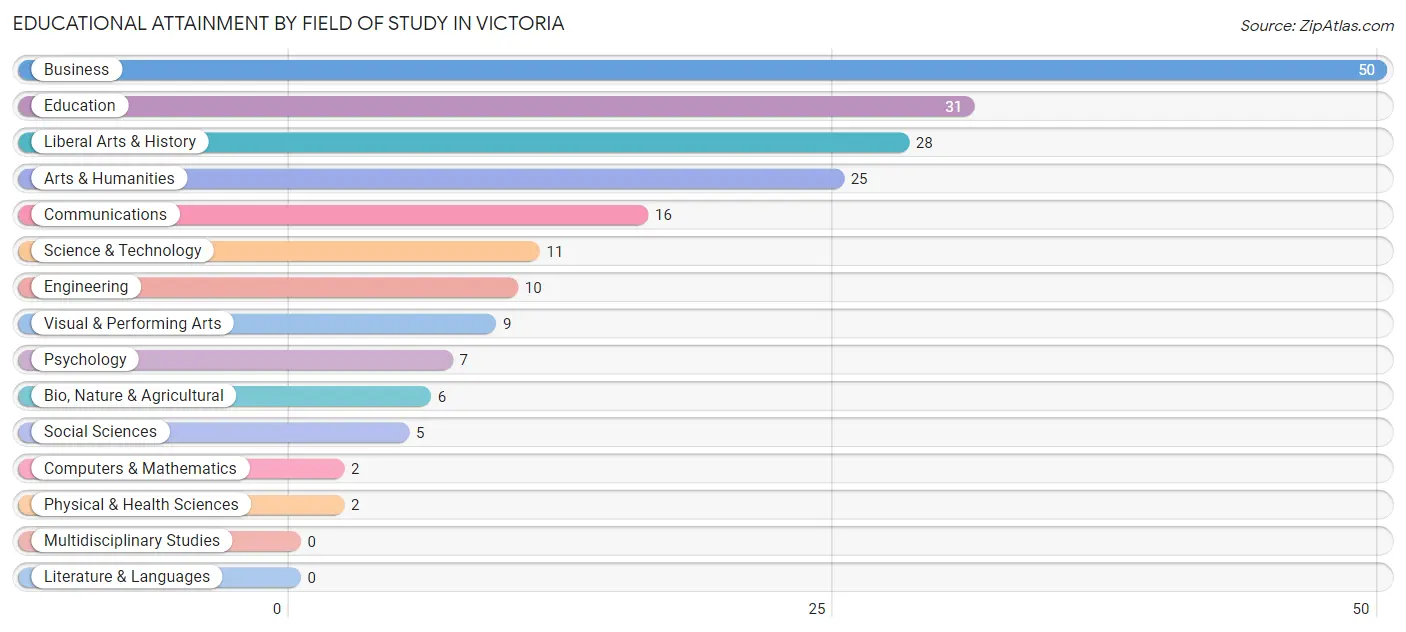
| Field of Study | # Graduates | % Graduates |
| Computers & Mathematics | 2 | 1.0% |
| Bio, Nature & Agricultural | 6 | 3.0% |
| Physical & Health Sciences | 2 | 1.0% |
| Psychology | 7 | 3.5% |
| Social Sciences | 5 | 2.5% |
| Engineering | 10 | 5.0% |
| Multidisciplinary Studies | 0 | 0.0% |
| Science & Technology | 11 | 5.4% |
| Business | 50 | 24.7% |
| Education | 31 | 15.3% |
| Literature & Languages | 0 | 0.0% |
| Liberal Arts & History | 28 | 13.9% |
| Visual & Performing Arts | 9 | 4.5% |
| Communications | 16 | 7.9% |
| Arts & Humanities | 25 | 12.4% |
| Total | 202 | 100.0% |
Transportation & Commute in Victoria
Vehicle Availability by Sex in Victoria
The most prevalent vehicle ownership categories in Victoria are males with 2 vehicles (145, accounting for 47.4%) and females with 2 vehicles (155, making up 46.6%).
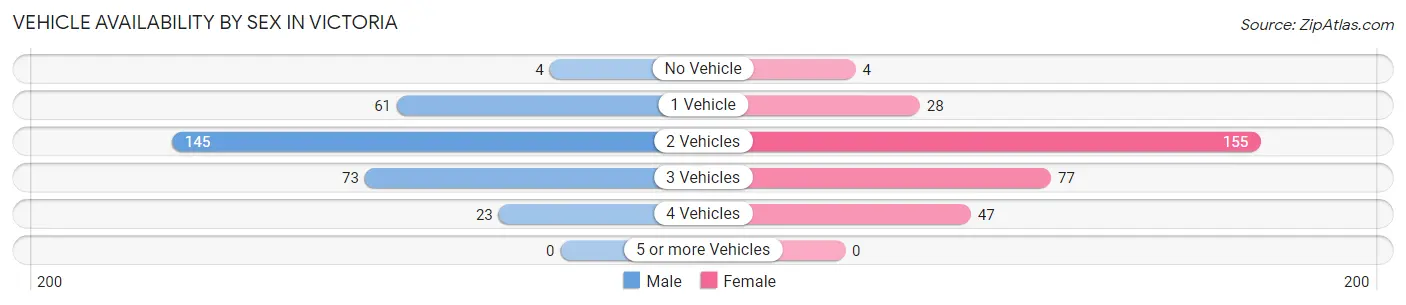
| Vehicles Available | Male | Female |
| No Vehicle | 4 (1.3%) | 4 (1.3%) |
| 1 Vehicle | 61 (19.9%) | 28 (9.0%) |
| 2 Vehicles | 145 (47.4%) | 155 (49.8%) |
| 3 Vehicles | 73 (23.9%) | 77 (24.8%) |
| 4 Vehicles | 23 (7.5%) | 47 (15.1%) |
| 5 or more Vehicles | 0 (0.0%) | 0 (0.0%) |
| Total | 306 (100.0%) | 311 (100.0%) |
Commute Time in Victoria
The most frequently occuring commute durations in Victoria are 15 to 19 minutes (241 commuters, 39.8%), 10 to 14 minutes (126 commuters, 20.8%), and 20 to 24 minutes (80 commuters, 13.2%).
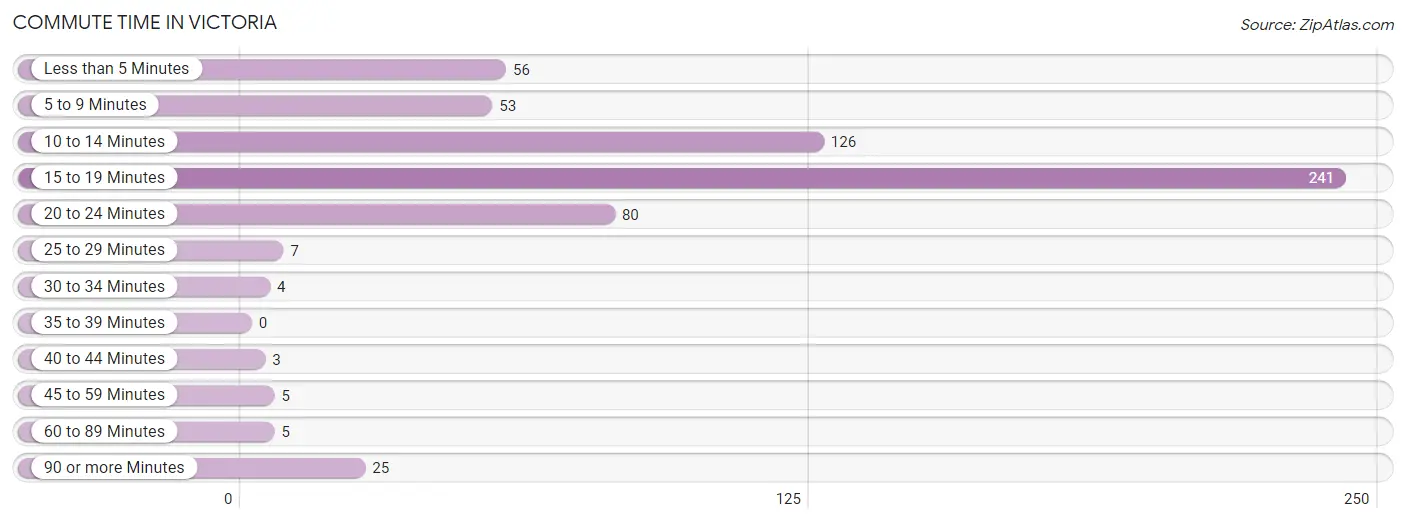
| Commute Time | # Commuters | % Commuters |
| Less than 5 Minutes | 56 | 9.3% |
| 5 to 9 Minutes | 53 | 8.8% |
| 10 to 14 Minutes | 126 | 20.8% |
| 15 to 19 Minutes | 241 | 39.8% |
| 20 to 24 Minutes | 80 | 13.2% |
| 25 to 29 Minutes | 7 | 1.2% |
| 30 to 34 Minutes | 4 | 0.7% |
| 35 to 39 Minutes | 0 | 0.0% |
| 40 to 44 Minutes | 3 | 0.5% |
| 45 to 59 Minutes | 5 | 0.8% |
| 60 to 89 Minutes | 5 | 0.8% |
| 90 or more Minutes | 25 | 4.1% |
Commute Time by Sex in Victoria
The most common commute times in Victoria are 15 to 19 minutes (111 commuters, 35.9%) for males and 15 to 19 minutes (130 commuters, 43.9%) for females.
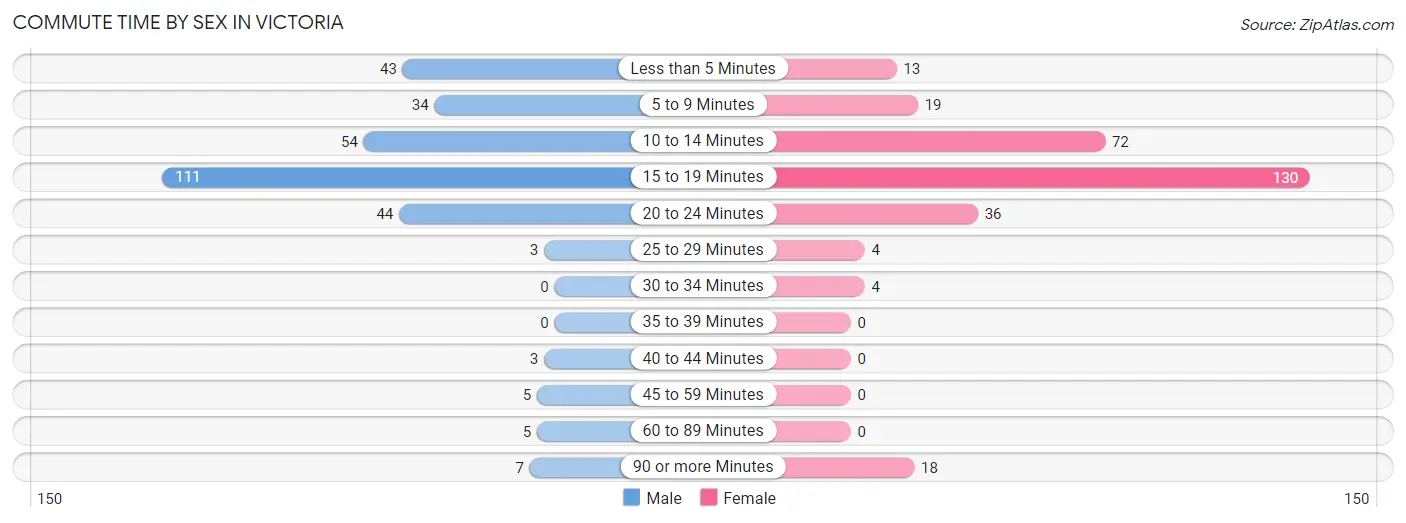
| Commute Time | Male | Female |
| Less than 5 Minutes | 43 (13.9%) | 13 (4.4%) |
| 5 to 9 Minutes | 34 (11.0%) | 19 (6.4%) |
| 10 to 14 Minutes | 54 (17.5%) | 72 (24.3%) |
| 15 to 19 Minutes | 111 (35.9%) | 130 (43.9%) |
| 20 to 24 Minutes | 44 (14.2%) | 36 (12.2%) |
| 25 to 29 Minutes | 3 (1.0%) | 4 (1.3%) |
| 30 to 34 Minutes | 0 (0.0%) | 4 (1.3%) |
| 35 to 39 Minutes | 0 (0.0%) | 0 (0.0%) |
| 40 to 44 Minutes | 3 (1.0%) | 0 (0.0%) |
| 45 to 59 Minutes | 5 (1.6%) | 0 (0.0%) |
| 60 to 89 Minutes | 5 (1.6%) | 0 (0.0%) |
| 90 or more Minutes | 7 (2.3%) | 18 (6.1%) |
Time of Departure to Work by Sex in Victoria
The most frequent times of departure to work in Victoria are 7:30 AM to 7:59 AM (94, 30.4%) for males and 7:00 AM to 7:29 AM (63, 21.3%) for females.
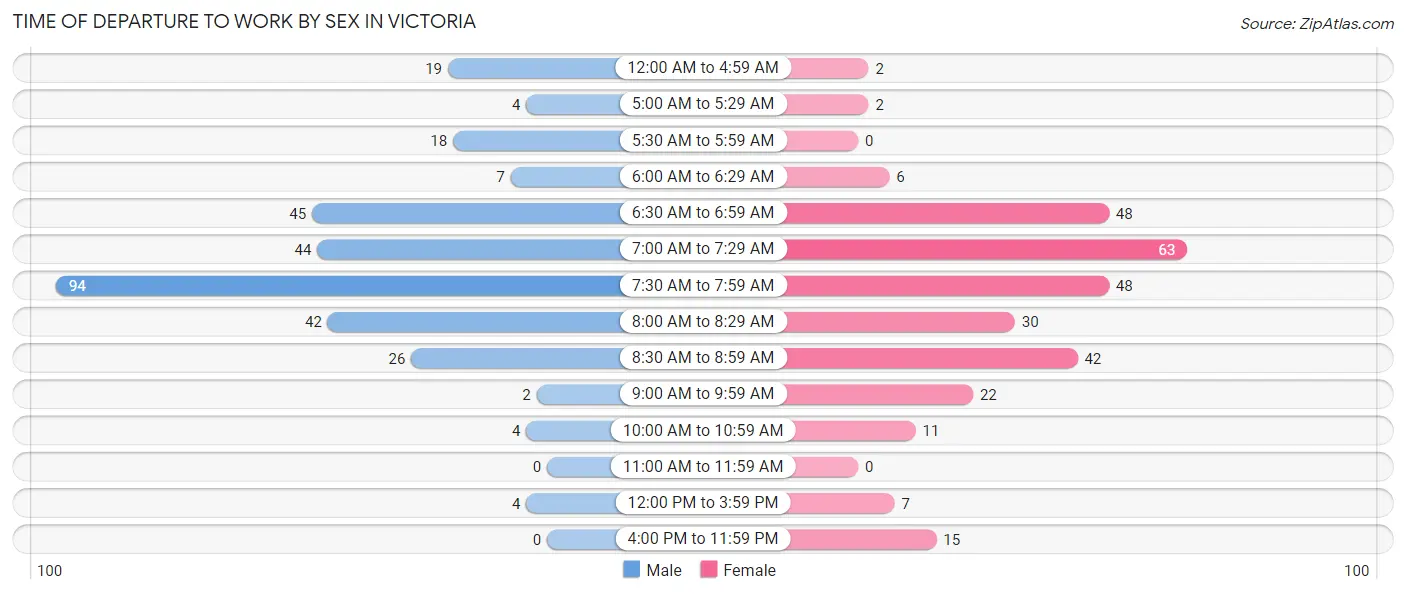
| Time of Departure | Male | Female |
| 12:00 AM to 4:59 AM | 19 (6.1%) | 2 (0.7%) |
| 5:00 AM to 5:29 AM | 4 (1.3%) | 2 (0.7%) |
| 5:30 AM to 5:59 AM | 18 (5.8%) | 0 (0.0%) |
| 6:00 AM to 6:29 AM | 7 (2.3%) | 6 (2.0%) |
| 6:30 AM to 6:59 AM | 45 (14.6%) | 48 (16.2%) |
| 7:00 AM to 7:29 AM | 44 (14.2%) | 63 (21.3%) |
| 7:30 AM to 7:59 AM | 94 (30.4%) | 48 (16.2%) |
| 8:00 AM to 8:29 AM | 42 (13.6%) | 30 (10.1%) |
| 8:30 AM to 8:59 AM | 26 (8.4%) | 42 (14.2%) |
| 9:00 AM to 9:59 AM | 2 (0.6%) | 22 (7.4%) |
| 10:00 AM to 10:59 AM | 4 (1.3%) | 11 (3.7%) |
| 11:00 AM to 11:59 AM | 0 (0.0%) | 0 (0.0%) |
| 12:00 PM to 3:59 PM | 4 (1.3%) | 7 (2.4%) |
| 4:00 PM to 11:59 PM | 0 (0.0%) | 15 (5.1%) |
| Total | 309 (100.0%) | 296 (100.0%) |
Housing Occupancy in Victoria
Occupancy by Ownership in Victoria
Of the total 478 dwellings in Victoria, owner-occupied units account for 299 (62.5%), while renter-occupied units make up 179 (37.4%).
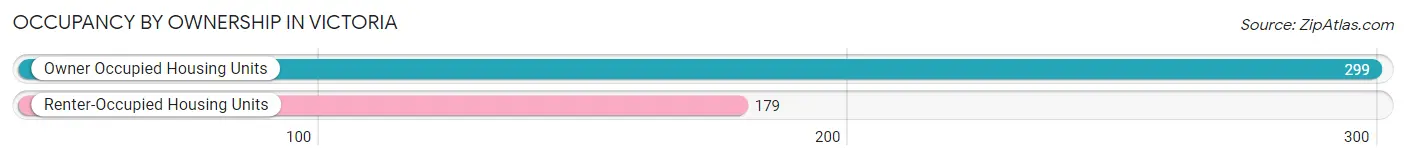
| Occupancy | # Housing Units | % Housing Units |
| Owner Occupied Housing Units | 299 | 62.5% |
| Renter-Occupied Housing Units | 179 | 37.4% |
| Total Occupied Housing Units | 478 | 100.0% |
Occupancy by Household Size in Victoria
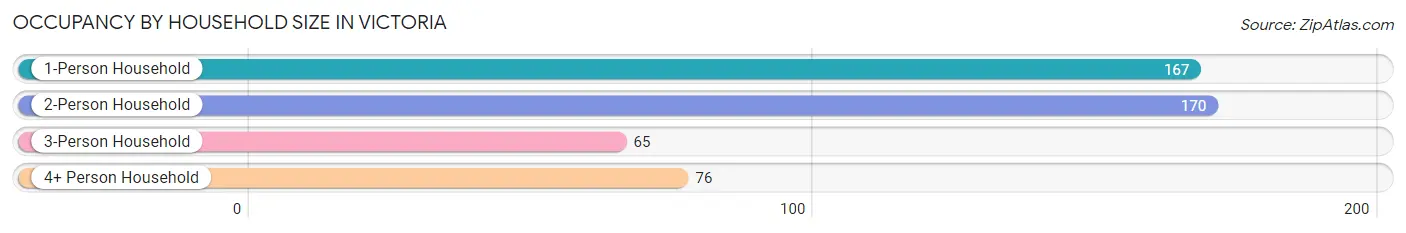
| Household Size | # Housing Units | % Housing Units |
| 1-Person Household | 167 | 34.9% |
| 2-Person Household | 170 | 35.6% |
| 3-Person Household | 65 | 13.6% |
| 4+ Person Household | 76 | 15.9% |
| Total Housing Units | 478 | 100.0% |
Occupancy by Ownership by Household Size in Victoria
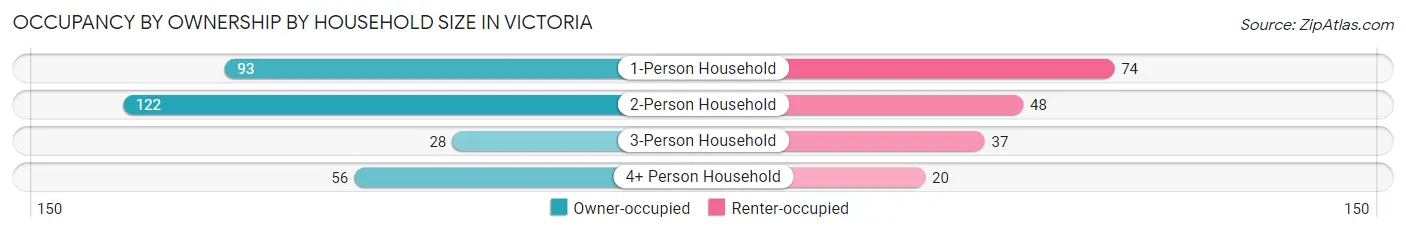
| Household Size | Owner-occupied | Renter-occupied |
| 1-Person Household | 93 (55.7%) | 74 (44.3%) |
| 2-Person Household | 122 (71.8%) | 48 (28.2%) |
| 3-Person Household | 28 (43.1%) | 37 (56.9%) |
| 4+ Person Household | 56 (73.7%) | 20 (26.3%) |
| Total Housing Units | 299 (62.5%) | 179 (37.4%) |
Occupancy by Educational Attainment in Victoria
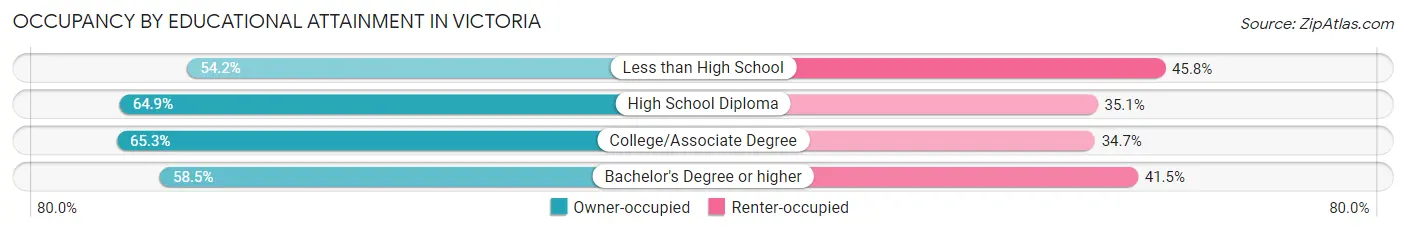
| Household Size | Owner-occupied | Renter-occupied |
| Less than High School | 13 (54.2%) | 11 (45.8%) |
| High School Diploma | 85 (64.9%) | 46 (35.1%) |
| College/Associate Degree | 115 (65.3%) | 61 (34.7%) |
| Bachelor's Degree or higher | 86 (58.5%) | 61 (41.5%) |
Occupancy by Age of Householder in Victoria
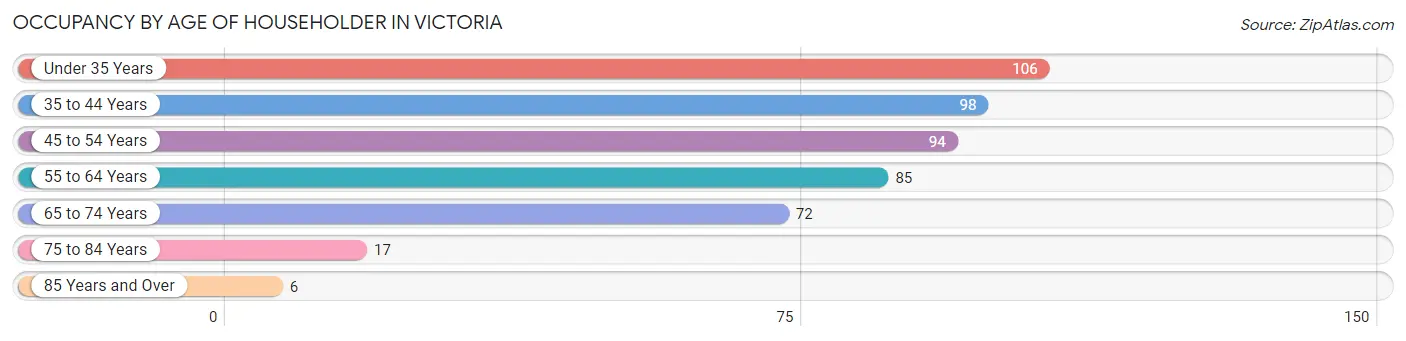
| Age Bracket | # Households | % Households |
| Under 35 Years | 106 | 22.2% |
| 35 to 44 Years | 98 | 20.5% |
| 45 to 54 Years | 94 | 19.7% |
| 55 to 64 Years | 85 | 17.8% |
| 65 to 74 Years | 72 | 15.1% |
| 75 to 84 Years | 17 | 3.6% |
| 85 Years and Over | 6 | 1.3% |
| Total | 478 | 100.0% |
Housing Finances in Victoria
Median Income by Occupancy in Victoria
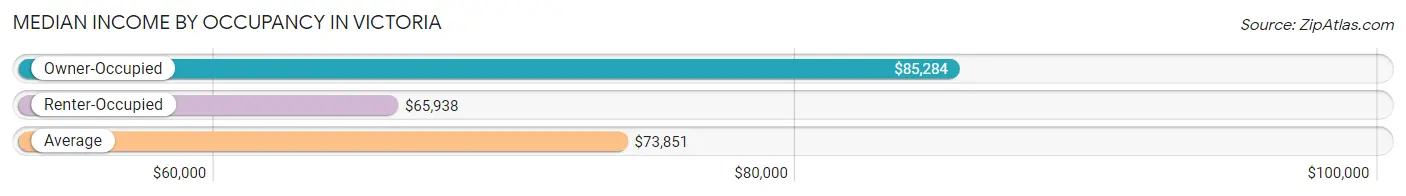
| Occupancy Type | # Households | Median Income |
| Owner-Occupied | 299 (62.5%) | $85,284 |
| Renter-Occupied | 179 (37.4%) | $65,938 |
| Average | 478 (100.0%) | $73,851 |
Occupancy by Householder Income Bracket in Victoria
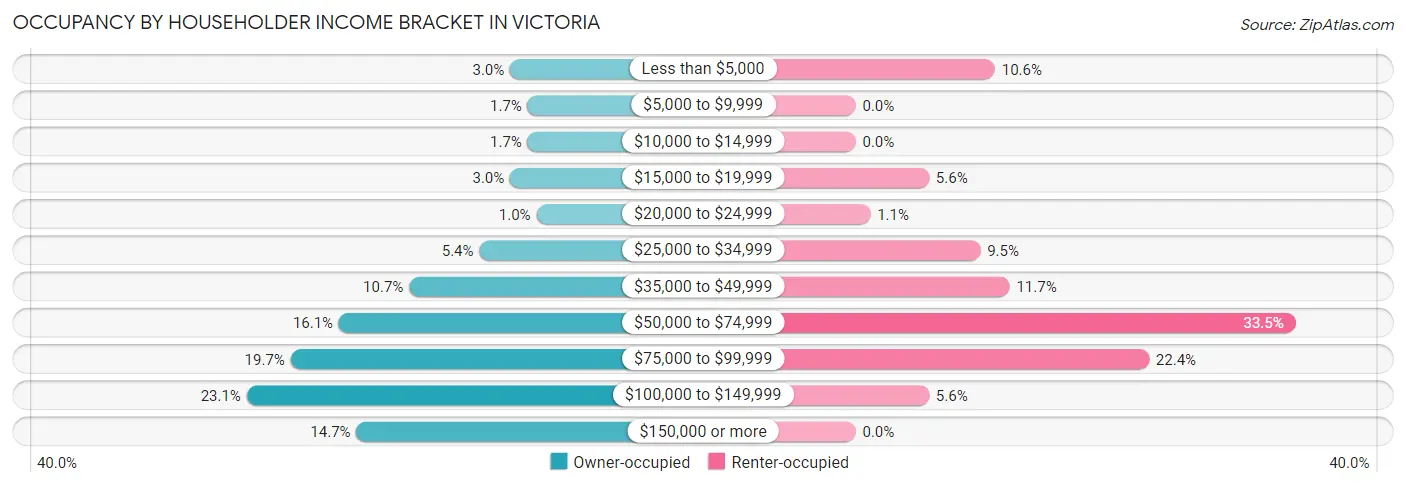
| Income Bracket | Owner-occupied | Renter-occupied |
| Less than $5,000 | 9 (3.0%) | 19 (10.6%) |
| $5,000 to $9,999 | 5 (1.7%) | 0 (0.0%) |
| $10,000 to $14,999 | 5 (1.7%) | 0 (0.0%) |
| $15,000 to $19,999 | 9 (3.0%) | 10 (5.6%) |
| $20,000 to $24,999 | 3 (1.0%) | 2 (1.1%) |
| $25,000 to $34,999 | 16 (5.3%) | 17 (9.5%) |
| $35,000 to $49,999 | 32 (10.7%) | 21 (11.7%) |
| $50,000 to $74,999 | 48 (16.1%) | 60 (33.5%) |
| $75,000 to $99,999 | 59 (19.7%) | 40 (22.4%) |
| $100,000 to $149,999 | 69 (23.1%) | 10 (5.6%) |
| $150,000 or more | 44 (14.7%) | 0 (0.0%) |
| Total | 299 (100.0%) | 179 (100.0%) |
Monthly Housing Cost Tiers in Victoria
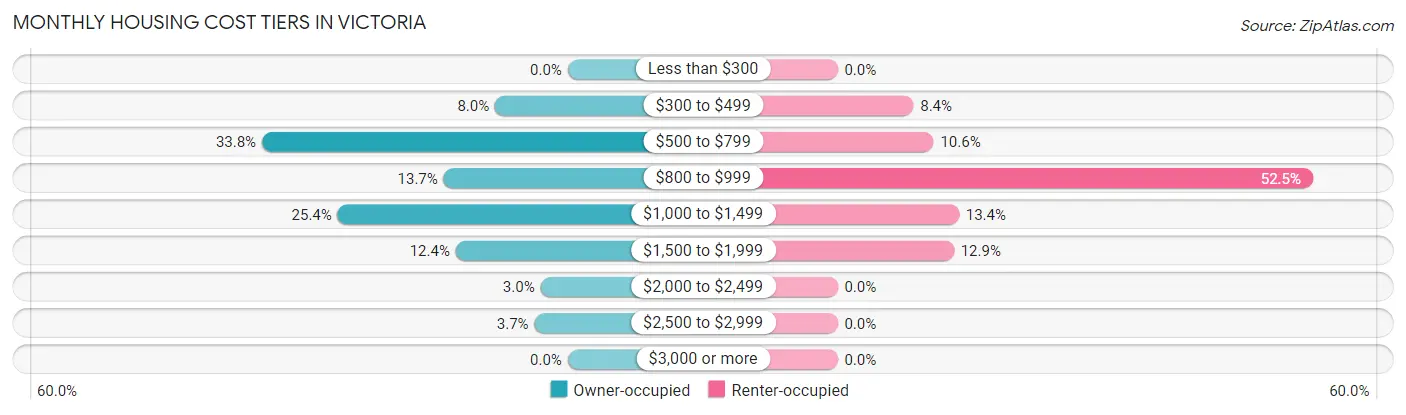
| Monthly Cost | Owner-occupied | Renter-occupied |
| Less than $300 | 0 (0.0%) | 0 (0.0%) |
| $300 to $499 | 24 (8.0%) | 15 (8.4%) |
| $500 to $799 | 101 (33.8%) | 19 (10.6%) |
| $800 to $999 | 41 (13.7%) | 94 (52.5%) |
| $1,000 to $1,499 | 76 (25.4%) | 24 (13.4%) |
| $1,500 to $1,999 | 37 (12.4%) | 23 (12.9%) |
| $2,000 to $2,499 | 9 (3.0%) | 0 (0.0%) |
| $2,500 to $2,999 | 11 (3.7%) | 0 (0.0%) |
| $3,000 or more | 0 (0.0%) | 0 (0.0%) |
| Total | 299 (100.0%) | 179 (100.0%) |
Physical Housing Characteristics in Victoria
Housing Structures in Victoria
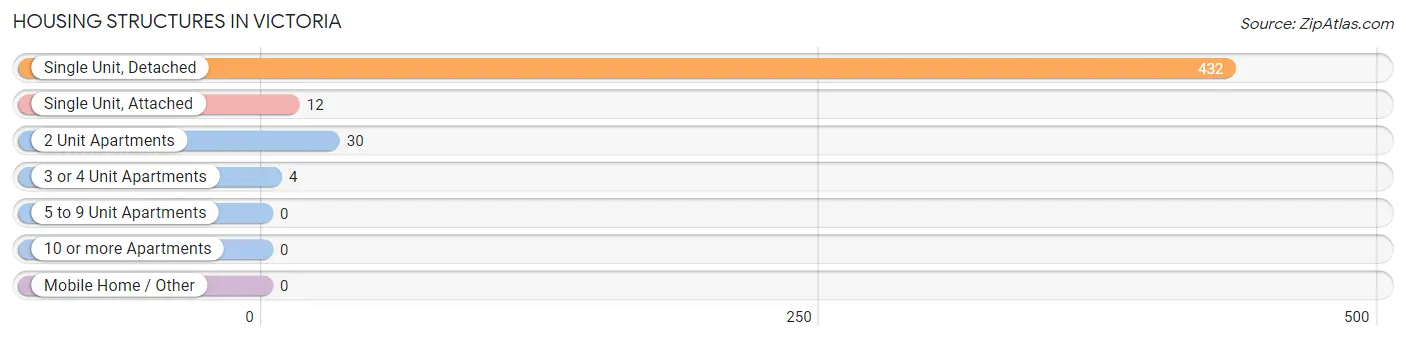
| Structure Type | # Housing Units | % Housing Units |
| Single Unit, Detached | 432 | 90.4% |
| Single Unit, Attached | 12 | 2.5% |
| 2 Unit Apartments | 30 | 6.3% |
| 3 or 4 Unit Apartments | 4 | 0.8% |
| 5 to 9 Unit Apartments | 0 | 0.0% |
| 10 or more Apartments | 0 | 0.0% |
| Mobile Home / Other | 0 | 0.0% |
| Total | 478 | 100.0% |
Housing Structures by Occupancy in Victoria
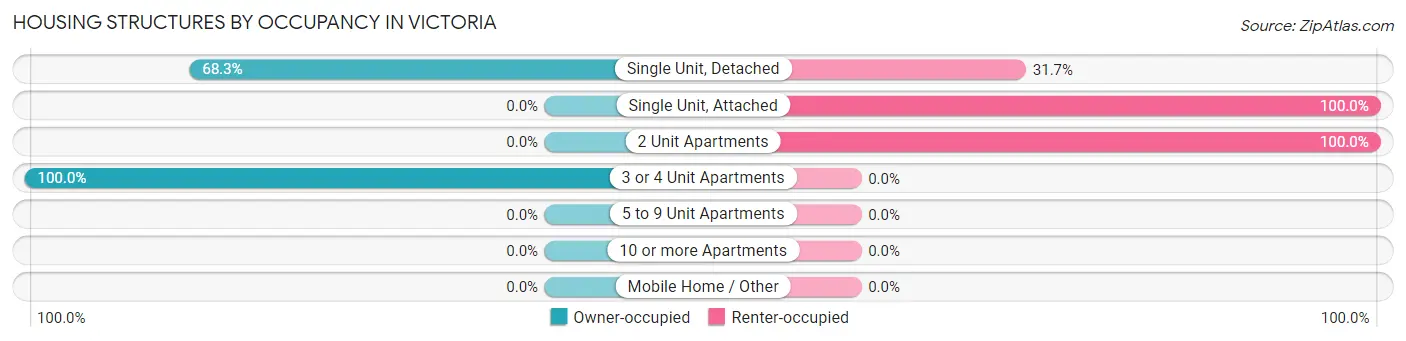
| Structure Type | Owner-occupied | Renter-occupied |
| Single Unit, Detached | 295 (68.3%) | 137 (31.7%) |
| Single Unit, Attached | 0 (0.0%) | 12 (100.0%) |
| 2 Unit Apartments | 0 (0.0%) | 30 (100.0%) |
| 3 or 4 Unit Apartments | 4 (100.0%) | 0 (0.0%) |
| 5 to 9 Unit Apartments | 0 (0.0%) | 0 (0.0%) |
| 10 or more Apartments | 0 (0.0%) | 0 (0.0%) |
| Mobile Home / Other | 0 (0.0%) | 0 (0.0%) |
| Total | 299 (62.5%) | 179 (37.4%) |
Housing Structures by Number of Rooms in Victoria
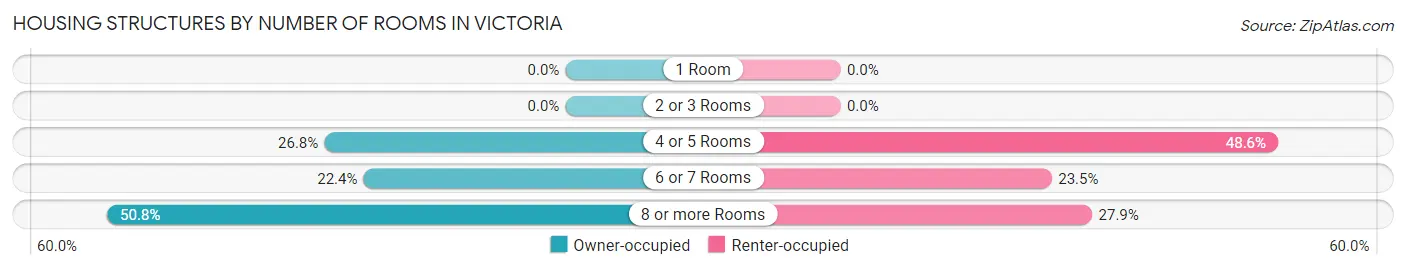
| Number of Rooms | Owner-occupied | Renter-occupied |
| 1 Room | 0 (0.0%) | 0 (0.0%) |
| 2 or 3 Rooms | 0 (0.0%) | 0 (0.0%) |
| 4 or 5 Rooms | 80 (26.8%) | 87 (48.6%) |
| 6 or 7 Rooms | 67 (22.4%) | 42 (23.5%) |
| 8 or more Rooms | 152 (50.8%) | 50 (27.9%) |
| Total | 299 (100.0%) | 179 (100.0%) |
Housing Structure by Heating Type in Victoria
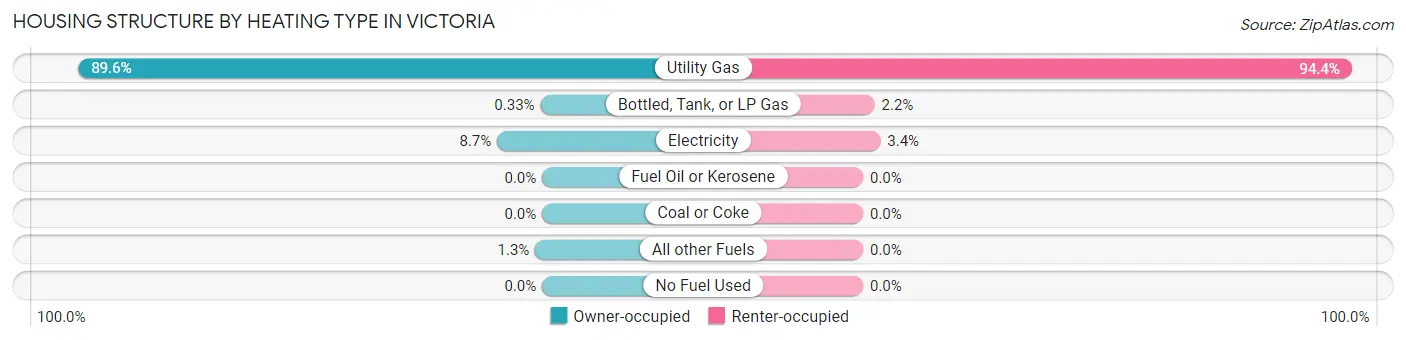
| Heating Type | Owner-occupied | Renter-occupied |
| Utility Gas | 268 (89.6%) | 169 (94.4%) |
| Bottled, Tank, or LP Gas | 1 (0.3%) | 4 (2.2%) |
| Electricity | 26 (8.7%) | 6 (3.4%) |
| Fuel Oil or Kerosene | 0 (0.0%) | 0 (0.0%) |
| Coal or Coke | 0 (0.0%) | 0 (0.0%) |
| All other Fuels | 4 (1.3%) | 0 (0.0%) |
| No Fuel Used | 0 (0.0%) | 0 (0.0%) |
| Total | 299 (100.0%) | 179 (100.0%) |
Household Vehicle Usage in Victoria
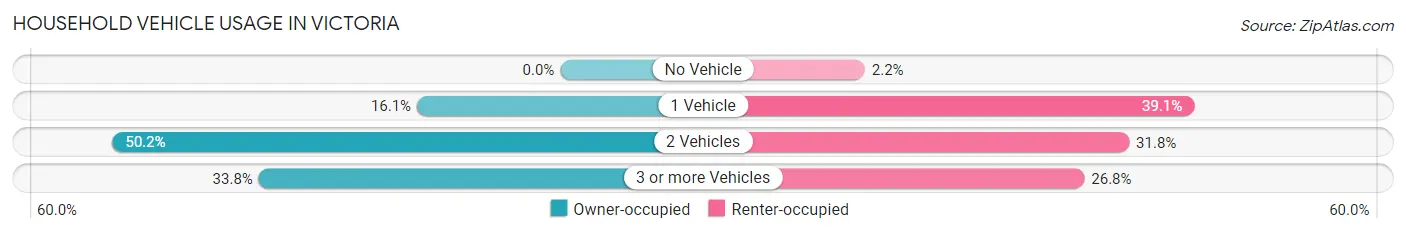
| Vehicles per Household | Owner-occupied | Renter-occupied |
| No Vehicle | 0 (0.0%) | 4 (2.2%) |
| 1 Vehicle | 48 (16.1%) | 70 (39.1%) |
| 2 Vehicles | 150 (50.2%) | 57 (31.8%) |
| 3 or more Vehicles | 101 (33.8%) | 48 (26.8%) |
| Total | 299 (100.0%) | 179 (100.0%) |
Real Estate & Mortgages in Victoria
Real Estate and Mortgage Overview in Victoria
| Characteristic | Without Mortgage | With Mortgage |
| Housing Units | 119 | 180 |
| Median Property Value | $175,500 | $151,500 |
| Median Household Income | $72,321 | $32 |
| Monthly Housing Costs | $596 | $0 |
| Real Estate Taxes | $2,628 | $0 |
Property Value by Mortgage Status in Victoria
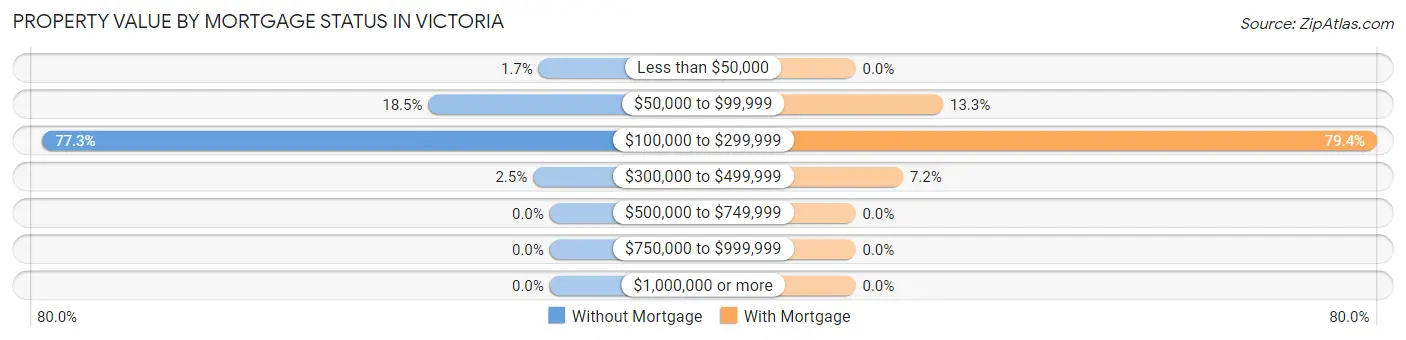
| Property Value | Without Mortgage | With Mortgage |
| Less than $50,000 | 2 (1.7%) | 0 (0.0%) |
| $50,000 to $99,999 | 22 (18.5%) | 24 (13.3%) |
| $100,000 to $299,999 | 92 (77.3%) | 143 (79.4%) |
| $300,000 to $499,999 | 3 (2.5%) | 13 (7.2%) |
| $500,000 to $749,999 | 0 (0.0%) | 0 (0.0%) |
| $750,000 to $999,999 | 0 (0.0%) | 0 (0.0%) |
| $1,000,000 or more | 0 (0.0%) | 0 (0.0%) |
| Total | 119 (100.0%) | 180 (100.0%) |
Household Income by Mortgage Status in Victoria
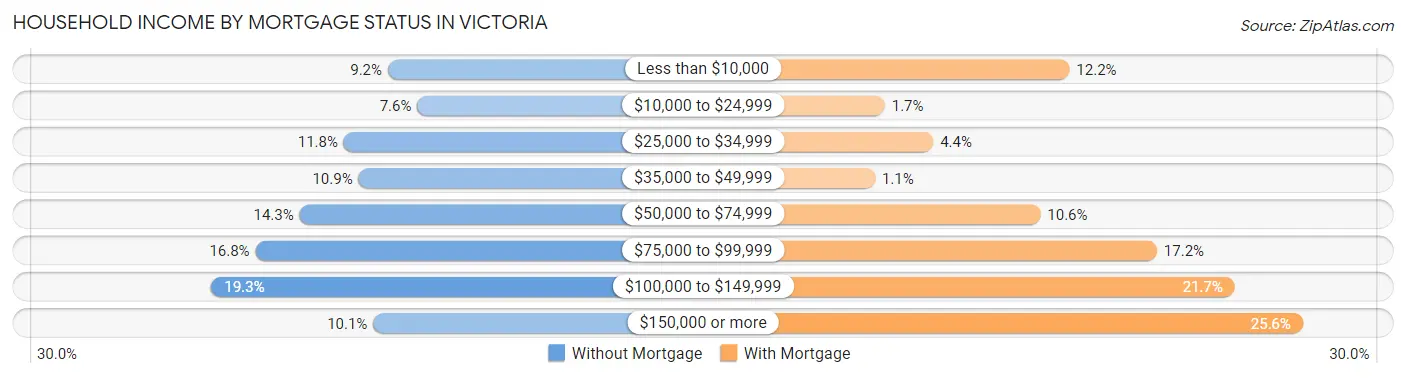
| Household Income | Without Mortgage | With Mortgage |
| Less than $10,000 | 11 (9.2%) | 22 (12.2%) |
| $10,000 to $24,999 | 9 (7.6%) | 3 (1.7%) |
| $25,000 to $34,999 | 14 (11.8%) | 8 (4.4%) |
| $35,000 to $49,999 | 13 (10.9%) | 2 (1.1%) |
| $50,000 to $74,999 | 17 (14.3%) | 19 (10.6%) |
| $75,000 to $99,999 | 20 (16.8%) | 31 (17.2%) |
| $100,000 to $149,999 | 23 (19.3%) | 39 (21.7%) |
| $150,000 or more | 12 (10.1%) | 46 (25.6%) |
| Total | 119 (100.0%) | 180 (100.0%) |
Property Value to Household Income Ratio in Victoria
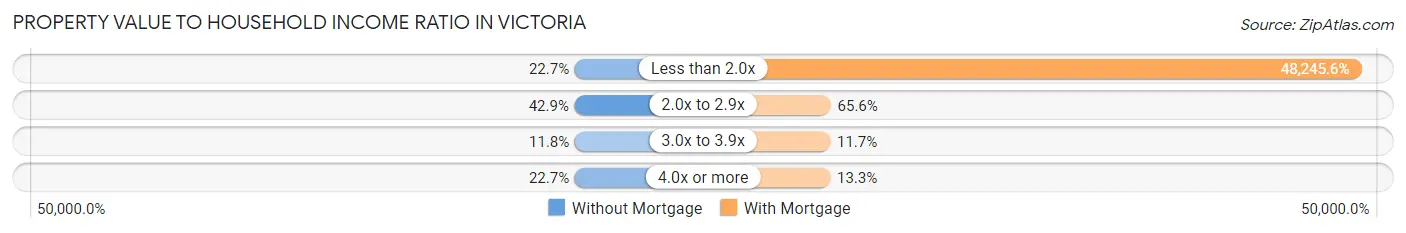
| Value-to-Income Ratio | Without Mortgage | With Mortgage |
| Less than 2.0x | 27 (22.7%) | 86,842 (48,245.6%) |
| 2.0x to 2.9x | 51 (42.9%) | 118 (65.6%) |
| 3.0x to 3.9x | 14 (11.8%) | 21 (11.7%) |
| 4.0x or more | 27 (22.7%) | 24 (13.3%) |
| Total | 119 (100.0%) | 180 (100.0%) |
Real Estate Taxes by Mortgage Status in Victoria
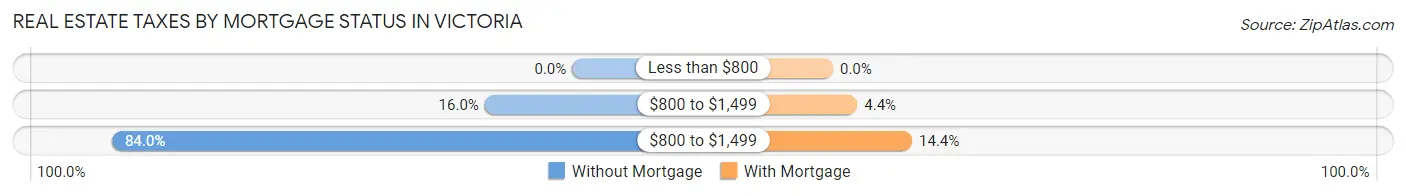
| Property Taxes | Without Mortgage | With Mortgage |
| Less than $800 | 0 (0.0%) | 0 (0.0%) |
| $800 to $1,499 | 19 (16.0%) | 8 (4.4%) |
| $800 to $1,499 | 100 (84.0%) | 26 (14.4%) |
| Total | 119 (100.0%) | 180 (100.0%) |
Health & Disability in Victoria
Health Insurance Coverage by Age in Victoria
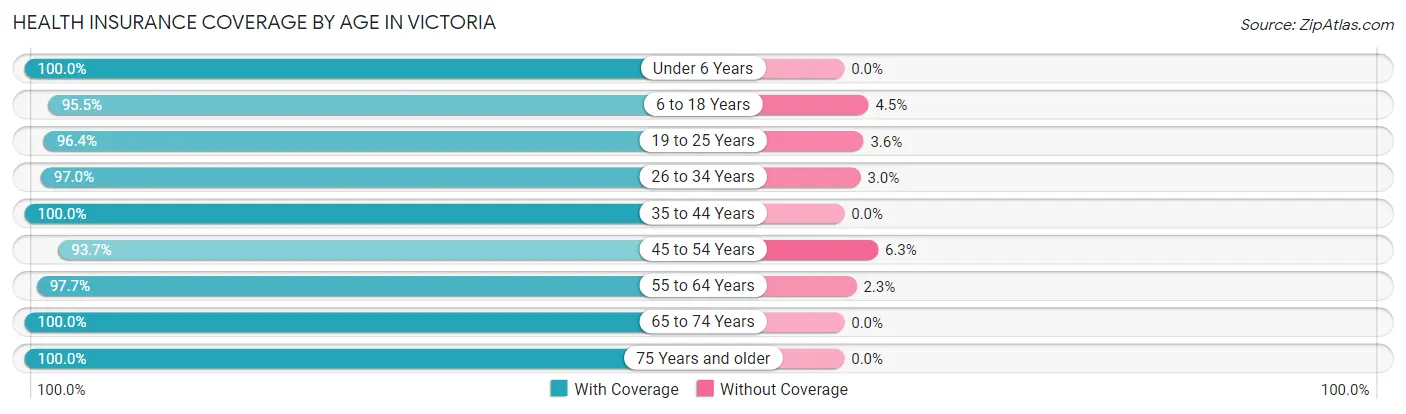
| Age Bracket | With Coverage | Without Coverage |
| Under 6 Years | 83 (100.0%) | 0 (0.0%) |
| 6 to 18 Years | 127 (95.5%) | 6 (4.5%) |
| 19 to 25 Years | 108 (96.4%) | 4 (3.6%) |
| 26 to 34 Years | 128 (97.0%) | 4 (3.0%) |
| 35 to 44 Years | 127 (100.0%) | 0 (0.0%) |
| 45 to 54 Years | 149 (93.7%) | 10 (6.3%) |
| 55 to 64 Years | 129 (97.7%) | 3 (2.3%) |
| 65 to 74 Years | 100 (100.0%) | 0 (0.0%) |
| 75 Years and older | 29 (100.0%) | 0 (0.0%) |
| Total | 980 (97.3%) | 27 (2.7%) |
Health Insurance Coverage by Citizenship Status in Victoria
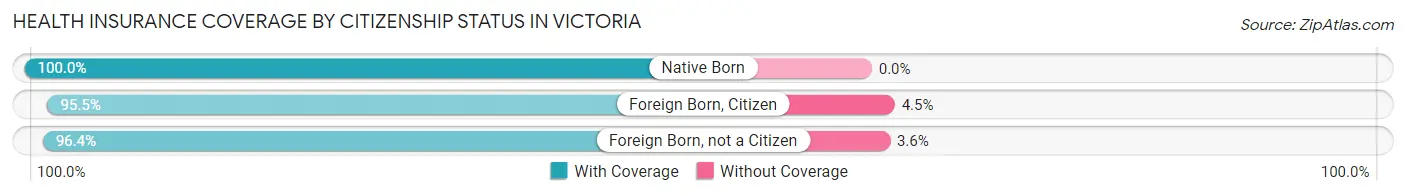
| Citizenship Status | With Coverage | Without Coverage |
| Native Born | 83 (100.0%) | 0 (0.0%) |
| Foreign Born, Citizen | 127 (95.5%) | 6 (4.5%) |
| Foreign Born, not a Citizen | 108 (96.4%) | 4 (3.6%) |
Health Insurance Coverage by Household Income in Victoria
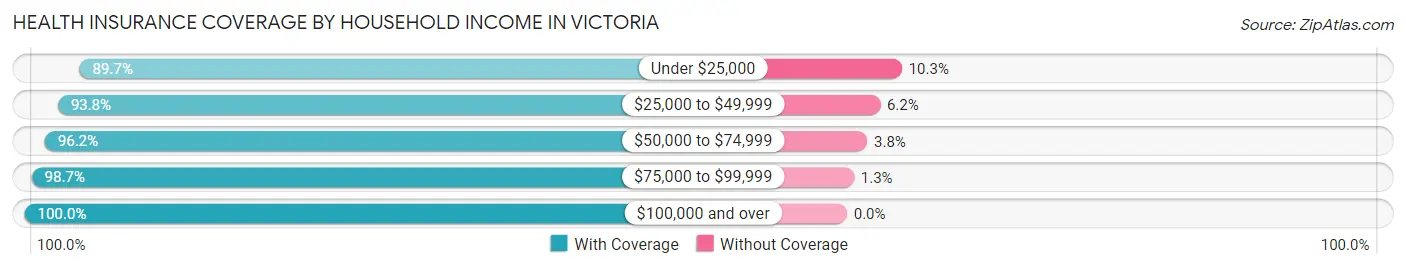
| Household Income | With Coverage | Without Coverage |
| Under $25,000 | 61 (89.7%) | 7 (10.3%) |
| $25,000 to $49,999 | 166 (93.8%) | 11 (6.2%) |
| $50,000 to $74,999 | 152 (96.2%) | 6 (3.8%) |
| $75,000 to $99,999 | 225 (98.7%) | 3 (1.3%) |
| $100,000 and over | 358 (100.0%) | 0 (0.0%) |
Public vs Private Health Insurance Coverage by Age in Victoria
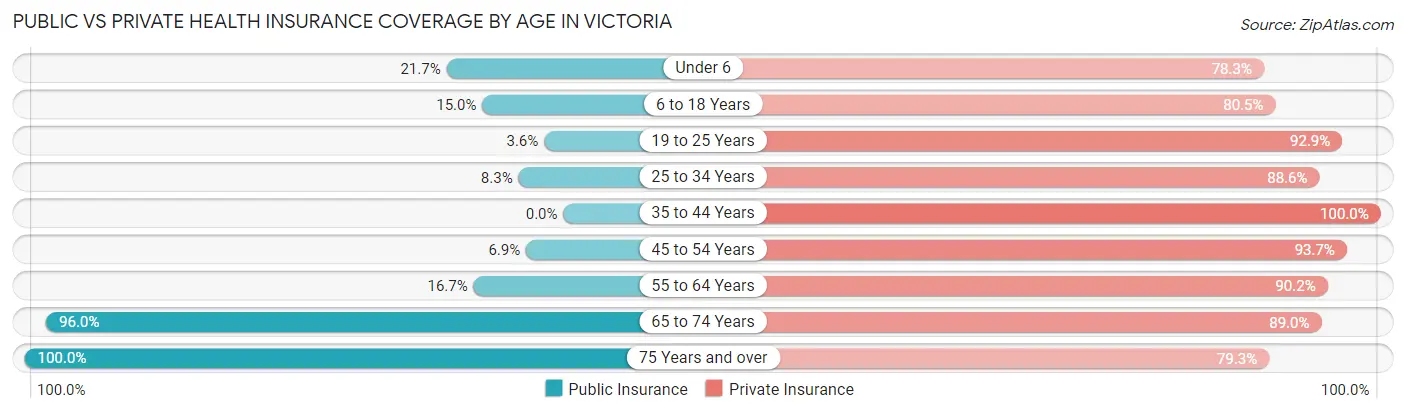
| Age Bracket | Public Insurance | Private Insurance |
| Under 6 | 18 (21.7%) | 65 (78.3%) |
| 6 to 18 Years | 20 (15.0%) | 107 (80.4%) |
| 19 to 25 Years | 4 (3.6%) | 104 (92.9%) |
| 25 to 34 Years | 11 (8.3%) | 117 (88.6%) |
| 35 to 44 Years | 0 (0.0%) | 127 (100.0%) |
| 45 to 54 Years | 11 (6.9%) | 149 (93.7%) |
| 55 to 64 Years | 22 (16.7%) | 119 (90.1%) |
| 65 to 74 Years | 96 (96.0%) | 89 (89.0%) |
| 75 Years and over | 29 (100.0%) | 23 (79.3%) |
| Total | 211 (20.9%) | 900 (89.4%) |
Disability Status by Sex by Age in Victoria
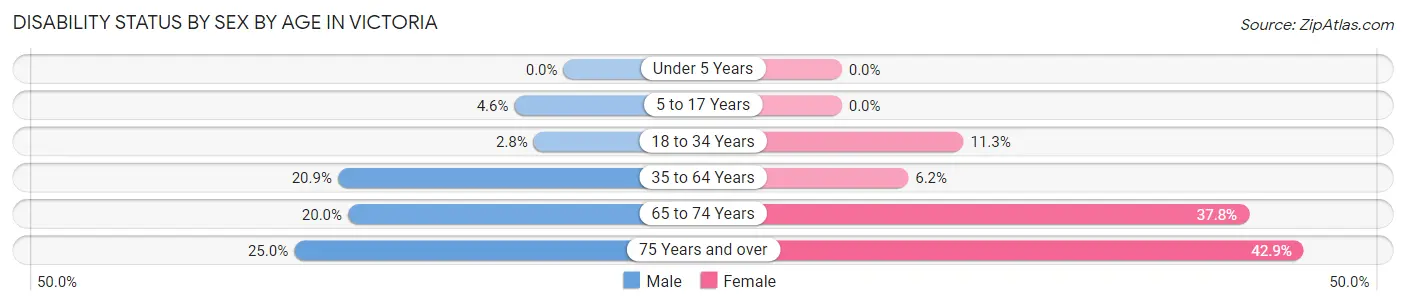
| Age Bracket | Male | Female |
| Under 5 Years | 0 (0.0%) | 0 (0.0%) |
| 5 to 17 Years | 3 (4.5%) | 0 (0.0%) |
| 18 to 34 Years | 4 (2.8%) | 13 (11.3%) |
| 35 to 64 Years | 40 (20.9%) | 14 (6.2%) |
| 65 to 74 Years | 11 (20.0%) | 17 (37.8%) |
| 75 Years and over | 2 (25.0%) | 9 (42.9%) |
Disability Class by Sex by Age in Victoria
Disability Class: Hearing Difficulty
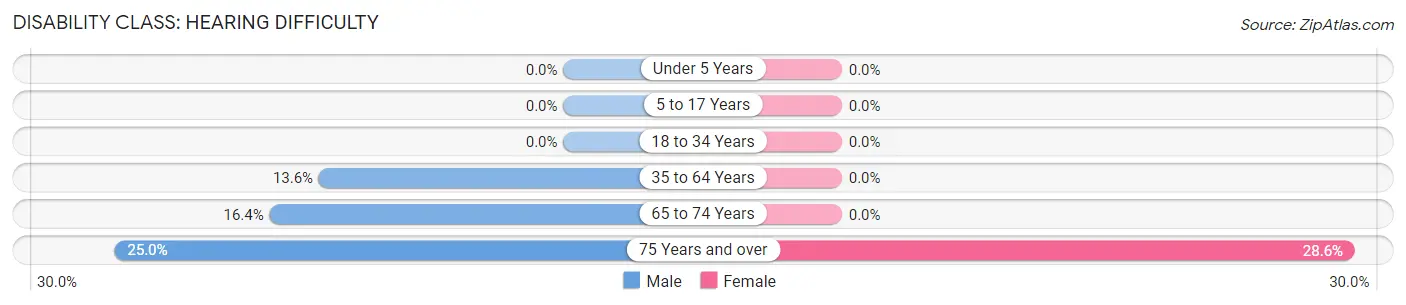
| Age Bracket | Male | Female |
| Under 5 Years | 0 (0.0%) | 0 (0.0%) |
| 5 to 17 Years | 0 (0.0%) | 0 (0.0%) |
| 18 to 34 Years | 0 (0.0%) | 0 (0.0%) |
| 35 to 64 Years | 26 (13.6%) | 0 (0.0%) |
| 65 to 74 Years | 9 (16.4%) | 0 (0.0%) |
| 75 Years and over | 2 (25.0%) | 6 (28.6%) |
Disability Class: Vision Difficulty
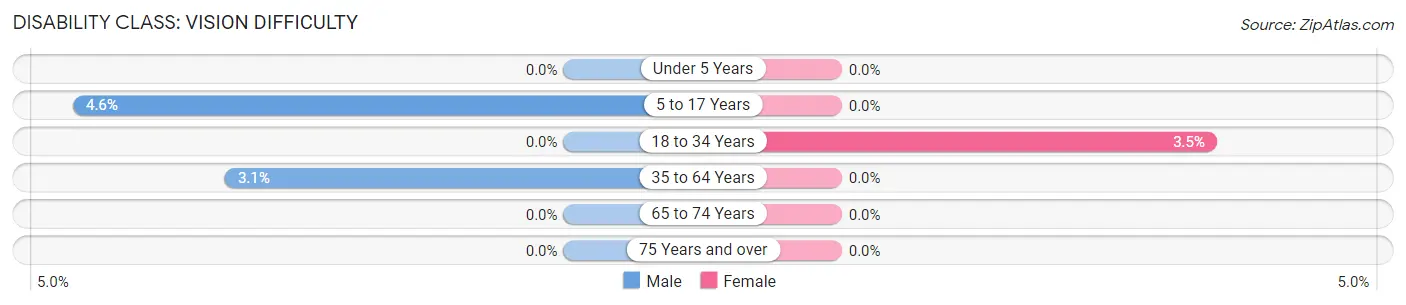
| Age Bracket | Male | Female |
| Under 5 Years | 0 (0.0%) | 0 (0.0%) |
| 5 to 17 Years | 3 (4.5%) | 0 (0.0%) |
| 18 to 34 Years | 0 (0.0%) | 4 (3.5%) |
| 35 to 64 Years | 6 (3.1%) | 0 (0.0%) |
| 65 to 74 Years | 0 (0.0%) | 0 (0.0%) |
| 75 Years and over | 0 (0.0%) | 0 (0.0%) |
Disability Class: Cognitive Difficulty
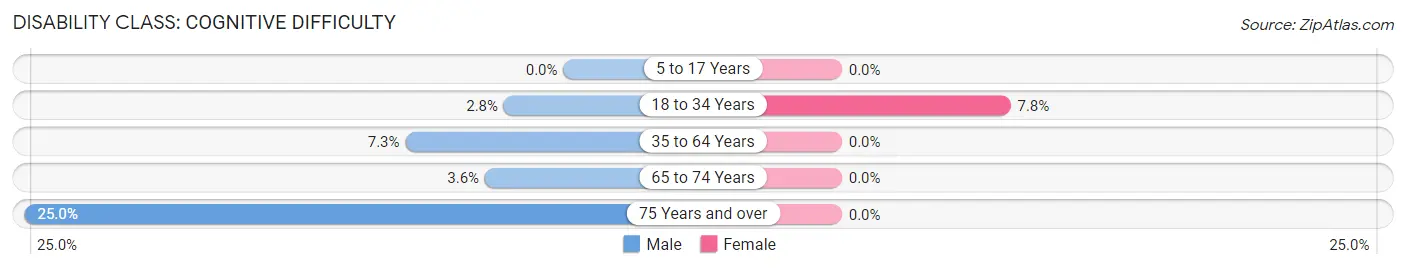
| Age Bracket | Male | Female |
| 5 to 17 Years | 0 (0.0%) | 0 (0.0%) |
| 18 to 34 Years | 4 (2.8%) | 9 (7.8%) |
| 35 to 64 Years | 14 (7.3%) | 0 (0.0%) |
| 65 to 74 Years | 2 (3.6%) | 0 (0.0%) |
| 75 Years and over | 2 (25.0%) | 0 (0.0%) |
Disability Class: Ambulatory Difficulty
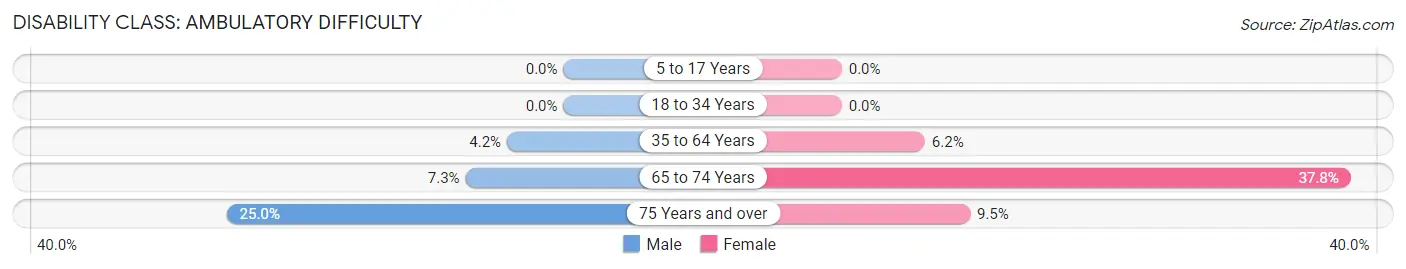
| Age Bracket | Male | Female |
| 5 to 17 Years | 0 (0.0%) | 0 (0.0%) |
| 18 to 34 Years | 0 (0.0%) | 0 (0.0%) |
| 35 to 64 Years | 8 (4.2%) | 14 (6.2%) |
| 65 to 74 Years | 4 (7.3%) | 17 (37.8%) |
| 75 Years and over | 2 (25.0%) | 2 (9.5%) |
Disability Class: Self-Care Difficulty
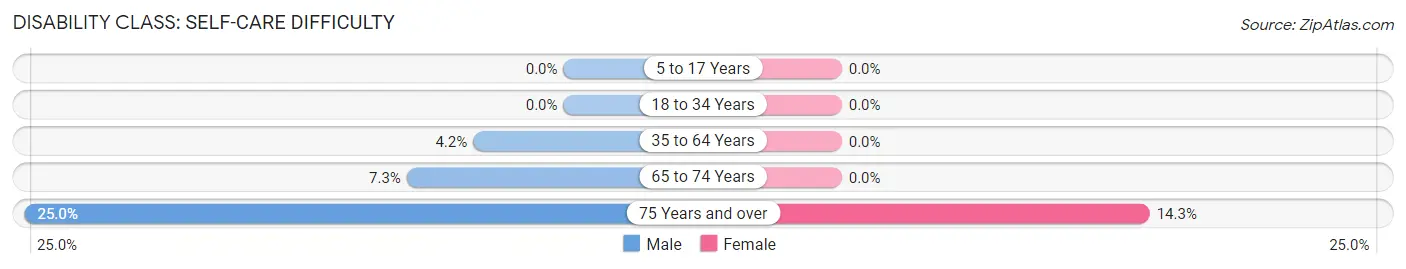
| Age Bracket | Male | Female |
| 5 to 17 Years | 0 (0.0%) | 0 (0.0%) |
| 18 to 34 Years | 0 (0.0%) | 0 (0.0%) |
| 35 to 64 Years | 8 (4.2%) | 0 (0.0%) |
| 65 to 74 Years | 4 (7.3%) | 0 (0.0%) |
| 75 Years and over | 2 (25.0%) | 3 (14.3%) |
Technology Access in Victoria
Computing Device Access in Victoria
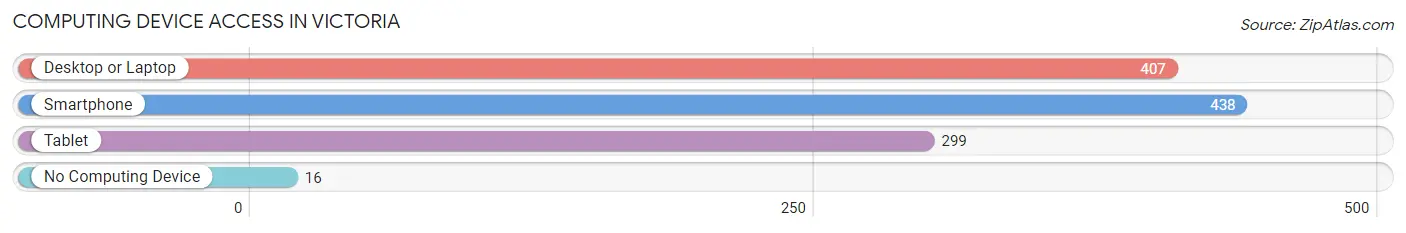
| Device Type | # Households | % Households |
| Desktop or Laptop | 407 | 85.2% |
| Smartphone | 438 | 91.6% |
| Tablet | 299 | 62.5% |
| No Computing Device | 16 | 3.4% |
| Total | 478 | 100.0% |
Internet Access in Victoria
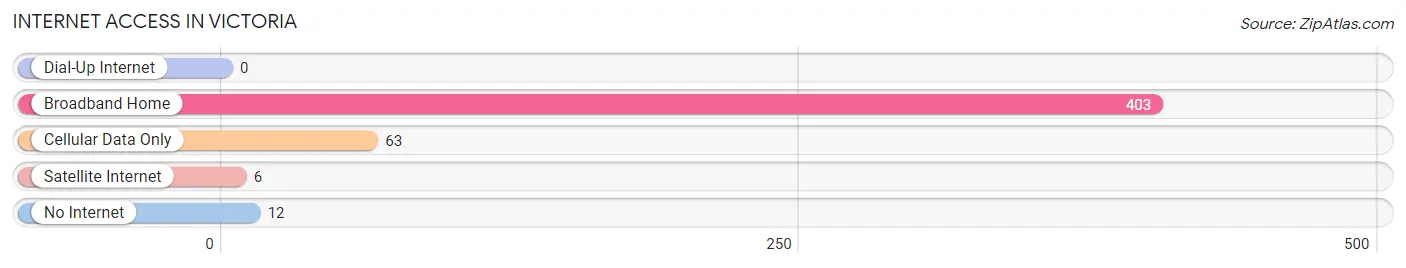
| Internet Type | # Households | % Households |
| Dial-Up Internet | 0 | 0.0% |
| Broadband Home | 403 | 84.3% |
| Cellular Data Only | 63 | 13.2% |
| Satellite Internet | 6 | 1.3% |
| No Internet | 12 | 2.5% |
| Total | 478 | 100.0% |
Victoria Summary
Victoria is a small city located in central Kansas, in the county of Ellsworth. It is situated on the Smoky Hill River, and is part of the Salina Metropolitan Statistical Area. The city has a population of 1,845 people, according to the 2010 census.
Geography
Victoria is located in the Smoky Hills region of Kansas, which is characterized by rolling hills and prairies. The city is situated on the Smoky Hill River, and is surrounded by agricultural land. The city is located at an elevation of 1,541 feet above sea level. The climate in Victoria is characterized by hot, humid summers and cold, dry winters.
History
Victoria was founded in 1871 by a group of German immigrants. The city was named after Queen Victoria of England. The city was incorporated in 1887, and the first post office was established in 1891. The city grew rapidly in the late 19th and early 20th centuries, and by 1910, the population had reached 1,845.
Economy
Victoria’s economy is largely based on agriculture. The city is home to several grain elevators, and the surrounding area is used for growing wheat, corn, and other crops. The city also has a small manufacturing sector, which includes a few small factories.
Demographics
According to the 2010 census, the population of Victoria was 1,845. The racial makeup of the city was 95.3% White, 0.7% African American, 0.3% Native American, 0.2% Asian, 0.1% Pacific Islander, and 3.4% from other races. The median household income was $41,250, and the median family income was $50,000.
Conclusion
Victoria is a small city located in central Kansas, in the county of Ellsworth. It is situated on the Smoky Hill River, and is part of the Salina Metropolitan Statistical Area. The city has a population of 1,845 people, according to the 2010 census. The economy of Victoria is largely based on agriculture, and the city is home to several grain elevators. The racial makeup of the city is predominantly White, with a small percentage of African American, Native American, Asian, and Pacific Islander residents. The median household income is $41,250, and the median family income is $50,000.
Common Questions
What is Per Capita Income in Victoria?
Per Capita income in Victoria is $36,548.
What is the Median Family Income in Victoria?
Median Family Income in Victoria is $90,278.
What is the Median Household income in Victoria?
Median Household Income in Victoria is $73,851.
What is Income or Wage Gap in Victoria?
Income or Wage Gap in Victoria is 28.2%.
Women in Victoria earn 71.8 cents for every dollar earned by a man.
What is Family Income Deficit in Victoria?
Family Income Deficit in Victoria is $6,033.
Families that are below poverty line in Victoria earn $6,033 less on average than the poverty threshold level.
What is Inequality or Gini Index in Victoria?
Inequality or Gini Index in Victoria is 0.36.
What is the Total Population of Victoria?
Total Population of Victoria is 1,027.
What is the Total Male Population of Victoria?
Total Male Population of Victoria is 514.
What is the Total Female Population of Victoria?
Total Female Population of Victoria is 513.
What is the Ratio of Males per 100 Females in Victoria?
There are 100.19 Males per 100 Females in Victoria.
What is the Ratio of Females per 100 Males in Victoria?
There are 99.81 Females per 100 Males in Victoria.
What is the Median Population Age in Victoria?
Median Population Age in Victoria is 38.5 Years.
What is the Average Family Size in Victoria
Average Family Size in Victoria is 2.7 People.
What is the Average Household Size in Victoria
Average Household Size in Victoria is 2.1 People.
How Large is the Labor Force in Victoria?
There are 652 People in the Labor Forcein in Victoria.
What is the Percentage of People in the Labor Force in Victoria?
77.5% of People are in the Labor Force in Victoria.
What is the Unemployment Rate in Victoria?
Unemployment Rate in Victoria is 1.7%.