Uniontown, KS Map & Demographics
Uniontown Map
Uniontown Overview
$16,862
PER CAPITA INCOME
$52,292
AVG FAMILY INCOME
$50,179
AVG HOUSEHOLD INCOME
0.39
INEQUALITY / GINI INDEX
356
TOTAL POPULATION
146
MALE POPULATION
210
FEMALE POPULATION
69.52
MALES / 100 FEMALES
143.84
FEMALES / 100 MALES
16.0
MEDIAN AGE
5.0
AVG FAMILY SIZE
3.8
AVG HOUSEHOLD SIZE
111
LABOR FORCE [ PEOPLE ]
62.4%
PERCENT IN LABOR FORCE
3.6%
UNEMPLOYMENT RATE
Uniontown Zip Codes
Uniontown Area Codes
Income in Uniontown
Income Overview in Uniontown
Per Capita Income in Uniontown is $16,862, while median incomes of families and households are $52,292 and $50,179 respectively.
| Characteristic | Number | Measure |
| Per Capita Income | 356 | $16,862 |
| Median Family Income | 61 | $52,292 |
| Mean Family Income | 61 | $54,936 |
| Median Household Income | 95 | $50,179 |
| Mean Household Income | 95 | $53,040 |
| Income Deficit | 61 | $0 |
| Wage / Income Gap (%) | 356 | 0.00% |
| Wage / Income Gap ($) | 356 | 100.00¢ per $1 |
| Gini / Inequality Index | 356 | 0.39 |
Earnings by Sex in Uniontown
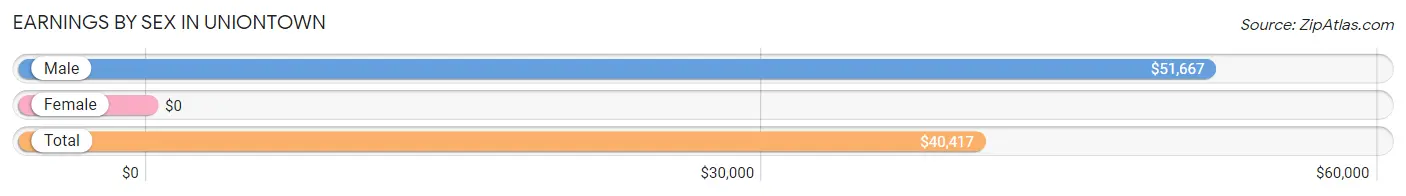
| Sex | Number | Average Earnings |
| Male | 64 (52.0%) | $51,667 |
| Female | 59 (48.0%) | $0 |
| Total | 123 (100.0%) | $40,417 |
Earnings by Sex by Income Bracket in Uniontown
The most common earnings brackets in Uniontown are $55,000 to $64,999 for men (14 | 21.9%) and $2,499 or less for women (11 | 18.6%).
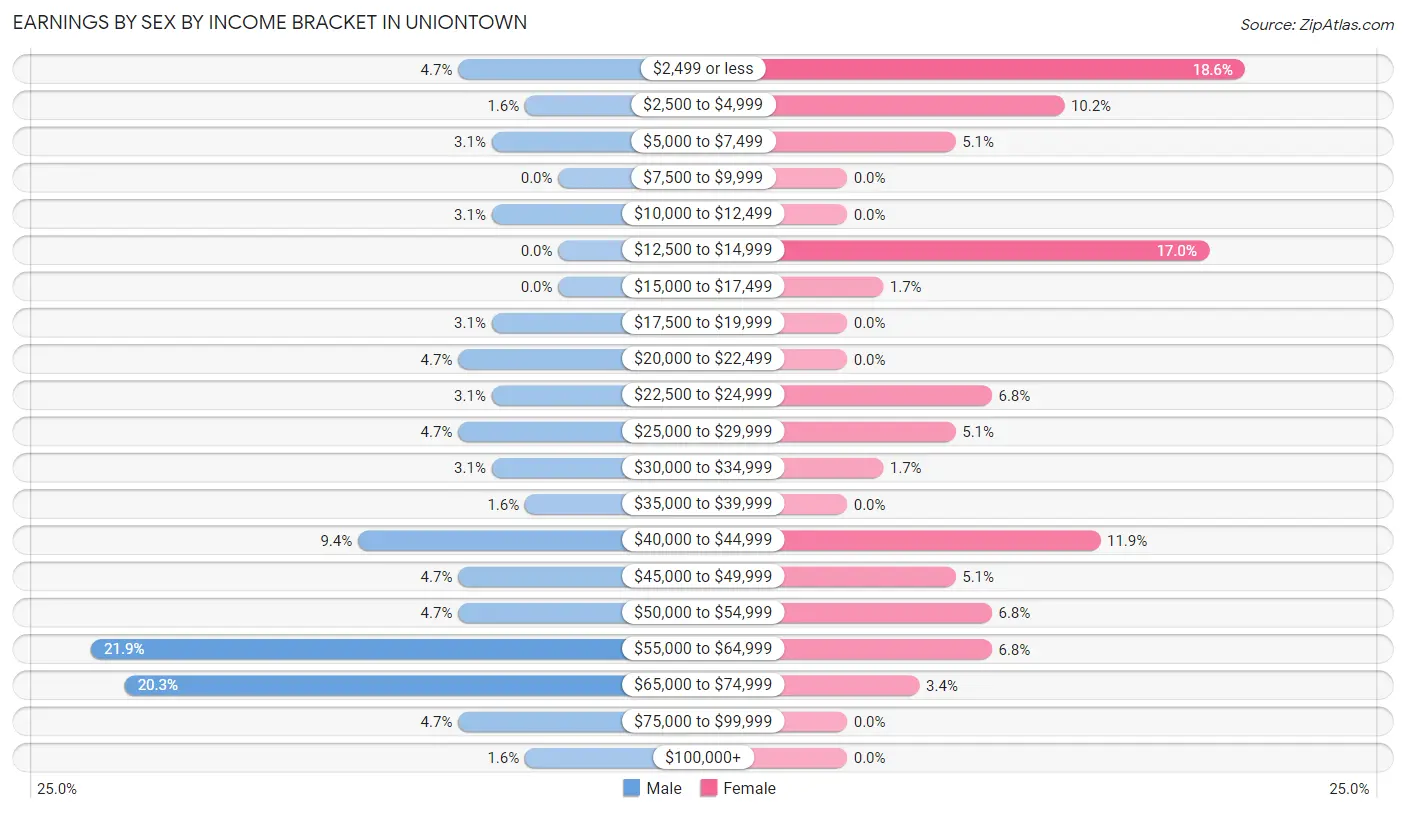
| Income | Male | Female |
| $2,499 or less | 3 (4.7%) | 11 (18.6%) |
| $2,500 to $4,999 | 1 (1.6%) | 6 (10.2%) |
| $5,000 to $7,499 | 2 (3.1%) | 3 (5.1%) |
| $7,500 to $9,999 | 0 (0.0%) | 0 (0.0%) |
| $10,000 to $12,499 | 2 (3.1%) | 0 (0.0%) |
| $12,500 to $14,999 | 0 (0.0%) | 10 (17.0%) |
| $15,000 to $17,499 | 0 (0.0%) | 1 (1.7%) |
| $17,500 to $19,999 | 2 (3.1%) | 0 (0.0%) |
| $20,000 to $22,499 | 3 (4.7%) | 0 (0.0%) |
| $22,500 to $24,999 | 2 (3.1%) | 4 (6.8%) |
| $25,000 to $29,999 | 3 (4.7%) | 3 (5.1%) |
| $30,000 to $34,999 | 2 (3.1%) | 1 (1.7%) |
| $35,000 to $39,999 | 1 (1.6%) | 0 (0.0%) |
| $40,000 to $44,999 | 6 (9.4%) | 7 (11.9%) |
| $45,000 to $49,999 | 3 (4.7%) | 3 (5.1%) |
| $50,000 to $54,999 | 3 (4.7%) | 4 (6.8%) |
| $55,000 to $64,999 | 14 (21.9%) | 4 (6.8%) |
| $65,000 to $74,999 | 13 (20.3%) | 2 (3.4%) |
| $75,000 to $99,999 | 3 (4.7%) | 0 (0.0%) |
| $100,000+ | 1 (1.6%) | 0 (0.0%) |
| Total | 64 (100.0%) | 59 (100.0%) |
Earnings by Sex by Educational Attainment in Uniontown
Average earnings in Uniontown are $45,833 for men and $23,750 for women, a difference of 48.2%. Men with an educational attainment of college or associate's degree enjoy the highest average annual earnings of $60,893, while those with high school diploma education earn the least with $40,250. Women with an educational attainment of graduate degree earn the most with the average annual earnings of $58,125, while those with high school diploma education have the smallest earnings of $2,499.
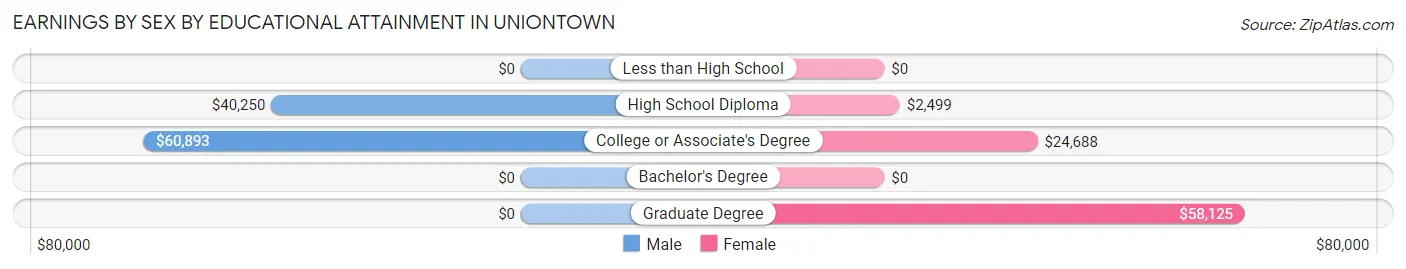
| Educational Attainment | Male Income | Female Income |
| Less than High School | - | - |
| High School Diploma | $40,250 | $2,499 |
| College or Associate's Degree | $60,893 | $24,688 |
| Bachelor's Degree | - | - |
| Graduate Degree | - | - |
| Total | $45,833 | $23,750 |
Family Income in Uniontown
Family Income Brackets in Uniontown
According to the Uniontown family income data, there are 25 families falling into the $50,000 to $74,999 income range, which is the most common income bracket and makes up 41.0% of all families.
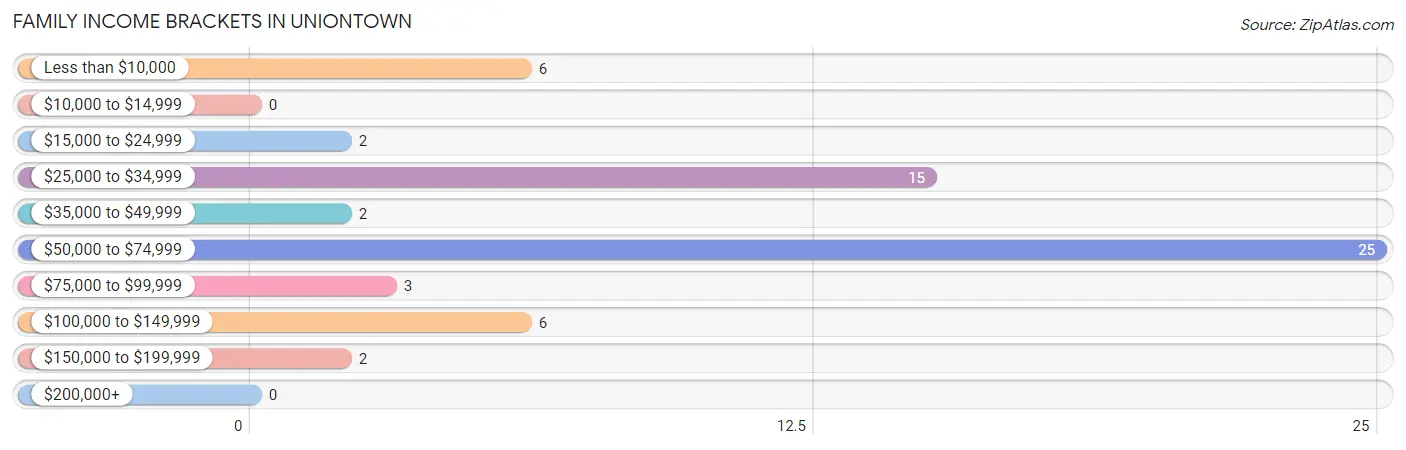
| Income Bracket | # Families | % Families |
| Less than $10,000 | 6 | 9.8% |
| $10,000 to $14,999 | 0 | 0.0% |
| $15,000 to $24,999 | 2 | 3.3% |
| $25,000 to $34,999 | 15 | 24.6% |
| $35,000 to $49,999 | 2 | 3.3% |
| $50,000 to $74,999 | 25 | 41.0% |
| $75,000 to $99,999 | 3 | 4.9% |
| $100,000 to $149,999 | 6 | 9.8% |
| $150,000 to $199,999 | 2 | 3.3% |
| $200,000+ | 0 | 0.0% |
Family Income by Famaliy Size in Uniontown
4-person families (7 | 11.5%) account for the highest median family income in Uniontown with $75,625 per family, while 3-person families (15 | 24.6%) have the highest median income of $20,083 per family member.
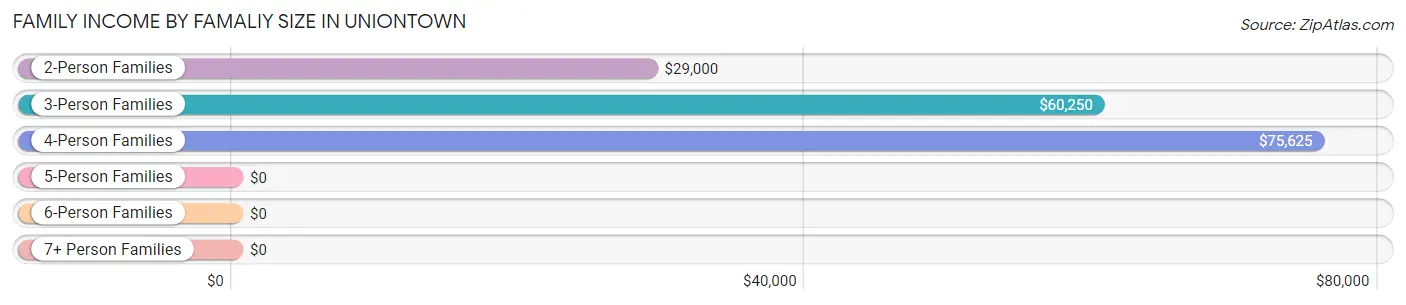
| Income Bracket | # Families | Median Income |
| 2-Person Families | 28 (45.9%) | $29,000 |
| 3-Person Families | 15 (24.6%) | $60,250 |
| 4-Person Families | 7 (11.5%) | $75,625 |
| 5-Person Families | 4 (6.6%) | $0 |
| 6-Person Families | 7 (11.5%) | $0 |
| 7+ Person Families | 0 (0.0%) | $0 |
| Total | 61 (100.0%) | $52,292 |
Family Income by Number of Earners in Uniontown
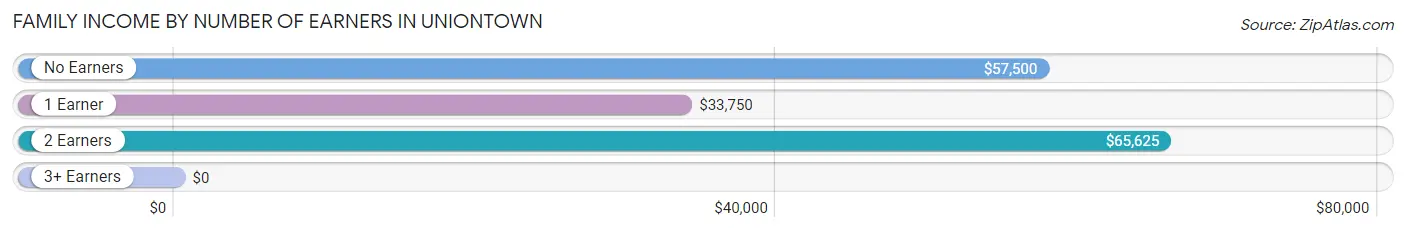
| Number of Earners | # Families | Median Income |
| No Earners | 4 (6.6%) | $57,500 |
| 1 Earner | 38 (62.3%) | $33,750 |
| 2 Earners | 17 (27.9%) | $65,625 |
| 3+ Earners | 2 (3.3%) | $0 |
| Total | 61 (100.0%) | $52,292 |
Household Income in Uniontown
Household Income Brackets in Uniontown
With 29 households falling in the category, the $50,000 to $74,999 income range is the most frequent in Uniontown, accounting for 30.5% of all households.
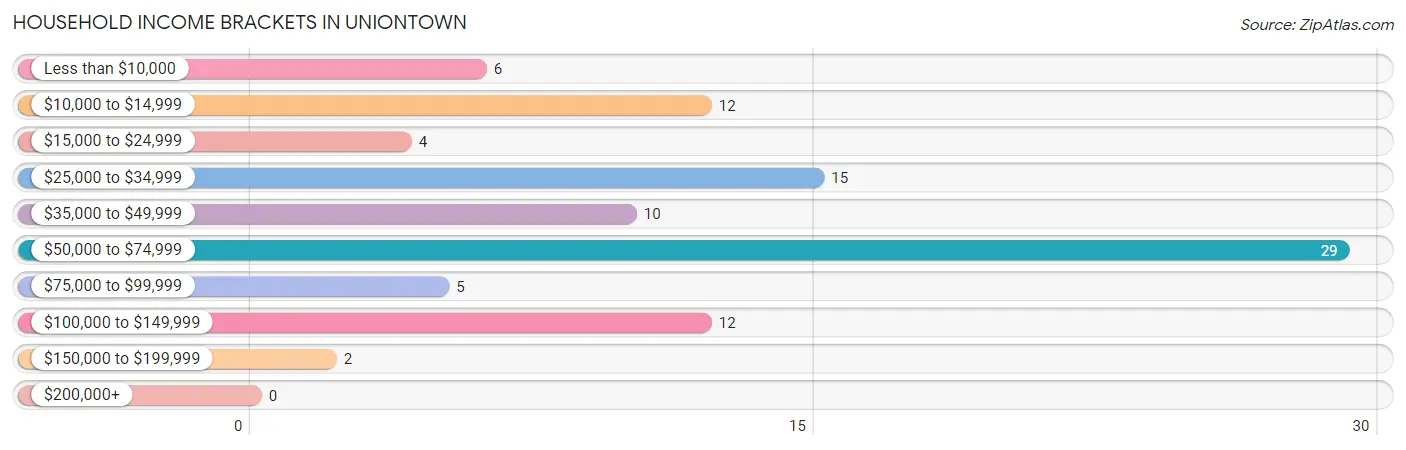
| Income Bracket | # Households | % Households |
| Less than $10,000 | 6 | 6.3% |
| $10,000 to $14,999 | 12 | 12.6% |
| $15,000 to $24,999 | 4 | 4.2% |
| $25,000 to $34,999 | 15 | 15.8% |
| $35,000 to $49,999 | 10 | 10.5% |
| $50,000 to $74,999 | 29 | 30.5% |
| $75,000 to $99,999 | 5 | 5.3% |
| $100,000 to $149,999 | 12 | 12.6% |
| $150,000 to $199,999 | 2 | 2.1% |
| $200,000+ | 0 | 0.0% |
Household Income by Householder Age in Uniontown
The median household income in Uniontown is $50,179, with the highest median household income of $51,250 found in the 25 to 44 years age bracket for the primary householder. A total of 29 households (30.5%) fall into this category. Meanwhile, the 15 to 24 years age bracket for the primary householder has the lowest median household income of $0, with 8 households (8.4%) in this group.
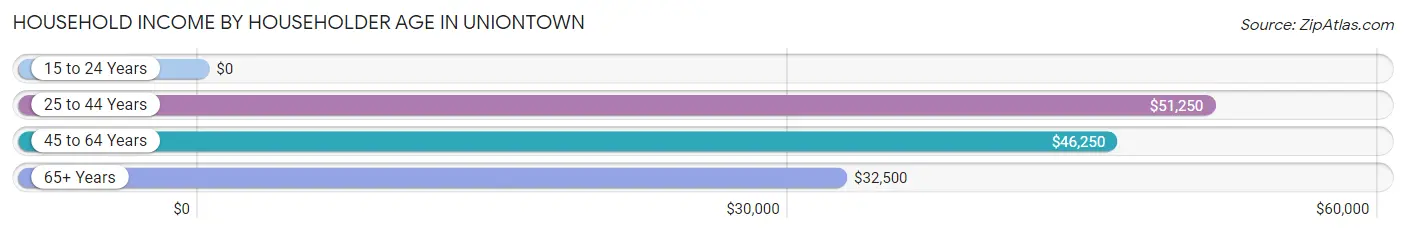
| Income Bracket | # Households | Median Income |
| 15 to 24 Years | 8 (8.4%) | $0 |
| 25 to 44 Years | 29 (30.5%) | $51,250 |
| 45 to 64 Years | 34 (35.8%) | $46,250 |
| 65+ Years | 24 (25.3%) | $32,500 |
| Total | 95 (100.0%) | $50,179 |
Poverty in Uniontown
Income Below Poverty by Sex and Age in Uniontown
With 13.7% poverty level for males and 12.4% for females among the residents of Uniontown, under 5 year old males and 18 to 24 year old females are the most vulnerable to poverty, with 11 males (52.4%) and 9 females (75.0%) in their respective age groups living below the poverty level.
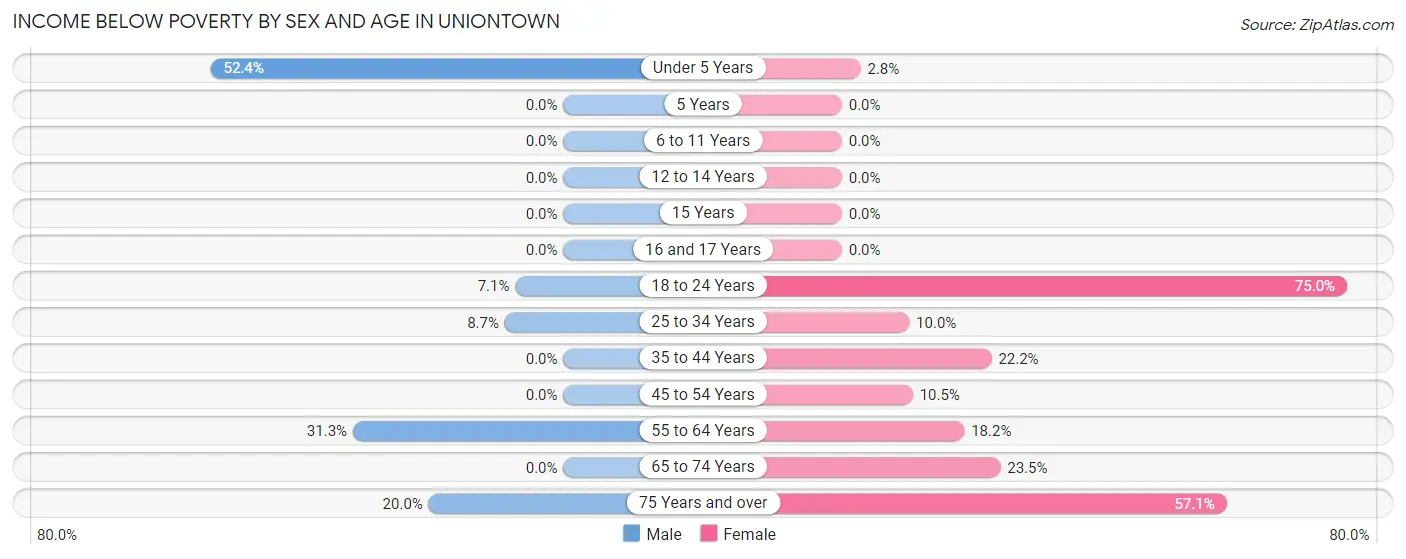
| Age Bracket | Male | Female |
| Under 5 Years | 11 (52.4%) | 1 (2.8%) |
| 5 Years | 0 (0.0%) | 0 (0.0%) |
| 6 to 11 Years | 0 (0.0%) | 0 (0.0%) |
| 12 to 14 Years | 0 (0.0%) | 0 (0.0%) |
| 15 Years | 0 (0.0%) | 0 (0.0%) |
| 16 and 17 Years | 0 (0.0%) | 0 (0.0%) |
| 18 to 24 Years | 1 (7.1%) | 9 (75.0%) |
| 25 to 34 Years | 2 (8.7%) | 2 (10.0%) |
| 35 to 44 Years | 0 (0.0%) | 2 (22.2%) |
| 45 to 54 Years | 0 (0.0%) | 2 (10.5%) |
| 55 to 64 Years | 5 (31.2%) | 2 (18.2%) |
| 65 to 74 Years | 0 (0.0%) | 4 (23.5%) |
| 75 Years and over | 1 (20.0%) | 4 (57.1%) |
| Total | 20 (13.7%) | 26 (12.4%) |
Income Above Poverty by Sex and Age in Uniontown
According to the poverty statistics in Uniontown, males aged 5 years and females aged 5 years are the age groups that are most secure financially, with 100.0% of males and 100.0% of females in these age groups living above the poverty line.
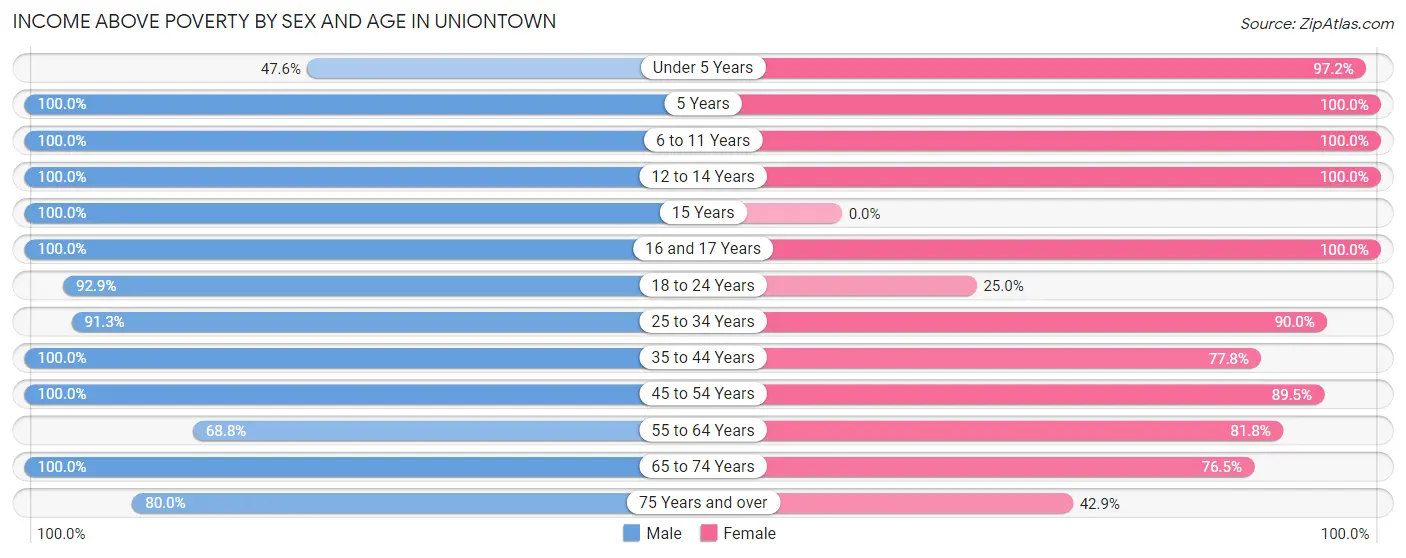
| Age Bracket | Male | Female |
| Under 5 Years | 10 (47.6%) | 35 (97.2%) |
| 5 Years | 4 (100.0%) | 35 (100.0%) |
| 6 to 11 Years | 23 (100.0%) | 40 (100.0%) |
| 12 to 14 Years | 15 (100.0%) | 2 (100.0%) |
| 15 Years | 2 (100.0%) | 0 (0.0%) |
| 16 and 17 Years | 5 (100.0%) | 2 (100.0%) |
| 18 to 24 Years | 13 (92.9%) | 3 (25.0%) |
| 25 to 34 Years | 21 (91.3%) | 18 (90.0%) |
| 35 to 44 Years | 5 (100.0%) | 7 (77.8%) |
| 45 to 54 Years | 5 (100.0%) | 17 (89.5%) |
| 55 to 64 Years | 11 (68.8%) | 9 (81.8%) |
| 65 to 74 Years | 8 (100.0%) | 13 (76.5%) |
| 75 Years and over | 4 (80.0%) | 3 (42.9%) |
| Total | 126 (86.3%) | 184 (87.6%) |
Income Below Poverty Among Married-Couple Families in Uniontown
The poverty statistics for married-couple families in Uniontown show that 6.1% or 2 of the total 33 families live below the poverty line. Families with 3 or 4 children have the highest poverty rate of 18.2%, comprising of 2 families. On the other hand, families with no children have the lowest poverty rate of 0.0%, which includes 0 families.
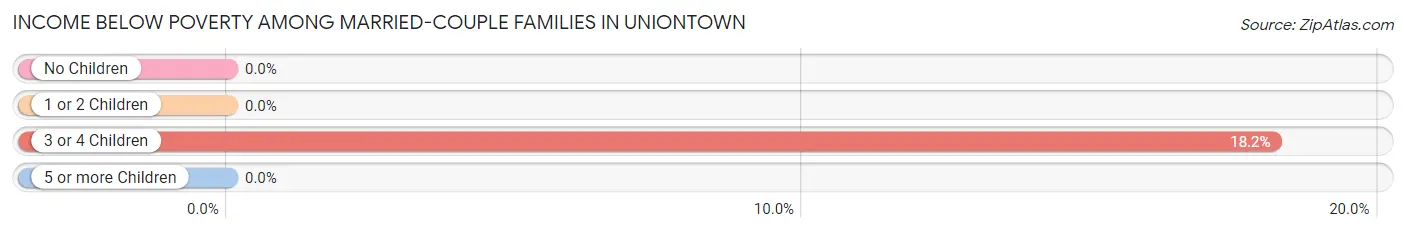
| Children | Above Poverty | Below Poverty |
| No Children | 10 (100.0%) | 0 (0.0%) |
| 1 or 2 Children | 12 (100.0%) | 0 (0.0%) |
| 3 or 4 Children | 9 (81.8%) | 2 (18.2%) |
| 5 or more Children | 0 (0.0%) | 0 (0.0%) |
| Total | 31 (93.9%) | 2 (6.1%) |
Income Below Poverty Among Single-Parent Households in Uniontown
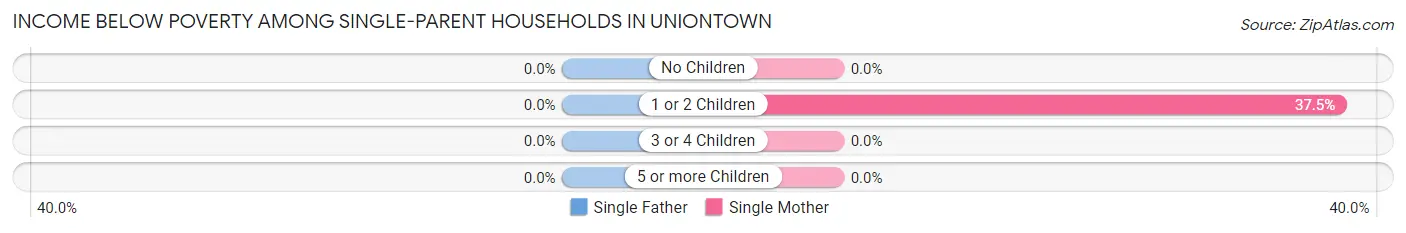
| Children | Single Father | Single Mother |
| No Children | 0 (0.0%) | 0 (0.0%) |
| 1 or 2 Children | 0 (0.0%) | 6 (37.5%) |
| 3 or 4 Children | 0 (0.0%) | 0 (0.0%) |
| 5 or more Children | 0 (0.0%) | 0 (0.0%) |
| Total | 0 (0.0%) | 6 (25.0%) |
Income Below Poverty Among Married-Couple vs Single-Parent Households in Uniontown
The poverty data for Uniontown shows that 2 of the married-couple family households (6.1%) and 6 of the single-parent households (21.4%) are living below the poverty level. Within the married-couple family households, those with 3 or 4 children have the highest poverty rate, with 2 households (18.2%) falling below the poverty line. Among the single-parent households, those with 1 or 2 children have the highest poverty rate, with 6 household (31.6%) living below poverty.
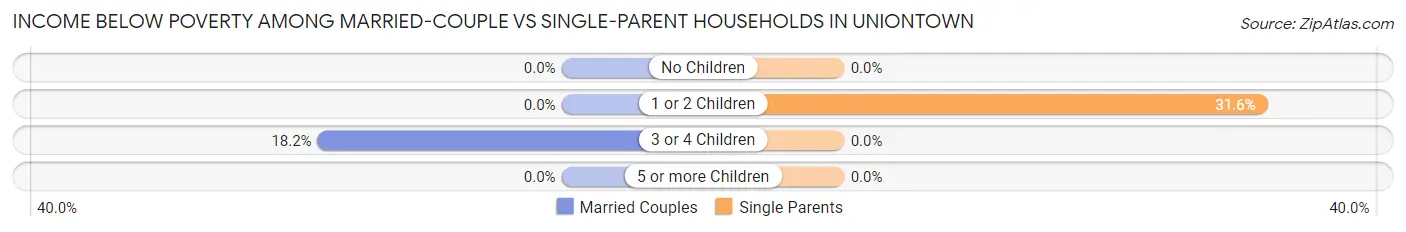
| Children | Married-Couple Families | Single-Parent Households |
| No Children | 0 (0.0%) | 0 (0.0%) |
| 1 or 2 Children | 0 (0.0%) | 6 (31.6%) |
| 3 or 4 Children | 2 (18.2%) | 0 (0.0%) |
| 5 or more Children | 0 (0.0%) | 0 (0.0%) |
| Total | 2 (6.1%) | 6 (21.4%) |
Race in Uniontown
The most populous races in Uniontown are White / Caucasian (336 | 94.4%), Two or more Races (20 | 5.6%), and Hispanic or Latino (3 | 0.8%).
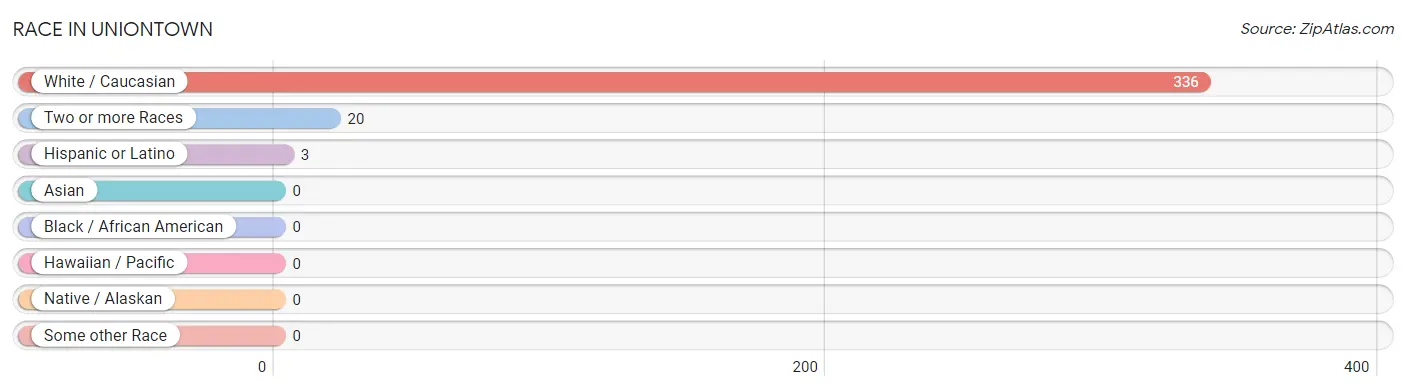
| Race | # Population | % Population |
| Asian | 0 | 0.0% |
| Black / African American | 0 | 0.0% |
| Hawaiian / Pacific | 0 | 0.0% |
| Hispanic or Latino | 3 | 0.8% |
| Native / Alaskan | 0 | 0.0% |
| White / Caucasian | 336 | 94.4% |
| Two or more Races | 20 | 5.6% |
| Some other Race | 0 | 0.0% |
| Total | 356 | 100.0% |
Ancestry in Uniontown
The most populous ancestries reported in Uniontown are American (186 | 52.2%), Irish (34 | 9.6%), German (21 | 5.9%), English (13 | 3.6%), and Cherokee (8 | 2.2%), together accounting for 73.6% of all Uniontown residents.
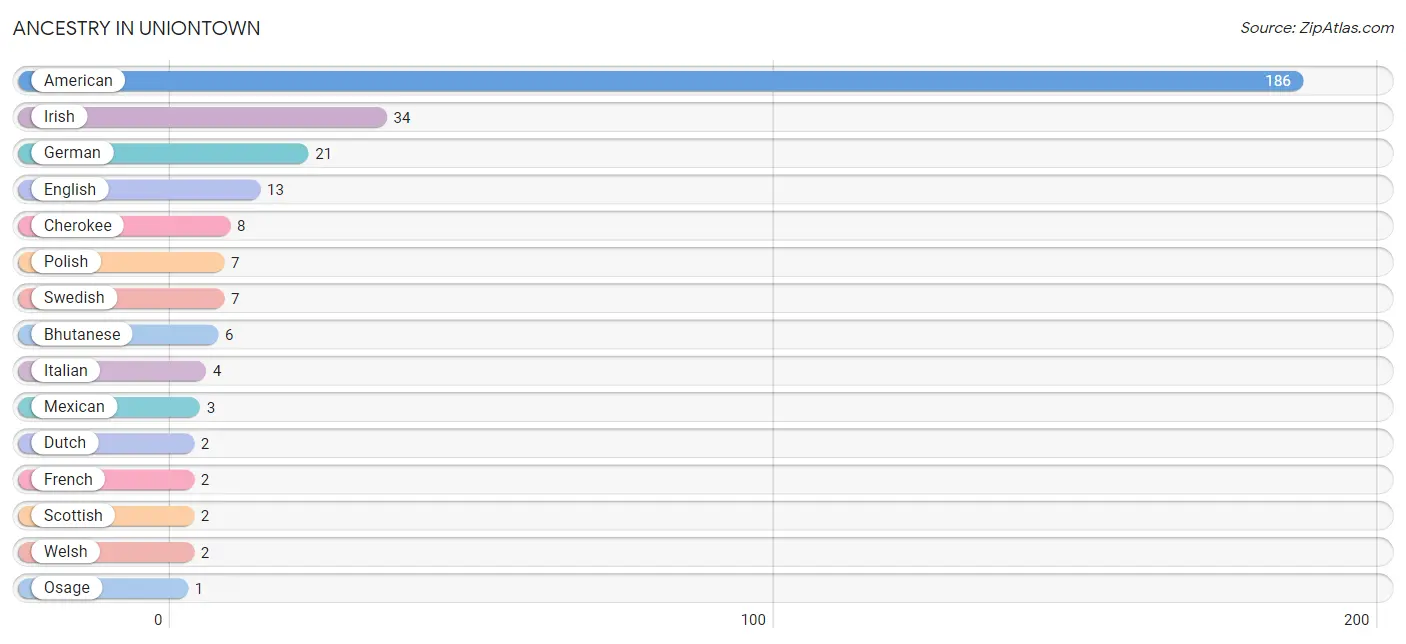
| Ancestry | # Population | % Population |
| American | 186 | 52.2% |
| Bhutanese | 6 | 1.7% |
| Cherokee | 8 | 2.2% |
| Dutch | 2 | 0.6% |
| English | 13 | 3.6% |
| French | 2 | 0.6% |
| German | 21 | 5.9% |
| Irish | 34 | 9.6% |
| Italian | 4 | 1.1% |
| Mexican | 3 | 0.8% |
| Osage | 1 | 0.3% |
| Polish | 7 | 2.0% |
| Scottish | 2 | 0.6% |
| Swedish | 7 | 2.0% |
| Welsh | 2 | 0.6% | View All 15 Rows |
Immigrants in Uniontown

| Immigration Origin | # Population | % Population | View All 0 Rows |
Sex and Age in Uniontown
Sex and Age in Uniontown
The most populous age groups in Uniontown are 5 to 9 Years (27 | 18.5%) for men and 5 to 9 Years (74 | 35.2%) for women.

| Age Bracket | Male | Female |
| Under 5 Years | 21 (14.4%) | 36 (17.1%) |
| 5 to 9 Years | 27 (18.5%) | 74 (35.2%) |
| 10 to 14 Years | 15 (10.3%) | 3 (1.4%) |
| 15 to 19 Years | 16 (11.0%) | 6 (2.9%) |
| 20 to 24 Years | 5 (3.4%) | 8 (3.8%) |
| 25 to 29 Years | 5 (3.4%) | 10 (4.8%) |
| 30 to 34 Years | 18 (12.3%) | 10 (4.8%) |
| 35 to 39 Years | 3 (2.1%) | 2 (0.9%) |
| 40 to 44 Years | 2 (1.4%) | 7 (3.3%) |
| 45 to 49 Years | 3 (2.1%) | 15 (7.1%) |
| 50 to 54 Years | 2 (1.4%) | 4 (1.9%) |
| 55 to 59 Years | 14 (9.6%) | 2 (0.9%) |
| 60 to 64 Years | 2 (1.4%) | 9 (4.3%) |
| 65 to 69 Years | 5 (3.4%) | 12 (5.7%) |
| 70 to 74 Years | 3 (2.1%) | 5 (2.4%) |
| 75 to 79 Years | 2 (1.4%) | 0 (0.0%) |
| 80 to 84 Years | 1 (0.7%) | 2 (0.9%) |
| 85 Years and over | 2 (1.4%) | 5 (2.4%) |
| Total | 146 (100.0%) | 210 (100.0%) |
Families and Households in Uniontown
Median Family Size in Uniontown
The median family size in Uniontown is 4.98 persons per family, with married-couple families (33 | 54.1%) accounting for the largest median family size of 7.3 persons per family. On the other hand, single female/mother families (24 | 39.3%) represent the smallest median family size with 2.08 persons per family.
| Family Type | # Families | Family Size |
| Married-Couple | 33 (54.1%) | 7.30 |
| Single Male/Father | 4 (6.6%) | 3.25 |
| Single Female/Mother | 24 (39.3%) | 2.08 |
| Total Families | 61 (100.0%) | 4.98 |
Median Household Size in Uniontown
The median household size in Uniontown is 3.75 persons per household, with married-couple households (33 | 34.7%) accounting for the largest median household size of 7.3 persons per household. non-family households (34 | 35.8%) represent the smallest median household size with 1.06 persons per household.
| Household Type | # Households | Household Size |
| Married-Couple | 33 (34.7%) | 7.30 |
| Single Male/Father | 4 (4.2%) | 4.25 |
| Single Female/Mother | 24 (25.3%) | 2.58 |
| Non-family | 34 (35.8%) | 1.06 |
| Total Households | 95 (100.0%) | 3.75 |
Household Size by Marriage Status in Uniontown
Out of a total of 95 households in Uniontown, 61 (64.2%) are family households, while 34 (35.8%) are nonfamily households. The most numerous type of family households are 2-person households, comprising 21, and the most common type of nonfamily households are 1-person households, comprising 32.
| Household Size | Family Households | Nonfamily Households |
| 1-Person Households | - | 32 (33.7%) |
| 2-Person Households | 21 (22.1%) | 2 (2.1%) |
| 3-Person Households | 15 (15.8%) | 0 (0.0%) |
| 4-Person Households | 13 (13.7%) | 0 (0.0%) |
| 5-Person Households | 5 (5.3%) | 0 (0.0%) |
| 6-Person Households | 7 (7.4%) | 0 (0.0%) |
| 7+ Person Households | 0 (0.0%) | 0 (0.0%) |
| Total | 61 (64.2%) | 34 (35.8%) |
Female Fertility in Uniontown
Fertility by Age in Uniontown
Average fertility rate in Uniontown is 103.0 births per 1,000 women. Women in the age bracket of 20 to 34 years have the highest fertility rate with 214.0 births per 1,000 women. Women in the age bracket of 20 to 34 years acount for 100.0% of all women with births.
| Age Bracket | Women with Births | Births / 1,000 Women |
| 15 to 19 years | 0 (0.0%) | 0.0 |
| 20 to 34 years | 6 (100.0%) | 214.0 |
| 35 to 50 years | 0 (0.0%) | 0.0 |
| Total | 6 (100.0%) | 103.0 |
Fertility by Age by Marriage Status in Uniontown
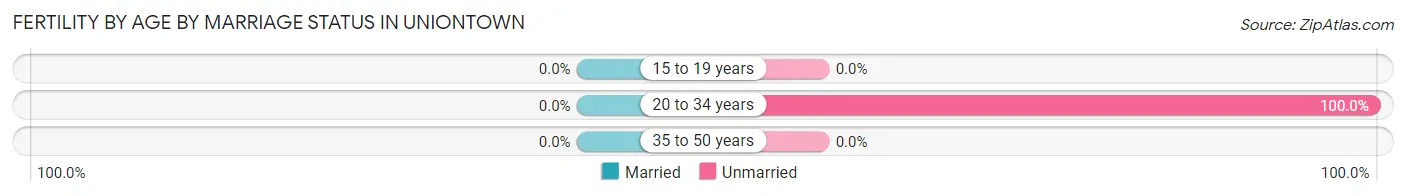
| Age Bracket | Married | Unmarried |
| 15 to 19 years | 0 (0.0%) | 0 (0.0%) |
| 20 to 34 years | 0 (0.0%) | 6 (100.0%) |
| 35 to 50 years | 0 (0.0%) | 0 (0.0%) |
| Total | 0 (0.0%) | 6 (100.0%) |
Fertility by Education in Uniontown
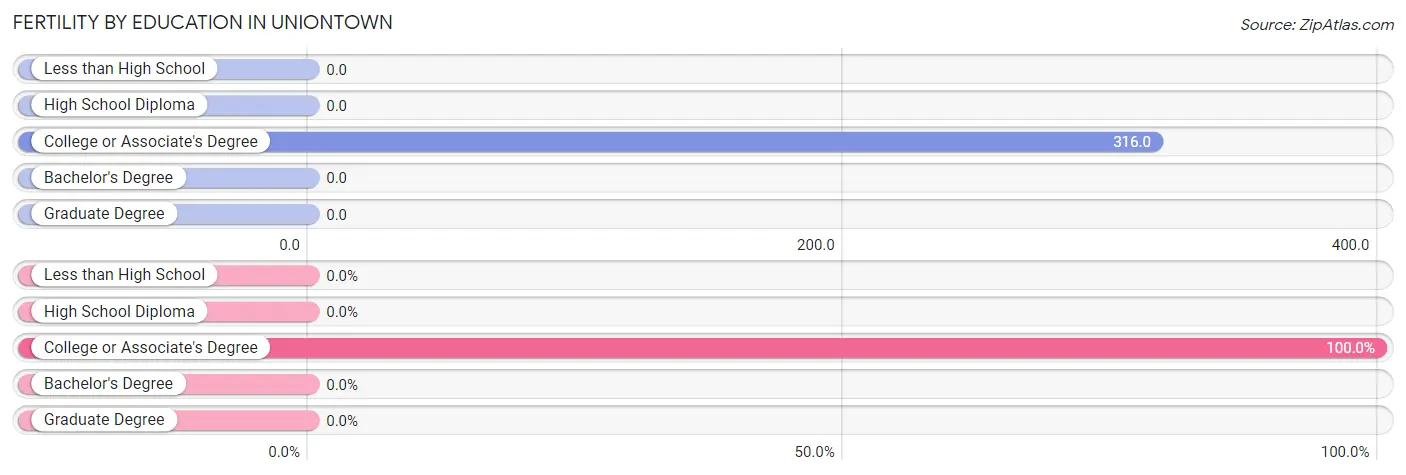
| Educational Attainment | Women with Births | Births / 1,000 Women |
| Less than High School | 0 (0.0%) | 0.0 |
| High School Diploma | 0 (0.0%) | 0.0 |
| College or Associate's Degree | 6 (100.0%) | 316.0 |
| Bachelor's Degree | 0 (0.0%) | 0.0 |
| Graduate Degree | 0 (0.0%) | 0.0 |
| Total | 6 (100.0%) | 103.0 |
Fertility by Education by Marriage Status in Uniontown
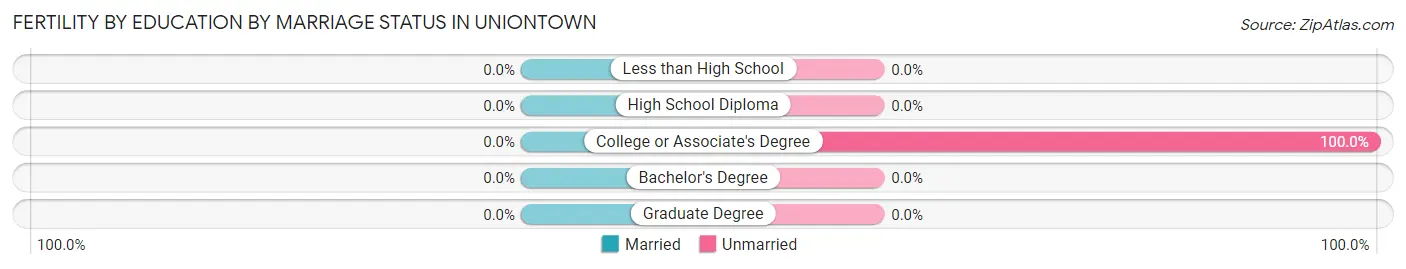
| Educational Attainment | Married | Unmarried |
| Less than High School | 0 (0.0%) | 0 (0.0%) |
| High School Diploma | 0 (0.0%) | 0 (0.0%) |
| College or Associate's Degree | 0 (0.0%) | 6 (100.0%) |
| Bachelor's Degree | 0 (0.0%) | 0 (0.0%) |
| Graduate Degree | 0 (0.0%) | 0 (0.0%) |
| Total | 0 (0.0%) | 6 (100.0%) |
Employment Characteristics in Uniontown
Employment by Class of Employer in Uniontown
Among the 101 employed individuals in Uniontown, private company employees (66 | 65.3%), local government employees (19 | 18.8%), and not-for-profit organizations (8 | 7.9%) make up the most common classes of employment.
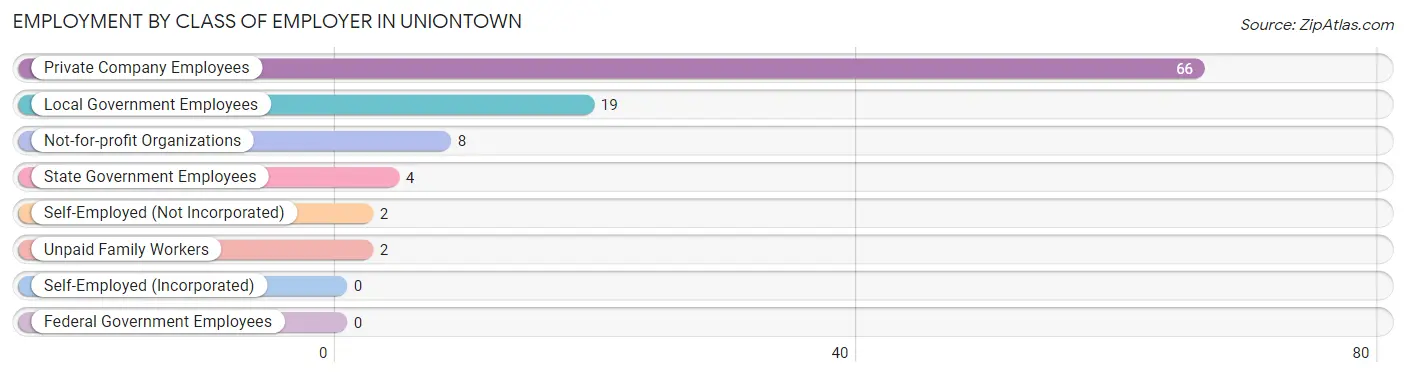
| Employer Class | # Employees | % Employees |
| Private Company Employees | 66 | 65.3% |
| Self-Employed (Incorporated) | 0 | 0.0% |
| Self-Employed (Not Incorporated) | 2 | 2.0% |
| Not-for-profit Organizations | 8 | 7.9% |
| Local Government Employees | 19 | 18.8% |
| State Government Employees | 4 | 4.0% |
| Federal Government Employees | 0 | 0.0% |
| Unpaid Family Workers | 2 | 2.0% |
| Total | 101 | 100.0% |
Employment Status by Age in Uniontown
According to the labor force statistics for Uniontown, out of the total population over 16 years of age (178), 62.4% or 111 individuals are in the labor force, with 3.6% or 4 of them unemployed. The age group with the highest labor force participation rate is 35 to 44 years, with 100.0% or 14 individuals in the labor force. Within the labor force, the 20 to 24 years age range has the highest percentage of unemployed individuals, with 33.3% or 2 of them being unemployed.
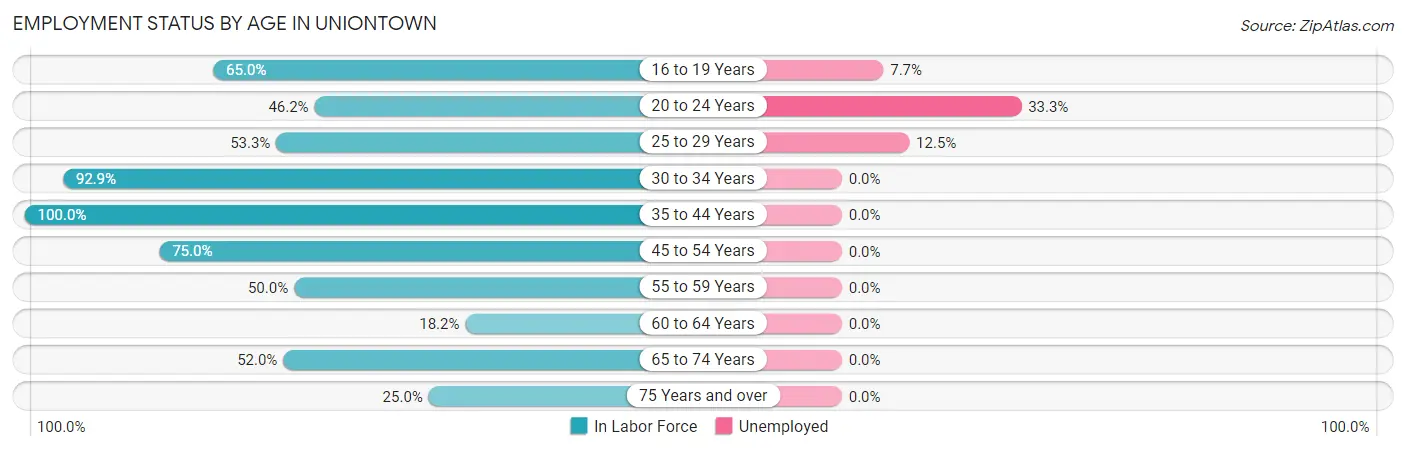
| Age Bracket | In Labor Force | Unemployed |
| 16 to 19 Years | 13 (65.0%) | 1 (7.7%) |
| 20 to 24 Years | 6 (46.2%) | 2 (33.3%) |
| 25 to 29 Years | 8 (53.3%) | 1 (12.5%) |
| 30 to 34 Years | 26 (92.9%) | 0 (0.0%) |
| 35 to 44 Years | 14 (100.0%) | 0 (0.0%) |
| 45 to 54 Years | 18 (75.0%) | 0 (0.0%) |
| 55 to 59 Years | 8 (50.0%) | 0 (0.0%) |
| 60 to 64 Years | 2 (18.2%) | 0 (0.0%) |
| 65 to 74 Years | 13 (52.0%) | 0 (0.0%) |
| 75 Years and over | 3 (25.0%) | 0 (0.0%) |
| Total | 111 (62.4%) | 4 (3.6%) |
Employment Status by Educational Attainment in Uniontown
According to labor force statistics for Uniontown, 70.4% of individuals (76) out of the total population between 25 and 64 years of age (108) are in the labor force, with 1.3% or 1 of them being unemployed. The group with the highest labor force participation rate are those with the educational attainment of bachelor's degree or higher, with 88.2% or 15 individuals in the labor force. Within the labor force, individuals with college / associate degree education have the highest percentage of unemployment, with 2.4% or 1 of them being unemployed.
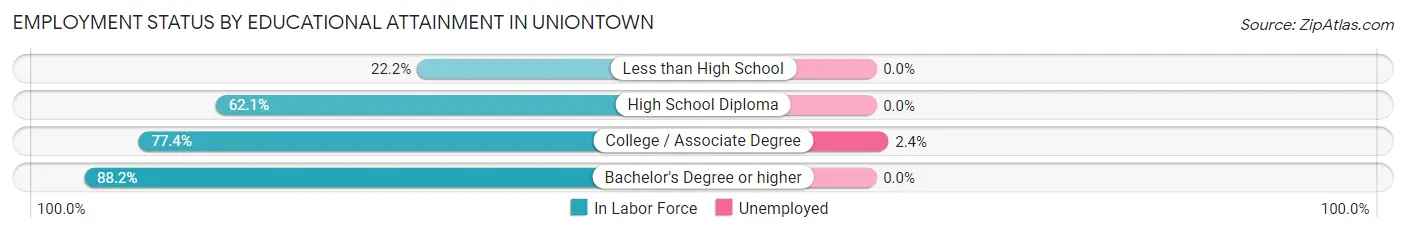
| Educational Attainment | In Labor Force | Unemployed |
| Less than High School | 2 (22.2%) | 0 (0.0%) |
| High School Diploma | 18 (62.1%) | 0 (0.0%) |
| College / Associate Degree | 41 (77.4%) | 1 (2.4%) |
| Bachelor's Degree or higher | 15 (88.2%) | 0 (0.0%) |
| Total | 76 (70.4%) | 1 (1.3%) |
Employment Occupations by Sex in Uniontown
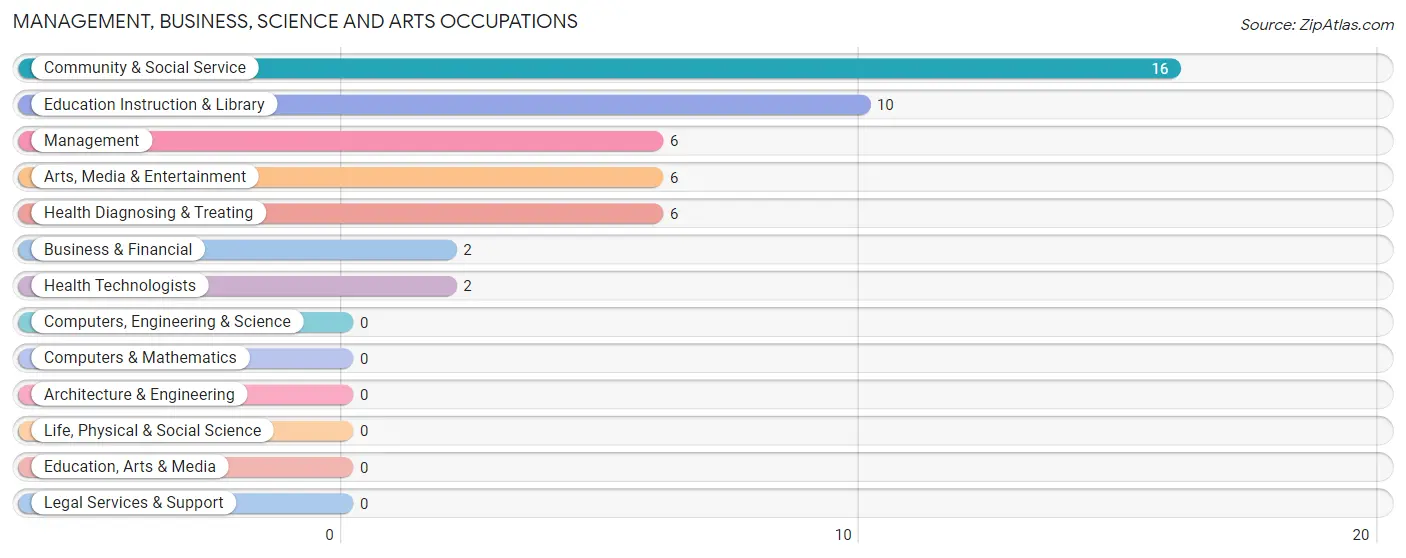
Management, Business, Science and Arts Occupations
The most common Management, Business, Science and Arts occupations in Uniontown are Community & Social Service (16 | 14.9%), Education Instruction & Library (10 | 9.3%), Management (6 | 5.6%), Arts, Media & Entertainment (6 | 5.6%), and Health Diagnosing & Treating (6 | 5.6%).
Management, Business, Science and Arts Occupations by Sex
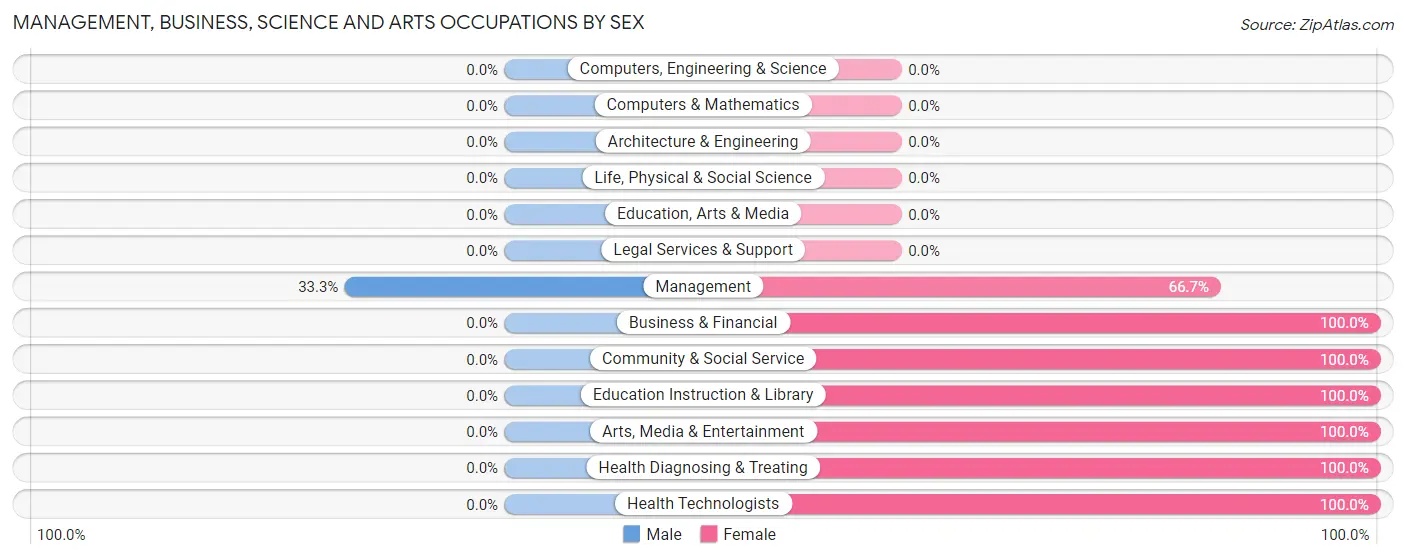
| Occupation | Male | Female |
| Management | 2 (33.3%) | 4 (66.7%) |
| Business & Financial | 0 (0.0%) | 2 (100.0%) |
| Computers, Engineering & Science | 0 (0.0%) | 0 (0.0%) |
| Computers & Mathematics | 0 (0.0%) | 0 (0.0%) |
| Architecture & Engineering | 0 (0.0%) | 0 (0.0%) |
| Life, Physical & Social Science | 0 (0.0%) | 0 (0.0%) |
| Community & Social Service | 0 (0.0%) | 16 (100.0%) |
| Education, Arts & Media | 0 (0.0%) | 0 (0.0%) |
| Legal Services & Support | 0 (0.0%) | 0 (0.0%) |
| Education Instruction & Library | 0 (0.0%) | 10 (100.0%) |
| Arts, Media & Entertainment | 0 (0.0%) | 6 (100.0%) |
| Health Diagnosing & Treating | 0 (0.0%) | 6 (100.0%) |
| Health Technologists | 0 (0.0%) | 2 (100.0%) |
| Total (Category) | 2 (6.7%) | 28 (93.3%) |
| Total (Overall) | 61 (57.0%) | 46 (43.0%) |
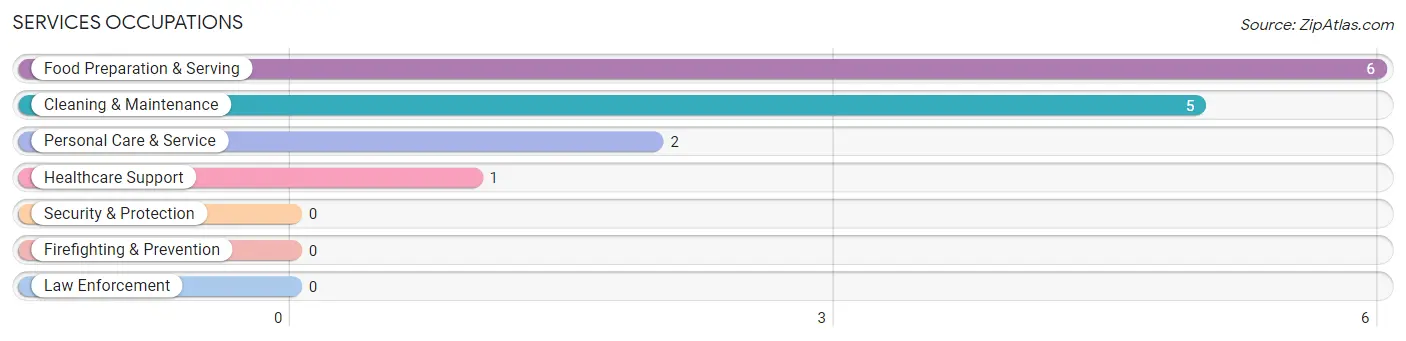
Services Occupations
The most common Services occupations in Uniontown are Food Preparation & Serving (6 | 5.6%), Cleaning & Maintenance (5 | 4.7%), Personal Care & Service (2 | 1.9%), and Healthcare Support (1 | 0.9%).
Services Occupations by Sex
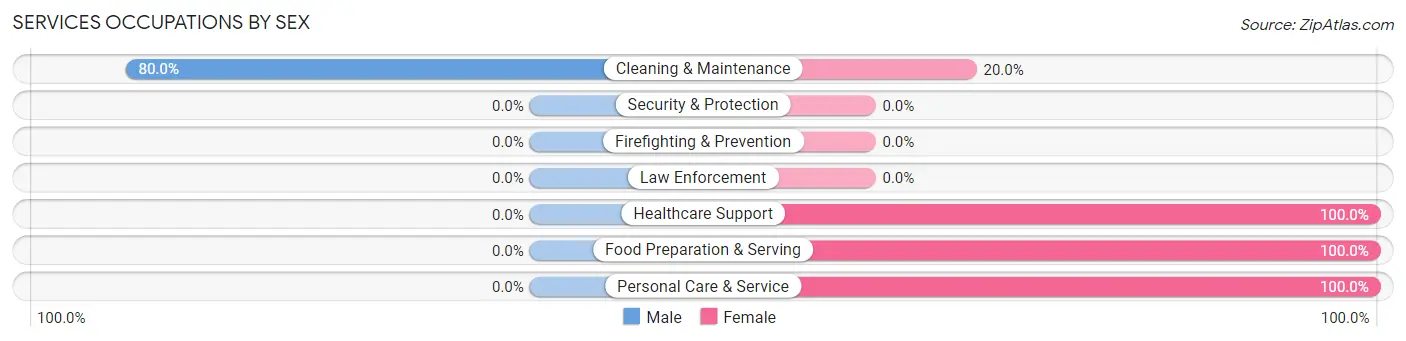
| Occupation | Male | Female |
| Healthcare Support | 0 (0.0%) | 1 (100.0%) |
| Security & Protection | 0 (0.0%) | 0 (0.0%) |
| Firefighting & Prevention | 0 (0.0%) | 0 (0.0%) |
| Law Enforcement | 0 (0.0%) | 0 (0.0%) |
| Food Preparation & Serving | 0 (0.0%) | 6 (100.0%) |
| Cleaning & Maintenance | 4 (80.0%) | 1 (20.0%) |
| Personal Care & Service | 0 (0.0%) | 2 (100.0%) |
| Total (Category) | 4 (28.6%) | 10 (71.4%) |
| Total (Overall) | 61 (57.0%) | 46 (43.0%) |
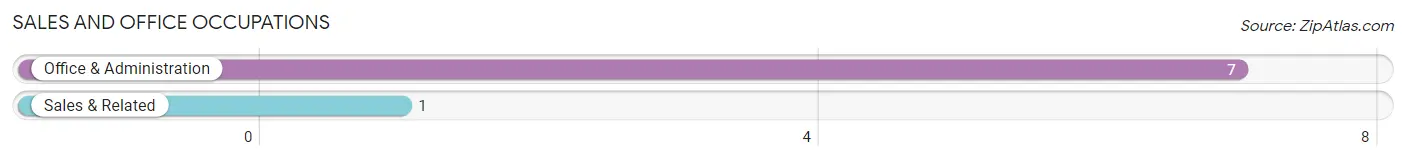
Sales and Office Occupations
The most common Sales and Office occupations in Uniontown are Office & Administration (7 | 6.5%), and Sales & Related (1 | 0.9%).
Sales and Office Occupations by Sex
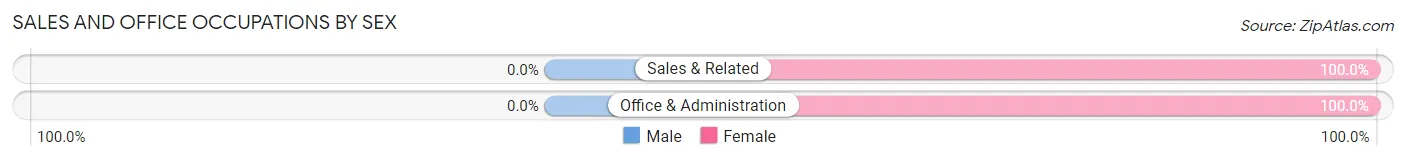
| Occupation | Male | Female |
| Sales & Related | 0 (0.0%) | 1 (100.0%) |
| Office & Administration | 0 (0.0%) | 7 (100.0%) |
| Total (Category) | 0 (0.0%) | 8 (100.0%) |
| Total (Overall) | 61 (57.0%) | 46 (43.0%) |
Natural Resources, Construction and Maintenance Occupations
The most common Natural Resources, Construction and Maintenance occupations in Uniontown are Construction & Extraction (12 | 11.2%), Farming, Fishing & Forestry (5 | 4.7%), and Installation, Maintenance & Repair (4 | 3.7%).
Natural Resources, Construction and Maintenance Occupations by Sex
| Occupation | Male | Female |
| Farming, Fishing & Forestry | 5 (100.0%) | 0 (0.0%) |
| Construction & Extraction | 12 (100.0%) | 0 (0.0%) |
| Installation, Maintenance & Repair | 4 (100.0%) | 0 (0.0%) |
| Total (Category) | 21 (100.0%) | 0 (0.0%) |
| Total (Overall) | 61 (57.0%) | 46 (43.0%) |
Production, Transportation and Moving Occupations
The most common Production, Transportation and Moving occupations in Uniontown are Production (27 | 25.2%), Transportation (5 | 4.7%), and Material Moving (2 | 1.9%).
Production, Transportation and Moving Occupations by Sex
| Occupation | Male | Female |
| Production | 27 (100.0%) | 0 (0.0%) |
| Transportation | 5 (100.0%) | 0 (0.0%) |
| Material Moving | 2 (100.0%) | 0 (0.0%) |
| Total (Category) | 34 (100.0%) | 0 (0.0%) |
| Total (Overall) | 61 (57.0%) | 46 (43.0%) |
Employment Industries by Sex in Uniontown
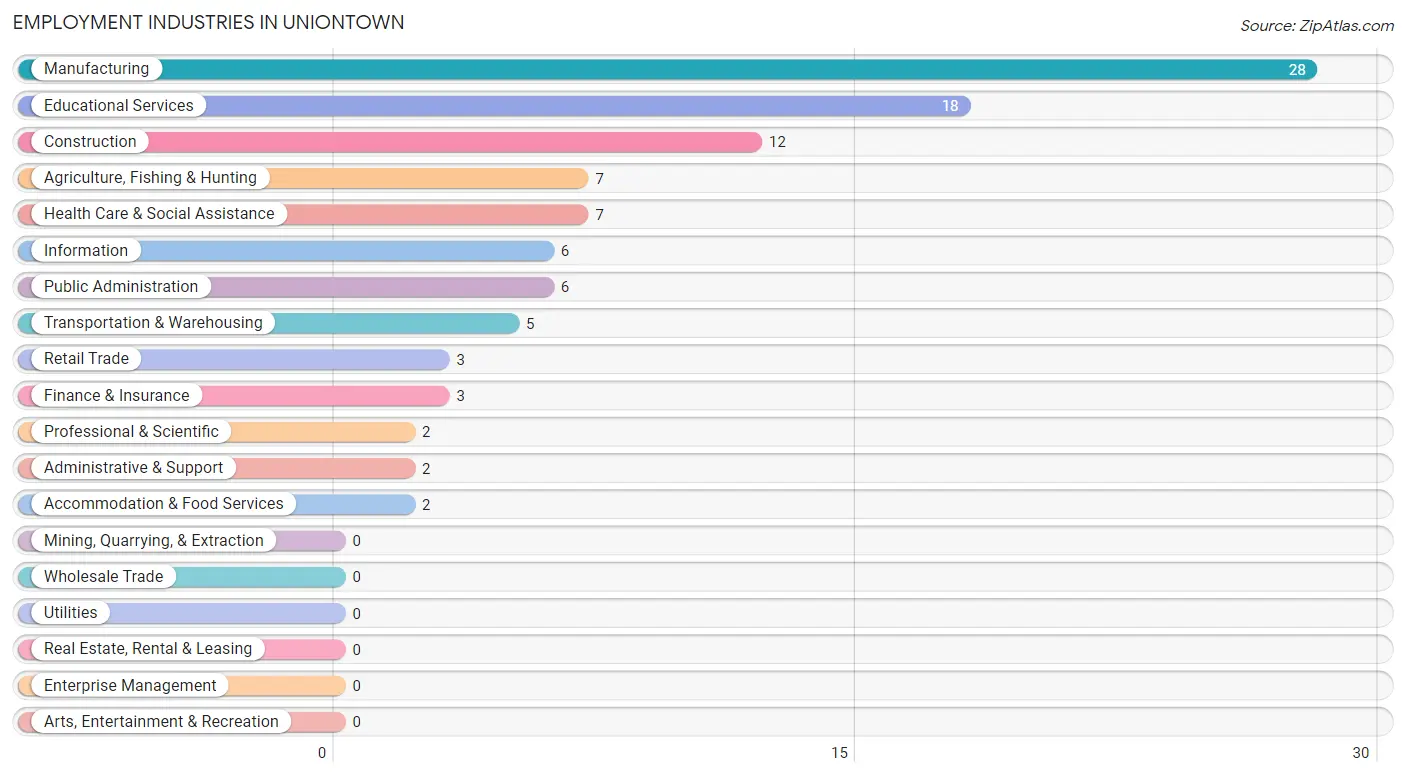
Employment Industries in Uniontown
The major employment industries in Uniontown include Manufacturing (28 | 26.2%), Educational Services (18 | 16.8%), Construction (12 | 11.2%), Agriculture, Fishing & Hunting (7 | 6.5%), and Health Care & Social Assistance (7 | 6.5%).
Employment Industries by Sex in Uniontown
The Uniontown industries that see more men than women are Construction (100.0%), Transportation & Warehousing (100.0%), and Administrative & Support (100.0%), whereas the industries that tend to have a higher number of women are Retail Trade (100.0%), Information (100.0%), and Professional & Scientific (100.0%).
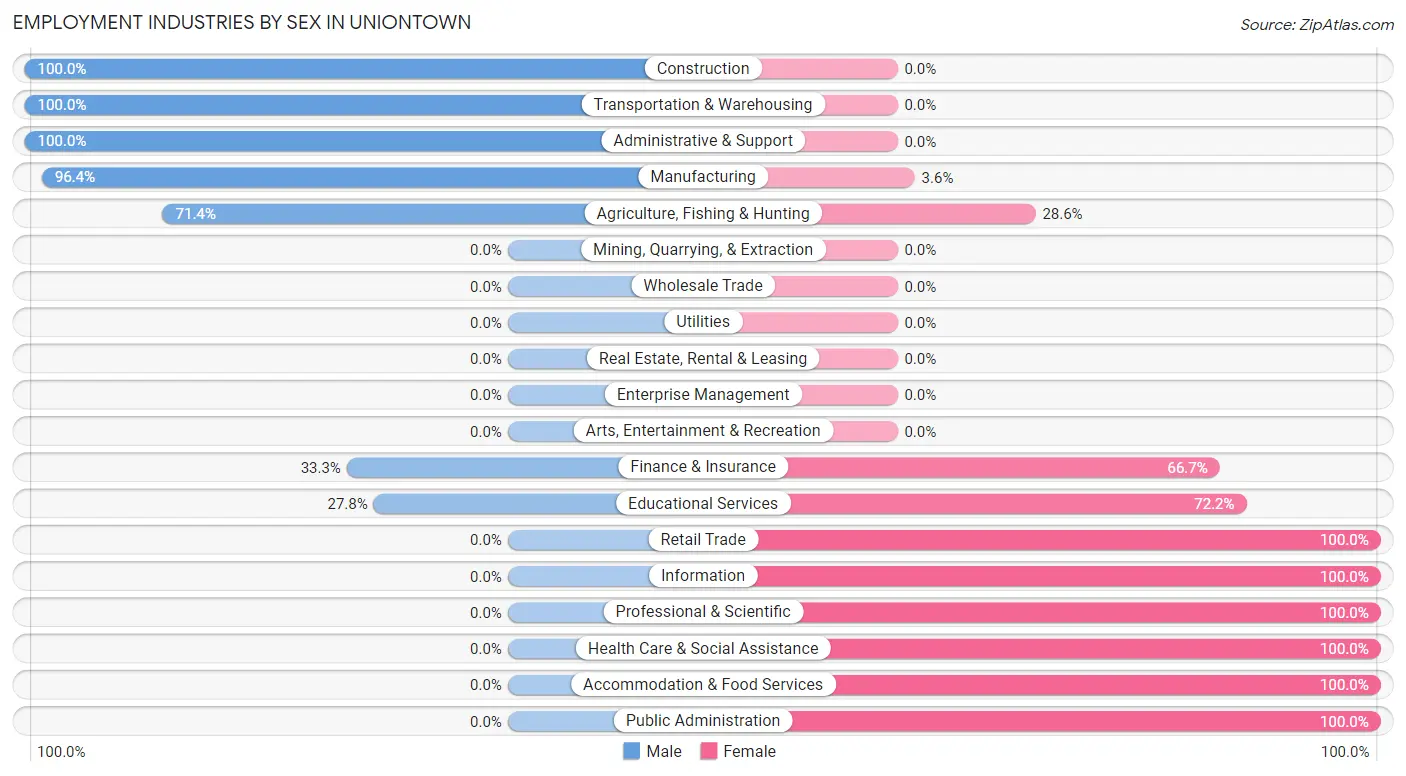
| Industry | Male | Female |
| Agriculture, Fishing & Hunting | 5 (71.4%) | 2 (28.6%) |
| Mining, Quarrying, & Extraction | 0 (0.0%) | 0 (0.0%) |
| Construction | 12 (100.0%) | 0 (0.0%) |
| Manufacturing | 27 (96.4%) | 1 (3.6%) |
| Wholesale Trade | 0 (0.0%) | 0 (0.0%) |
| Retail Trade | 0 (0.0%) | 3 (100.0%) |
| Transportation & Warehousing | 5 (100.0%) | 0 (0.0%) |
| Utilities | 0 (0.0%) | 0 (0.0%) |
| Information | 0 (0.0%) | 6 (100.0%) |
| Finance & Insurance | 1 (33.3%) | 2 (66.7%) |
| Real Estate, Rental & Leasing | 0 (0.0%) | 0 (0.0%) |
| Professional & Scientific | 0 (0.0%) | 2 (100.0%) |
| Enterprise Management | 0 (0.0%) | 0 (0.0%) |
| Administrative & Support | 2 (100.0%) | 0 (0.0%) |
| Educational Services | 5 (27.8%) | 13 (72.2%) |
| Health Care & Social Assistance | 0 (0.0%) | 7 (100.0%) |
| Arts, Entertainment & Recreation | 0 (0.0%) | 0 (0.0%) |
| Accommodation & Food Services | 0 (0.0%) | 2 (100.0%) |
| Public Administration | 0 (0.0%) | 6 (100.0%) |
| Total | 61 (57.0%) | 46 (43.0%) |
Education in Uniontown
School Enrollment in Uniontown
The most common levels of schooling among the 145 students in Uniontown are elementary school (62 | 42.8%), kindergarten (35 | 24.1%), and middle school (16 | 11.0%).
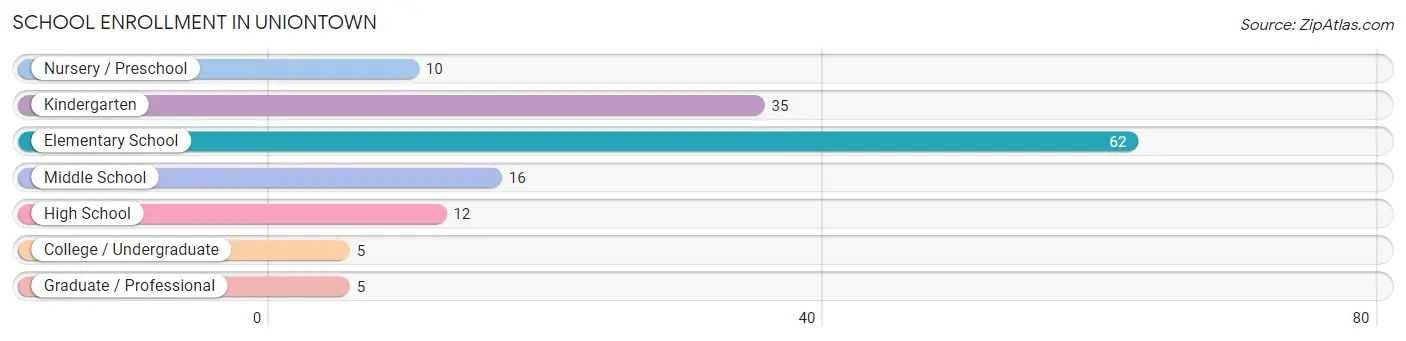
| School Level | # Students | % Students |
| Nursery / Preschool | 10 | 6.9% |
| Kindergarten | 35 | 24.1% |
| Elementary School | 62 | 42.8% |
| Middle School | 16 | 11.0% |
| High School | 12 | 8.3% |
| College / Undergraduate | 5 | 3.5% |
| Graduate / Professional | 5 | 3.5% |
| Total | 145 | 100.0% |
School Enrollment by Age by Funding Source in Uniontown
Out of a total of 145 students who are enrolled in schools in Uniontown, 7 (4.8%) attend a private institution, while the remaining 138 (95.2%) are enrolled in public schools. The age group of 25 to 34 year olds has the highest likelihood of being enrolled in private schools, with 2 (66.7% in the age bracket) enrolled. Conversely, the age group of 10 to 14 year olds has the lowest likelihood of being enrolled in a private school, with 18 (100.0% in the age bracket) attending a public institution.
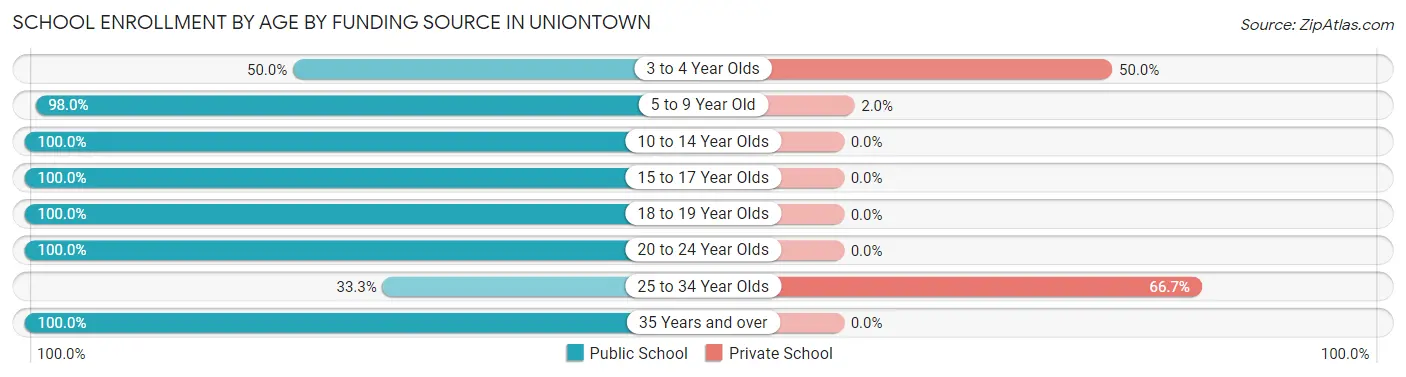
| Age Bracket | Public School | Private School |
| 3 to 4 Year Olds | 3 (50.0%) | 3 (50.0%) |
| 5 to 9 Year Old | 99 (98.0%) | 2 (2.0%) |
| 10 to 14 Year Olds | 18 (100.0%) | 0 (0.0%) |
| 15 to 17 Year Olds | 8 (100.0%) | 0 (0.0%) |
| 18 to 19 Year Olds | 2 (100.0%) | 0 (0.0%) |
| 20 to 24 Year Olds | 3 (100.0%) | 0 (0.0%) |
| 25 to 34 Year Olds | 1 (33.3%) | 2 (66.7%) |
| 35 Years and over | 4 (100.0%) | 0 (0.0%) |
| Total | 138 (95.2%) | 7 (4.8%) |
Educational Attainment by Field of Study in Uniontown
Education (16 | 51.6%), psychology (4 | 12.9%), science & technology (4 | 12.9%), bio, nature & agricultural (2 | 6.5%), and business (2 | 6.5%) are the most common fields of study among 31 individuals in Uniontown who have obtained a bachelor's degree or higher.
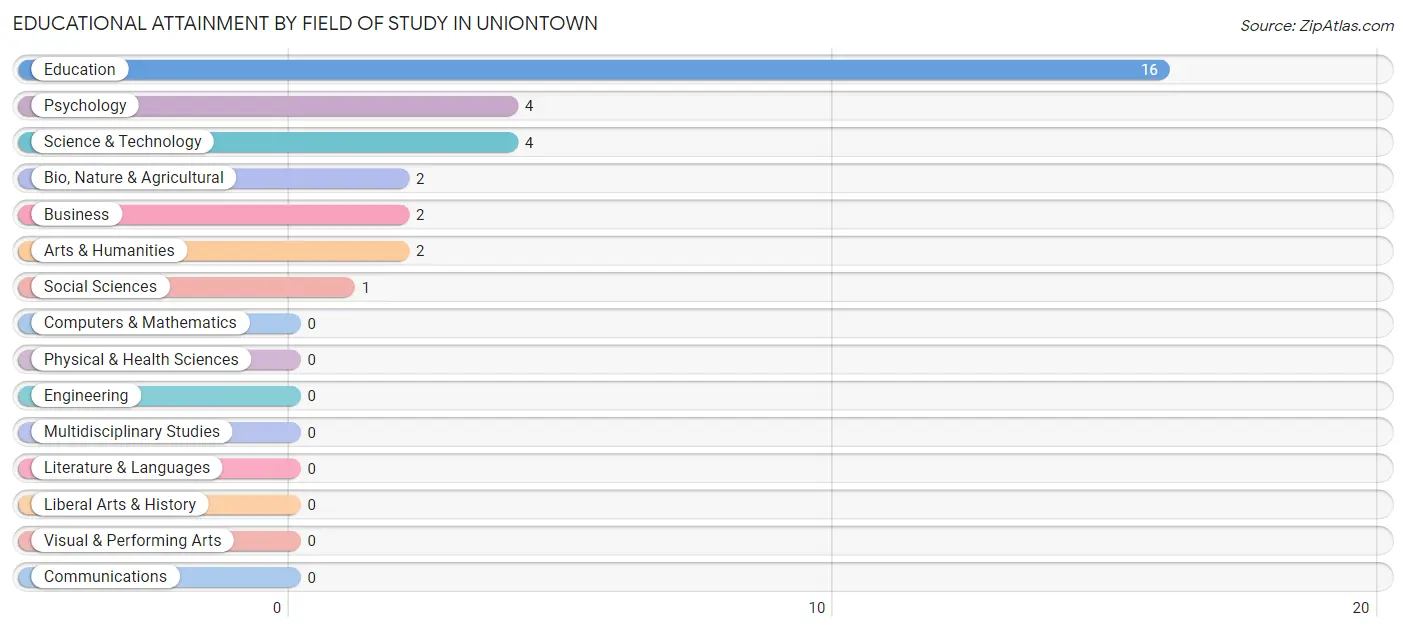
| Field of Study | # Graduates | % Graduates |
| Computers & Mathematics | 0 | 0.0% |
| Bio, Nature & Agricultural | 2 | 6.5% |
| Physical & Health Sciences | 0 | 0.0% |
| Psychology | 4 | 12.9% |
| Social Sciences | 1 | 3.2% |
| Engineering | 0 | 0.0% |
| Multidisciplinary Studies | 0 | 0.0% |
| Science & Technology | 4 | 12.9% |
| Business | 2 | 6.5% |
| Education | 16 | 51.6% |
| Literature & Languages | 0 | 0.0% |
| Liberal Arts & History | 0 | 0.0% |
| Visual & Performing Arts | 0 | 0.0% |
| Communications | 0 | 0.0% |
| Arts & Humanities | 2 | 6.5% |
| Total | 31 | 100.0% |
Transportation & Commute in Uniontown
Vehicle Availability by Sex in Uniontown
The most prevalent vehicle ownership categories in Uniontown are males with 2 vehicles (45, accounting for 73.8%) and females with 2 vehicles (19, making up 112.5%).
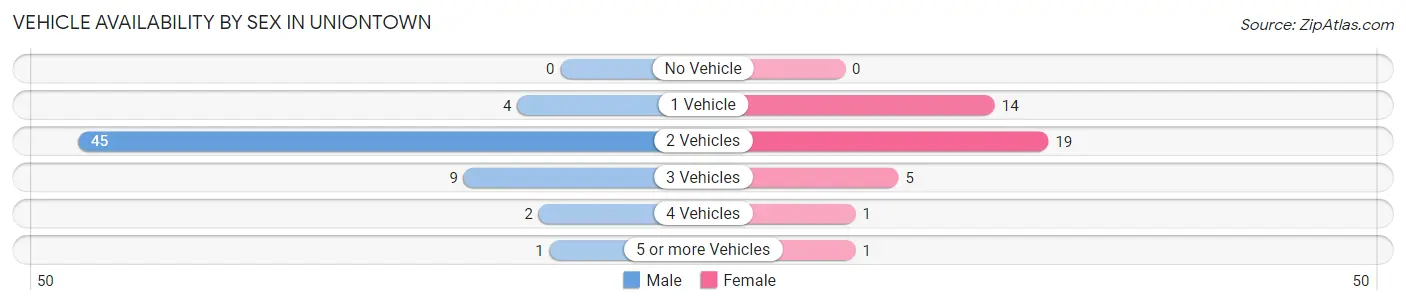
| Vehicles Available | Male | Female |
| No Vehicle | 0 (0.0%) | 0 (0.0%) |
| 1 Vehicle | 4 (6.6%) | 14 (35.0%) |
| 2 Vehicles | 45 (73.8%) | 19 (47.5%) |
| 3 Vehicles | 9 (14.7%) | 5 (12.5%) |
| 4 Vehicles | 2 (3.3%) | 1 (2.5%) |
| 5 or more Vehicles | 1 (1.6%) | 1 (2.5%) |
| Total | 61 (100.0%) | 40 (100.0%) |
Commute Time in Uniontown
The most frequently occuring commute durations in Uniontown are 40 to 44 minutes (21 commuters, 22.8%), 20 to 24 minutes (18 commuters, 19.6%), and less than 5 minutes (14 commuters, 15.2%).
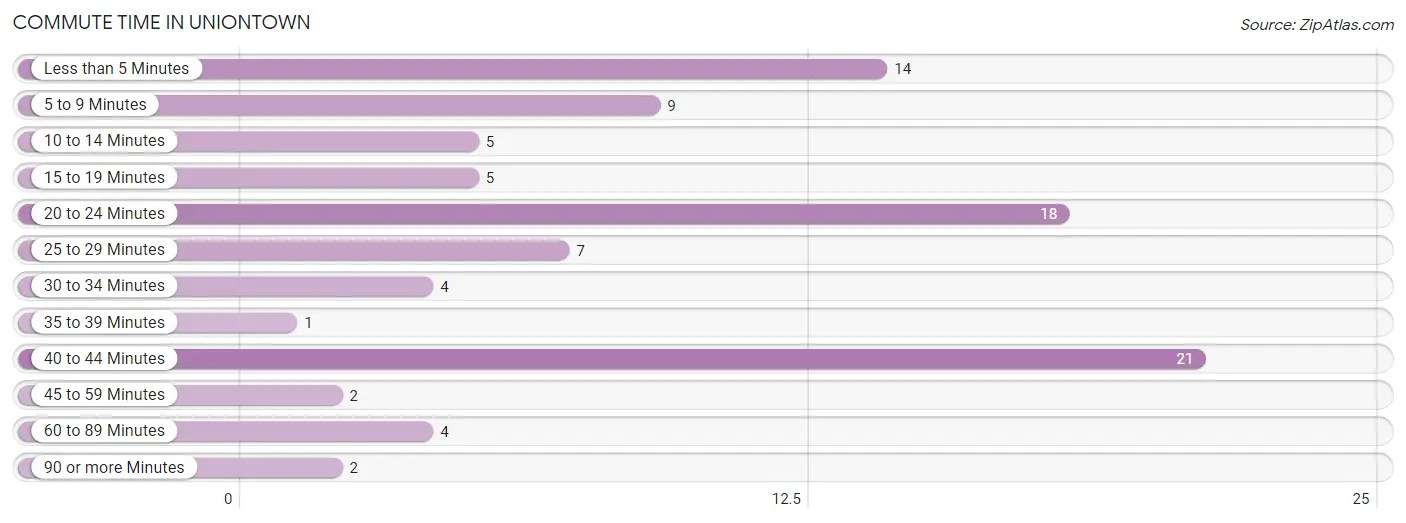
| Commute Time | # Commuters | % Commuters |
| Less than 5 Minutes | 14 | 15.2% |
| 5 to 9 Minutes | 9 | 9.8% |
| 10 to 14 Minutes | 5 | 5.4% |
| 15 to 19 Minutes | 5 | 5.4% |
| 20 to 24 Minutes | 18 | 19.6% |
| 25 to 29 Minutes | 7 | 7.6% |
| 30 to 34 Minutes | 4 | 4.3% |
| 35 to 39 Minutes | 1 | 1.1% |
| 40 to 44 Minutes | 21 | 22.8% |
| 45 to 59 Minutes | 2 | 2.2% |
| 60 to 89 Minutes | 4 | 4.3% |
| 90 or more Minutes | 2 | 2.2% |
Commute Time by Sex in Uniontown
The most common commute times in Uniontown are 40 to 44 minutes (17 commuters, 27.9%) for males and 20 to 24 minutes (6 commuters, 19.4%) for females.
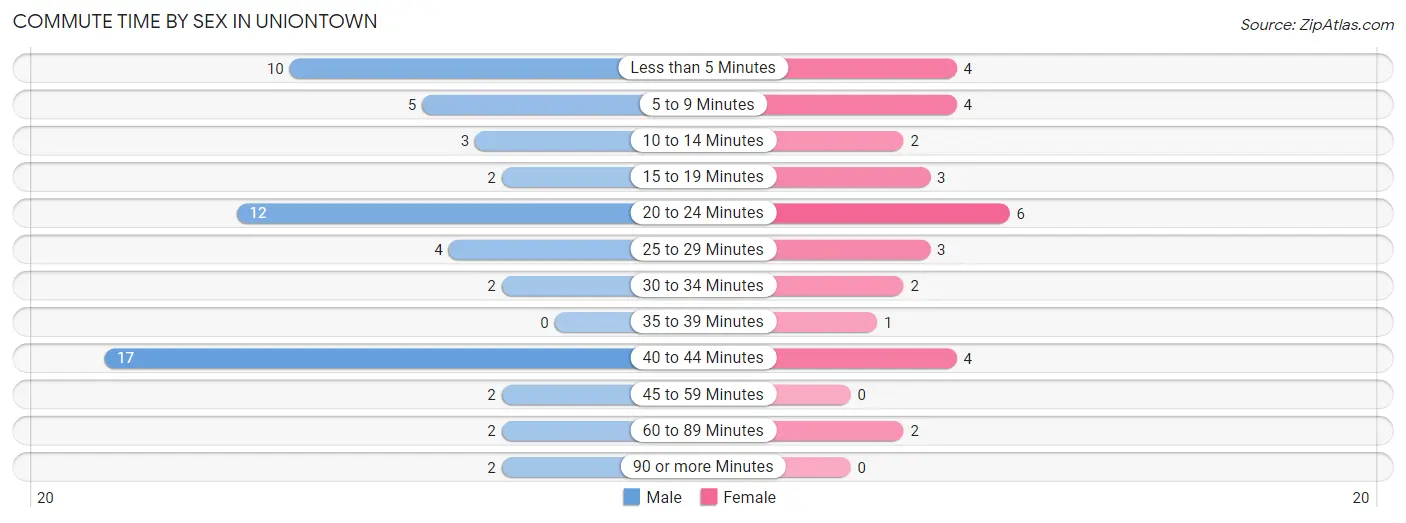
| Commute Time | Male | Female |
| Less than 5 Minutes | 10 (16.4%) | 4 (12.9%) |
| 5 to 9 Minutes | 5 (8.2%) | 4 (12.9%) |
| 10 to 14 Minutes | 3 (4.9%) | 2 (6.5%) |
| 15 to 19 Minutes | 2 (3.3%) | 3 (9.7%) |
| 20 to 24 Minutes | 12 (19.7%) | 6 (19.4%) |
| 25 to 29 Minutes | 4 (6.6%) | 3 (9.7%) |
| 30 to 34 Minutes | 2 (3.3%) | 2 (6.5%) |
| 35 to 39 Minutes | 0 (0.0%) | 1 (3.2%) |
| 40 to 44 Minutes | 17 (27.9%) | 4 (12.9%) |
| 45 to 59 Minutes | 2 (3.3%) | 0 (0.0%) |
| 60 to 89 Minutes | 2 (3.3%) | 2 (6.5%) |
| 90 or more Minutes | 2 (3.3%) | 0 (0.0%) |
Time of Departure to Work by Sex in Uniontown
The most frequent times of departure to work in Uniontown are 12:00 PM to 3:59 PM (26, 42.6%) for males and 7:30 AM to 7:59 AM (9, 29.0%) for females.
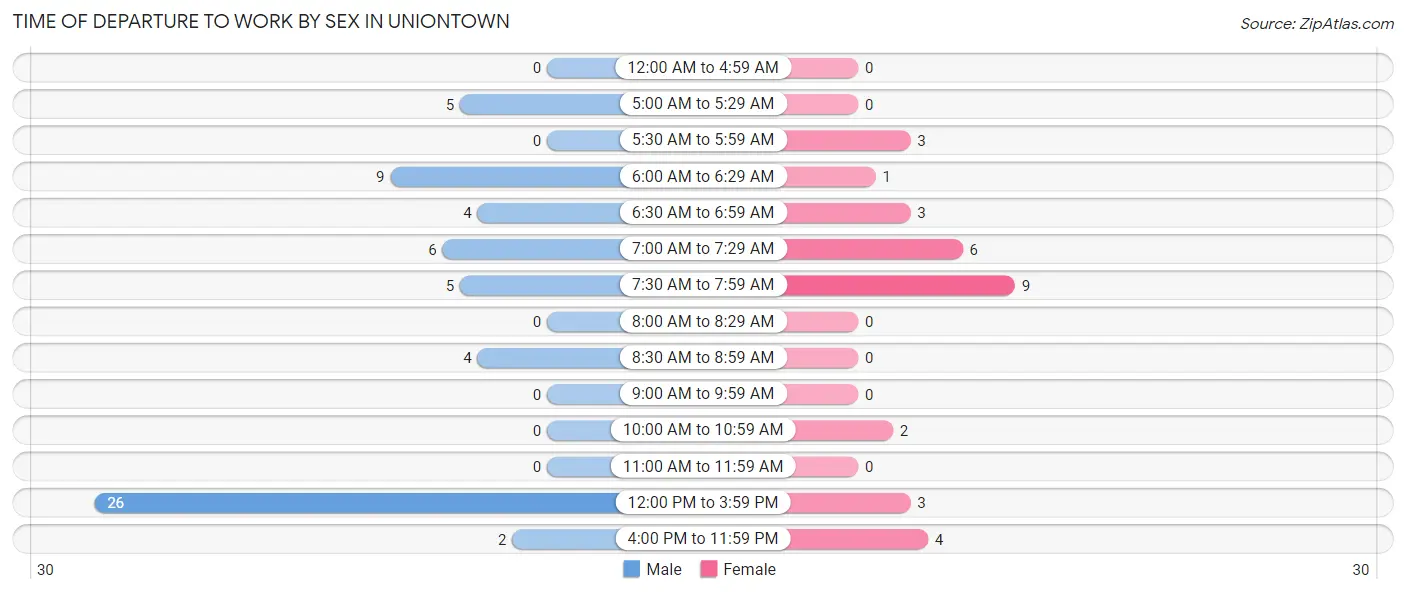
| Time of Departure | Male | Female |
| 12:00 AM to 4:59 AM | 0 (0.0%) | 0 (0.0%) |
| 5:00 AM to 5:29 AM | 5 (8.2%) | 0 (0.0%) |
| 5:30 AM to 5:59 AM | 0 (0.0%) | 3 (9.7%) |
| 6:00 AM to 6:29 AM | 9 (14.7%) | 1 (3.2%) |
| 6:30 AM to 6:59 AM | 4 (6.6%) | 3 (9.7%) |
| 7:00 AM to 7:29 AM | 6 (9.8%) | 6 (19.4%) |
| 7:30 AM to 7:59 AM | 5 (8.2%) | 9 (29.0%) |
| 8:00 AM to 8:29 AM | 0 (0.0%) | 0 (0.0%) |
| 8:30 AM to 8:59 AM | 4 (6.6%) | 0 (0.0%) |
| 9:00 AM to 9:59 AM | 0 (0.0%) | 0 (0.0%) |
| 10:00 AM to 10:59 AM | 0 (0.0%) | 2 (6.5%) |
| 11:00 AM to 11:59 AM | 0 (0.0%) | 0 (0.0%) |
| 12:00 PM to 3:59 PM | 26 (42.6%) | 3 (9.7%) |
| 4:00 PM to 11:59 PM | 2 (3.3%) | 4 (12.9%) |
| Total | 61 (100.0%) | 31 (100.0%) |
Housing Occupancy in Uniontown
Occupancy by Ownership in Uniontown
Of the total 95 dwellings in Uniontown, owner-occupied units account for 72 (75.8%), while renter-occupied units make up 23 (24.2%).
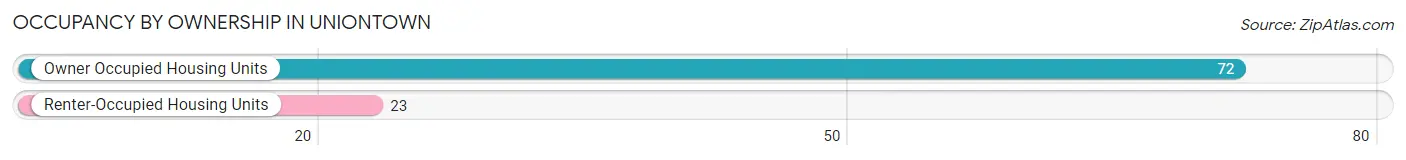
| Occupancy | # Housing Units | % Housing Units |
| Owner Occupied Housing Units | 72 | 75.8% |
| Renter-Occupied Housing Units | 23 | 24.2% |
| Total Occupied Housing Units | 95 | 100.0% |
Occupancy by Household Size in Uniontown
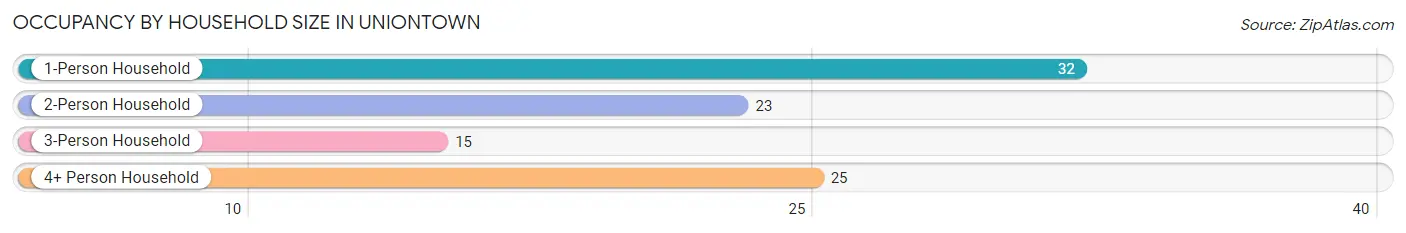
| Household Size | # Housing Units | % Housing Units |
| 1-Person Household | 32 | 33.7% |
| 2-Person Household | 23 | 24.2% |
| 3-Person Household | 15 | 15.8% |
| 4+ Person Household | 25 | 26.3% |
| Total Housing Units | 95 | 100.0% |
Occupancy by Ownership by Household Size in Uniontown
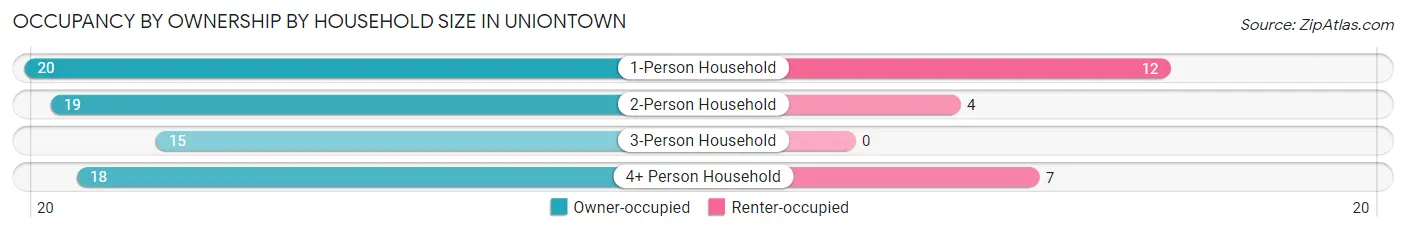
| Household Size | Owner-occupied | Renter-occupied |
| 1-Person Household | 20 (62.5%) | 12 (37.5%) |
| 2-Person Household | 19 (82.6%) | 4 (17.4%) |
| 3-Person Household | 15 (100.0%) | 0 (0.0%) |
| 4+ Person Household | 18 (72.0%) | 7 (28.0%) |
| Total Housing Units | 72 (75.8%) | 23 (24.2%) |
Occupancy by Educational Attainment in Uniontown
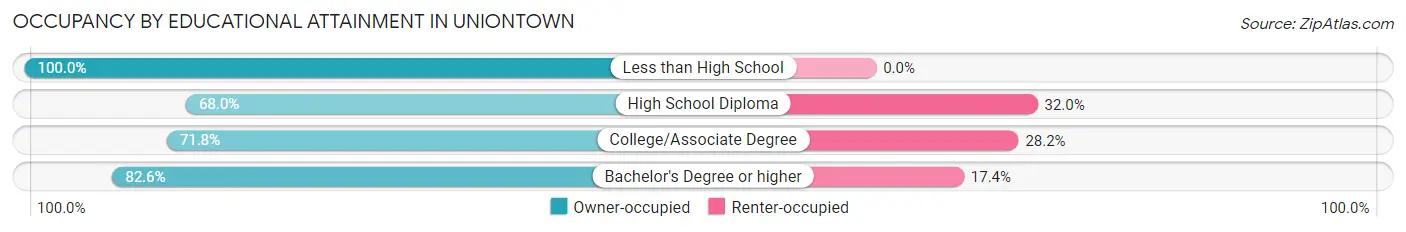
| Household Size | Owner-occupied | Renter-occupied |
| Less than High School | 8 (100.0%) | 0 (0.0%) |
| High School Diploma | 17 (68.0%) | 8 (32.0%) |
| College/Associate Degree | 28 (71.8%) | 11 (28.2%) |
| Bachelor's Degree or higher | 19 (82.6%) | 4 (17.4%) |
Occupancy by Age of Householder in Uniontown
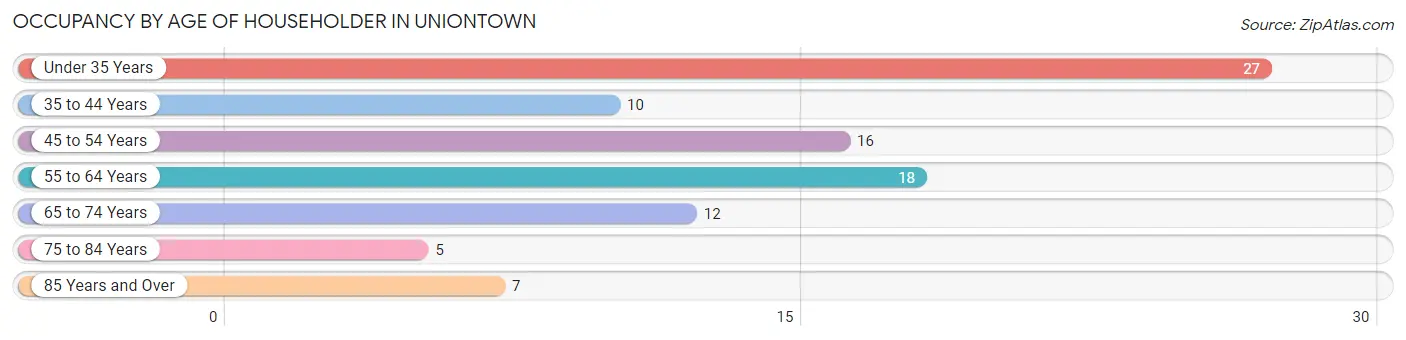
| Age Bracket | # Households | % Households |
| Under 35 Years | 27 | 28.4% |
| 35 to 44 Years | 10 | 10.5% |
| 45 to 54 Years | 16 | 16.8% |
| 55 to 64 Years | 18 | 19.0% |
| 65 to 74 Years | 12 | 12.6% |
| 75 to 84 Years | 5 | 5.3% |
| 85 Years and Over | 7 | 7.4% |
| Total | 95 | 100.0% |
Housing Finances in Uniontown
Median Income by Occupancy in Uniontown
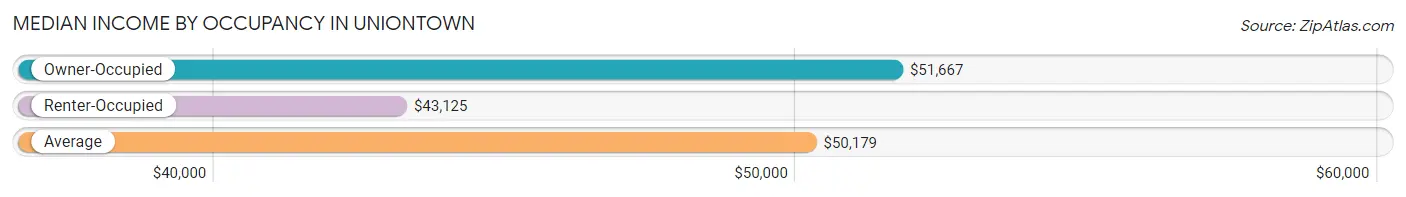
| Occupancy Type | # Households | Median Income |
| Owner-Occupied | 72 (75.8%) | $51,667 |
| Renter-Occupied | 23 (24.2%) | $43,125 |
| Average | 95 (100.0%) | $50,179 |
Occupancy by Householder Income Bracket in Uniontown
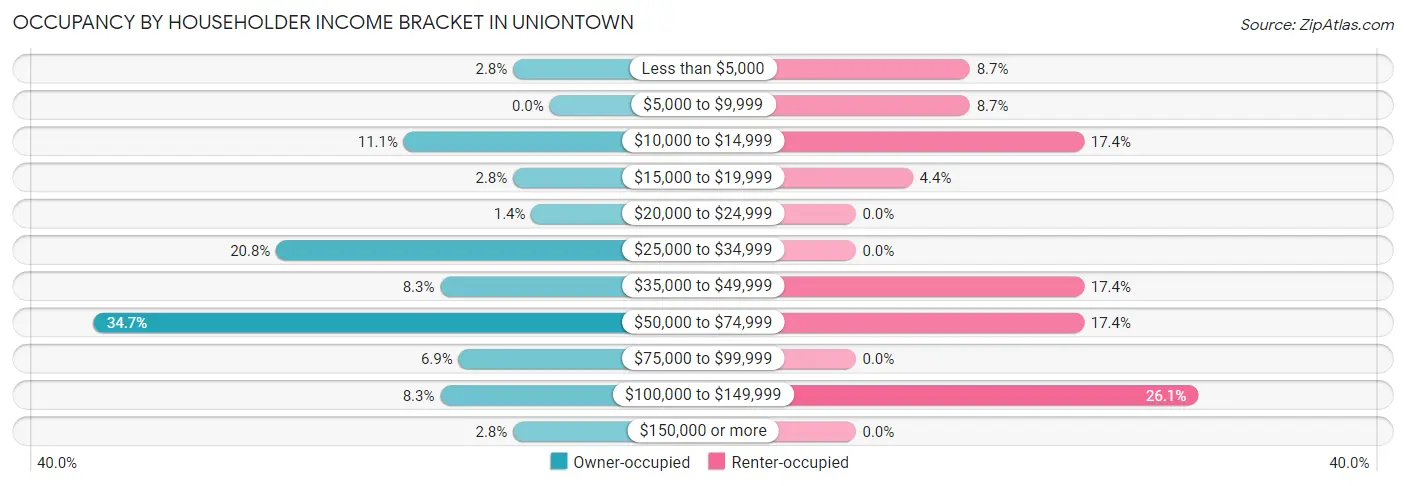
| Income Bracket | Owner-occupied | Renter-occupied |
| Less than $5,000 | 2 (2.8%) | 2 (8.7%) |
| $5,000 to $9,999 | 0 (0.0%) | 2 (8.7%) |
| $10,000 to $14,999 | 8 (11.1%) | 4 (17.4%) |
| $15,000 to $19,999 | 2 (2.8%) | 1 (4.3%) |
| $20,000 to $24,999 | 1 (1.4%) | 0 (0.0%) |
| $25,000 to $34,999 | 15 (20.8%) | 0 (0.0%) |
| $35,000 to $49,999 | 6 (8.3%) | 4 (17.4%) |
| $50,000 to $74,999 | 25 (34.7%) | 4 (17.4%) |
| $75,000 to $99,999 | 5 (6.9%) | 0 (0.0%) |
| $100,000 to $149,999 | 6 (8.3%) | 6 (26.1%) |
| $150,000 or more | 2 (2.8%) | 0 (0.0%) |
| Total | 72 (100.0%) | 23 (100.0%) |
Monthly Housing Cost Tiers in Uniontown
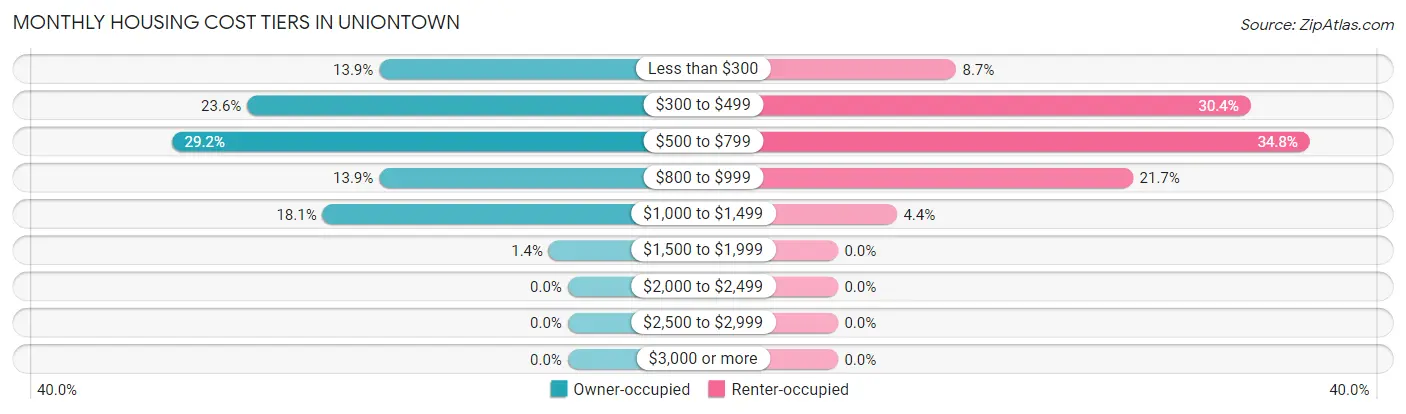
| Monthly Cost | Owner-occupied | Renter-occupied |
| Less than $300 | 10 (13.9%) | 2 (8.7%) |
| $300 to $499 | 17 (23.6%) | 7 (30.4%) |
| $500 to $799 | 21 (29.2%) | 8 (34.8%) |
| $800 to $999 | 10 (13.9%) | 5 (21.7%) |
| $1,000 to $1,499 | 13 (18.1%) | 1 (4.3%) |
| $1,500 to $1,999 | 1 (1.4%) | 0 (0.0%) |
| $2,000 to $2,499 | 0 (0.0%) | 0 (0.0%) |
| $2,500 to $2,999 | 0 (0.0%) | 0 (0.0%) |
| $3,000 or more | 0 (0.0%) | 0 (0.0%) |
| Total | 72 (100.0%) | 23 (100.0%) |
Physical Housing Characteristics in Uniontown
Housing Structures in Uniontown
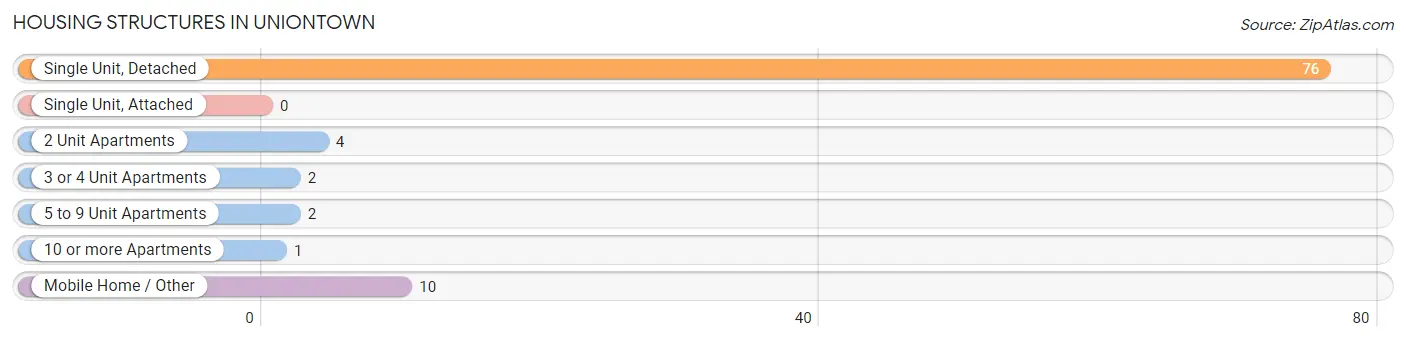
| Structure Type | # Housing Units | % Housing Units |
| Single Unit, Detached | 76 | 80.0% |
| Single Unit, Attached | 0 | 0.0% |
| 2 Unit Apartments | 4 | 4.2% |
| 3 or 4 Unit Apartments | 2 | 2.1% |
| 5 to 9 Unit Apartments | 2 | 2.1% |
| 10 or more Apartments | 1 | 1.1% |
| Mobile Home / Other | 10 | 10.5% |
| Total | 95 | 100.0% |
Housing Structures by Occupancy in Uniontown
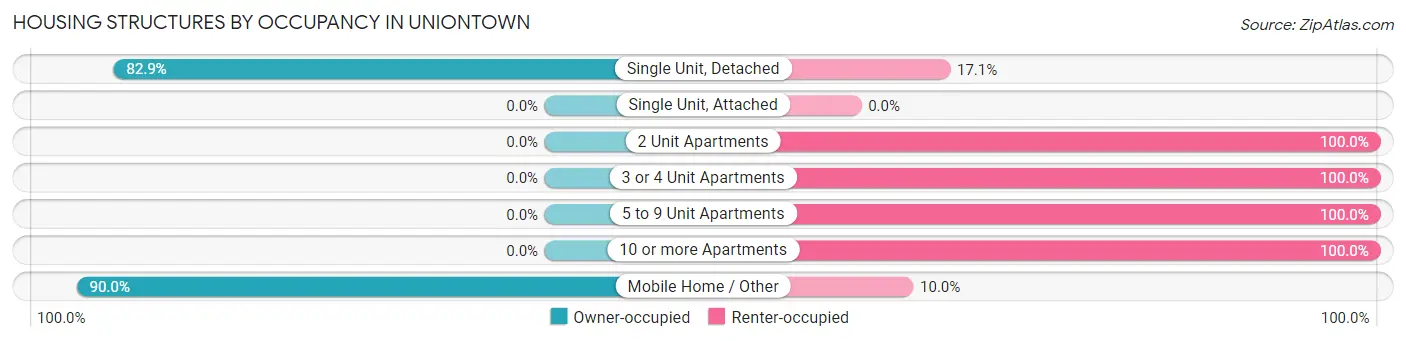
| Structure Type | Owner-occupied | Renter-occupied |
| Single Unit, Detached | 63 (82.9%) | 13 (17.1%) |
| Single Unit, Attached | 0 (0.0%) | 0 (0.0%) |
| 2 Unit Apartments | 0 (0.0%) | 4 (100.0%) |
| 3 or 4 Unit Apartments | 0 (0.0%) | 2 (100.0%) |
| 5 to 9 Unit Apartments | 0 (0.0%) | 2 (100.0%) |
| 10 or more Apartments | 0 (0.0%) | 1 (100.0%) |
| Mobile Home / Other | 9 (90.0%) | 1 (10.0%) |
| Total | 72 (75.8%) | 23 (24.2%) |
Housing Structures by Number of Rooms in Uniontown

| Number of Rooms | Owner-occupied | Renter-occupied |
| 1 Room | 0 (0.0%) | 1 (4.3%) |
| 2 or 3 Rooms | 2 (2.8%) | 6 (26.1%) |
| 4 or 5 Rooms | 43 (59.7%) | 5 (21.7%) |
| 6 or 7 Rooms | 17 (23.6%) | 11 (47.8%) |
| 8 or more Rooms | 10 (13.9%) | 0 (0.0%) |
| Total | 72 (100.0%) | 23 (100.0%) |
Housing Structure by Heating Type in Uniontown
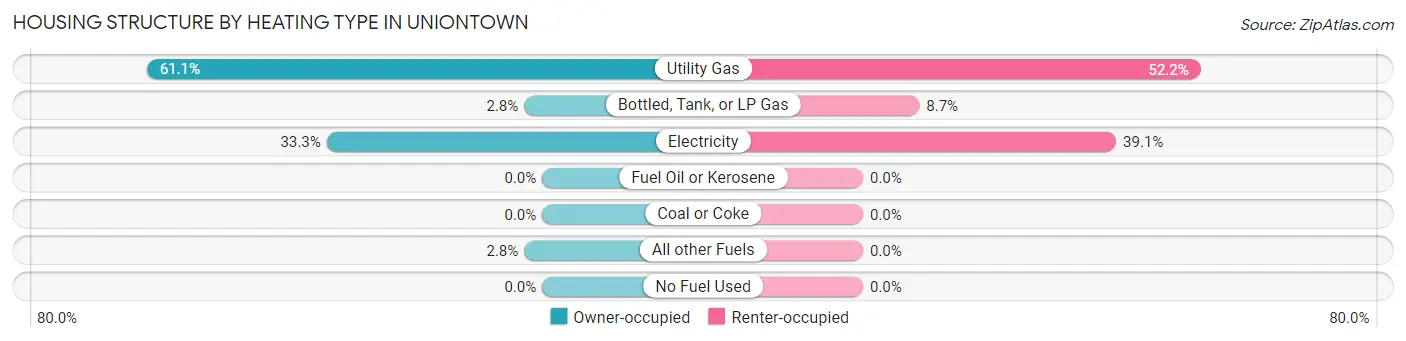
| Heating Type | Owner-occupied | Renter-occupied |
| Utility Gas | 44 (61.1%) | 12 (52.2%) |
| Bottled, Tank, or LP Gas | 2 (2.8%) | 2 (8.7%) |
| Electricity | 24 (33.3%) | 9 (39.1%) |
| Fuel Oil or Kerosene | 0 (0.0%) | 0 (0.0%) |
| Coal or Coke | 0 (0.0%) | 0 (0.0%) |
| All other Fuels | 2 (2.8%) | 0 (0.0%) |
| No Fuel Used | 0 (0.0%) | 0 (0.0%) |
| Total | 72 (100.0%) | 23 (100.0%) |
Household Vehicle Usage in Uniontown
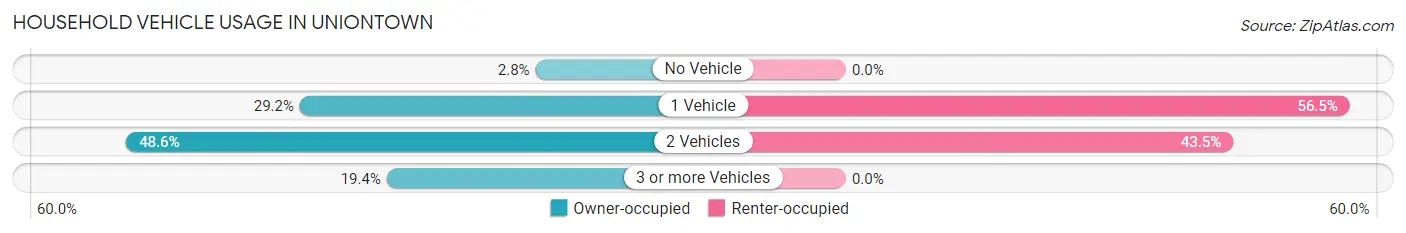
| Vehicles per Household | Owner-occupied | Renter-occupied |
| No Vehicle | 2 (2.8%) | 0 (0.0%) |
| 1 Vehicle | 21 (29.2%) | 13 (56.5%) |
| 2 Vehicles | 35 (48.6%) | 10 (43.5%) |
| 3 or more Vehicles | 14 (19.4%) | 0 (0.0%) |
| Total | 72 (100.0%) | 23 (100.0%) |
Real Estate & Mortgages in Uniontown
Real Estate and Mortgage Overview in Uniontown
| Characteristic | Without Mortgage | With Mortgage |
| Housing Units | 39 | 33 |
| Median Property Value | $34,700 | $72,500 |
| Median Household Income | $41,563 | $2 |
| Monthly Housing Costs | $417 | $0 |
| Real Estate Taxes | $556 | $0 |
Property Value by Mortgage Status in Uniontown
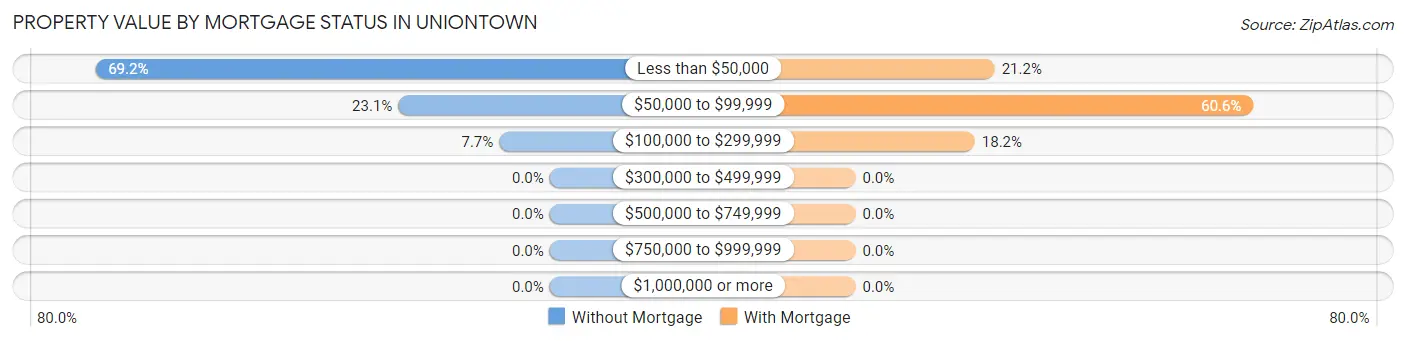
| Property Value | Without Mortgage | With Mortgage |
| Less than $50,000 | 27 (69.2%) | 7 (21.2%) |
| $50,000 to $99,999 | 9 (23.1%) | 20 (60.6%) |
| $100,000 to $299,999 | 3 (7.7%) | 6 (18.2%) |
| $300,000 to $499,999 | 0 (0.0%) | 0 (0.0%) |
| $500,000 to $749,999 | 0 (0.0%) | 0 (0.0%) |
| $750,000 to $999,999 | 0 (0.0%) | 0 (0.0%) |
| $1,000,000 or more | 0 (0.0%) | 0 (0.0%) |
| Total | 39 (100.0%) | 33 (100.0%) |
Household Income by Mortgage Status in Uniontown
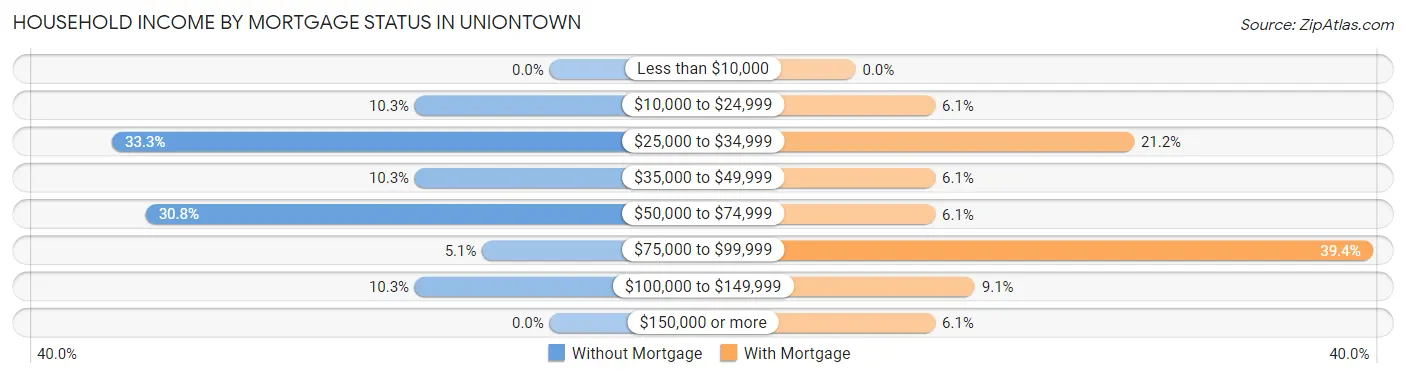
| Household Income | Without Mortgage | With Mortgage |
| Less than $10,000 | 0 (0.0%) | 0 (0.0%) |
| $10,000 to $24,999 | 4 (10.3%) | 2 (6.1%) |
| $25,000 to $34,999 | 13 (33.3%) | 7 (21.2%) |
| $35,000 to $49,999 | 4 (10.3%) | 2 (6.1%) |
| $50,000 to $74,999 | 12 (30.8%) | 2 (6.1%) |
| $75,000 to $99,999 | 2 (5.1%) | 13 (39.4%) |
| $100,000 to $149,999 | 4 (10.3%) | 3 (9.1%) |
| $150,000 or more | 0 (0.0%) | 2 (6.1%) |
| Total | 39 (100.0%) | 33 (100.0%) |
Property Value to Household Income Ratio in Uniontown
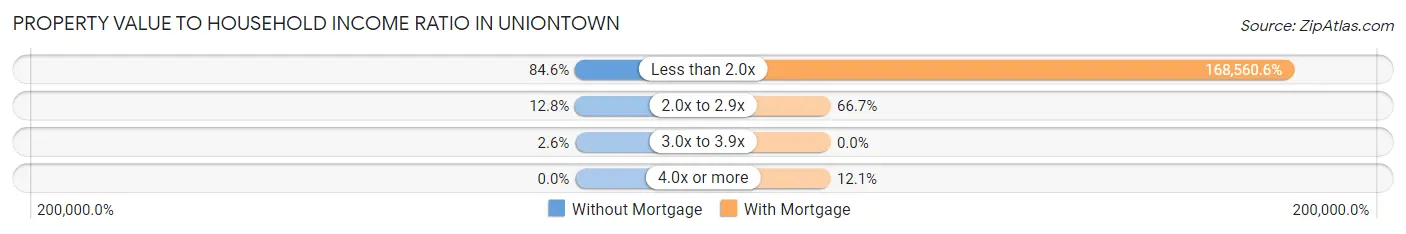
| Value-to-Income Ratio | Without Mortgage | With Mortgage |
| Less than 2.0x | 33 (84.6%) | 55,625 (168,560.6%) |
| 2.0x to 2.9x | 5 (12.8%) | 22 (66.7%) |
| 3.0x to 3.9x | 1 (2.6%) | 0 (0.0%) |
| 4.0x or more | 0 (0.0%) | 4 (12.1%) |
| Total | 39 (100.0%) | 33 (100.0%) |
Real Estate Taxes by Mortgage Status in Uniontown
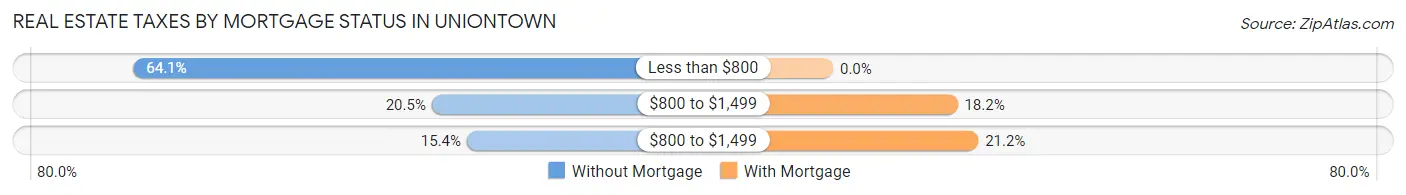
| Property Taxes | Without Mortgage | With Mortgage |
| Less than $800 | 25 (64.1%) | 0 (0.0%) |
| $800 to $1,499 | 8 (20.5%) | 6 (18.2%) |
| $800 to $1,499 | 6 (15.4%) | 7 (21.2%) |
| Total | 39 (100.0%) | 33 (100.0%) |
Health & Disability in Uniontown
Health Insurance Coverage by Age in Uniontown
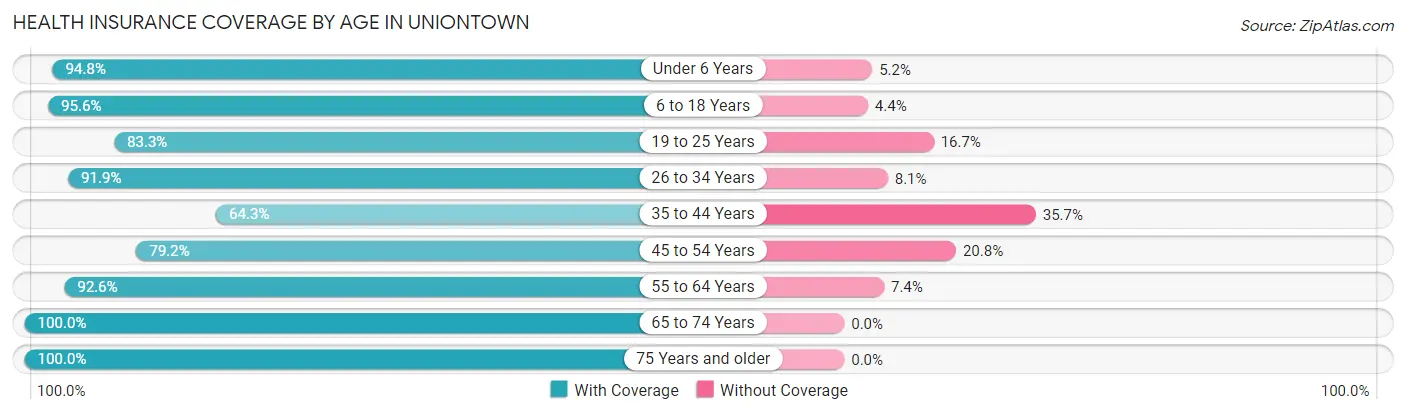
| Age Bracket | With Coverage | Without Coverage |
| Under 6 Years | 91 (94.8%) | 5 (5.2%) |
| 6 to 18 Years | 87 (95.6%) | 4 (4.4%) |
| 19 to 25 Years | 25 (83.3%) | 5 (16.7%) |
| 26 to 34 Years | 34 (91.9%) | 3 (8.1%) |
| 35 to 44 Years | 9 (64.3%) | 5 (35.7%) |
| 45 to 54 Years | 19 (79.2%) | 5 (20.8%) |
| 55 to 64 Years | 25 (92.6%) | 2 (7.4%) |
| 65 to 74 Years | 25 (100.0%) | 0 (0.0%) |
| 75 Years and older | 12 (100.0%) | 0 (0.0%) |
| Total | 327 (91.8%) | 29 (8.2%) |
Health Insurance Coverage by Citizenship Status in Uniontown
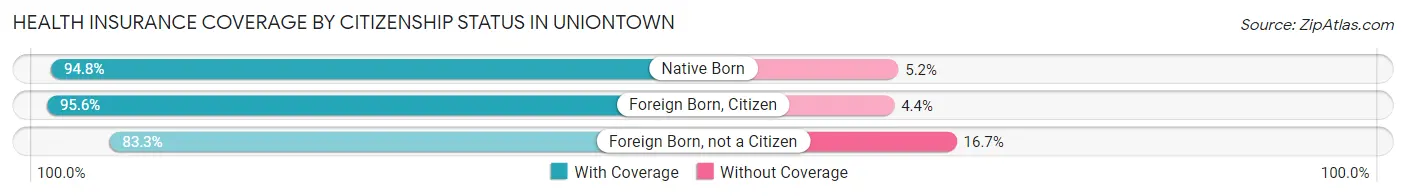
| Citizenship Status | With Coverage | Without Coverage |
| Native Born | 91 (94.8%) | 5 (5.2%) |
| Foreign Born, Citizen | 87 (95.6%) | 4 (4.4%) |
| Foreign Born, not a Citizen | 25 (83.3%) | 5 (16.7%) |
Health Insurance Coverage by Household Income in Uniontown
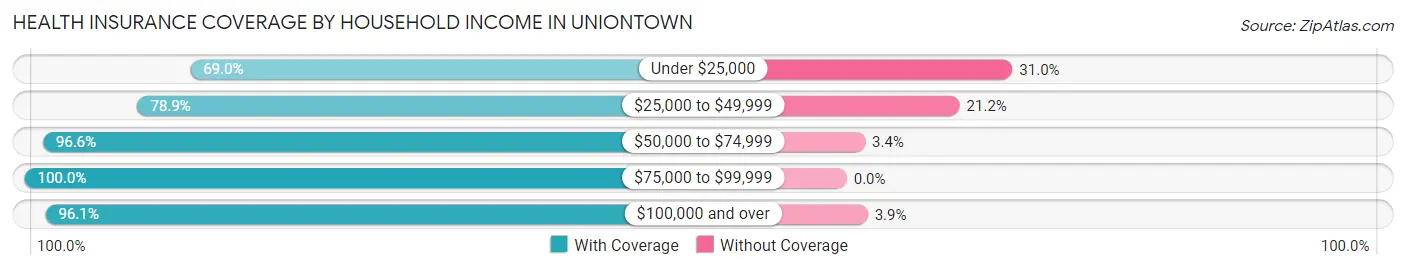
| Household Income | With Coverage | Without Coverage |
| Under $25,000 | 20 (69.0%) | 9 (31.0%) |
| $25,000 to $49,999 | 41 (78.8%) | 11 (21.1%) |
| $50,000 to $74,999 | 197 (96.6%) | 7 (3.4%) |
| $75,000 to $99,999 | 20 (100.0%) | 0 (0.0%) |
| $100,000 and over | 49 (96.1%) | 2 (3.9%) |
Public vs Private Health Insurance Coverage by Age in Uniontown
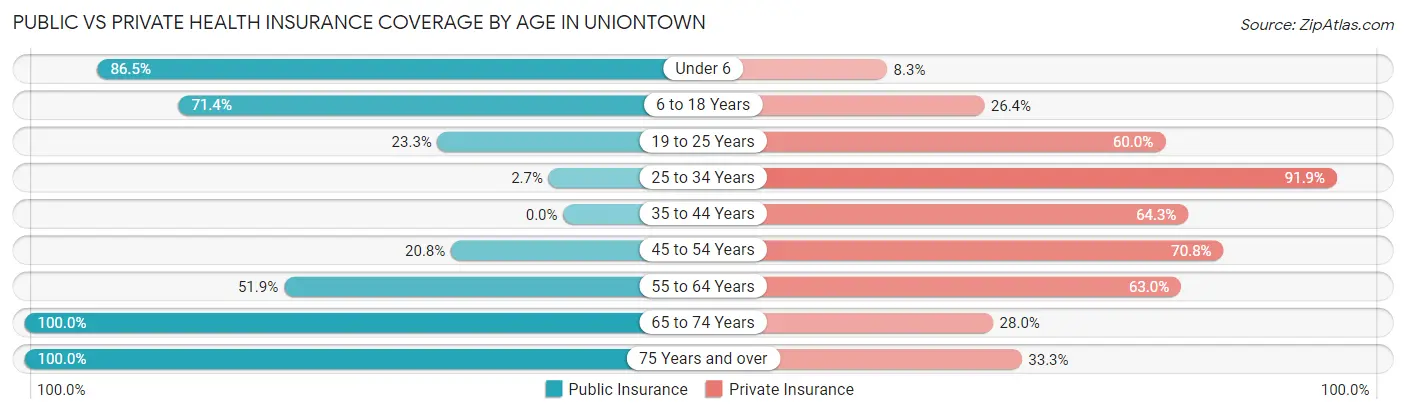
| Age Bracket | Public Insurance | Private Insurance |
| Under 6 | 83 (86.5%) | 8 (8.3%) |
| 6 to 18 Years | 65 (71.4%) | 24 (26.4%) |
| 19 to 25 Years | 7 (23.3%) | 18 (60.0%) |
| 25 to 34 Years | 1 (2.7%) | 34 (91.9%) |
| 35 to 44 Years | 0 (0.0%) | 9 (64.3%) |
| 45 to 54 Years | 5 (20.8%) | 17 (70.8%) |
| 55 to 64 Years | 14 (51.8%) | 17 (63.0%) |
| 65 to 74 Years | 25 (100.0%) | 7 (28.0%) |
| 75 Years and over | 12 (100.0%) | 4 (33.3%) |
| Total | 212 (59.6%) | 138 (38.8%) |
Disability Status by Sex by Age in Uniontown
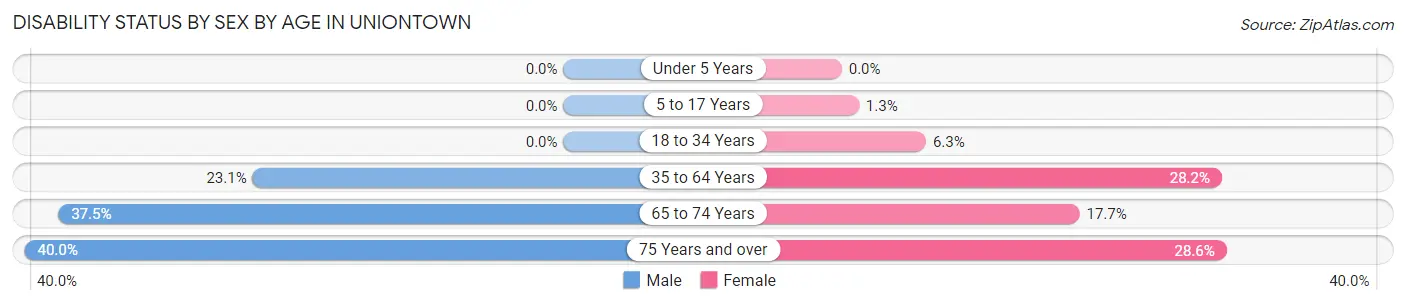
| Age Bracket | Male | Female |
| Under 5 Years | 0 (0.0%) | 0 (0.0%) |
| 5 to 17 Years | 0 (0.0%) | 1 (1.3%) |
| 18 to 34 Years | 0 (0.0%) | 2 (6.2%) |
| 35 to 64 Years | 6 (23.1%) | 11 (28.2%) |
| 65 to 74 Years | 3 (37.5%) | 3 (17.6%) |
| 75 Years and over | 2 (40.0%) | 2 (28.6%) |
Disability Class by Sex by Age in Uniontown
Disability Class: Hearing Difficulty
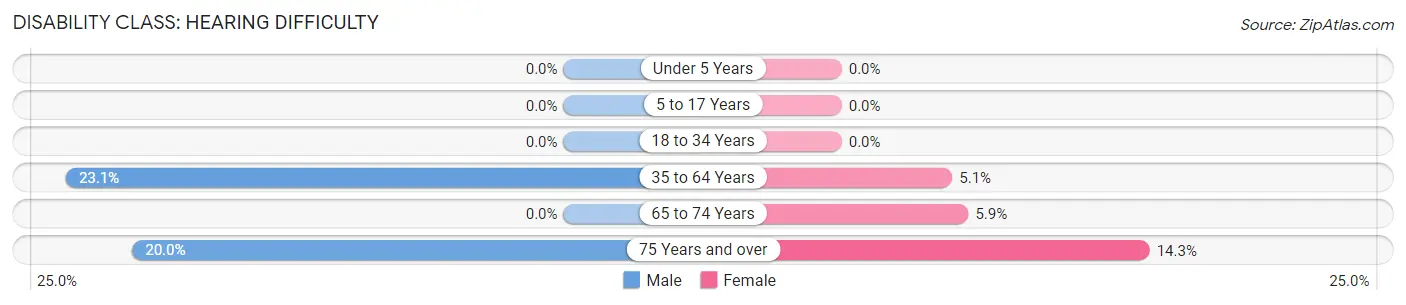
| Age Bracket | Male | Female |
| Under 5 Years | 0 (0.0%) | 0 (0.0%) |
| 5 to 17 Years | 0 (0.0%) | 0 (0.0%) |
| 18 to 34 Years | 0 (0.0%) | 0 (0.0%) |
| 35 to 64 Years | 6 (23.1%) | 2 (5.1%) |
| 65 to 74 Years | 0 (0.0%) | 1 (5.9%) |
| 75 Years and over | 1 (20.0%) | 1 (14.3%) |
Disability Class: Vision Difficulty
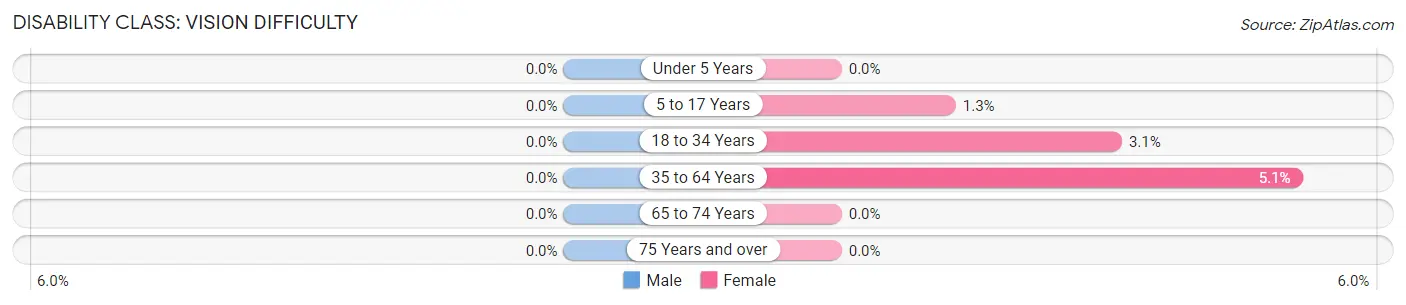
| Age Bracket | Male | Female |
| Under 5 Years | 0 (0.0%) | 0 (0.0%) |
| 5 to 17 Years | 0 (0.0%) | 1 (1.3%) |
| 18 to 34 Years | 0 (0.0%) | 1 (3.1%) |
| 35 to 64 Years | 0 (0.0%) | 2 (5.1%) |
| 65 to 74 Years | 0 (0.0%) | 0 (0.0%) |
| 75 Years and over | 0 (0.0%) | 0 (0.0%) |
Disability Class: Cognitive Difficulty
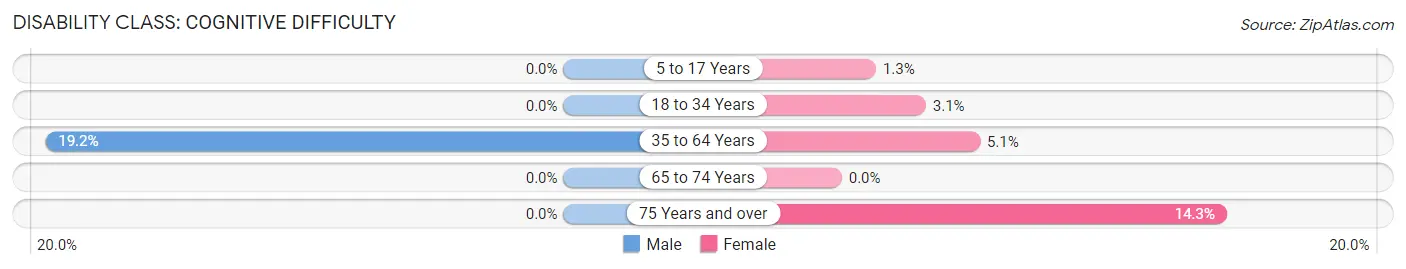
| Age Bracket | Male | Female |
| 5 to 17 Years | 0 (0.0%) | 1 (1.3%) |
| 18 to 34 Years | 0 (0.0%) | 1 (3.1%) |
| 35 to 64 Years | 5 (19.2%) | 2 (5.1%) |
| 65 to 74 Years | 0 (0.0%) | 0 (0.0%) |
| 75 Years and over | 0 (0.0%) | 1 (14.3%) |
Disability Class: Ambulatory Difficulty
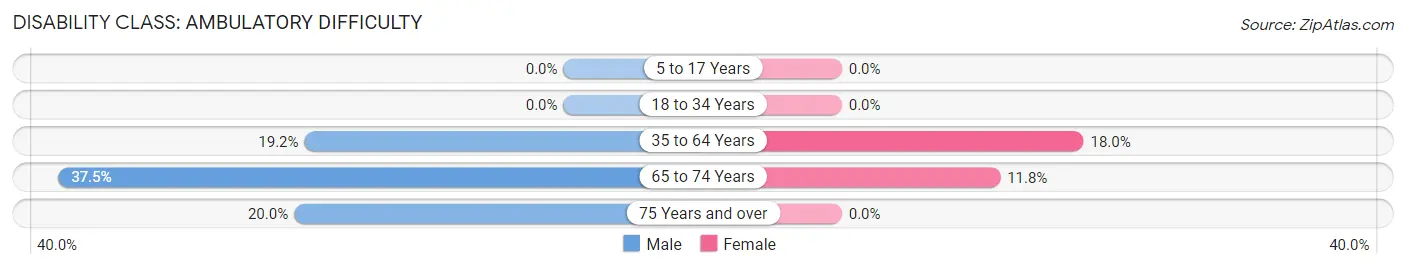
| Age Bracket | Male | Female |
| 5 to 17 Years | 0 (0.0%) | 0 (0.0%) |
| 18 to 34 Years | 0 (0.0%) | 0 (0.0%) |
| 35 to 64 Years | 5 (19.2%) | 7 (17.9%) |
| 65 to 74 Years | 3 (37.5%) | 2 (11.8%) |
| 75 Years and over | 1 (20.0%) | 0 (0.0%) |
Disability Class: Self-Care Difficulty
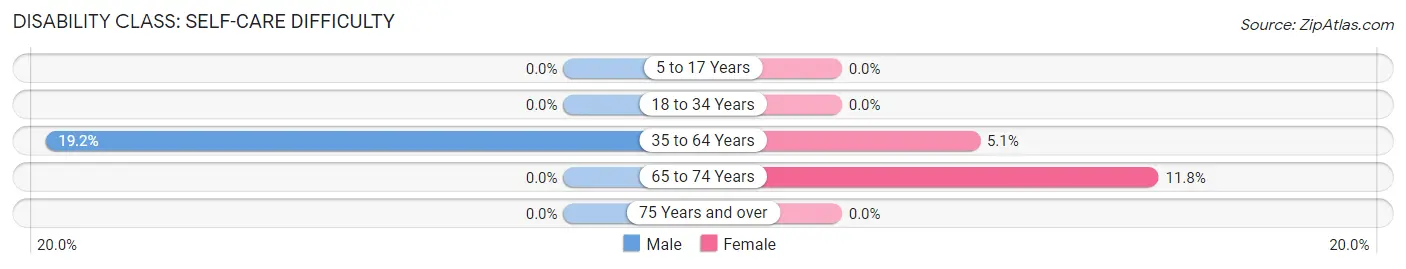
| Age Bracket | Male | Female |
| 5 to 17 Years | 0 (0.0%) | 0 (0.0%) |
| 18 to 34 Years | 0 (0.0%) | 0 (0.0%) |
| 35 to 64 Years | 5 (19.2%) | 2 (5.1%) |
| 65 to 74 Years | 0 (0.0%) | 2 (11.8%) |
| 75 Years and over | 0 (0.0%) | 0 (0.0%) |
Technology Access in Uniontown
Computing Device Access in Uniontown
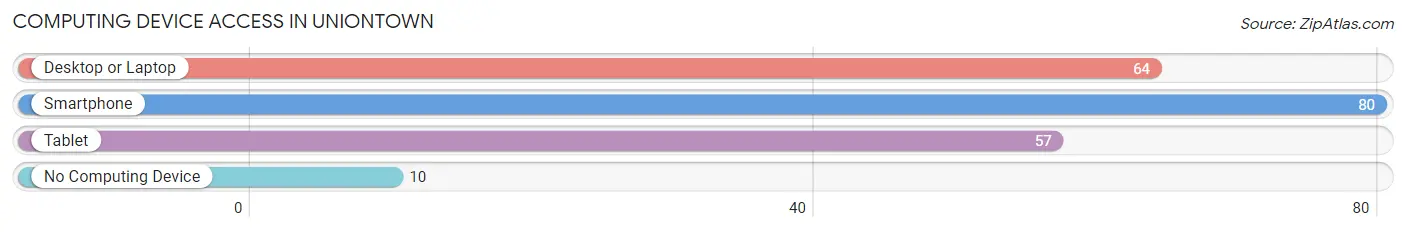
| Device Type | # Households | % Households |
| Desktop or Laptop | 64 | 67.4% |
| Smartphone | 80 | 84.2% |
| Tablet | 57 | 60.0% |
| No Computing Device | 10 | 10.5% |
| Total | 95 | 100.0% |
Internet Access in Uniontown
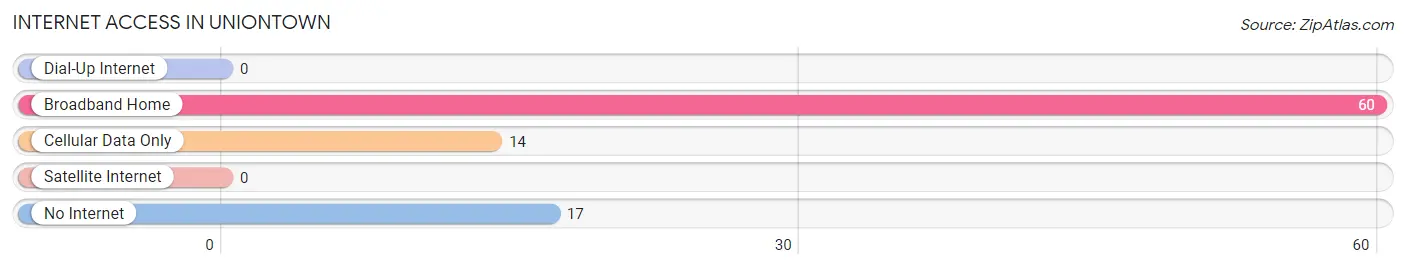
| Internet Type | # Households | % Households |
| Dial-Up Internet | 0 | 0.0% |
| Broadband Home | 60 | 63.2% |
| Cellular Data Only | 14 | 14.7% |
| Satellite Internet | 0 | 0.0% |
| No Internet | 17 | 17.9% |
| Total | 95 | 100.0% |
Uniontown Summary
Introduction
Uniontown is a small town located in the southeastern corner of Kansas. It is situated in the county of Bourbon, and is part of the Fort Scott Micropolitan Statistical Area. The town has a population of just over 1,000 people, and is known for its rural charm and friendly atmosphere. The town is home to a variety of businesses, including a grocery store, a bank, a post office, and a few restaurants. The town is also home to a number of churches, and is a popular destination for outdoor recreation.
History
Uniontown was founded in 1867 by a group of settlers from Ohio. The town was named after the Union Army, which had recently won the Civil War. The town was originally a farming community, and the settlers quickly established a post office and a school. The town grew slowly over the years, and by the early 1900s, it had become a thriving community.
In the 1920s, Uniontown experienced a period of growth, as the town was connected to the railroad. This allowed for the transportation of goods and services to and from the town, and it also allowed for the growth of the local economy. The town also experienced a period of growth during the 1950s and 1960s, as the town was connected to the interstate highway system.
Geography
Uniontown is located in the southeastern corner of Kansas, in the county of Bourbon. The town is situated on the banks of the Marmaton River, and is surrounded by rolling hills and farmland. The town is located approximately 30 miles from the city of Fort Scott, and is about an hour and a half drive from the state capital of Topeka.
The town has a total area of 1.2 square miles, and has an elevation of 890 feet. The town has a humid continental climate, with hot summers and cold winters. The average annual temperature is around 54 degrees Fahrenheit, and the average annual precipitation is around 37 inches.
Economy
Uniontown is a small town, and the local economy is largely based on agriculture. The town is home to a variety of farms, and the local economy is also supported by the nearby Fort Scott Micropolitan Statistical Area. The town is also home to a variety of businesses, including a grocery store, a bank, a post office, and a few restaurants.
Demographics
As of the 2010 census, Uniontown had a population of 1,072 people. The town has a median age of 39.7 years, and the median household income is $41,250. The town is predominantly white, with 92.3% of the population identifying as white. The town also has a small Hispanic population, with 4.2% of the population identifying as Hispanic or Latino.
Conclusion
Uniontown is a small town located in the southeastern corner of Kansas. The town has a population of just over 1,000 people, and is known for its rural charm and friendly atmosphere. The town is home to a variety of businesses, including a grocery store, a bank, a post office, and a few restaurants. The town is also home to a number of churches, and is a popular destination for outdoor recreation. The town has a humid continental climate, with hot summers and cold winters. The local economy is largely based on agriculture, and the town is also supported by the nearby Fort Scott Micropolitan Statistical Area. The town is predominantly white, with 92.3% of the population identifying as white.
Common Questions
What is Per Capita Income in Uniontown?
Per Capita income in Uniontown is $16,862.
What is the Median Family Income in Uniontown?
Median Family Income in Uniontown is $52,292.
What is the Median Household income in Uniontown?
Median Household Income in Uniontown is $50,179.
What is Inequality or Gini Index in Uniontown?
Inequality or Gini Index in Uniontown is 0.39.
What is the Total Population of Uniontown?
Total Population of Uniontown is 356.
What is the Total Male Population of Uniontown?
Total Male Population of Uniontown is 146.
What is the Total Female Population of Uniontown?
Total Female Population of Uniontown is 210.
What is the Ratio of Males per 100 Females in Uniontown?
There are 69.52 Males per 100 Females in Uniontown.
What is the Ratio of Females per 100 Males in Uniontown?
There are 143.84 Females per 100 Males in Uniontown.
What is the Median Population Age in Uniontown?
Median Population Age in Uniontown is 16.0 Years.
What is the Average Family Size in Uniontown
Average Family Size in Uniontown is 5.0 People.
What is the Average Household Size in Uniontown
Average Household Size in Uniontown is 3.8 People.
How Large is the Labor Force in Uniontown?
There are 111 People in the Labor Forcein in Uniontown.
What is the Percentage of People in the Labor Force in Uniontown?
62.4% of People are in the Labor Force in Uniontown.
What is the Unemployment Rate in Uniontown?
Unemployment Rate in Uniontown is 3.6%.