Syracuse, KS Map & Demographics
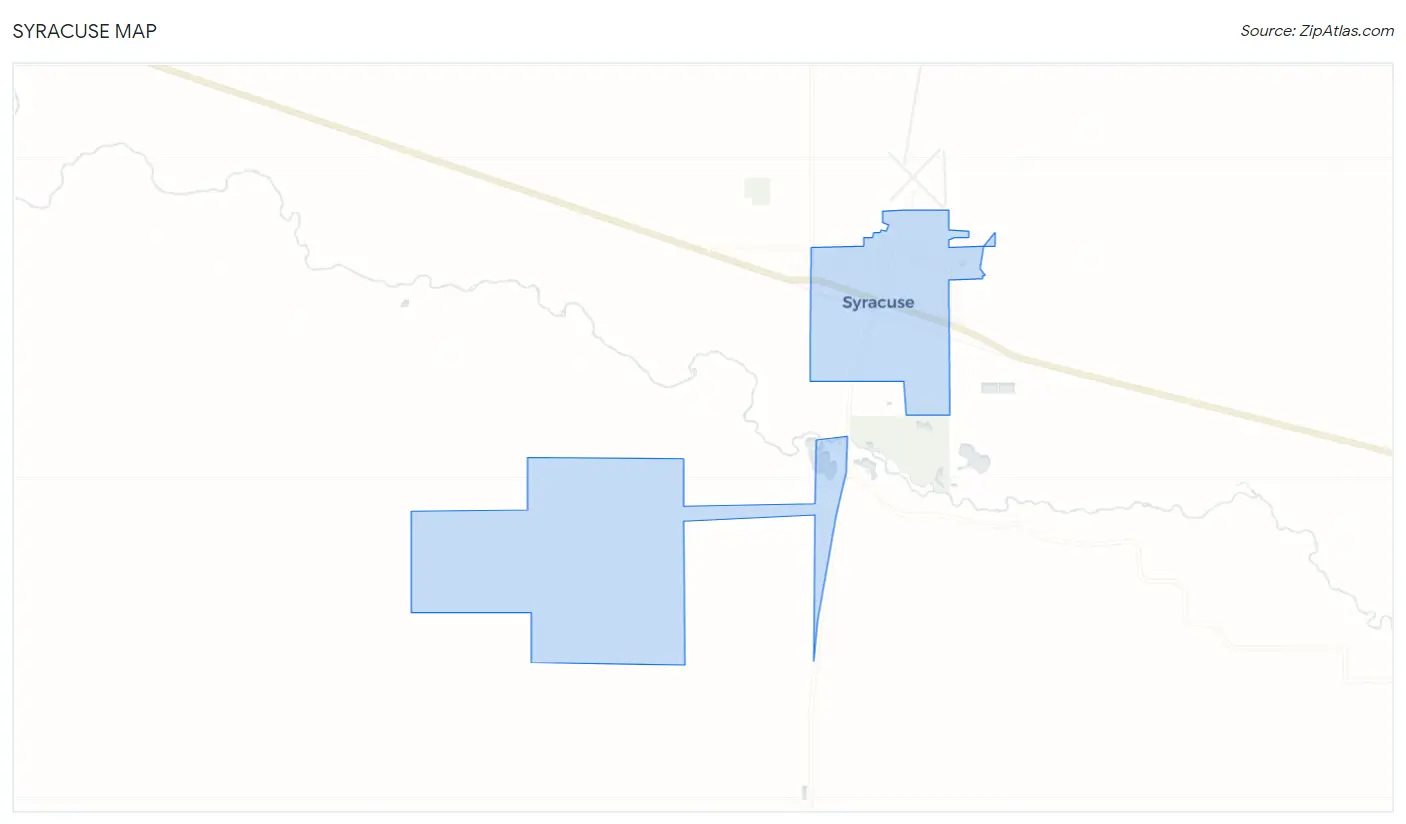
Syracuse Map
Syracuse Overview
$25,078
PER CAPITA INCOME
$68,523
AVG FAMILY INCOME
$52,143
AVG HOUSEHOLD INCOME
25.9%
WAGE / INCOME GAP [ % ]
74.1¢/ $1
WAGE / INCOME GAP [ $ ]
0.37
INEQUALITY / GINI INDEX
1,511
TOTAL POPULATION
675
MALE POPULATION
836
FEMALE POPULATION
80.74
MALES / 100 FEMALES
123.85
FEMALES / 100 MALES
34.8
MEDIAN AGE
3.8
AVG FAMILY SIZE
2.8
AVG HOUSEHOLD SIZE
647
LABOR FORCE [ PEOPLE ]
57.9%
PERCENT IN LABOR FORCE
Syracuse Zip Codes
Syracuse Area Codes
Income in Syracuse
Income Overview in Syracuse
Per Capita Income in Syracuse is $25,078, while median incomes of families and households are $68,523 and $52,143 respectively.
| Characteristic | Number | Measure |
| Per Capita Income | 1,511 | $25,078 |
| Median Family Income | 333 | $68,523 |
| Mean Family Income | 333 | $76,457 |
| Median Household Income | 530 | $52,143 |
| Mean Household Income | 530 | $63,169 |
| Income Deficit | 333 | $0 |
| Wage / Income Gap (%) | 1,511 | 25.87% |
| Wage / Income Gap ($) | 1,511 | 74.13¢ per $1 |
| Gini / Inequality Index | 1,511 | 0.37 |
Earnings by Sex in Syracuse
Average Earnings in Syracuse are $40,380, $42,073 for men and $31,190 for women, a difference of 25.9%.
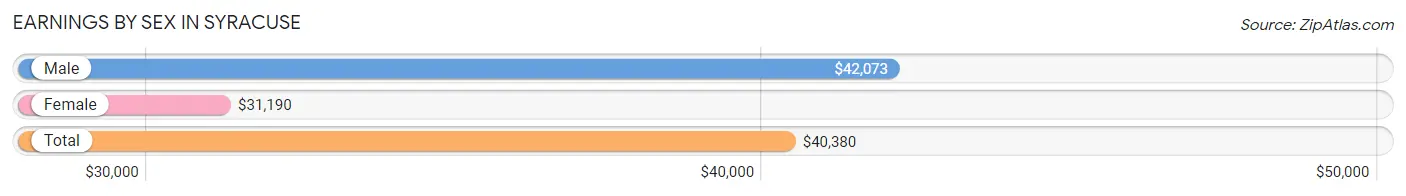
| Sex | Number | Average Earnings |
| Male | 349 (51.2%) | $42,073 |
| Female | 332 (48.7%) | $31,190 |
| Total | 681 (100.0%) | $40,380 |
Earnings by Sex by Income Bracket in Syracuse
The most common earnings brackets in Syracuse are $40,000 to $44,999 for men (82 | 23.5%) and $25,000 to $29,999 for women (44 | 13.3%).
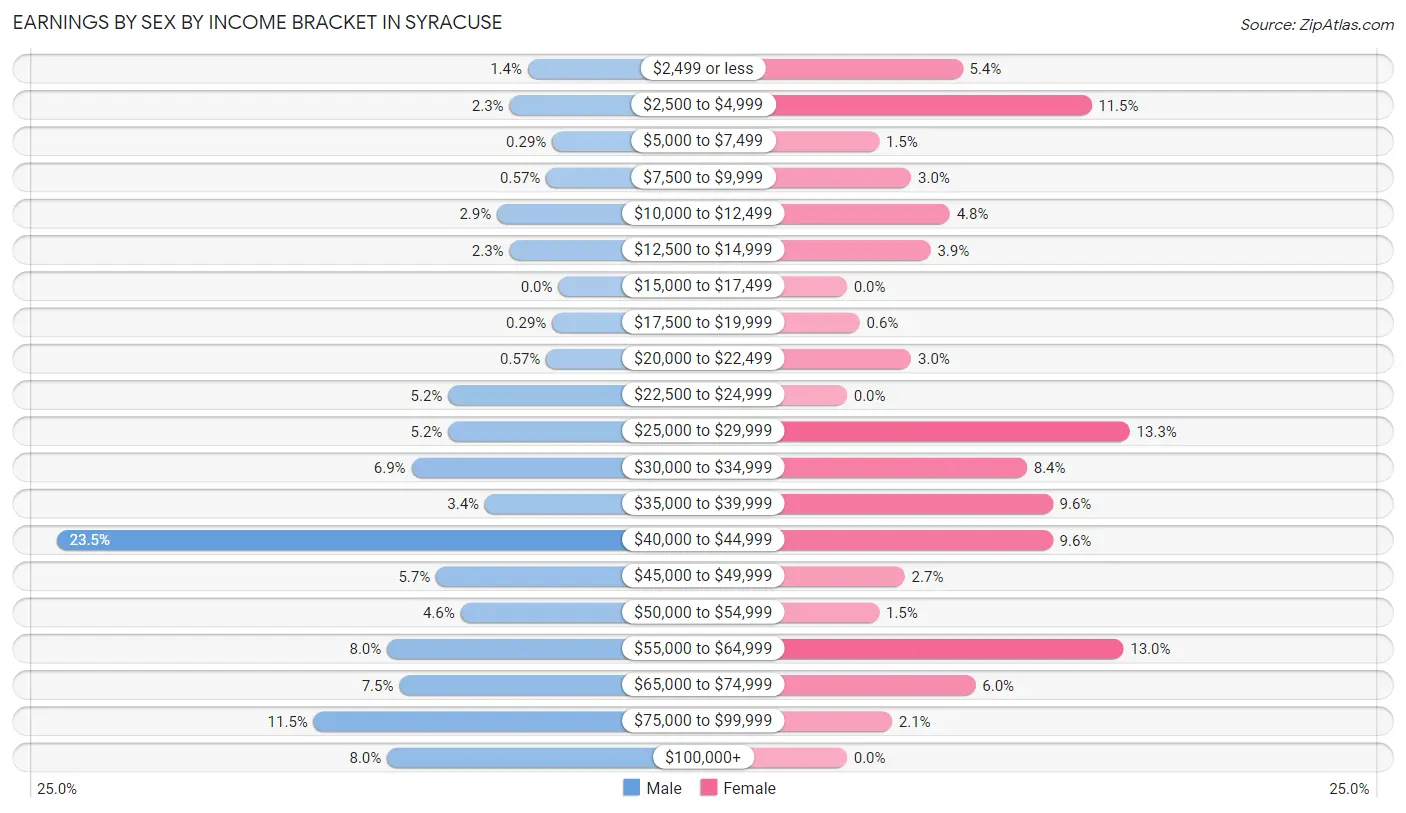
| Income | Male | Female |
| $2,499 or less | 5 (1.4%) | 18 (5.4%) |
| $2,500 to $4,999 | 8 (2.3%) | 38 (11.5%) |
| $5,000 to $7,499 | 1 (0.3%) | 5 (1.5%) |
| $7,500 to $9,999 | 2 (0.6%) | 10 (3.0%) |
| $10,000 to $12,499 | 10 (2.9%) | 16 (4.8%) |
| $12,500 to $14,999 | 8 (2.3%) | 13 (3.9%) |
| $15,000 to $17,499 | 0 (0.0%) | 0 (0.0%) |
| $17,500 to $19,999 | 1 (0.3%) | 2 (0.6%) |
| $20,000 to $22,499 | 2 (0.6%) | 10 (3.0%) |
| $22,500 to $24,999 | 18 (5.2%) | 0 (0.0%) |
| $25,000 to $29,999 | 18 (5.2%) | 44 (13.3%) |
| $30,000 to $34,999 | 24 (6.9%) | 28 (8.4%) |
| $35,000 to $39,999 | 12 (3.4%) | 32 (9.6%) |
| $40,000 to $44,999 | 82 (23.5%) | 32 (9.6%) |
| $45,000 to $49,999 | 20 (5.7%) | 9 (2.7%) |
| $50,000 to $54,999 | 16 (4.6%) | 5 (1.5%) |
| $55,000 to $64,999 | 28 (8.0%) | 43 (13.0%) |
| $65,000 to $74,999 | 26 (7.4%) | 20 (6.0%) |
| $75,000 to $99,999 | 40 (11.5%) | 7 (2.1%) |
| $100,000+ | 28 (8.0%) | 0 (0.0%) |
| Total | 349 (100.0%) | 332 (100.0%) |
Earnings by Sex by Educational Attainment in Syracuse
Average earnings in Syracuse are $42,310 for men and $36,420 for women, a difference of 13.9%. Men with an educational attainment of college or associate's degree enjoy the highest average annual earnings of $48,125, while those with less than high school education earn the least with $29,028. Women with an educational attainment of college or associate's degree earn the most with the average annual earnings of $40,652, while those with high school diploma education have the smallest earnings of $30,893.
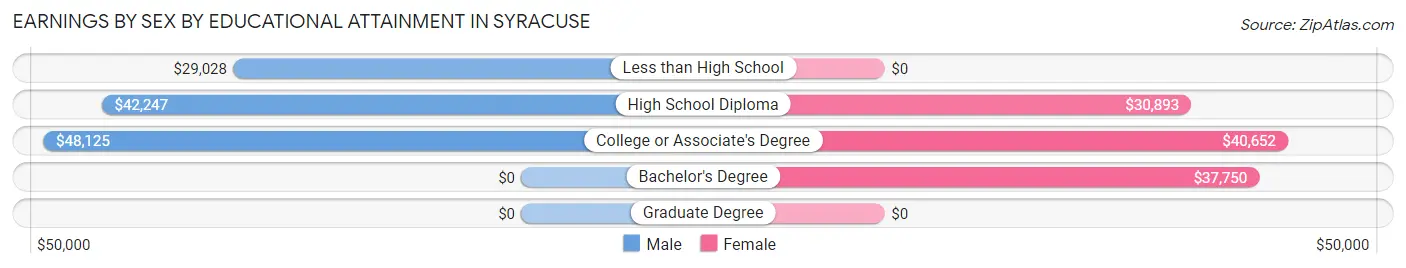
| Educational Attainment | Male Income | Female Income |
| Less than High School | $29,028 | $0 |
| High School Diploma | $42,247 | $30,893 |
| College or Associate's Degree | $48,125 | $40,652 |
| Bachelor's Degree | - | - |
| Graduate Degree | - | - |
| Total | $42,310 | $36,420 |
Family Income in Syracuse
Family Income Brackets in Syracuse
According to the Syracuse family income data, there are 100 families falling into the $100,000 to $149,999 income range, which is the most common income bracket and makes up 30.0% of all families.
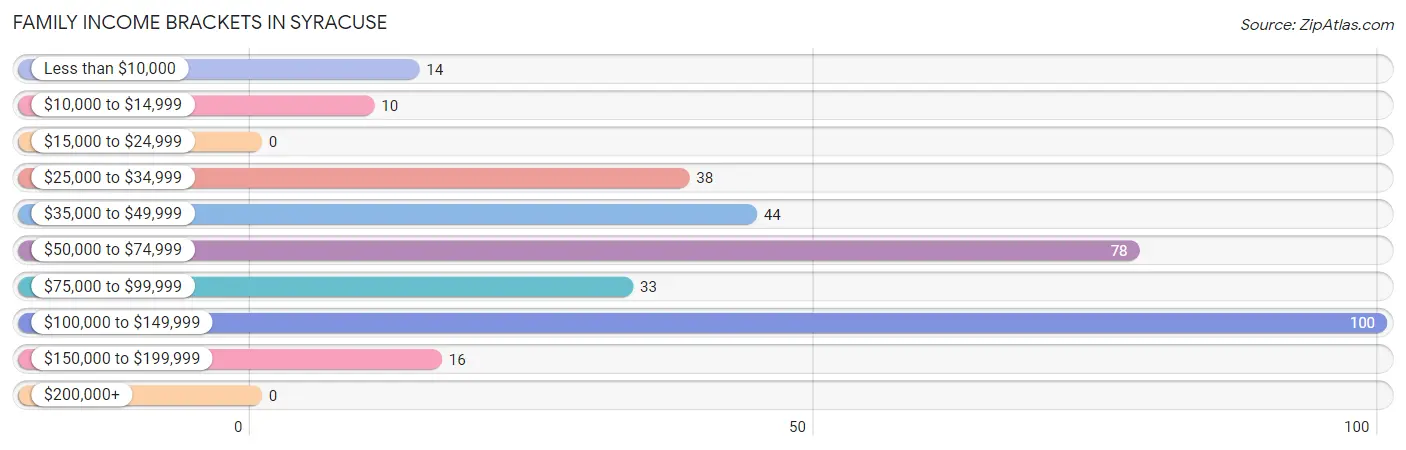
| Income Bracket | # Families | % Families |
| Less than $10,000 | 14 | 4.2% |
| $10,000 to $14,999 | 10 | 3.0% |
| $15,000 to $24,999 | 0 | 0.0% |
| $25,000 to $34,999 | 38 | 11.4% |
| $35,000 to $49,999 | 44 | 13.2% |
| $50,000 to $74,999 | 78 | 23.4% |
| $75,000 to $99,999 | 33 | 9.9% |
| $100,000 to $149,999 | 100 | 30.0% |
| $150,000 to $199,999 | 16 | 4.8% |
| $200,000+ | 0 | 0.0% |
Family Income by Famaliy Size in Syracuse
5-person families (46 | 13.8%) account for the highest median family income in Syracuse with $101,154 per family, while 2-person families (189 | 56.8%) have the highest median income of $34,375 per family member.
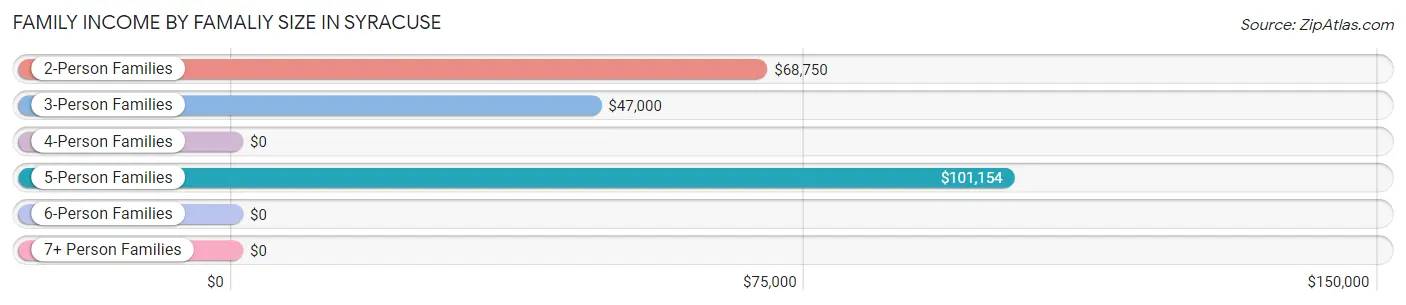
| Income Bracket | # Families | Median Income |
| 2-Person Families | 189 (56.8%) | $68,750 |
| 3-Person Families | 64 (19.2%) | $47,000 |
| 4-Person Families | 24 (7.2%) | $0 |
| 5-Person Families | 46 (13.8%) | $101,154 |
| 6-Person Families | 10 (3.0%) | $0 |
| 7+ Person Families | 0 (0.0%) | $0 |
| Total | 333 (100.0%) | $68,523 |
Family Income by Number of Earners in Syracuse
The median family income in Syracuse is $68,523, with families comprising 3+ earners (6) having the highest median family income of $158,750, while families with no earners (67) have the lowest median family income of $38,438, accounting for 1.8% and 20.1% of families, respectively.
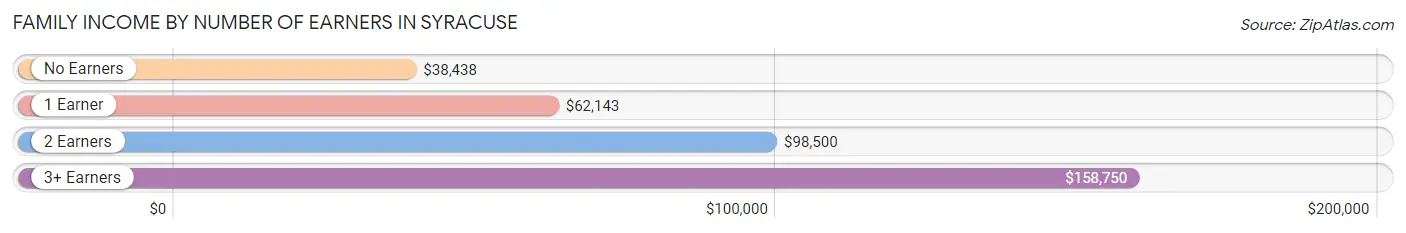
| Number of Earners | # Families | Median Income |
| No Earners | 67 (20.1%) | $38,438 |
| 1 Earner | 108 (32.4%) | $62,143 |
| 2 Earners | 152 (45.7%) | $98,500 |
| 3+ Earners | 6 (1.8%) | $158,750 |
| Total | 333 (100.0%) | $68,523 |
Household Income in Syracuse
Household Income Brackets in Syracuse
With 118 households falling in the category, the $50,000 to $74,999 income range is the most frequent in Syracuse, accounting for 22.3% of all households.
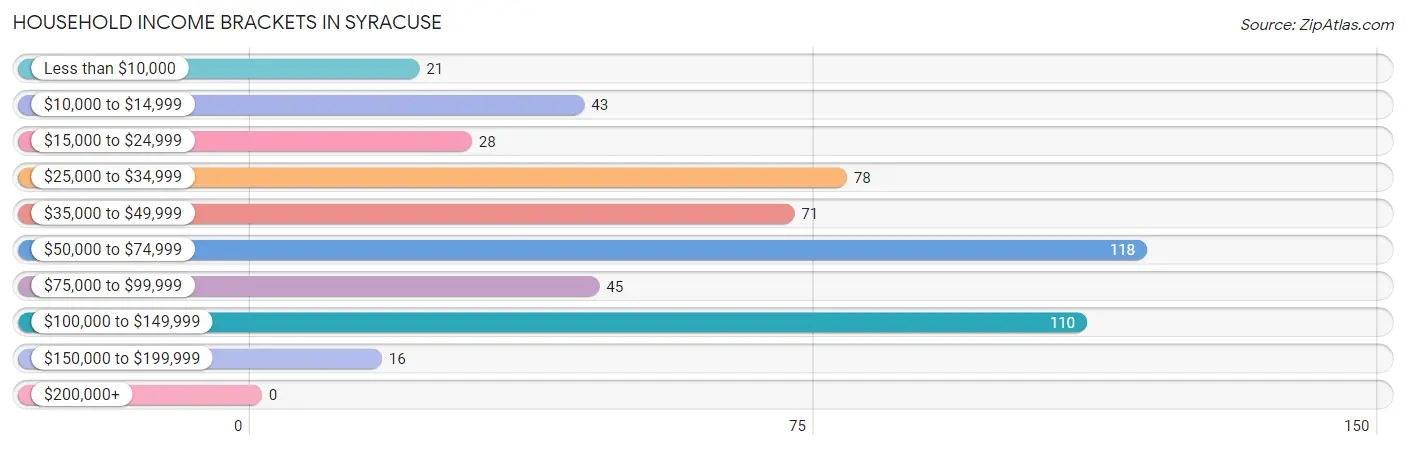
| Income Bracket | # Households | % Households |
| Less than $10,000 | 21 | 4.0% |
| $10,000 to $14,999 | 43 | 8.1% |
| $15,000 to $24,999 | 28 | 5.3% |
| $25,000 to $34,999 | 78 | 14.7% |
| $35,000 to $49,999 | 71 | 13.4% |
| $50,000 to $74,999 | 118 | 22.3% |
| $75,000 to $99,999 | 45 | 8.5% |
| $100,000 to $149,999 | 110 | 20.8% |
| $150,000 to $199,999 | 16 | 3.0% |
| $200,000+ | 0 | 0.0% |
Household Income by Householder Age in Syracuse
The median household income in Syracuse is $52,143, with the highest median household income of $96,688 found in the 45 to 64 years age bracket for the primary householder. A total of 171 households (32.3%) fall into this category. Meanwhile, the 15 to 24 years age bracket for the primary householder has the lowest median household income of $37,083, with 27 households (5.1%) in this group.
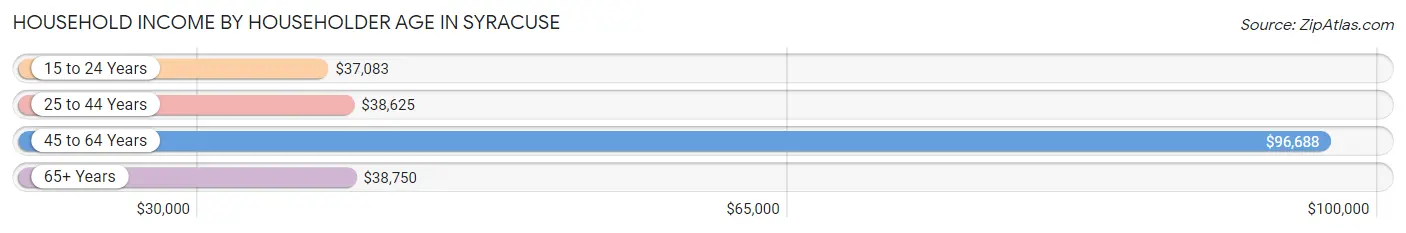
| Income Bracket | # Households | Median Income |
| 15 to 24 Years | 27 (5.1%) | $37,083 |
| 25 to 44 Years | 163 (30.7%) | $38,625 |
| 45 to 64 Years | 171 (32.3%) | $96,688 |
| 65+ Years | 169 (31.9%) | $38,750 |
| Total | 530 (100.0%) | $52,143 |
Poverty in Syracuse
Income Below Poverty by Sex and Age in Syracuse
With 6.5% poverty level for males and 14.6% for females among the residents of Syracuse, 16 and 17 year old males and 75 year old and over females are the most vulnerable to poverty, with 13 males (21.3%) and 33 females (35.5%) in their respective age groups living below the poverty level.
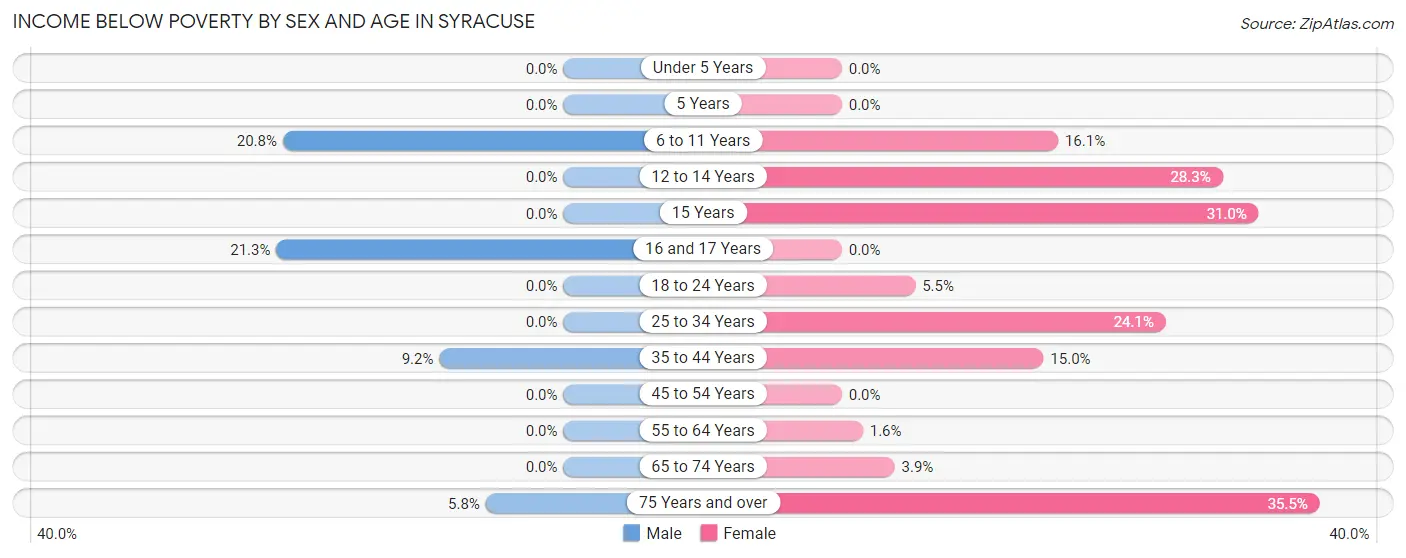
| Age Bracket | Male | Female |
| Under 5 Years | 0 (0.0%) | 0 (0.0%) |
| 5 Years | 0 (0.0%) | 0 (0.0%) |
| 6 to 11 Years | 20 (20.8%) | 13 (16.1%) |
| 12 to 14 Years | 0 (0.0%) | 13 (28.3%) |
| 15 Years | 0 (0.0%) | 13 (30.9%) |
| 16 and 17 Years | 13 (21.3%) | 0 (0.0%) |
| 18 to 24 Years | 0 (0.0%) | 3 (5.4%) |
| 25 to 34 Years | 0 (0.0%) | 19 (24.0%) |
| 35 to 44 Years | 7 (9.2%) | 25 (15.0%) |
| 45 to 54 Years | 0 (0.0%) | 0 (0.0%) |
| 55 to 64 Years | 0 (0.0%) | 1 (1.6%) |
| 65 to 74 Years | 0 (0.0%) | 2 (3.9%) |
| 75 Years and over | 3 (5.8%) | 33 (35.5%) |
| Total | 43 (6.5%) | 122 (14.6%) |
Income Above Poverty by Sex and Age in Syracuse
According to the poverty statistics in Syracuse, males aged under 5 years and females aged under 5 years are the age groups that are most secure financially, with 100.0% of males and 100.0% of females in these age groups living above the poverty line.
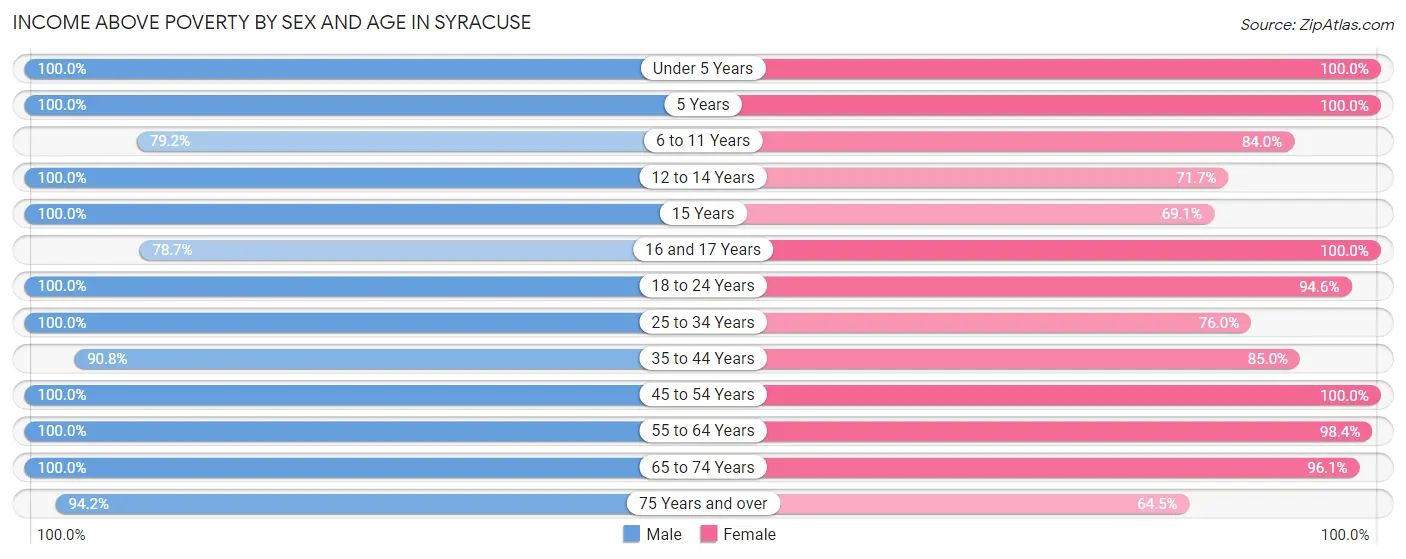
| Age Bracket | Male | Female |
| Under 5 Years | 26 (100.0%) | 42 (100.0%) |
| 5 Years | 16 (100.0%) | 15 (100.0%) |
| 6 to 11 Years | 76 (79.2%) | 68 (84.0%) |
| 12 to 14 Years | 20 (100.0%) | 33 (71.7%) |
| 15 Years | 10 (100.0%) | 29 (69.1%) |
| 16 and 17 Years | 48 (78.7%) | 13 (100.0%) |
| 18 to 24 Years | 33 (100.0%) | 52 (94.6%) |
| 25 to 34 Years | 119 (100.0%) | 60 (75.9%) |
| 35 to 44 Years | 69 (90.8%) | 142 (85.0%) |
| 45 to 54 Years | 34 (100.0%) | 88 (100.0%) |
| 55 to 64 Years | 72 (100.0%) | 63 (98.4%) |
| 65 to 74 Years | 51 (100.0%) | 49 (96.1%) |
| 75 Years and over | 49 (94.2%) | 60 (64.5%) |
| Total | 623 (93.5%) | 714 (85.4%) |
Income Below Poverty Among Married-Couple Families in Syracuse
The poverty statistics for married-couple families in Syracuse show that 3.9% or 10 of the total 255 families live below the poverty line. Families with 3 or 4 children have the highest poverty rate of 12.7%, comprising of 7 families. On the other hand, families with 1 or 2 children have the lowest poverty rate of 0.0%, which includes 0 families.
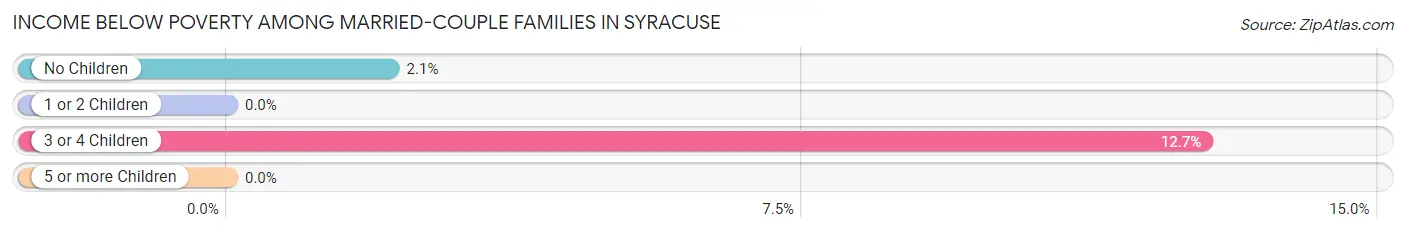
| Children | Above Poverty | Below Poverty |
| No Children | 139 (97.9%) | 3 (2.1%) |
| 1 or 2 Children | 58 (100.0%) | 0 (0.0%) |
| 3 or 4 Children | 48 (87.3%) | 7 (12.7%) |
| 5 or more Children | 0 (0.0%) | 0 (0.0%) |
| Total | 245 (96.1%) | 10 (3.9%) |
Income Below Poverty Among Single-Parent Households in Syracuse
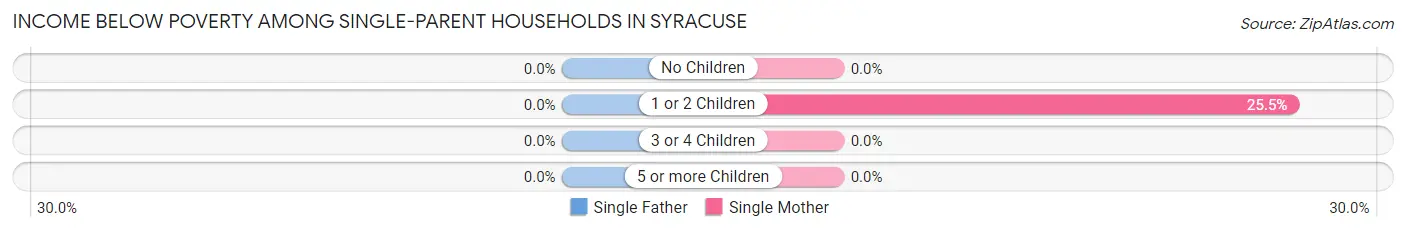
| Children | Single Father | Single Mother |
| No Children | 0 (0.0%) | 0 (0.0%) |
| 1 or 2 Children | 0 (0.0%) | 14 (25.5%) |
| 3 or 4 Children | 0 (0.0%) | 0 (0.0%) |
| 5 or more Children | 0 (0.0%) | 0 (0.0%) |
| Total | 0 (0.0%) | 14 (19.2%) |
Income Below Poverty Among Married-Couple vs Single-Parent Households in Syracuse
The poverty data for Syracuse shows that 10 of the married-couple family households (3.9%) and 14 of the single-parent households (17.9%) are living below the poverty level. Within the married-couple family households, those with 3 or 4 children have the highest poverty rate, with 7 households (12.7%) falling below the poverty line. Among the single-parent households, those with 1 or 2 children have the highest poverty rate, with 14 household (25.5%) living below poverty.
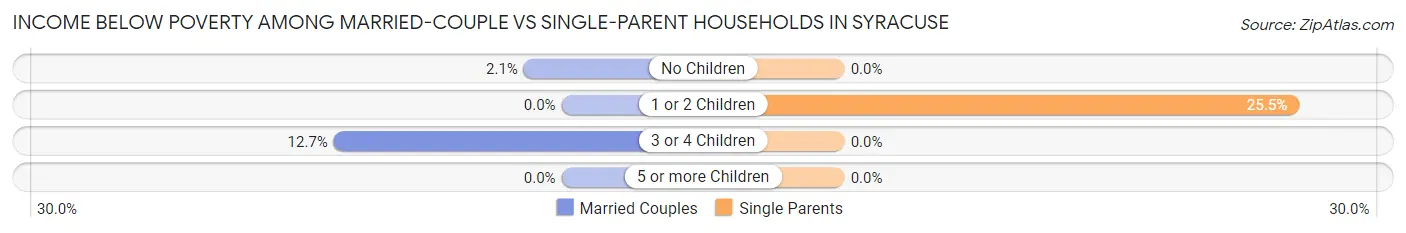
| Children | Married-Couple Families | Single-Parent Households |
| No Children | 3 (2.1%) | 0 (0.0%) |
| 1 or 2 Children | 0 (0.0%) | 14 (25.5%) |
| 3 or 4 Children | 7 (12.7%) | 0 (0.0%) |
| 5 or more Children | 0 (0.0%) | 0 (0.0%) |
| Total | 10 (3.9%) | 14 (17.9%) |
Race in Syracuse
The most populous races in Syracuse are White / Caucasian (1,379 | 91.3%), Hispanic or Latino (523 | 34.6%), and Two or more Races (87 | 5.8%).
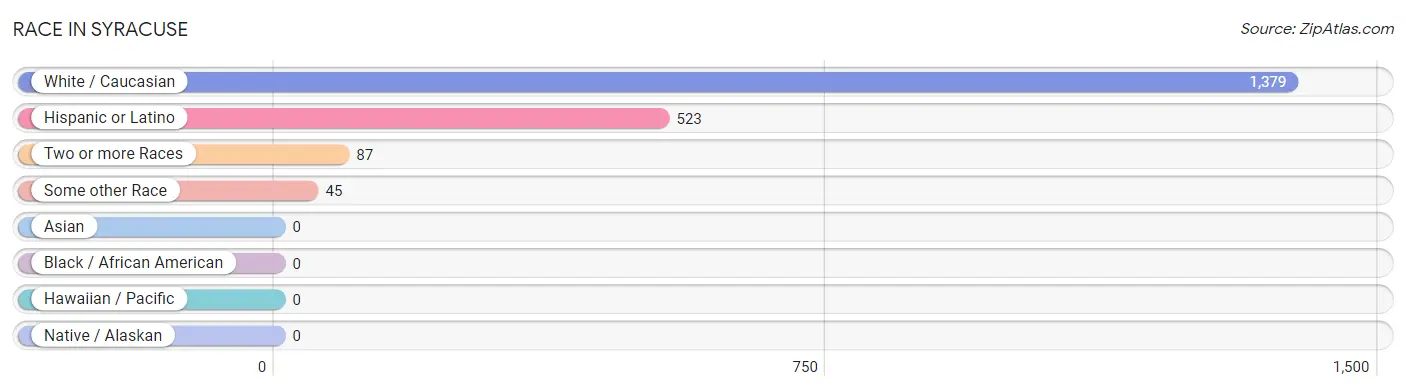
| Race | # Population | % Population |
| Asian | 0 | 0.0% |
| Black / African American | 0 | 0.0% |
| Hawaiian / Pacific | 0 | 0.0% |
| Hispanic or Latino | 523 | 34.6% |
| Native / Alaskan | 0 | 0.0% |
| White / Caucasian | 1,379 | 91.3% |
| Two or more Races | 87 | 5.8% |
| Some other Race | 45 | 3.0% |
| Total | 1,511 | 100.0% |
Ancestry in Syracuse
The most populous ancestries reported in Syracuse are German (339 | 22.4%), Mexican (307 | 20.3%), English (150 | 9.9%), Central American (126 | 8.3%), and Honduran (126 | 8.3%), together accounting for 69.4% of all Syracuse residents.
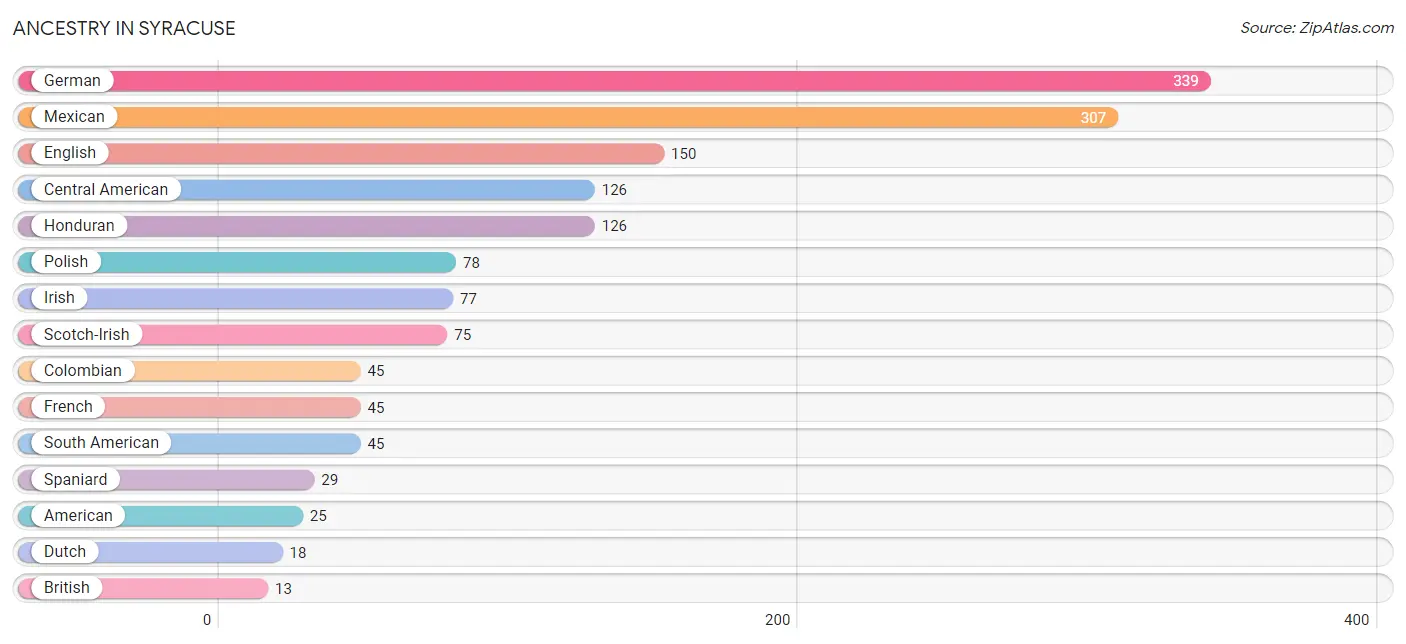
| Ancestry | # Population | % Population |
| American | 25 | 1.7% |
| British | 13 | 0.9% |
| Central American | 126 | 8.3% |
| Colombian | 45 | 3.0% |
| Danish | 3 | 0.2% |
| Dutch | 18 | 1.2% |
| Dutch West Indian | 1 | 0.1% |
| English | 150 | 9.9% |
| French | 45 | 3.0% |
| German | 339 | 22.4% |
| Honduran | 126 | 8.3% |
| Irish | 77 | 5.1% |
| Italian | 1 | 0.1% |
| Mexican | 307 | 20.3% |
| Norwegian | 12 | 0.8% |
| Polish | 78 | 5.2% |
| Russian | 5 | 0.3% |
| Scotch-Irish | 75 | 5.0% |
| Scottish | 3 | 0.2% |
| South American | 45 | 3.0% |
| Spaniard | 29 | 1.9% |
| Swedish | 13 | 0.9% |
| Swiss | 2 | 0.1% | View All 23 Rows |
Immigrants in Syracuse
The most numerous immigrant groups reported in Syracuse came from Central America (219 | 14.5%), Latin America (219 | 14.5%), Honduras (113 | 7.5%), Mexico (102 | 6.8%), and Eastern Europe (14 | 0.9%), together accounting for 44.1% of all Syracuse residents.
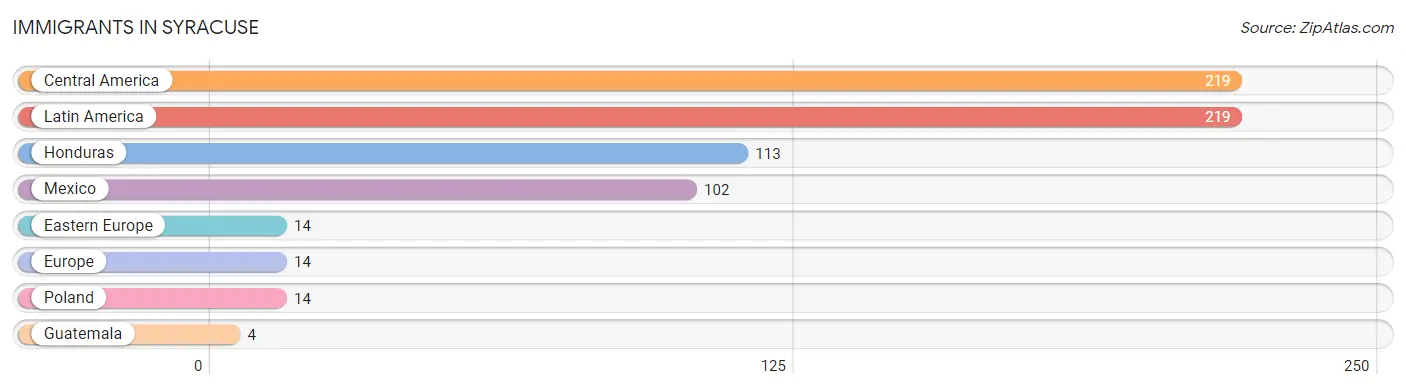
| Immigration Origin | # Population | % Population |
| Central America | 219 | 14.5% |
| Eastern Europe | 14 | 0.9% |
| Europe | 14 | 0.9% |
| Guatemala | 4 | 0.3% |
| Honduras | 113 | 7.5% |
| Latin America | 219 | 14.5% |
| Mexico | 102 | 6.8% |
| Poland | 14 | 0.9% | View All 8 Rows |
Sex and Age in Syracuse
Sex and Age in Syracuse
The most populous age groups in Syracuse are 30 to 34 Years (115 | 17.0%) for men and 35 to 39 Years (110 | 13.2%) for women.
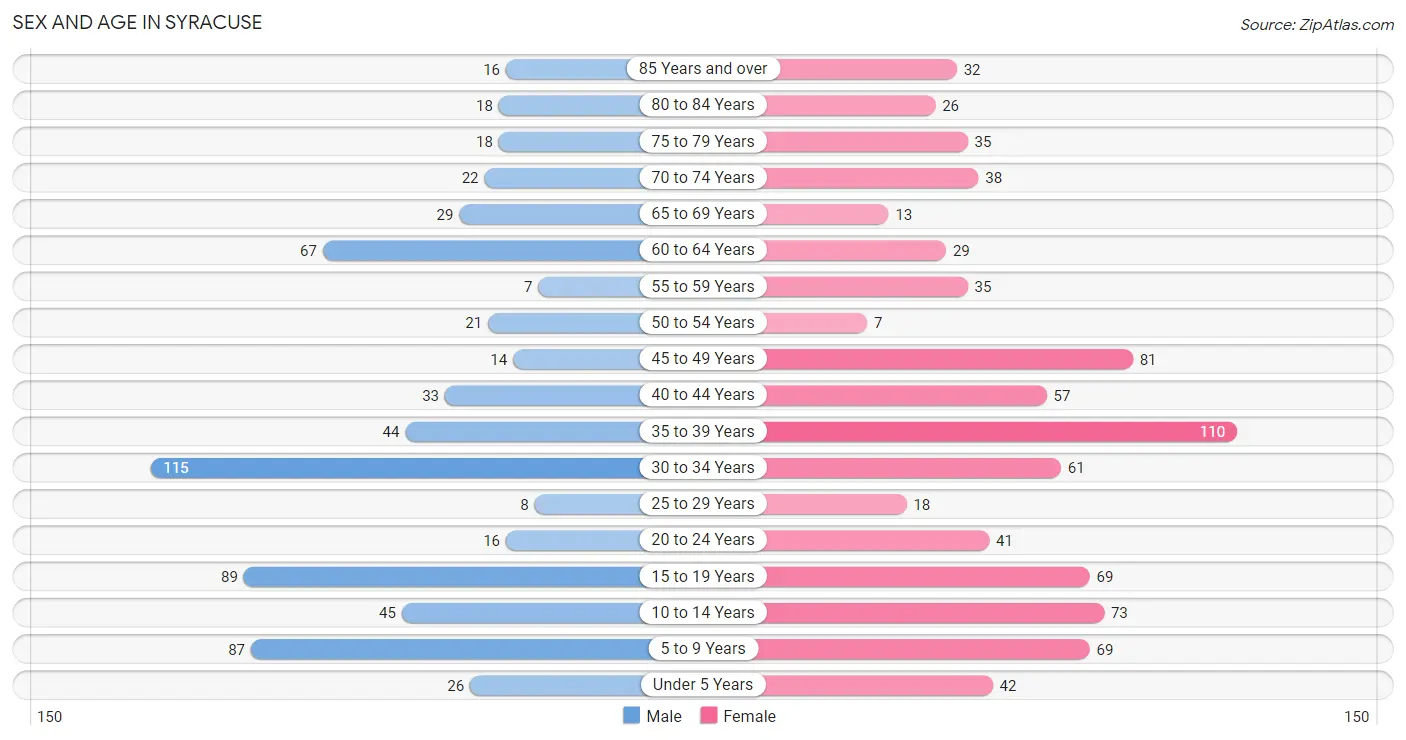
| Age Bracket | Male | Female |
| Under 5 Years | 26 (3.8%) | 42 (5.0%) |
| 5 to 9 Years | 87 (12.9%) | 69 (8.3%) |
| 10 to 14 Years | 45 (6.7%) | 73 (8.7%) |
| 15 to 19 Years | 89 (13.2%) | 69 (8.3%) |
| 20 to 24 Years | 16 (2.4%) | 41 (4.9%) |
| 25 to 29 Years | 8 (1.2%) | 18 (2.1%) |
| 30 to 34 Years | 115 (17.0%) | 61 (7.3%) |
| 35 to 39 Years | 44 (6.5%) | 110 (13.2%) |
| 40 to 44 Years | 33 (4.9%) | 57 (6.8%) |
| 45 to 49 Years | 14 (2.1%) | 81 (9.7%) |
| 50 to 54 Years | 21 (3.1%) | 7 (0.8%) |
| 55 to 59 Years | 7 (1.0%) | 35 (4.2%) |
| 60 to 64 Years | 67 (9.9%) | 29 (3.5%) |
| 65 to 69 Years | 29 (4.3%) | 13 (1.6%) |
| 70 to 74 Years | 22 (3.3%) | 38 (4.5%) |
| 75 to 79 Years | 18 (2.7%) | 35 (4.2%) |
| 80 to 84 Years | 18 (2.7%) | 26 (3.1%) |
| 85 Years and over | 16 (2.4%) | 32 (3.8%) |
| Total | 675 (100.0%) | 836 (100.0%) |
Families and Households in Syracuse
Median Family Size in Syracuse
The median family size in Syracuse is 3.83 persons per family, with married-couple families (255 | 76.6%) accounting for the largest median family size of 4.02 persons per family. On the other hand, single female/mother families (73 | 21.9%) represent the smallest median family size with 3.21 persons per family.
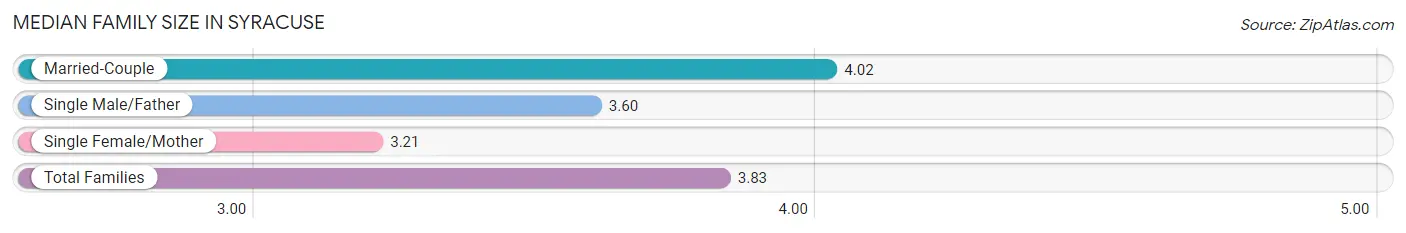
| Family Type | # Families | Family Size |
| Married-Couple | 255 (76.6%) | 4.02 |
| Single Male/Father | 5 (1.5%) | 3.60 |
| Single Female/Mother | 73 (21.9%) | 3.21 |
| Total Families | 333 (100.0%) | 3.83 |
Median Household Size in Syracuse
The median household size in Syracuse is 2.83 persons per household, with single male/father households (5 | 0.9%) accounting for the largest median household size of 4.6 persons per household. non-family households (197 | 37.2%) represent the smallest median household size with 1.05 persons per household.
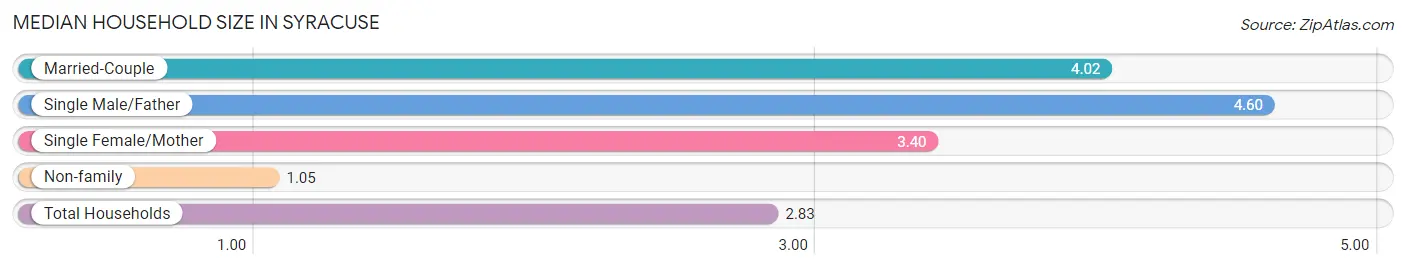
| Household Type | # Households | Household Size |
| Married-Couple | 255 (48.1%) | 4.02 |
| Single Male/Father | 5 (0.9%) | 4.60 |
| Single Female/Mother | 73 (13.8%) | 3.40 |
| Non-family | 197 (37.2%) | 1.05 |
| Total Households | 530 (100.0%) | 2.83 |
Household Size by Marriage Status in Syracuse
Out of a total of 530 households in Syracuse, 333 (62.8%) are family households, while 197 (37.2%) are nonfamily households. The most numerous type of family households are 2-person households, comprising 183, and the most common type of nonfamily households are 1-person households, comprising 187.
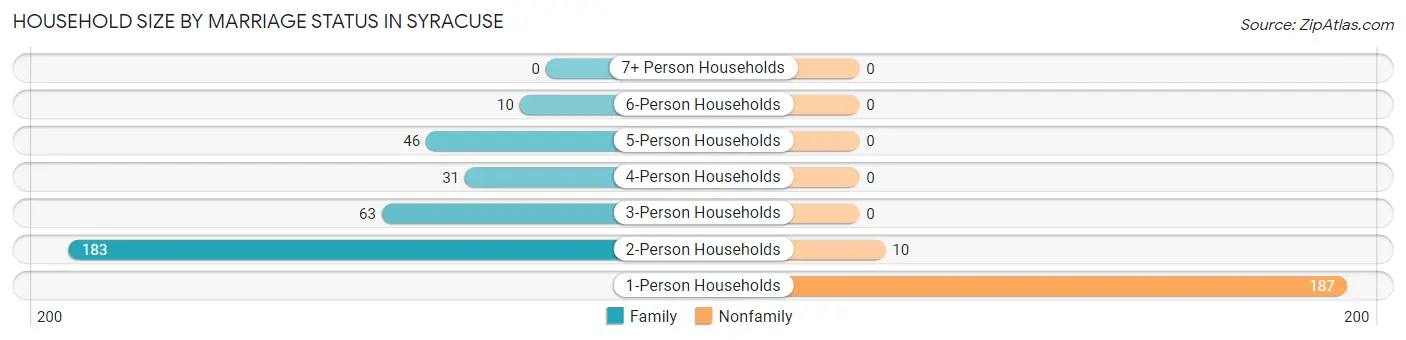
| Household Size | Family Households | Nonfamily Households |
| 1-Person Households | - | 187 (35.3%) |
| 2-Person Households | 183 (34.5%) | 10 (1.9%) |
| 3-Person Households | 63 (11.9%) | 0 (0.0%) |
| 4-Person Households | 31 (5.9%) | 0 (0.0%) |
| 5-Person Households | 46 (8.7%) | 0 (0.0%) |
| 6-Person Households | 10 (1.9%) | 0 (0.0%) |
| 7+ Person Households | 0 (0.0%) | 0 (0.0%) |
| Total | 333 (62.8%) | 197 (37.2%) |
Female Fertility in Syracuse
Fertility by Age in Syracuse
Average fertility rate in Syracuse is 7.0 births per 1,000 women. Women in the age bracket of 20 to 34 years have the highest fertility rate with 25.0 births per 1,000 women. Women in the age bracket of 20 to 34 years acount for 100.0% of all women with births.
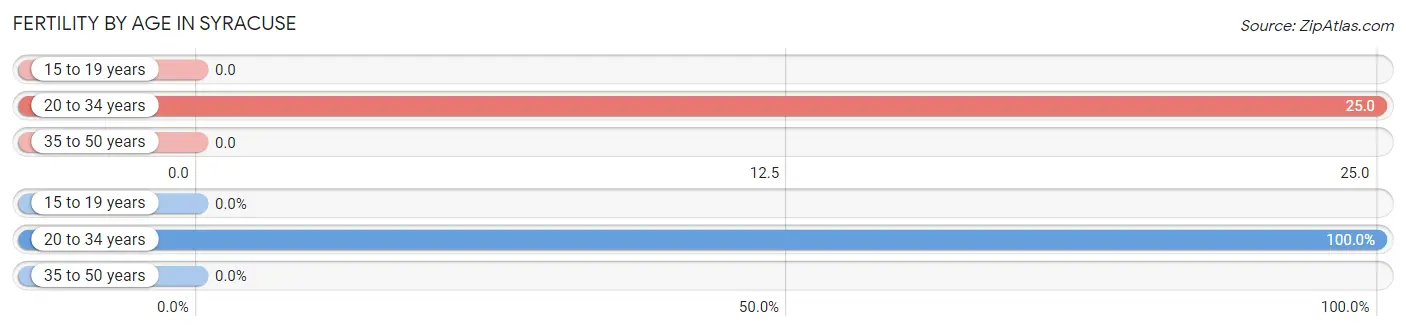
| Age Bracket | Women with Births | Births / 1,000 Women |
| 15 to 19 years | 0 (0.0%) | 0.0 |
| 20 to 34 years | 3 (100.0%) | 25.0 |
| 35 to 50 years | 0 (0.0%) | 0.0 |
| Total | 3 (100.0%) | 7.0 |
Fertility by Age by Marriage Status in Syracuse
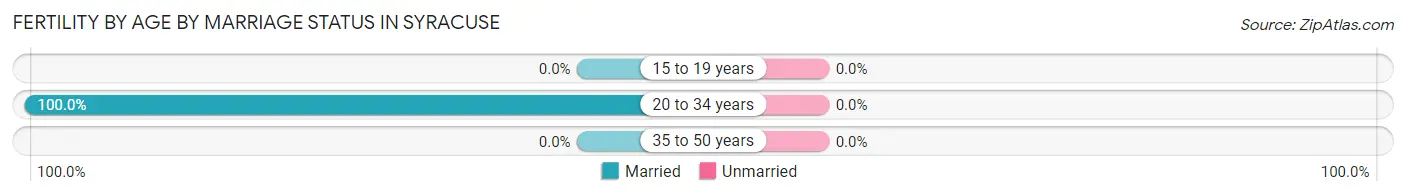
| Age Bracket | Married | Unmarried |
| 15 to 19 years | 0 (0.0%) | 0 (0.0%) |
| 20 to 34 years | 3 (100.0%) | 0 (0.0%) |
| 35 to 50 years | 0 (0.0%) | 0 (0.0%) |
| Total | 3 (100.0%) | 0 (0.0%) |
Fertility by Education in Syracuse
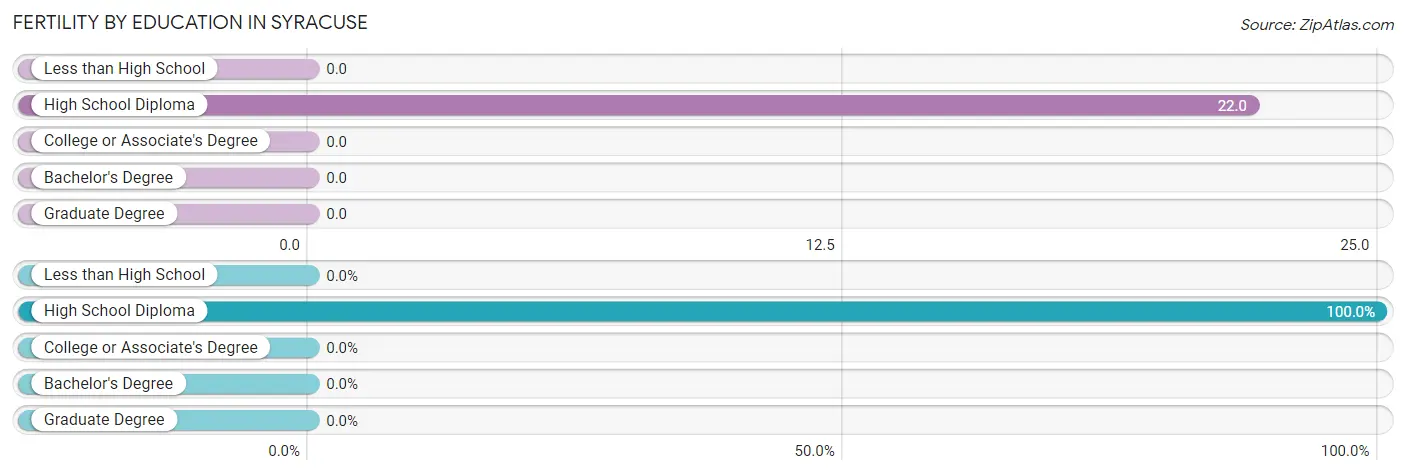
| Educational Attainment | Women with Births | Births / 1,000 Women |
| Less than High School | 0 (0.0%) | 0.0 |
| High School Diploma | 3 (100.0%) | 22.0 |
| College or Associate's Degree | 0 (0.0%) | 0.0 |
| Bachelor's Degree | 0 (0.0%) | 0.0 |
| Graduate Degree | 0 (0.0%) | 0.0 |
| Total | 3 (100.0%) | 7.0 |
Fertility by Education by Marriage Status in Syracuse
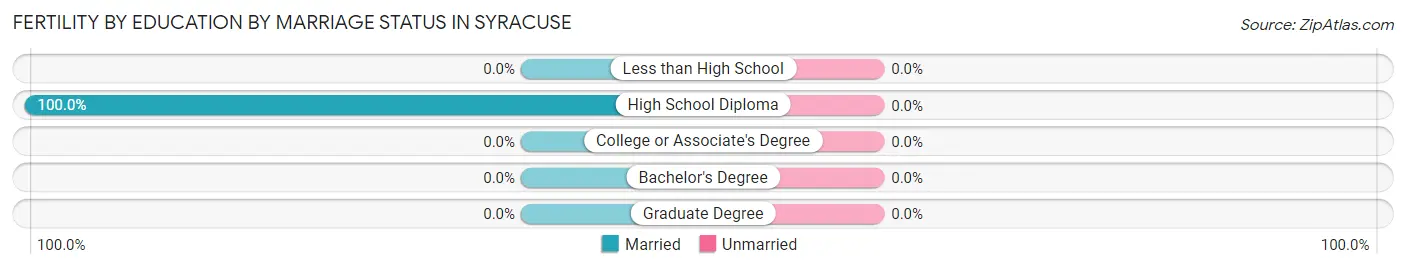
| Educational Attainment | Married | Unmarried |
| Less than High School | 0 (0.0%) | 0 (0.0%) |
| High School Diploma | 3 (100.0%) | 0 (0.0%) |
| College or Associate's Degree | 0 (0.0%) | 0 (0.0%) |
| Bachelor's Degree | 0 (0.0%) | 0 (0.0%) |
| Graduate Degree | 0 (0.0%) | 0 (0.0%) |
| Total | 3 (100.0%) | 0 (0.0%) |
Employment Characteristics in Syracuse
Employment by Class of Employer in Syracuse
Among the 634 employed individuals in Syracuse, private company employees (367 | 57.9%), self-employed (not incorporated) (82 | 12.9%), and local government employees (54 | 8.5%) make up the most common classes of employment.
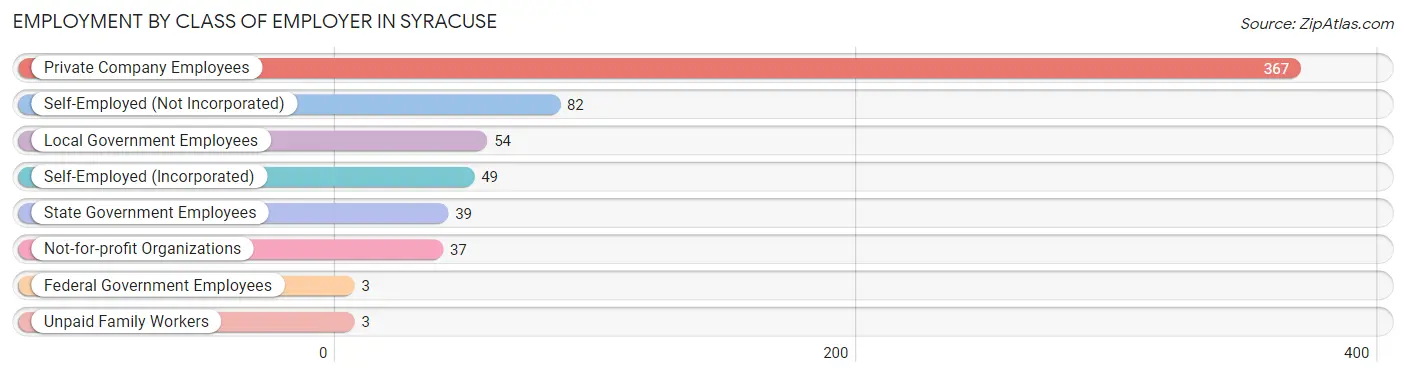
| Employer Class | # Employees | % Employees |
| Private Company Employees | 367 | 57.9% |
| Self-Employed (Incorporated) | 49 | 7.7% |
| Self-Employed (Not Incorporated) | 82 | 12.9% |
| Not-for-profit Organizations | 37 | 5.8% |
| Local Government Employees | 54 | 8.5% |
| State Government Employees | 39 | 6.1% |
| Federal Government Employees | 3 | 0.5% |
| Unpaid Family Workers | 3 | 0.5% |
| Total | 634 | 100.0% |
Employment Status by Age in Syracuse
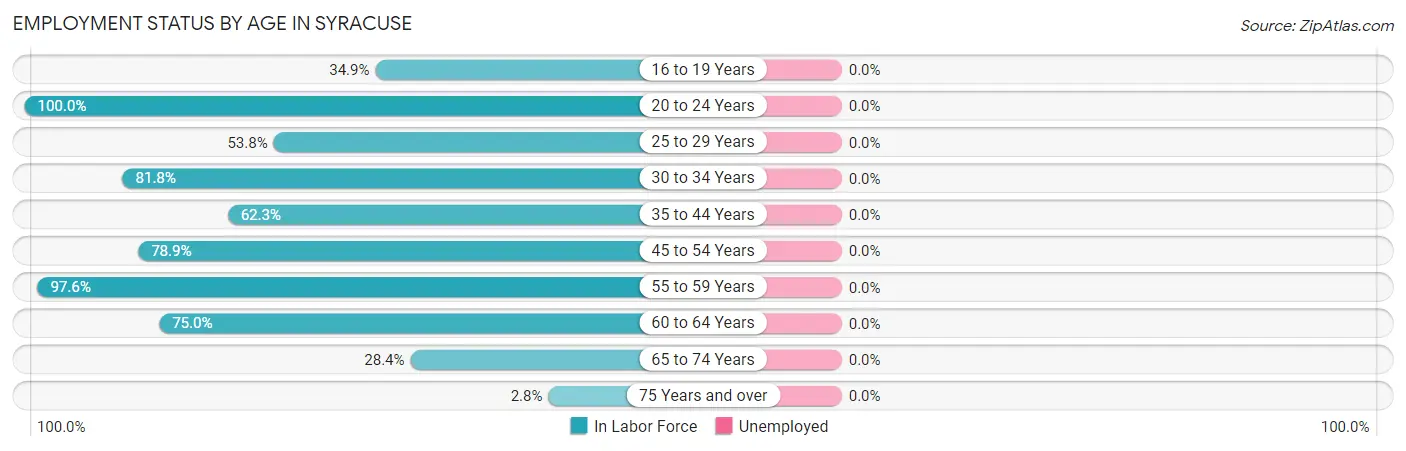
| Age Bracket | In Labor Force | Unemployed |
| 16 to 19 Years | 37 (34.9%) | 0 (0.0%) |
| 20 to 24 Years | 57 (100.0%) | 0 (0.0%) |
| 25 to 29 Years | 14 (53.8%) | 0 (0.0%) |
| 30 to 34 Years | 144 (81.8%) | 0 (0.0%) |
| 35 to 44 Years | 152 (62.3%) | 0 (0.0%) |
| 45 to 54 Years | 97 (78.9%) | 0 (0.0%) |
| 55 to 59 Years | 41 (97.6%) | 0 (0.0%) |
| 60 to 64 Years | 72 (75.0%) | 0 (0.0%) |
| 65 to 74 Years | 29 (28.4%) | 0 (0.0%) |
| 75 Years and over | 4 (2.8%) | 0 (0.0%) |
| Total | 647 (57.9%) | 0 (0.0%) |
Employment Status by Educational Attainment in Syracuse
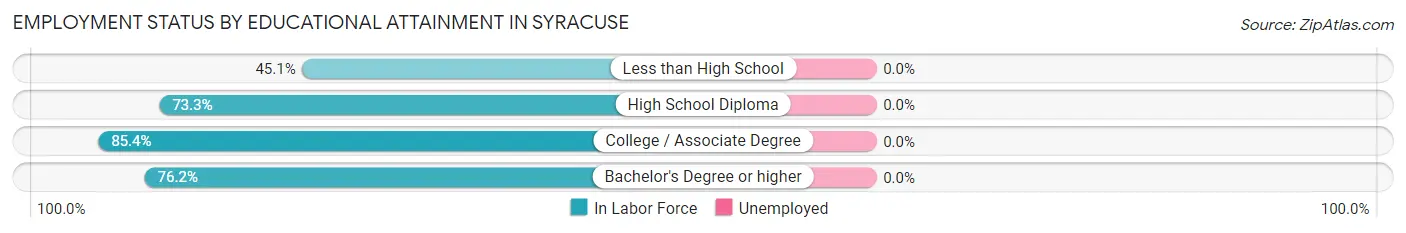
| Educational Attainment | In Labor Force | Unemployed |
| Less than High School | 41 (45.1%) | 0 (0.0%) |
| High School Diploma | 214 (73.3%) | 0 (0.0%) |
| College / Associate Degree | 169 (85.4%) | 0 (0.0%) |
| Bachelor's Degree or higher | 96 (76.2%) | 0 (0.0%) |
| Total | 520 (73.6%) | 0 (0.0%) |
Employment Occupations by Sex in Syracuse
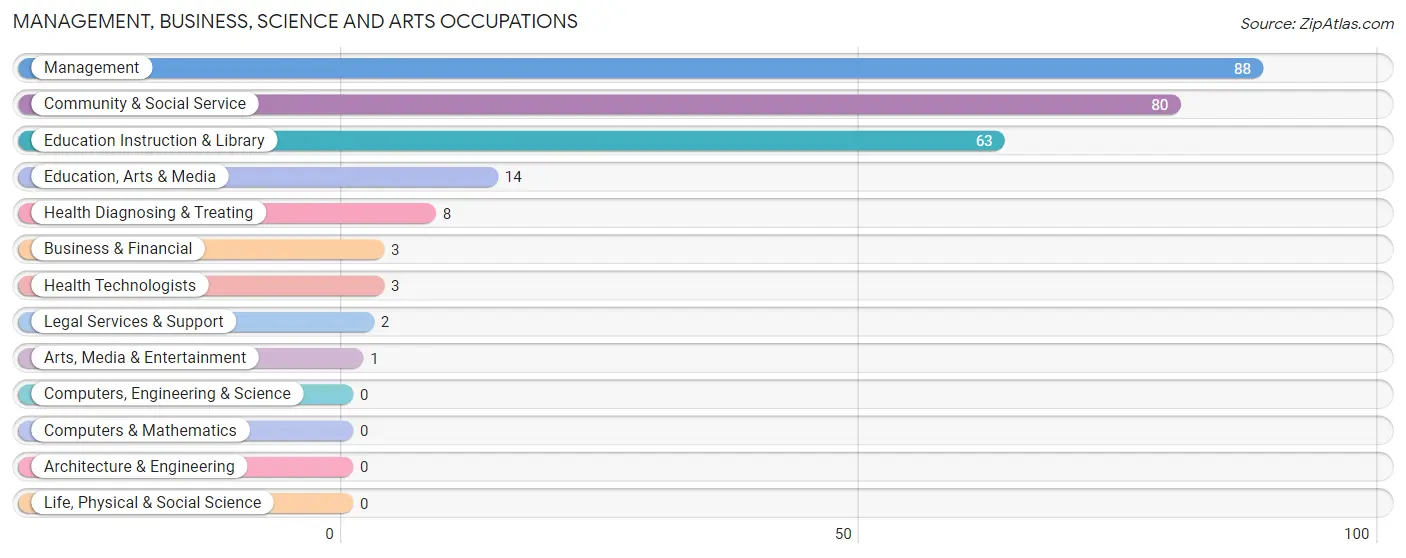
Management, Business, Science and Arts Occupations
The most common Management, Business, Science and Arts occupations in Syracuse are Management (88 | 13.6%), Community & Social Service (80 | 12.4%), Education Instruction & Library (63 | 9.7%), Education, Arts & Media (14 | 2.2%), and Health Diagnosing & Treating (8 | 1.2%).
Management, Business, Science and Arts Occupations by Sex
Within the Management, Business, Science and Arts occupations in Syracuse, the most male-oriented occupations are Business & Financial (100.0%), Legal Services & Support (100.0%), and Management (81.8%), while the most female-oriented occupations are Arts, Media & Entertainment (100.0%), Health Technologists (100.0%), and Education Instruction & Library (84.1%).
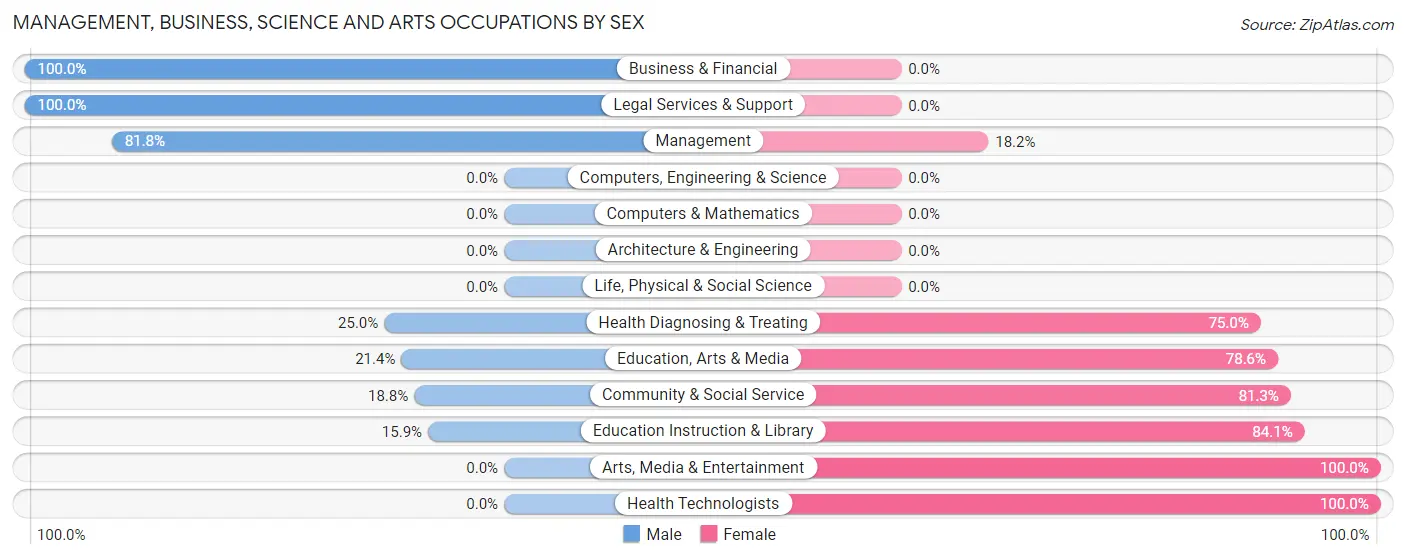
| Occupation | Male | Female |
| Management | 72 (81.8%) | 16 (18.2%) |
| Business & Financial | 3 (100.0%) | 0 (0.0%) |
| Computers, Engineering & Science | 0 (0.0%) | 0 (0.0%) |
| Computers & Mathematics | 0 (0.0%) | 0 (0.0%) |
| Architecture & Engineering | 0 (0.0%) | 0 (0.0%) |
| Life, Physical & Social Science | 0 (0.0%) | 0 (0.0%) |
| Community & Social Service | 15 (18.8%) | 65 (81.2%) |
| Education, Arts & Media | 3 (21.4%) | 11 (78.6%) |
| Legal Services & Support | 2 (100.0%) | 0 (0.0%) |
| Education Instruction & Library | 10 (15.9%) | 53 (84.1%) |
| Arts, Media & Entertainment | 0 (0.0%) | 1 (100.0%) |
| Health Diagnosing & Treating | 2 (25.0%) | 6 (75.0%) |
| Health Technologists | 0 (0.0%) | 3 (100.0%) |
| Total (Category) | 92 (51.4%) | 87 (48.6%) |
| Total (Overall) | 331 (51.2%) | 316 (48.8%) |
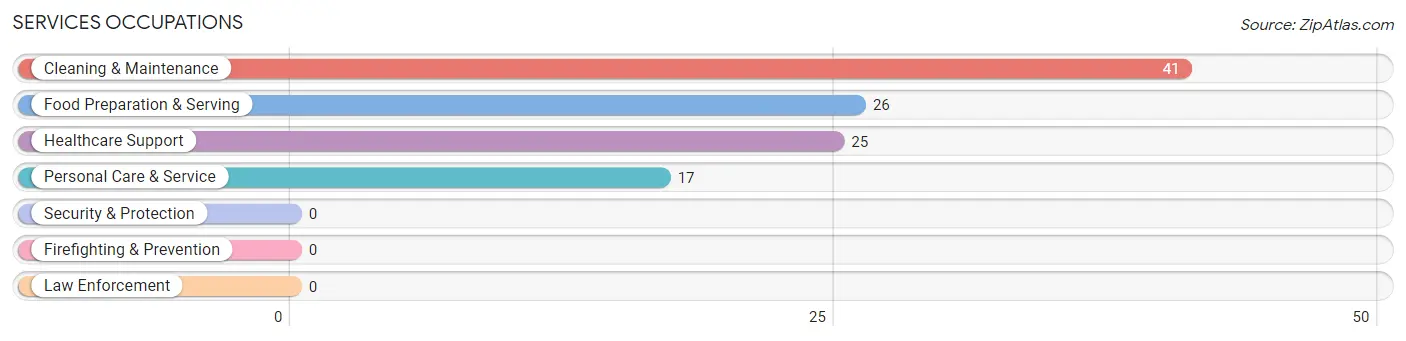
Services Occupations
The most common Services occupations in Syracuse are Cleaning & Maintenance (41 | 6.3%), Food Preparation & Serving (26 | 4.0%), Healthcare Support (25 | 3.9%), and Personal Care & Service (17 | 2.6%).
Services Occupations by Sex
Within the Services occupations in Syracuse, the most male-oriented occupations are Cleaning & Maintenance (19.5%), Personal Care & Service (11.8%), and Food Preparation & Serving (11.5%), while the most female-oriented occupations are Healthcare Support (100.0%), Food Preparation & Serving (88.5%), and Personal Care & Service (88.2%).
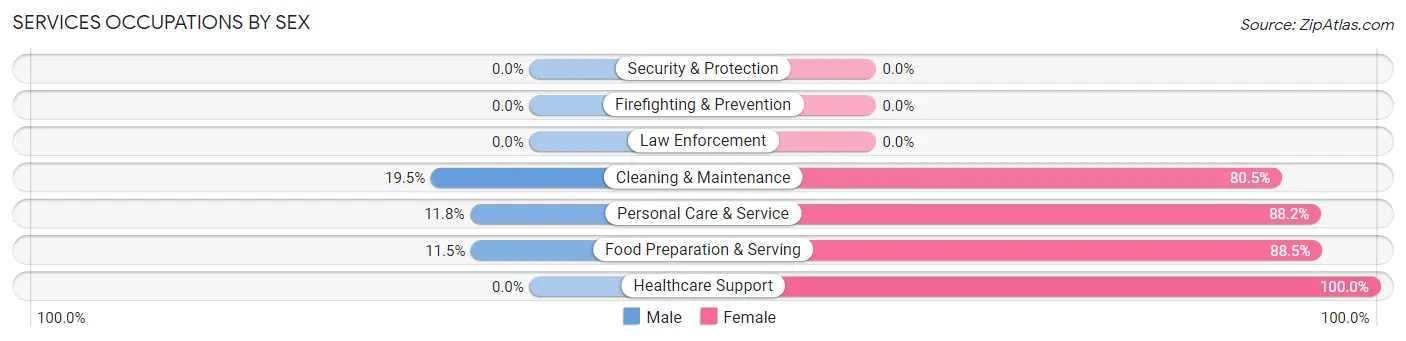
| Occupation | Male | Female |
| Healthcare Support | 0 (0.0%) | 25 (100.0%) |
| Security & Protection | 0 (0.0%) | 0 (0.0%) |
| Firefighting & Prevention | 0 (0.0%) | 0 (0.0%) |
| Law Enforcement | 0 (0.0%) | 0 (0.0%) |
| Food Preparation & Serving | 3 (11.5%) | 23 (88.5%) |
| Cleaning & Maintenance | 8 (19.5%) | 33 (80.5%) |
| Personal Care & Service | 2 (11.8%) | 15 (88.2%) |
| Total (Category) | 13 (11.9%) | 96 (88.1%) |
| Total (Overall) | 331 (51.2%) | 316 (48.8%) |
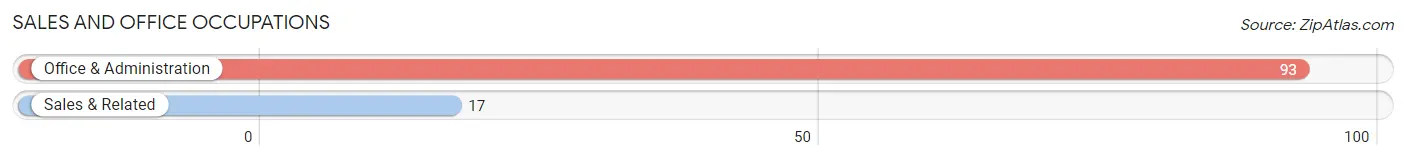
Sales and Office Occupations
The most common Sales and Office occupations in Syracuse are Office & Administration (93 | 14.4%), and Sales & Related (17 | 2.6%).
Sales and Office Occupations by Sex
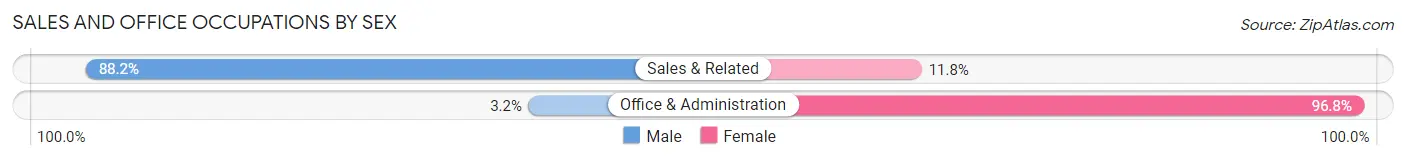
| Occupation | Male | Female |
| Sales & Related | 15 (88.2%) | 2 (11.8%) |
| Office & Administration | 3 (3.2%) | 90 (96.8%) |
| Total (Category) | 18 (16.4%) | 92 (83.6%) |
| Total (Overall) | 331 (51.2%) | 316 (48.8%) |
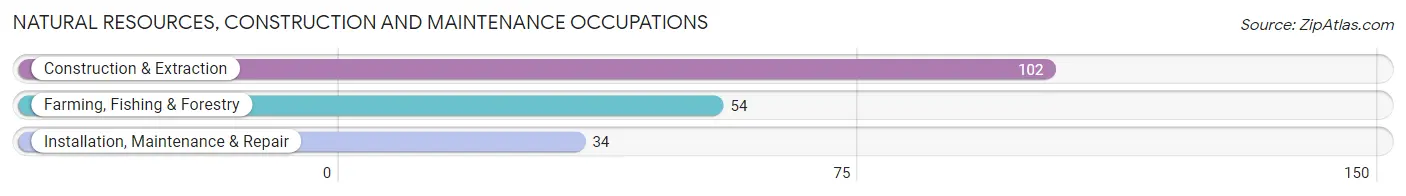
Natural Resources, Construction and Maintenance Occupations
The most common Natural Resources, Construction and Maintenance occupations in Syracuse are Construction & Extraction (102 | 15.8%), Farming, Fishing & Forestry (54 | 8.4%), and Installation, Maintenance & Repair (34 | 5.3%).
Natural Resources, Construction and Maintenance Occupations by Sex
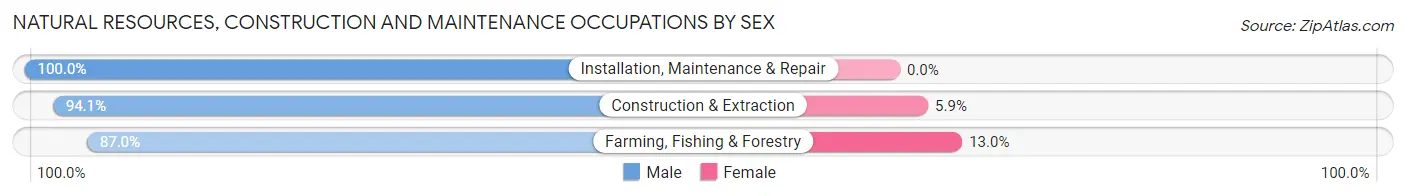
| Occupation | Male | Female |
| Farming, Fishing & Forestry | 47 (87.0%) | 7 (13.0%) |
| Construction & Extraction | 96 (94.1%) | 6 (5.9%) |
| Installation, Maintenance & Repair | 34 (100.0%) | 0 (0.0%) |
| Total (Category) | 177 (93.2%) | 13 (6.8%) |
| Total (Overall) | 331 (51.2%) | 316 (48.8%) |
Production, Transportation and Moving Occupations
The most common Production, Transportation and Moving occupations in Syracuse are Production (21 | 3.3%), Transportation (20 | 3.1%), and Material Moving (18 | 2.8%).
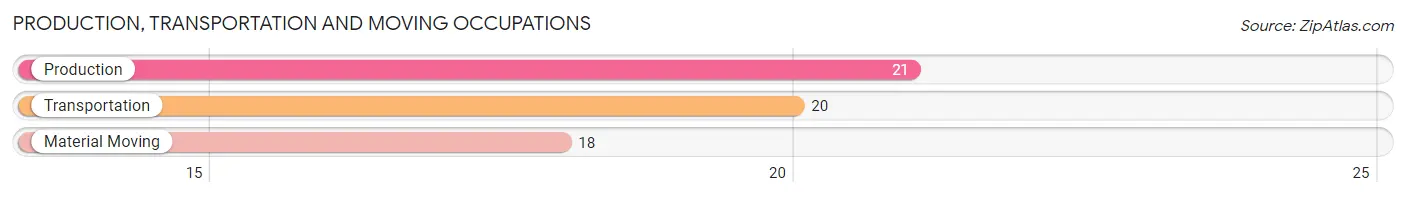
Production, Transportation and Moving Occupations by Sex
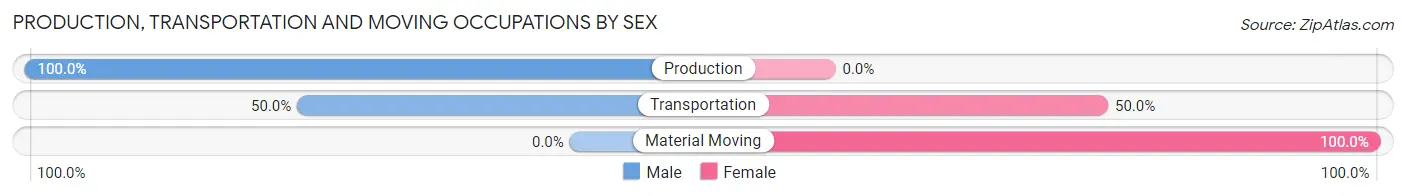
| Occupation | Male | Female |
| Production | 21 (100.0%) | 0 (0.0%) |
| Transportation | 10 (50.0%) | 10 (50.0%) |
| Material Moving | 0 (0.0%) | 18 (100.0%) |
| Total (Category) | 31 (52.5%) | 28 (47.5%) |
| Total (Overall) | 331 (51.2%) | 316 (48.8%) |
Employment Industries by Sex in Syracuse
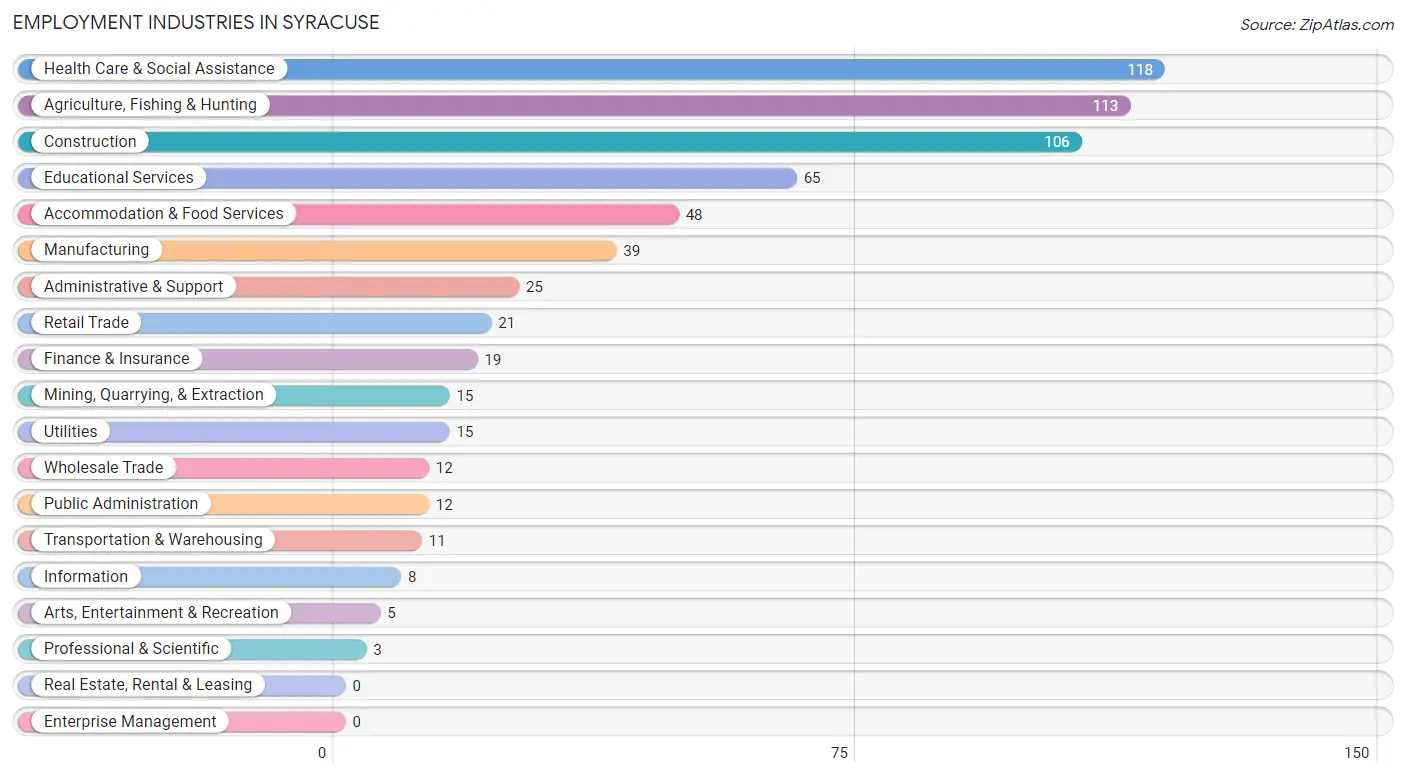
Employment Industries in Syracuse
The major employment industries in Syracuse include Health Care & Social Assistance (118 | 18.2%), Agriculture, Fishing & Hunting (113 | 17.5%), Construction (106 | 16.4%), Educational Services (65 | 10.1%), and Accommodation & Food Services (48 | 7.4%).
Employment Industries by Sex in Syracuse
The Syracuse industries that see more men than women are Wholesale Trade (100.0%), Utilities (100.0%), and Information (100.0%), whereas the industries that tend to have a higher number of women are Health Care & Social Assistance (95.8%), Finance & Insurance (89.5%), and Educational Services (87.7%).
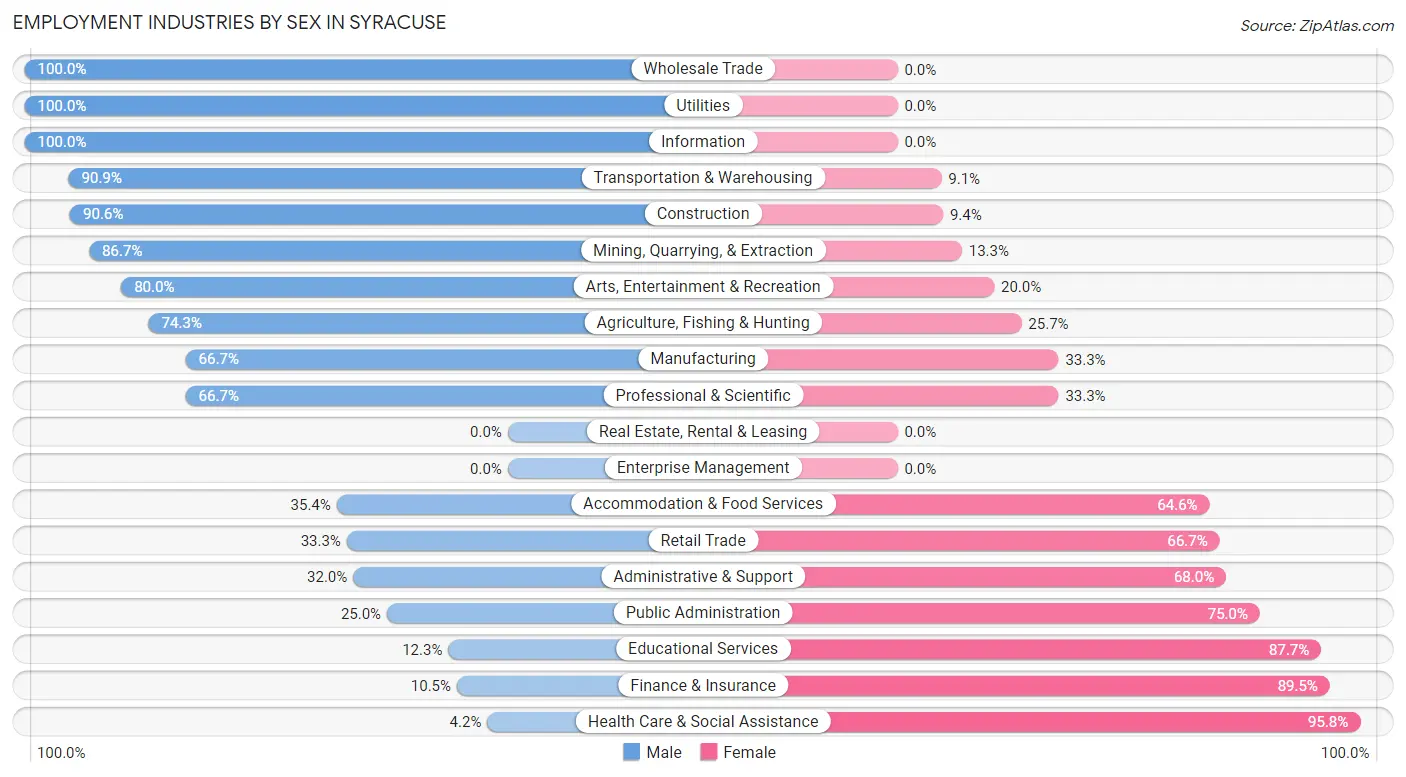
| Industry | Male | Female |
| Agriculture, Fishing & Hunting | 84 (74.3%) | 29 (25.7%) |
| Mining, Quarrying, & Extraction | 13 (86.7%) | 2 (13.3%) |
| Construction | 96 (90.6%) | 10 (9.4%) |
| Manufacturing | 26 (66.7%) | 13 (33.3%) |
| Wholesale Trade | 12 (100.0%) | 0 (0.0%) |
| Retail Trade | 7 (33.3%) | 14 (66.7%) |
| Transportation & Warehousing | 10 (90.9%) | 1 (9.1%) |
| Utilities | 15 (100.0%) | 0 (0.0%) |
| Information | 8 (100.0%) | 0 (0.0%) |
| Finance & Insurance | 2 (10.5%) | 17 (89.5%) |
| Real Estate, Rental & Leasing | 0 (0.0%) | 0 (0.0%) |
| Professional & Scientific | 2 (66.7%) | 1 (33.3%) |
| Enterprise Management | 0 (0.0%) | 0 (0.0%) |
| Administrative & Support | 8 (32.0%) | 17 (68.0%) |
| Educational Services | 8 (12.3%) | 57 (87.7%) |
| Health Care & Social Assistance | 5 (4.2%) | 113 (95.8%) |
| Arts, Entertainment & Recreation | 4 (80.0%) | 1 (20.0%) |
| Accommodation & Food Services | 17 (35.4%) | 31 (64.6%) |
| Public Administration | 3 (25.0%) | 9 (75.0%) |
| Total | 331 (51.2%) | 316 (48.8%) |
Education in Syracuse
School Enrollment in Syracuse
The most common levels of schooling among the 391 students in Syracuse are high school (136 | 34.8%), elementary school (93 | 23.8%), and middle school (89 | 22.8%).
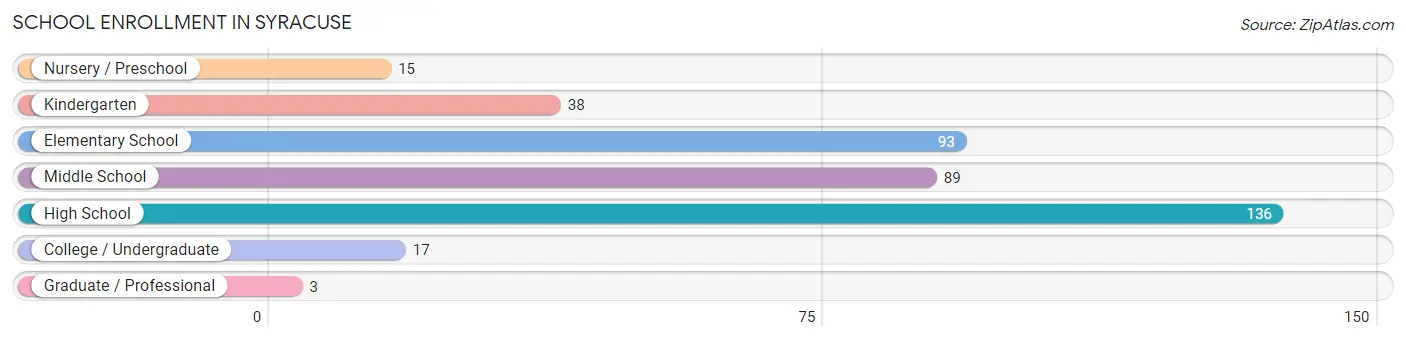
| School Level | # Students | % Students |
| Nursery / Preschool | 15 | 3.8% |
| Kindergarten | 38 | 9.7% |
| Elementary School | 93 | 23.8% |
| Middle School | 89 | 22.8% |
| High School | 136 | 34.8% |
| College / Undergraduate | 17 | 4.3% |
| Graduate / Professional | 3 | 0.8% |
| Total | 391 | 100.0% |
School Enrollment by Age by Funding Source in Syracuse
Out of a total of 391 students who are enrolled in schools in Syracuse, 14 (3.6%) attend a private institution, while the remaining 377 (96.4%) are enrolled in public schools. The age group of 3 to 4 year olds has the highest likelihood of being enrolled in private schools, with 8 (80.0% in the age bracket) enrolled. Conversely, the age group of 5 to 9 year old has the lowest likelihood of being enrolled in a private school, with 123 (100.0% in the age bracket) attending a public institution.
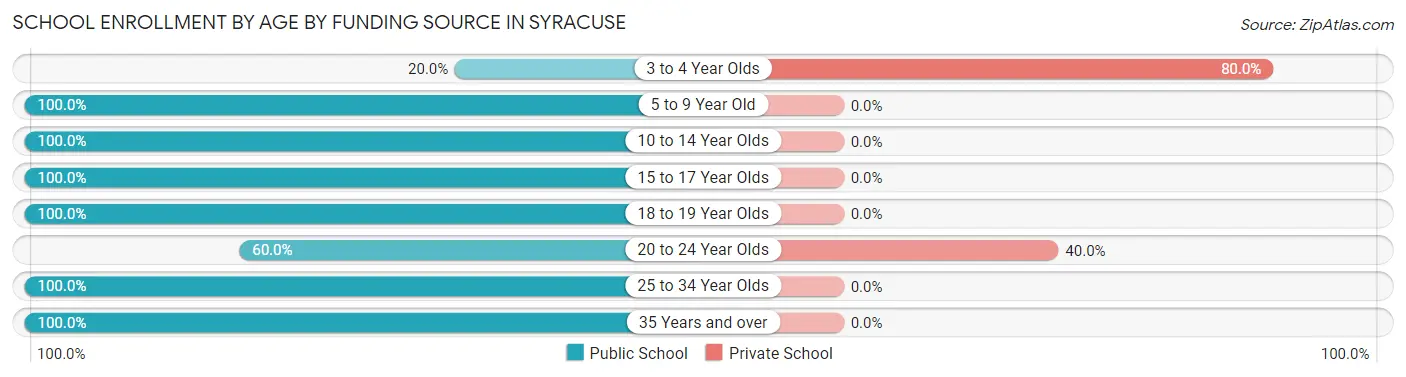
| Age Bracket | Public School | Private School |
| 3 to 4 Year Olds | 2 (20.0%) | 8 (80.0%) |
| 5 to 9 Year Old | 123 (100.0%) | 0 (0.0%) |
| 10 to 14 Year Olds | 105 (100.0%) | 0 (0.0%) |
| 15 to 17 Year Olds | 126 (100.0%) | 0 (0.0%) |
| 18 to 19 Year Olds | 7 (100.0%) | 0 (0.0%) |
| 20 to 24 Year Olds | 9 (60.0%) | 6 (40.0%) |
| 25 to 34 Year Olds | 2 (100.0%) | 0 (0.0%) |
| 35 Years and over | 3 (100.0%) | 0 (0.0%) |
| Total | 377 (96.4%) | 14 (3.6%) |
Educational Attainment by Field of Study in Syracuse
Business (27 | 18.2%), education (26 | 17.6%), bio, nature & agricultural (20 | 13.5%), social sciences (16 | 10.8%), and arts & humanities (14 | 9.5%) are the most common fields of study among 148 individuals in Syracuse who have obtained a bachelor's degree or higher.
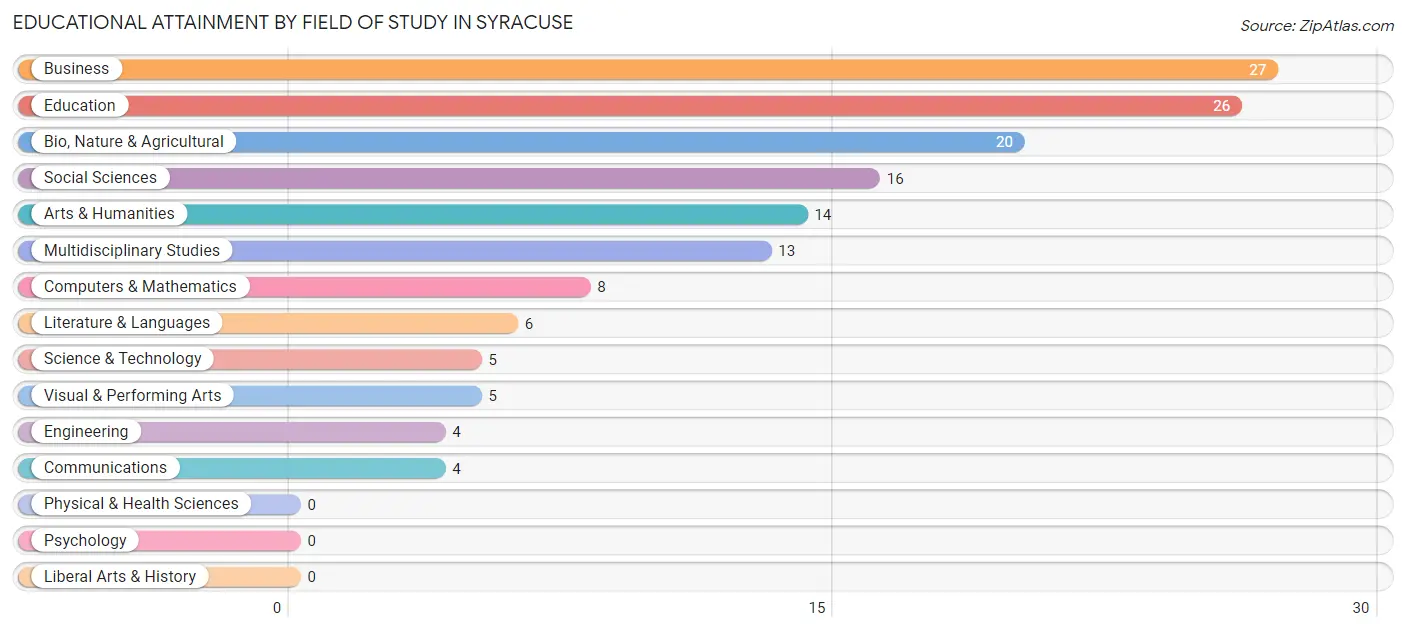
| Field of Study | # Graduates | % Graduates |
| Computers & Mathematics | 8 | 5.4% |
| Bio, Nature & Agricultural | 20 | 13.5% |
| Physical & Health Sciences | 0 | 0.0% |
| Psychology | 0 | 0.0% |
| Social Sciences | 16 | 10.8% |
| Engineering | 4 | 2.7% |
| Multidisciplinary Studies | 13 | 8.8% |
| Science & Technology | 5 | 3.4% |
| Business | 27 | 18.2% |
| Education | 26 | 17.6% |
| Literature & Languages | 6 | 4.1% |
| Liberal Arts & History | 0 | 0.0% |
| Visual & Performing Arts | 5 | 3.4% |
| Communications | 4 | 2.7% |
| Arts & Humanities | 14 | 9.5% |
| Total | 148 | 100.0% |
Transportation & Commute in Syracuse
Vehicle Availability by Sex in Syracuse
The most prevalent vehicle ownership categories in Syracuse are males with 1 vehicle (109, accounting for 32.9%) and females with 1 vehicle (83, making up 36.0%).
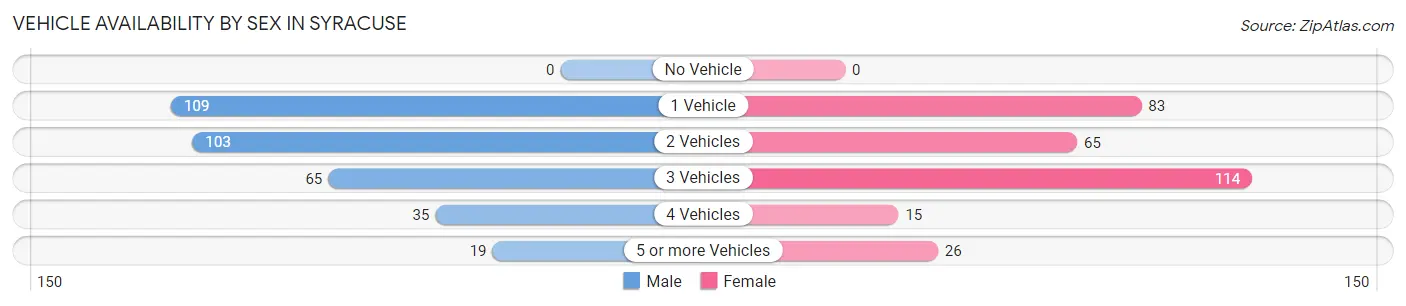
| Vehicles Available | Male | Female |
| No Vehicle | 0 (0.0%) | 0 (0.0%) |
| 1 Vehicle | 109 (32.9%) | 83 (27.4%) |
| 2 Vehicles | 103 (31.1%) | 65 (21.4%) |
| 3 Vehicles | 65 (19.6%) | 114 (37.6%) |
| 4 Vehicles | 35 (10.6%) | 15 (5.0%) |
| 5 or more Vehicles | 19 (5.7%) | 26 (8.6%) |
| Total | 331 (100.0%) | 303 (100.0%) |
Commute Time in Syracuse
The most frequently occuring commute durations in Syracuse are less than 5 minutes (150 commuters, 25.8%), 5 to 9 minutes (110 commuters, 18.9%), and 25 to 29 minutes (86 commuters, 14.8%).
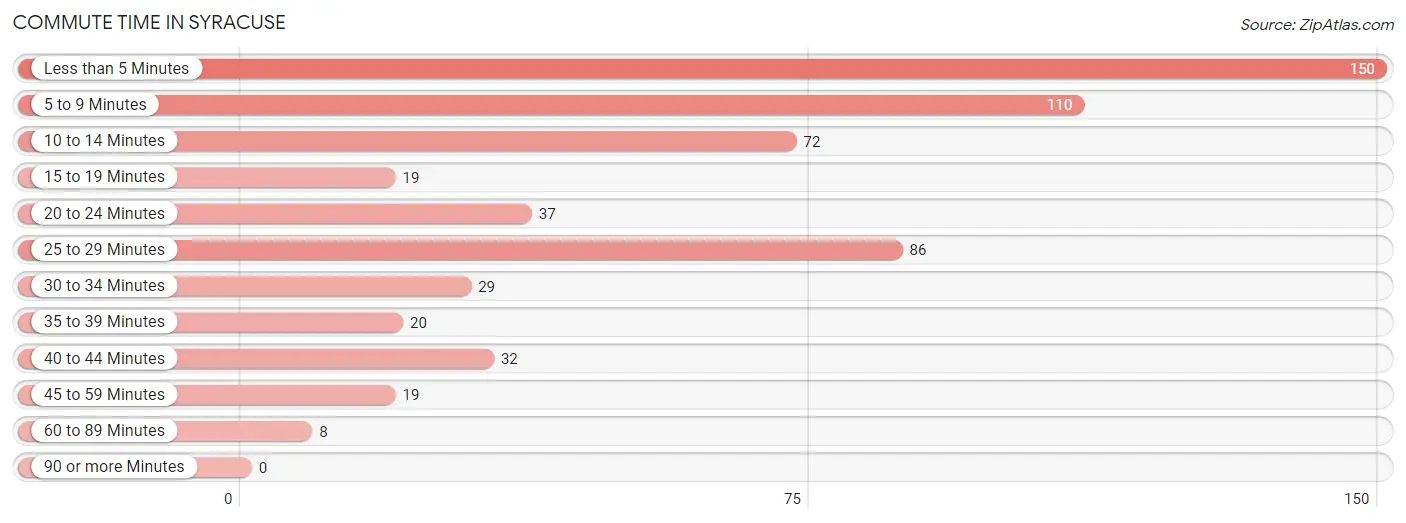
| Commute Time | # Commuters | % Commuters |
| Less than 5 Minutes | 150 | 25.8% |
| 5 to 9 Minutes | 110 | 18.9% |
| 10 to 14 Minutes | 72 | 12.4% |
| 15 to 19 Minutes | 19 | 3.3% |
| 20 to 24 Minutes | 37 | 6.4% |
| 25 to 29 Minutes | 86 | 14.8% |
| 30 to 34 Minutes | 29 | 5.0% |
| 35 to 39 Minutes | 20 | 3.4% |
| 40 to 44 Minutes | 32 | 5.5% |
| 45 to 59 Minutes | 19 | 3.3% |
| 60 to 89 Minutes | 8 | 1.4% |
| 90 or more Minutes | 0 | 0.0% |
Commute Time by Sex in Syracuse
The most common commute times in Syracuse are 25 to 29 minutes (86 commuters, 27.5%) for males and 5 to 9 minutes (77 commuters, 28.6%) for females.
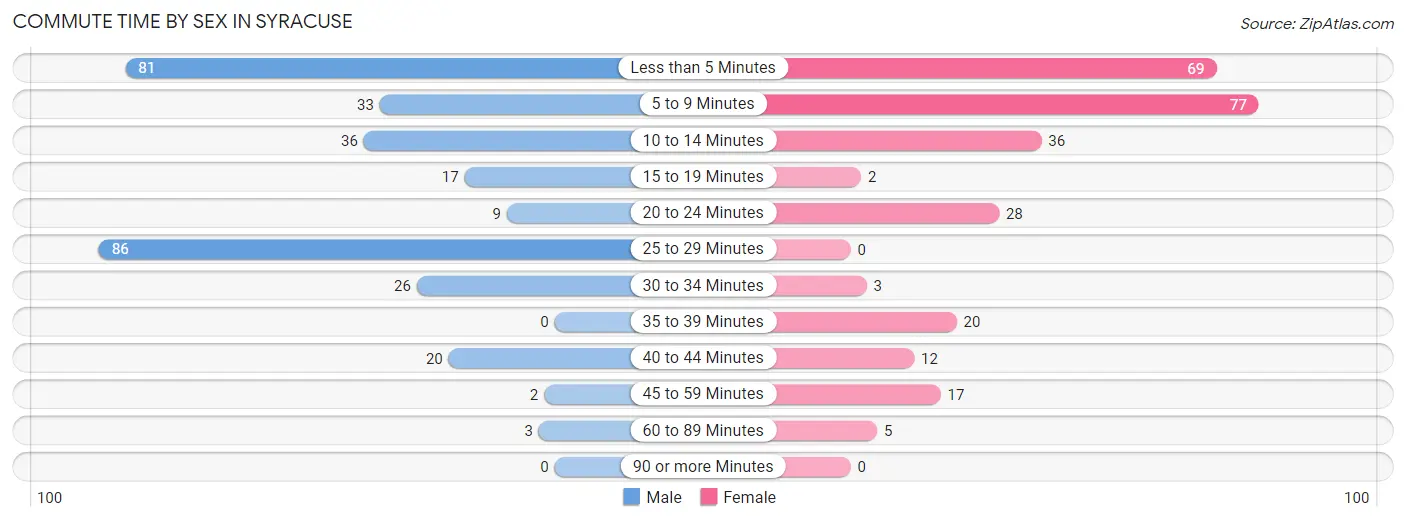
| Commute Time | Male | Female |
| Less than 5 Minutes | 81 (25.9%) | 69 (25.7%) |
| 5 to 9 Minutes | 33 (10.5%) | 77 (28.6%) |
| 10 to 14 Minutes | 36 (11.5%) | 36 (13.4%) |
| 15 to 19 Minutes | 17 (5.4%) | 2 (0.7%) |
| 20 to 24 Minutes | 9 (2.9%) | 28 (10.4%) |
| 25 to 29 Minutes | 86 (27.5%) | 0 (0.0%) |
| 30 to 34 Minutes | 26 (8.3%) | 3 (1.1%) |
| 35 to 39 Minutes | 0 (0.0%) | 20 (7.4%) |
| 40 to 44 Minutes | 20 (6.4%) | 12 (4.5%) |
| 45 to 59 Minutes | 2 (0.6%) | 17 (6.3%) |
| 60 to 89 Minutes | 3 (1.0%) | 5 (1.9%) |
| 90 or more Minutes | 0 (0.0%) | 0 (0.0%) |
Time of Departure to Work by Sex in Syracuse
The most frequent times of departure to work in Syracuse are 6:00 AM to 6:29 AM (132, 42.2%) for males and 7:30 AM to 7:59 AM (51, 19.0%) for females.
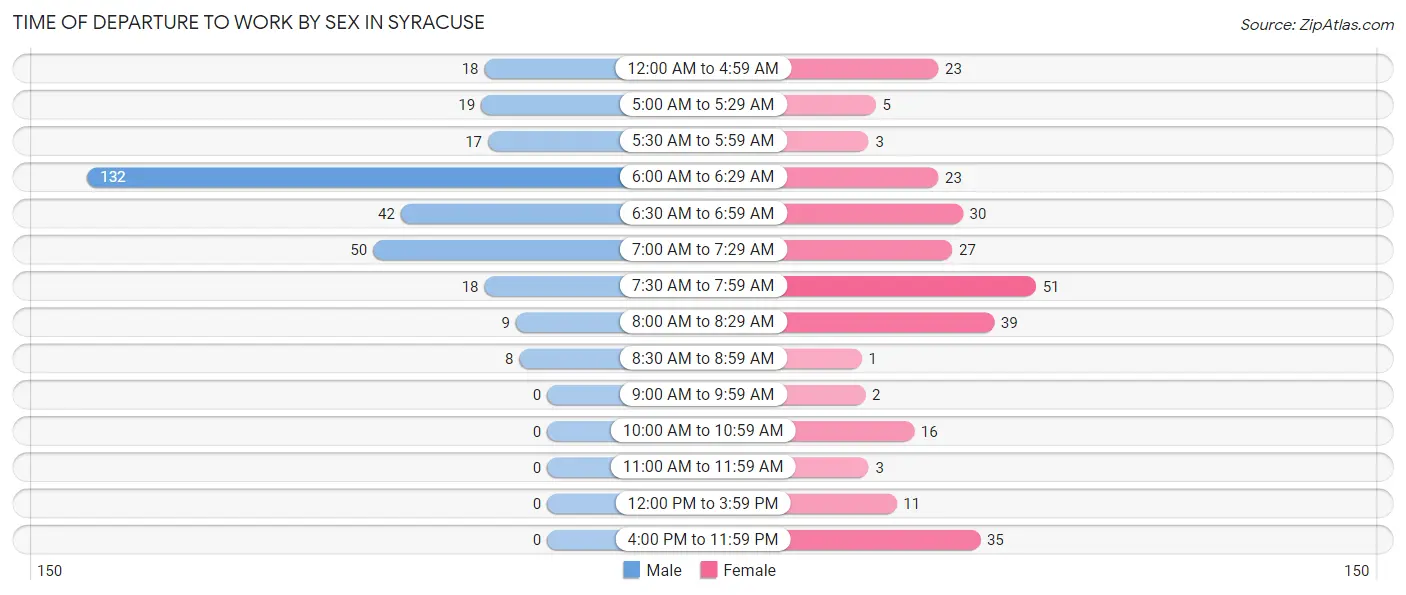
| Time of Departure | Male | Female |
| 12:00 AM to 4:59 AM | 18 (5.8%) | 23 (8.6%) |
| 5:00 AM to 5:29 AM | 19 (6.1%) | 5 (1.9%) |
| 5:30 AM to 5:59 AM | 17 (5.4%) | 3 (1.1%) |
| 6:00 AM to 6:29 AM | 132 (42.2%) | 23 (8.6%) |
| 6:30 AM to 6:59 AM | 42 (13.4%) | 30 (11.2%) |
| 7:00 AM to 7:29 AM | 50 (16.0%) | 27 (10.0%) |
| 7:30 AM to 7:59 AM | 18 (5.8%) | 51 (19.0%) |
| 8:00 AM to 8:29 AM | 9 (2.9%) | 39 (14.5%) |
| 8:30 AM to 8:59 AM | 8 (2.6%) | 1 (0.4%) |
| 9:00 AM to 9:59 AM | 0 (0.0%) | 2 (0.7%) |
| 10:00 AM to 10:59 AM | 0 (0.0%) | 16 (5.9%) |
| 11:00 AM to 11:59 AM | 0 (0.0%) | 3 (1.1%) |
| 12:00 PM to 3:59 PM | 0 (0.0%) | 11 (4.1%) |
| 4:00 PM to 11:59 PM | 0 (0.0%) | 35 (13.0%) |
| Total | 313 (100.0%) | 269 (100.0%) |
Housing Occupancy in Syracuse
Occupancy by Ownership in Syracuse
Of the total 530 dwellings in Syracuse, owner-occupied units account for 375 (70.8%), while renter-occupied units make up 155 (29.2%).
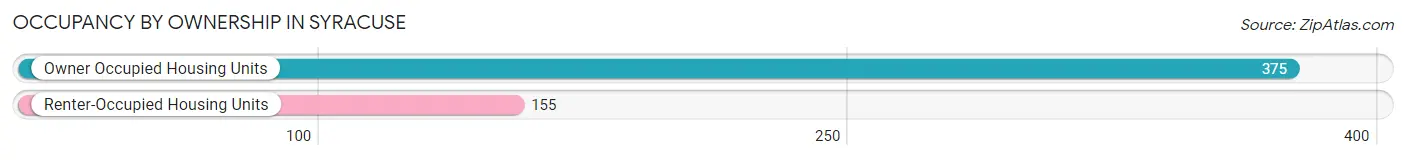
| Occupancy | # Housing Units | % Housing Units |
| Owner Occupied Housing Units | 375 | 70.8% |
| Renter-Occupied Housing Units | 155 | 29.2% |
| Total Occupied Housing Units | 530 | 100.0% |
Occupancy by Household Size in Syracuse
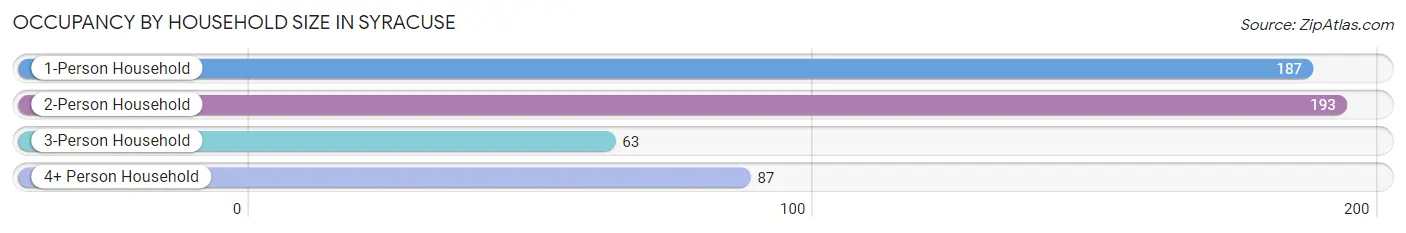
| Household Size | # Housing Units | % Housing Units |
| 1-Person Household | 187 | 35.3% |
| 2-Person Household | 193 | 36.4% |
| 3-Person Household | 63 | 11.9% |
| 4+ Person Household | 87 | 16.4% |
| Total Housing Units | 530 | 100.0% |
Occupancy by Ownership by Household Size in Syracuse
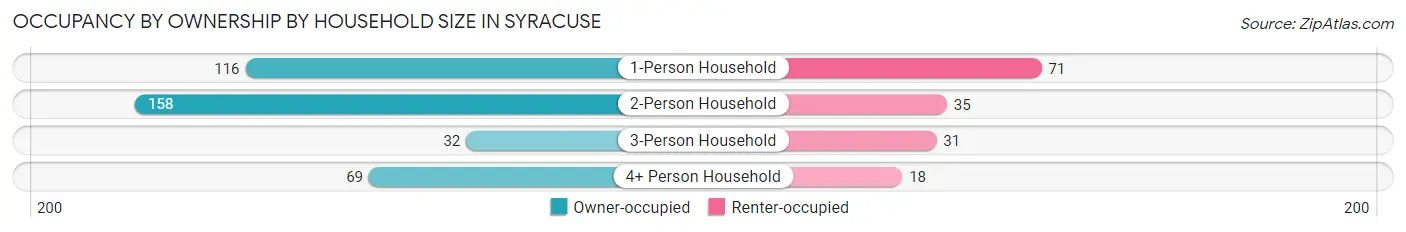
| Household Size | Owner-occupied | Renter-occupied |
| 1-Person Household | 116 (62.0%) | 71 (38.0%) |
| 2-Person Household | 158 (81.9%) | 35 (18.1%) |
| 3-Person Household | 32 (50.8%) | 31 (49.2%) |
| 4+ Person Household | 69 (79.3%) | 18 (20.7%) |
| Total Housing Units | 375 (70.8%) | 155 (29.2%) |
Occupancy by Educational Attainment in Syracuse
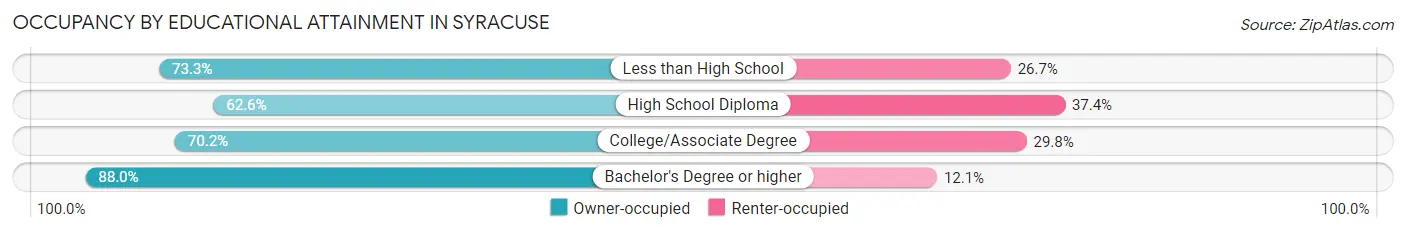
| Household Size | Owner-occupied | Renter-occupied |
| Less than High School | 44 (73.3%) | 16 (26.7%) |
| High School Diploma | 112 (62.6%) | 67 (37.4%) |
| College/Associate Degree | 146 (70.2%) | 62 (29.8%) |
| Bachelor's Degree or higher | 73 (87.9%) | 10 (12.0%) |
Occupancy by Age of Householder in Syracuse
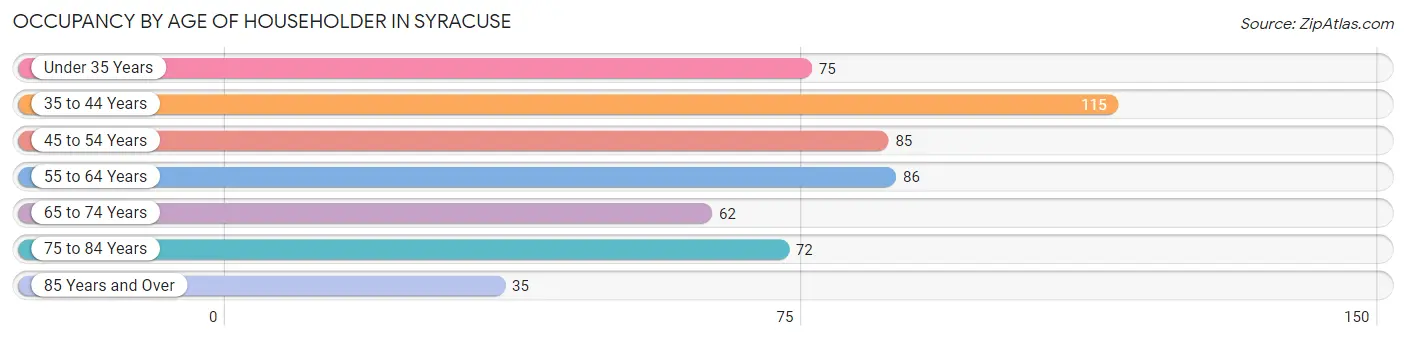
| Age Bracket | # Households | % Households |
| Under 35 Years | 75 | 14.1% |
| 35 to 44 Years | 115 | 21.7% |
| 45 to 54 Years | 85 | 16.0% |
| 55 to 64 Years | 86 | 16.2% |
| 65 to 74 Years | 62 | 11.7% |
| 75 to 84 Years | 72 | 13.6% |
| 85 Years and Over | 35 | 6.6% |
| Total | 530 | 100.0% |
Housing Finances in Syracuse
Median Income by Occupancy in Syracuse
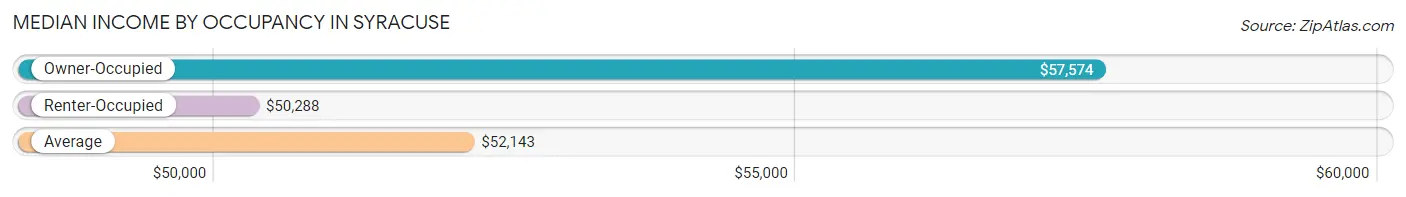
| Occupancy Type | # Households | Median Income |
| Owner-Occupied | 375 (70.8%) | $57,574 |
| Renter-Occupied | 155 (29.2%) | $50,288 |
| Average | 530 (100.0%) | $52,143 |
Occupancy by Householder Income Bracket in Syracuse
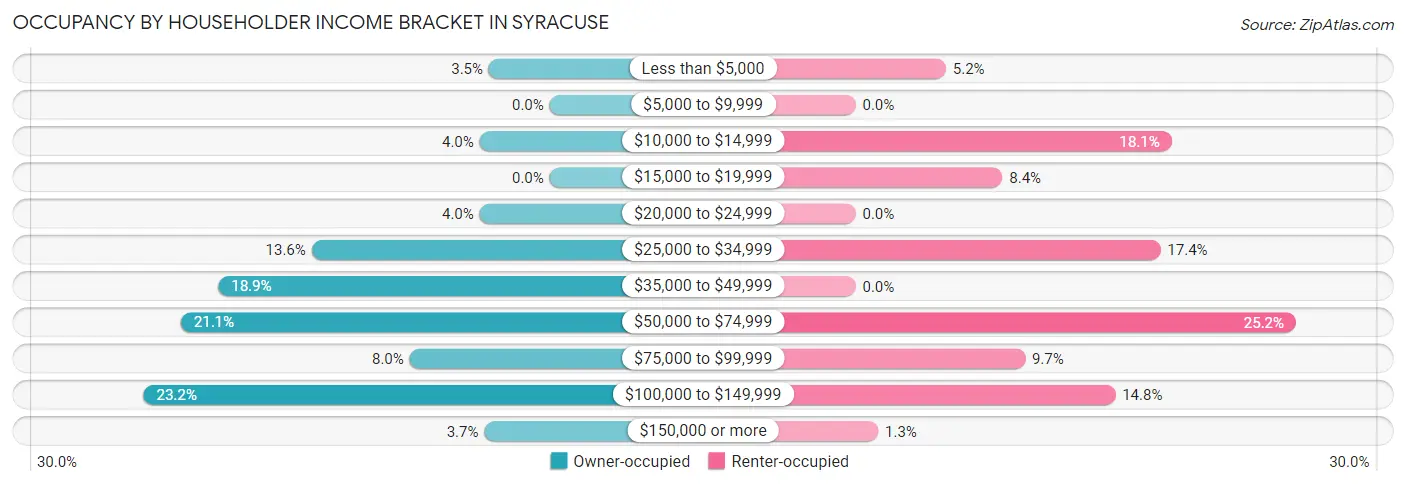
| Income Bracket | Owner-occupied | Renter-occupied |
| Less than $5,000 | 13 (3.5%) | 8 (5.2%) |
| $5,000 to $9,999 | 0 (0.0%) | 0 (0.0%) |
| $10,000 to $14,999 | 15 (4.0%) | 28 (18.1%) |
| $15,000 to $19,999 | 0 (0.0%) | 13 (8.4%) |
| $20,000 to $24,999 | 15 (4.0%) | 0 (0.0%) |
| $25,000 to $34,999 | 51 (13.6%) | 27 (17.4%) |
| $35,000 to $49,999 | 71 (18.9%) | 0 (0.0%) |
| $50,000 to $74,999 | 79 (21.1%) | 39 (25.2%) |
| $75,000 to $99,999 | 30 (8.0%) | 15 (9.7%) |
| $100,000 to $149,999 | 87 (23.2%) | 23 (14.8%) |
| $150,000 or more | 14 (3.7%) | 2 (1.3%) |
| Total | 375 (100.0%) | 155 (100.0%) |
Monthly Housing Cost Tiers in Syracuse
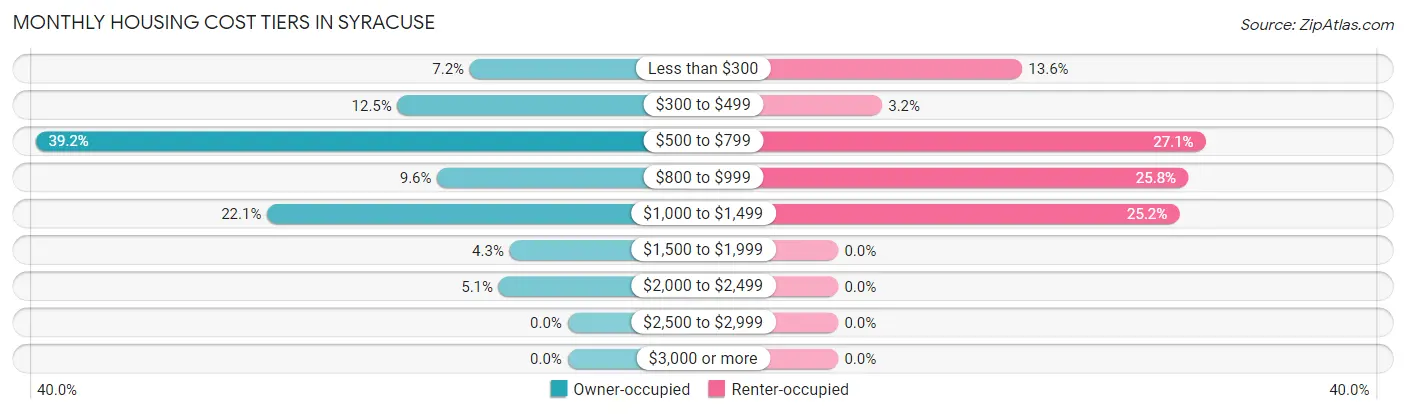
| Monthly Cost | Owner-occupied | Renter-occupied |
| Less than $300 | 27 (7.2%) | 21 (13.6%) |
| $300 to $499 | 47 (12.5%) | 5 (3.2%) |
| $500 to $799 | 147 (39.2%) | 42 (27.1%) |
| $800 to $999 | 36 (9.6%) | 40 (25.8%) |
| $1,000 to $1,499 | 83 (22.1%) | 39 (25.2%) |
| $1,500 to $1,999 | 16 (4.3%) | 0 (0.0%) |
| $2,000 to $2,499 | 19 (5.1%) | 0 (0.0%) |
| $2,500 to $2,999 | 0 (0.0%) | 0 (0.0%) |
| $3,000 or more | 0 (0.0%) | 0 (0.0%) |
| Total | 375 (100.0%) | 155 (100.0%) |
Physical Housing Characteristics in Syracuse
Housing Structures in Syracuse
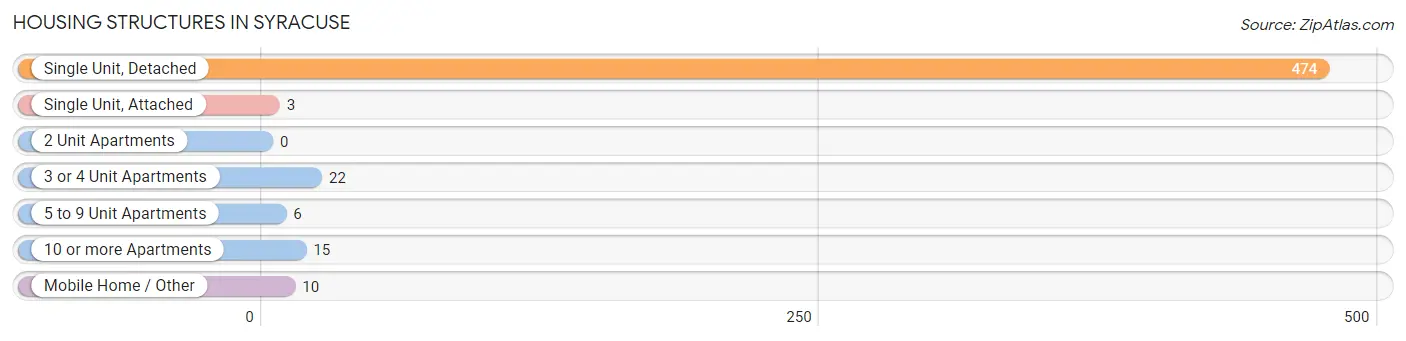
| Structure Type | # Housing Units | % Housing Units |
| Single Unit, Detached | 474 | 89.4% |
| Single Unit, Attached | 3 | 0.6% |
| 2 Unit Apartments | 0 | 0.0% |
| 3 or 4 Unit Apartments | 22 | 4.2% |
| 5 to 9 Unit Apartments | 6 | 1.1% |
| 10 or more Apartments | 15 | 2.8% |
| Mobile Home / Other | 10 | 1.9% |
| Total | 530 | 100.0% |
Housing Structures by Occupancy in Syracuse
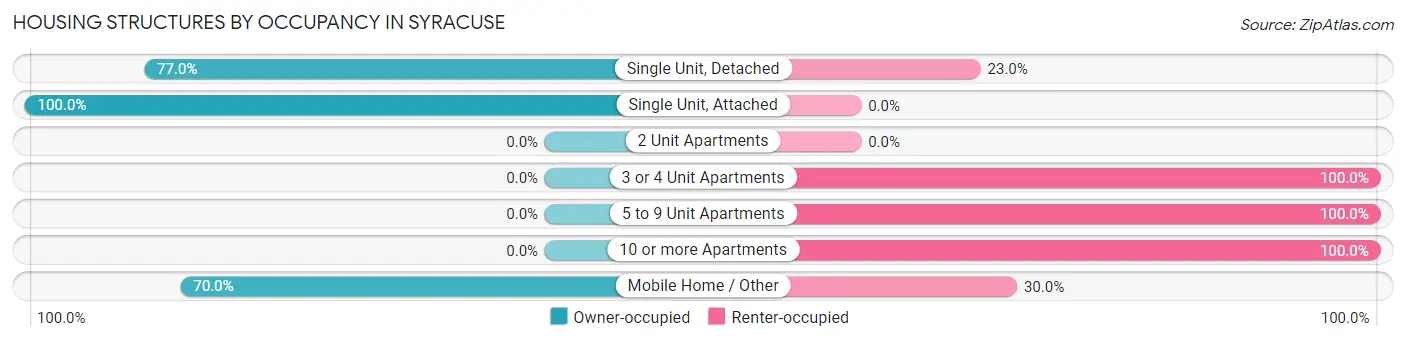
| Structure Type | Owner-occupied | Renter-occupied |
| Single Unit, Detached | 365 (77.0%) | 109 (23.0%) |
| Single Unit, Attached | 3 (100.0%) | 0 (0.0%) |
| 2 Unit Apartments | 0 (0.0%) | 0 (0.0%) |
| 3 or 4 Unit Apartments | 0 (0.0%) | 22 (100.0%) |
| 5 to 9 Unit Apartments | 0 (0.0%) | 6 (100.0%) |
| 10 or more Apartments | 0 (0.0%) | 15 (100.0%) |
| Mobile Home / Other | 7 (70.0%) | 3 (30.0%) |
| Total | 375 (70.8%) | 155 (29.2%) |
Housing Structures by Number of Rooms in Syracuse
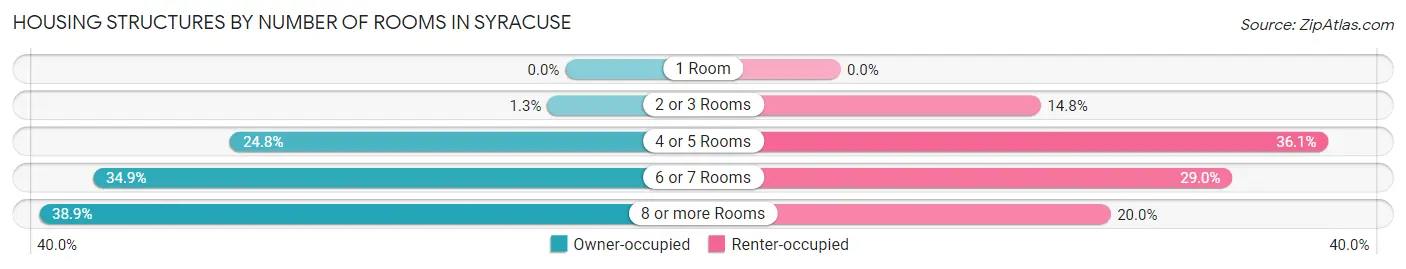
| Number of Rooms | Owner-occupied | Renter-occupied |
| 1 Room | 0 (0.0%) | 0 (0.0%) |
| 2 or 3 Rooms | 5 (1.3%) | 23 (14.8%) |
| 4 or 5 Rooms | 93 (24.8%) | 56 (36.1%) |
| 6 or 7 Rooms | 131 (34.9%) | 45 (29.0%) |
| 8 or more Rooms | 146 (38.9%) | 31 (20.0%) |
| Total | 375 (100.0%) | 155 (100.0%) |
Housing Structure by Heating Type in Syracuse
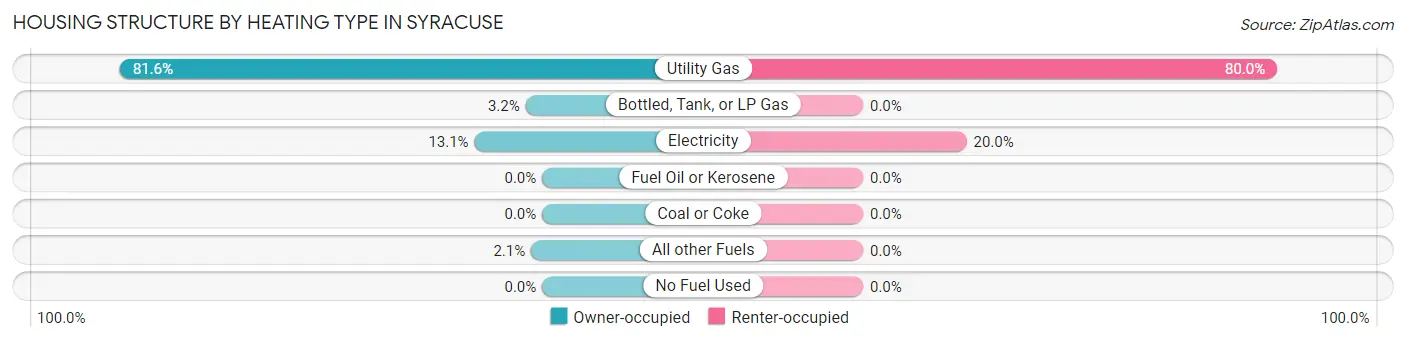
| Heating Type | Owner-occupied | Renter-occupied |
| Utility Gas | 306 (81.6%) | 124 (80.0%) |
| Bottled, Tank, or LP Gas | 12 (3.2%) | 0 (0.0%) |
| Electricity | 49 (13.1%) | 31 (20.0%) |
| Fuel Oil or Kerosene | 0 (0.0%) | 0 (0.0%) |
| Coal or Coke | 0 (0.0%) | 0 (0.0%) |
| All other Fuels | 8 (2.1%) | 0 (0.0%) |
| No Fuel Used | 0 (0.0%) | 0 (0.0%) |
| Total | 375 (100.0%) | 155 (100.0%) |
Household Vehicle Usage in Syracuse
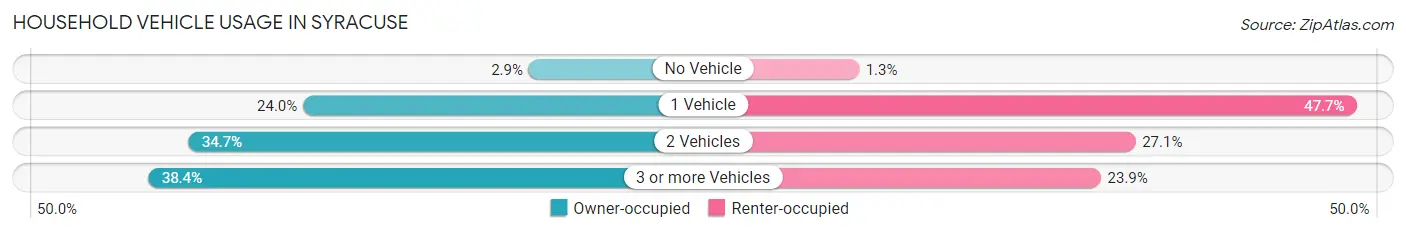
| Vehicles per Household | Owner-occupied | Renter-occupied |
| No Vehicle | 11 (2.9%) | 2 (1.3%) |
| 1 Vehicle | 90 (24.0%) | 74 (47.7%) |
| 2 Vehicles | 130 (34.7%) | 42 (27.1%) |
| 3 or more Vehicles | 144 (38.4%) | 37 (23.9%) |
| Total | 375 (100.0%) | 155 (100.0%) |
Real Estate & Mortgages in Syracuse
Real Estate and Mortgage Overview in Syracuse
| Characteristic | Without Mortgage | With Mortgage |
| Housing Units | 212 | 163 |
| Median Property Value | $145,800 | $96,100 |
| Median Household Income | $46,500 | $6 |
| Monthly Housing Costs | $565 | $0 |
| Real Estate Taxes | $2,395 | $0 |
Property Value by Mortgage Status in Syracuse
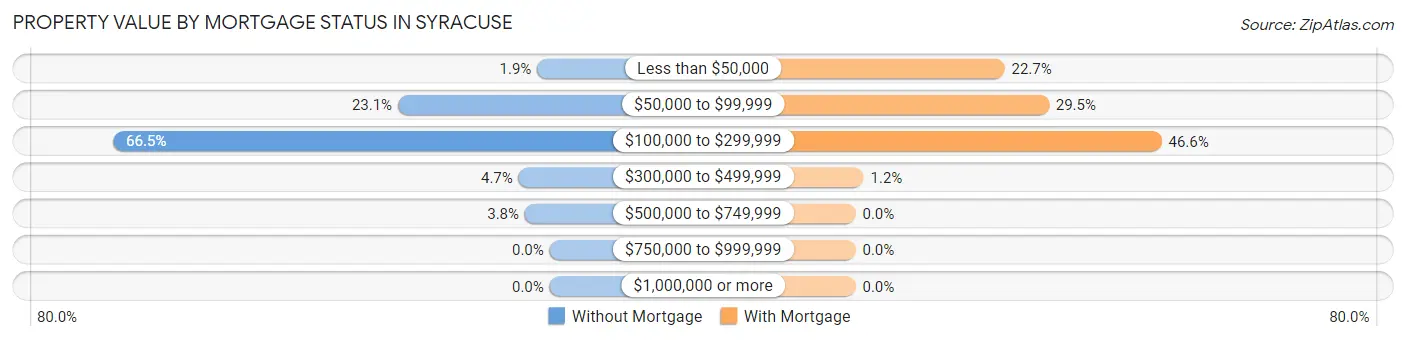
| Property Value | Without Mortgage | With Mortgage |
| Less than $50,000 | 4 (1.9%) | 37 (22.7%) |
| $50,000 to $99,999 | 49 (23.1%) | 48 (29.4%) |
| $100,000 to $299,999 | 141 (66.5%) | 76 (46.6%) |
| $300,000 to $499,999 | 10 (4.7%) | 2 (1.2%) |
| $500,000 to $749,999 | 8 (3.8%) | 0 (0.0%) |
| $750,000 to $999,999 | 0 (0.0%) | 0 (0.0%) |
| $1,000,000 or more | 0 (0.0%) | 0 (0.0%) |
| Total | 212 (100.0%) | 163 (100.0%) |
Household Income by Mortgage Status in Syracuse
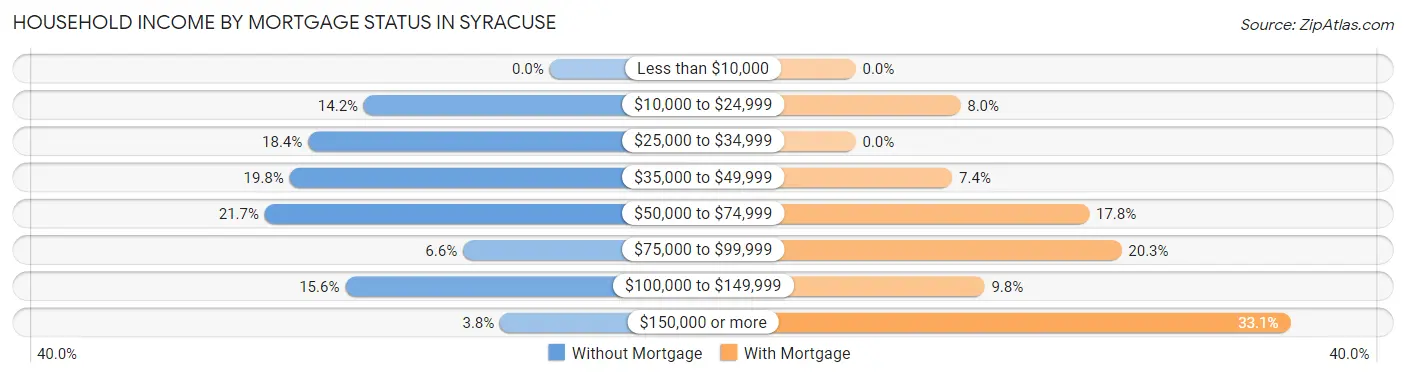
| Household Income | Without Mortgage | With Mortgage |
| Less than $10,000 | 0 (0.0%) | 0 (0.0%) |
| $10,000 to $24,999 | 30 (14.1%) | 13 (8.0%) |
| $25,000 to $34,999 | 39 (18.4%) | 0 (0.0%) |
| $35,000 to $49,999 | 42 (19.8%) | 12 (7.4%) |
| $50,000 to $74,999 | 46 (21.7%) | 29 (17.8%) |
| $75,000 to $99,999 | 14 (6.6%) | 33 (20.3%) |
| $100,000 to $149,999 | 33 (15.6%) | 16 (9.8%) |
| $150,000 or more | 8 (3.8%) | 54 (33.1%) |
| Total | 212 (100.0%) | 163 (100.0%) |
Property Value to Household Income Ratio in Syracuse
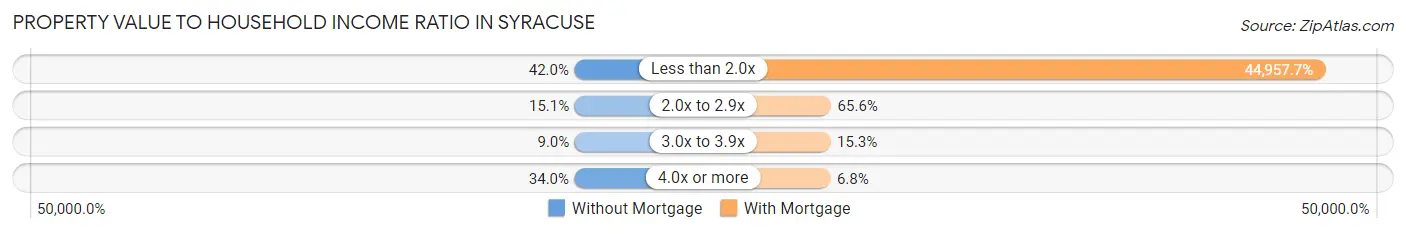
| Value-to-Income Ratio | Without Mortgage | With Mortgage |
| Less than 2.0x | 89 (42.0%) | 73,281 (44,957.7%) |
| 2.0x to 2.9x | 32 (15.1%) | 107 (65.6%) |
| 3.0x to 3.9x | 19 (9.0%) | 25 (15.3%) |
| 4.0x or more | 72 (34.0%) | 11 (6.8%) |
| Total | 212 (100.0%) | 163 (100.0%) |
Real Estate Taxes by Mortgage Status in Syracuse
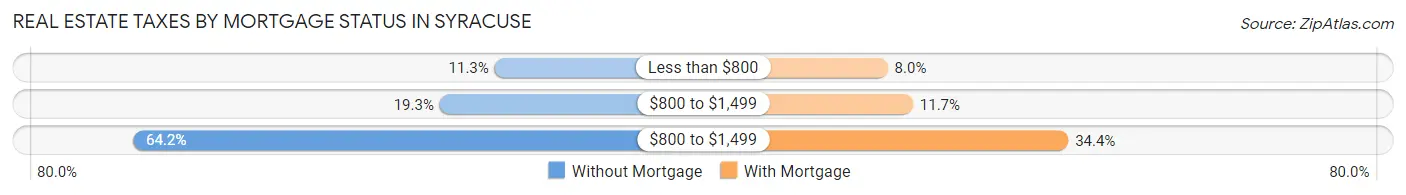
| Property Taxes | Without Mortgage | With Mortgage |
| Less than $800 | 24 (11.3%) | 13 (8.0%) |
| $800 to $1,499 | 41 (19.3%) | 19 (11.7%) |
| $800 to $1,499 | 136 (64.1%) | 56 (34.4%) |
| Total | 212 (100.0%) | 163 (100.0%) |
Health & Disability in Syracuse
Health Insurance Coverage by Age in Syracuse
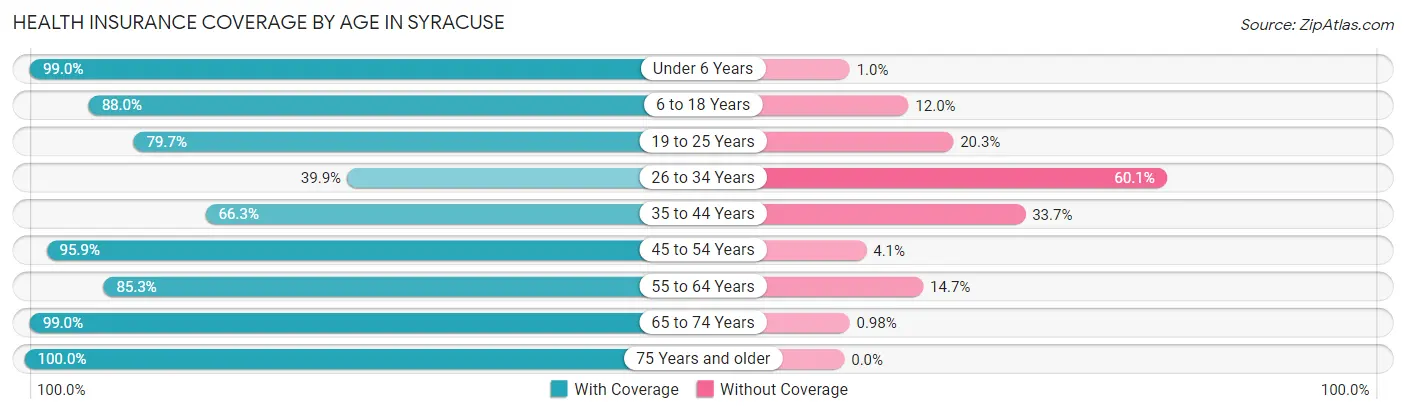
| Age Bracket | With Coverage | Without Coverage |
| Under 6 Years | 98 (99.0%) | 1 (1.0%) |
| 6 to 18 Years | 346 (88.0%) | 47 (12.0%) |
| 19 to 25 Years | 51 (79.7%) | 13 (20.3%) |
| 26 to 34 Years | 79 (39.9%) | 119 (60.1%) |
| 35 to 44 Years | 161 (66.3%) | 82 (33.7%) |
| 45 to 54 Years | 117 (95.9%) | 5 (4.1%) |
| 55 to 64 Years | 116 (85.3%) | 20 (14.7%) |
| 65 to 74 Years | 101 (99.0%) | 1 (1.0%) |
| 75 Years and older | 145 (100.0%) | 0 (0.0%) |
| Total | 1,214 (80.8%) | 288 (19.2%) |
Health Insurance Coverage by Citizenship Status in Syracuse
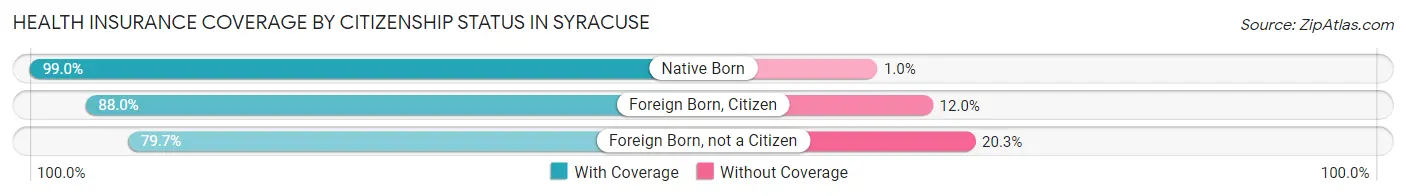
| Citizenship Status | With Coverage | Without Coverage |
| Native Born | 98 (99.0%) | 1 (1.0%) |
| Foreign Born, Citizen | 346 (88.0%) | 47 (12.0%) |
| Foreign Born, not a Citizen | 51 (79.7%) | 13 (20.3%) |
Health Insurance Coverage by Household Income in Syracuse
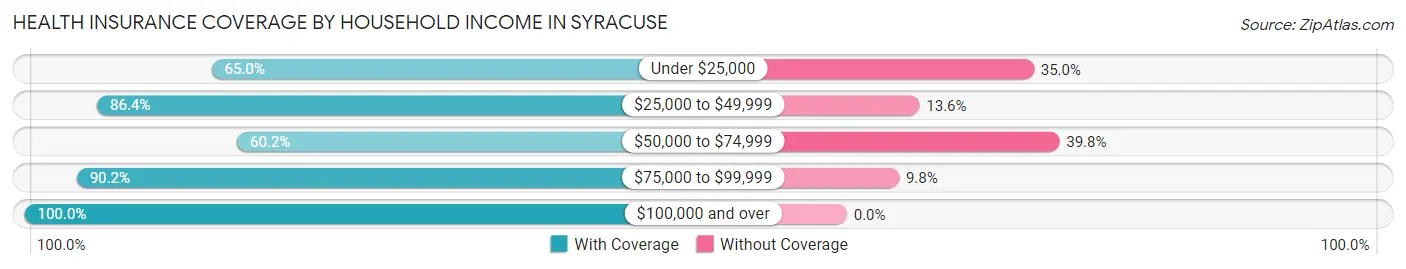
| Household Income | With Coverage | Without Coverage |
| Under $25,000 | 102 (65.0%) | 55 (35.0%) |
| $25,000 to $49,999 | 305 (86.4%) | 48 (13.6%) |
| $50,000 to $74,999 | 260 (60.2%) | 172 (39.8%) |
| $75,000 to $99,999 | 120 (90.2%) | 13 (9.8%) |
| $100,000 and over | 427 (100.0%) | 0 (0.0%) |
Public vs Private Health Insurance Coverage by Age in Syracuse
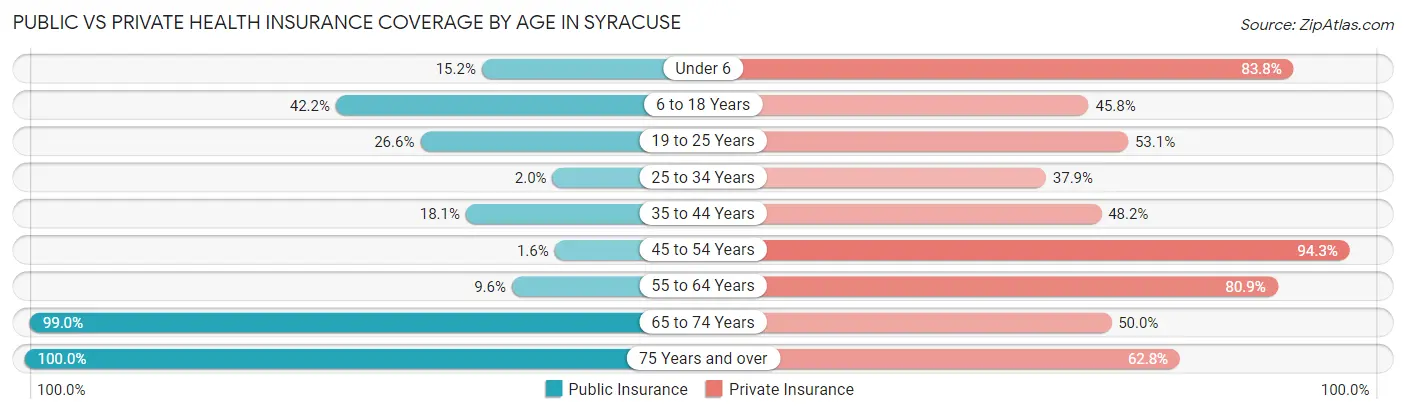
| Age Bracket | Public Insurance | Private Insurance |
| Under 6 | 15 (15.1%) | 83 (83.8%) |
| 6 to 18 Years | 166 (42.2%) | 180 (45.8%) |
| 19 to 25 Years | 17 (26.6%) | 34 (53.1%) |
| 25 to 34 Years | 4 (2.0%) | 75 (37.9%) |
| 35 to 44 Years | 44 (18.1%) | 117 (48.1%) |
| 45 to 54 Years | 2 (1.6%) | 115 (94.3%) |
| 55 to 64 Years | 13 (9.6%) | 110 (80.9%) |
| 65 to 74 Years | 101 (99.0%) | 51 (50.0%) |
| 75 Years and over | 145 (100.0%) | 91 (62.8%) |
| Total | 507 (33.8%) | 856 (57.0%) |
Disability Status by Sex by Age in Syracuse
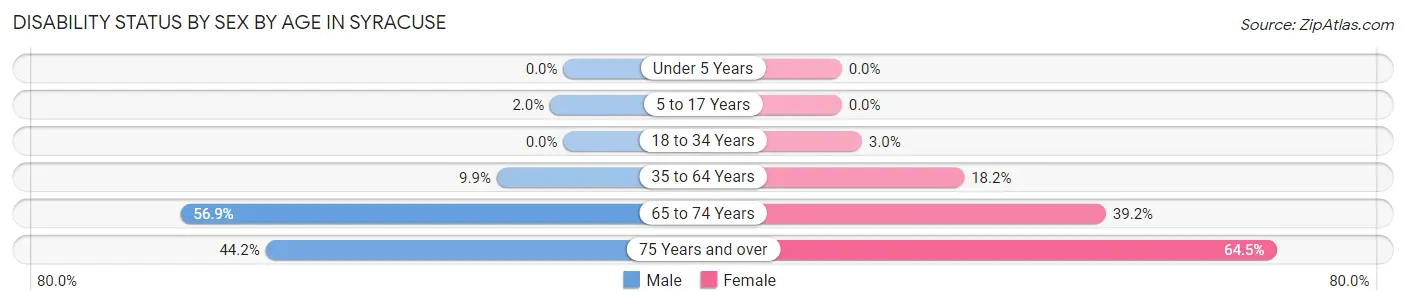
| Age Bracket | Male | Female |
| Under 5 Years | 0 (0.0%) | 0 (0.0%) |
| 5 to 17 Years | 4 (2.0%) | 0 (0.0%) |
| 18 to 34 Years | 0 (0.0%) | 4 (3.0%) |
| 35 to 64 Years | 18 (9.9%) | 58 (18.2%) |
| 65 to 74 Years | 29 (56.9%) | 20 (39.2%) |
| 75 Years and over | 23 (44.2%) | 60 (64.5%) |
Disability Class by Sex by Age in Syracuse
Disability Class: Hearing Difficulty
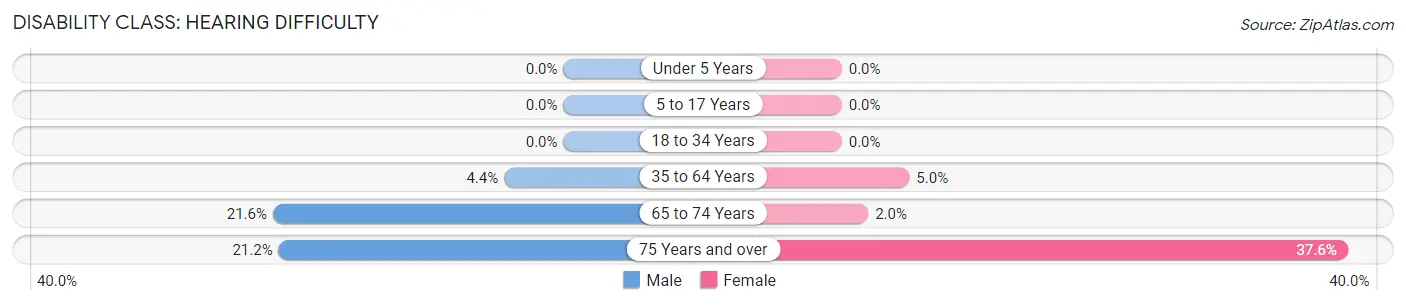
| Age Bracket | Male | Female |
| Under 5 Years | 0 (0.0%) | 0 (0.0%) |
| 5 to 17 Years | 0 (0.0%) | 0 (0.0%) |
| 18 to 34 Years | 0 (0.0%) | 0 (0.0%) |
| 35 to 64 Years | 8 (4.4%) | 16 (5.0%) |
| 65 to 74 Years | 11 (21.6%) | 1 (2.0%) |
| 75 Years and over | 11 (21.1%) | 35 (37.6%) |
Disability Class: Vision Difficulty
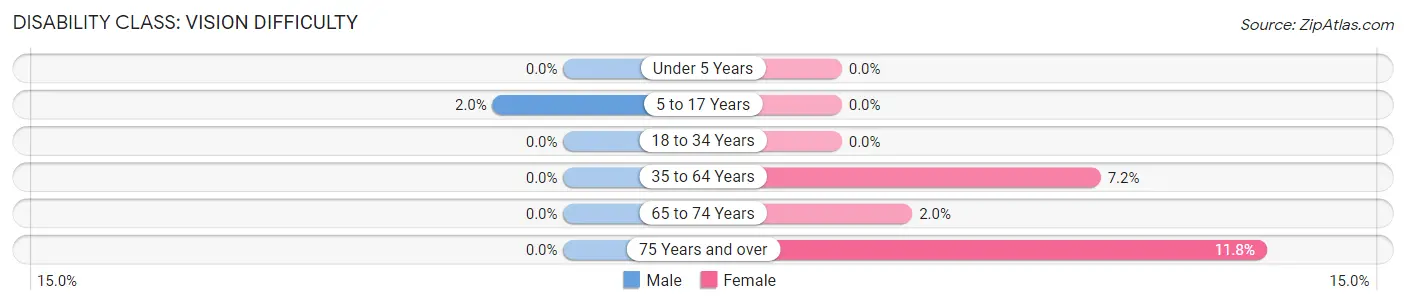
| Age Bracket | Male | Female |
| Under 5 Years | 0 (0.0%) | 0 (0.0%) |
| 5 to 17 Years | 4 (2.0%) | 0 (0.0%) |
| 18 to 34 Years | 0 (0.0%) | 0 (0.0%) |
| 35 to 64 Years | 0 (0.0%) | 23 (7.2%) |
| 65 to 74 Years | 0 (0.0%) | 1 (2.0%) |
| 75 Years and over | 0 (0.0%) | 11 (11.8%) |
Disability Class: Cognitive Difficulty
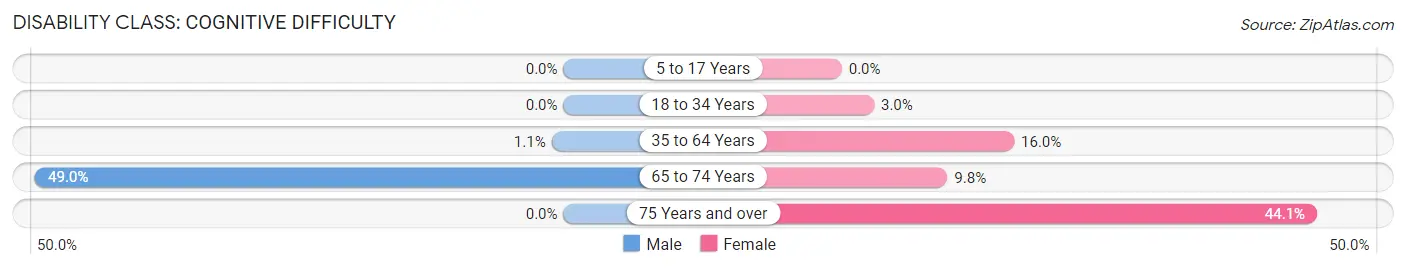
| Age Bracket | Male | Female |
| 5 to 17 Years | 0 (0.0%) | 0 (0.0%) |
| 18 to 34 Years | 0 (0.0%) | 4 (3.0%) |
| 35 to 64 Years | 2 (1.1%) | 51 (16.0%) |
| 65 to 74 Years | 25 (49.0%) | 5 (9.8%) |
| 75 Years and over | 0 (0.0%) | 41 (44.1%) |
Disability Class: Ambulatory Difficulty
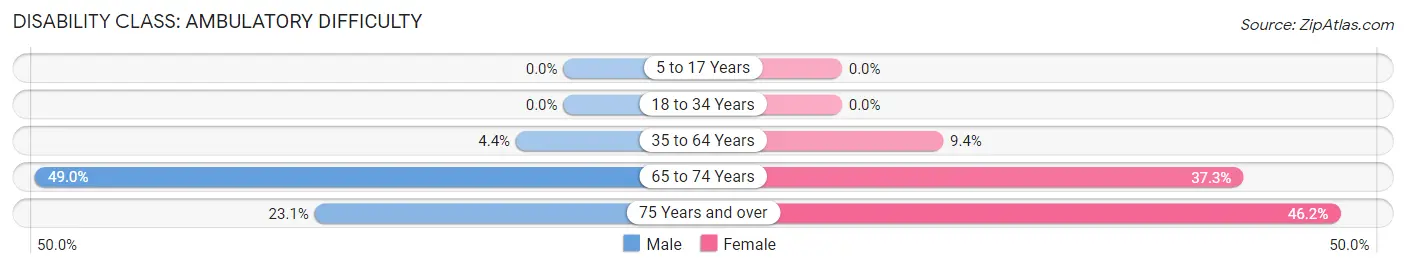
| Age Bracket | Male | Female |
| 5 to 17 Years | 0 (0.0%) | 0 (0.0%) |
| 18 to 34 Years | 0 (0.0%) | 0 (0.0%) |
| 35 to 64 Years | 8 (4.4%) | 30 (9.4%) |
| 65 to 74 Years | 25 (49.0%) | 19 (37.2%) |
| 75 Years and over | 12 (23.1%) | 43 (46.2%) |
Disability Class: Self-Care Difficulty
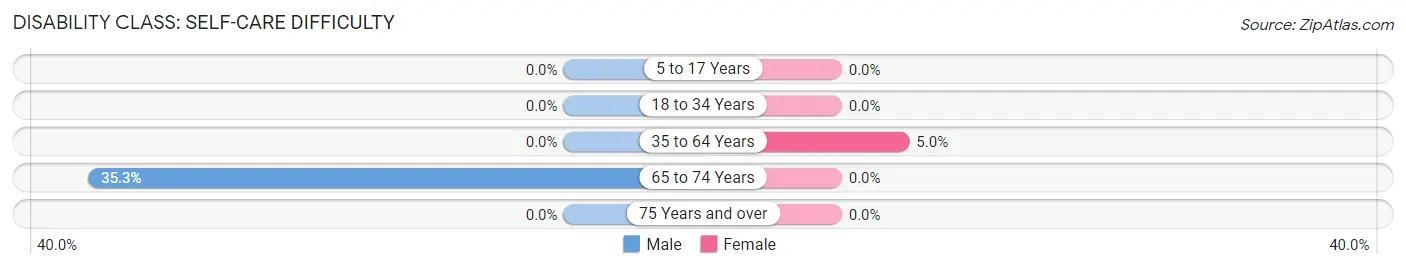
| Age Bracket | Male | Female |
| 5 to 17 Years | 0 (0.0%) | 0 (0.0%) |
| 18 to 34 Years | 0 (0.0%) | 0 (0.0%) |
| 35 to 64 Years | 0 (0.0%) | 16 (5.0%) |
| 65 to 74 Years | 18 (35.3%) | 0 (0.0%) |
| 75 Years and over | 0 (0.0%) | 0 (0.0%) |
Technology Access in Syracuse
Computing Device Access in Syracuse
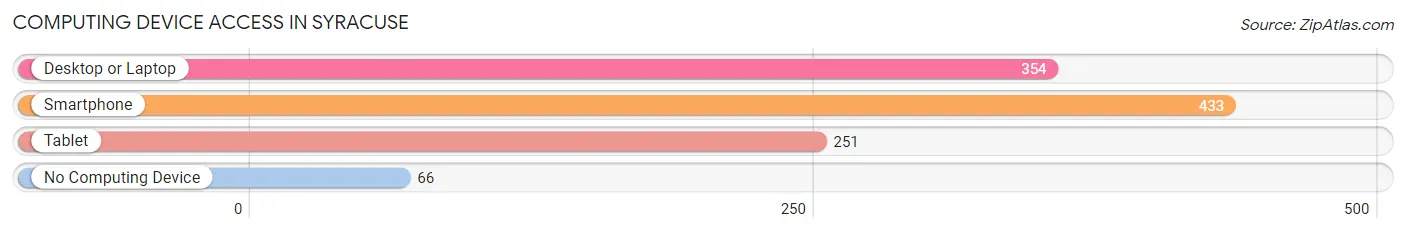
| Device Type | # Households | % Households |
| Desktop or Laptop | 354 | 66.8% |
| Smartphone | 433 | 81.7% |
| Tablet | 251 | 47.4% |
| No Computing Device | 66 | 12.4% |
| Total | 530 | 100.0% |
Internet Access in Syracuse
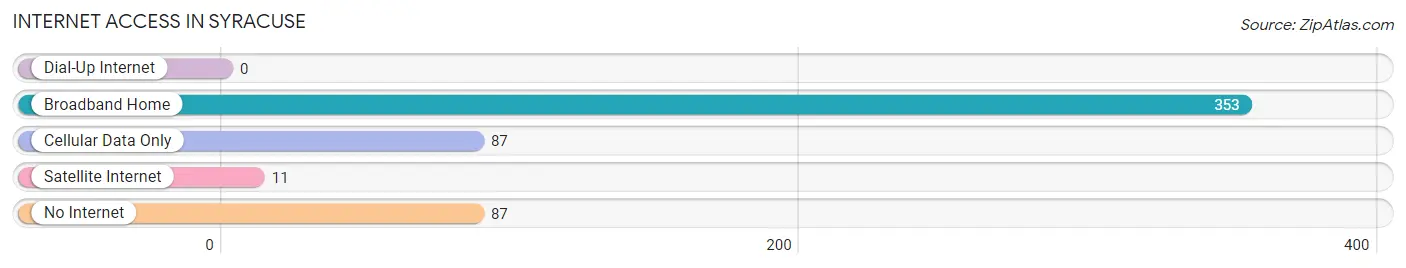
| Internet Type | # Households | % Households |
| Dial-Up Internet | 0 | 0.0% |
| Broadband Home | 353 | 66.6% |
| Cellular Data Only | 87 | 16.4% |
| Satellite Internet | 11 | 2.1% |
| No Internet | 87 | 16.4% |
| Total | 530 | 100.0% |
Syracuse Summary
Syracuse is a small city located in Hamilton County, Kansas, United States. It is situated on the banks of the Arkansas River, approximately 25 miles south of the Kansas-Oklahoma border. The city has a population of 1,845 as of the 2010 census.
History
Syracuse was founded in 1887 by a group of settlers from Syracuse, New York. The city was named after the original city in New York, and the settlers brought with them many of the same traditions and customs. The first post office was established in 1887, and the city was incorporated in 1891.
The city was originally a farming community, but it soon developed into a small manufacturing center. The first industry in Syracuse was a flour mill, which was built in 1891. Other industries soon followed, including a brickyard, a creamery, a canning factory, and a furniture factory.
The city experienced a period of growth in the early 20th century, and by the 1920s, it had become a thriving community. The city was home to several churches, a bank, a newspaper, and a variety of businesses.
Geography
Syracuse is located at 37°14'N, 95°45'W (37.23, -95.75). It is situated on the banks of the Arkansas River, approximately 25 miles south of the Kansas-Oklahoma border. The city has a total area of 1.2 square miles, all of which is land.
The climate in Syracuse is characterized by hot, humid summers and cold, dry winters. The average annual temperature is 61°F, and the average annual precipitation is 33 inches.
Economy
Syracuse is a small city with a limited economy. The city's main industries are agriculture and manufacturing. The city is home to several small businesses, including a grocery store, a hardware store, and a restaurant.
The city is also home to a number of small manufacturing companies, including a furniture factory, a canning factory, and a brickyard. The city is also home to a number of agricultural businesses, including a dairy farm and a grain elevator.
Demographics
As of the 2010 census, there were 1,845 people, 745 households, and 486 families residing in the city. The population density was 1,527.3 people per square mile. The racial makeup of the city was 95.2% White, 0.7% African American, 0.4% Native American, 0.2% Asian, 0.1% Pacific Islander, 1.2% from other races, and 2.2% from two or more races. Hispanic or Latino of any race were 3.2% of the population.
The median income for a household in the city was $31,250, and the median income for a family was $37,500. The per capita income for the city was $15,945. About 16.2% of families and 19.2% of the population were below the poverty line, including 25.2% of those under age 18 and 11.2% of those age 65 or over.
Common Questions
What is Per Capita Income in Syracuse?
Per Capita income in Syracuse is $25,078.
What is the Median Family Income in Syracuse?
Median Family Income in Syracuse is $68,523.
What is the Median Household income in Syracuse?
Median Household Income in Syracuse is $52,143.
What is Income or Wage Gap in Syracuse?
Income or Wage Gap in Syracuse is 25.9%.
Women in Syracuse earn 74.1 cents for every dollar earned by a man.
What is Inequality or Gini Index in Syracuse?
Inequality or Gini Index in Syracuse is 0.37.
What is the Total Population of Syracuse?
Total Population of Syracuse is 1,511.
What is the Total Male Population of Syracuse?
Total Male Population of Syracuse is 675.
What is the Total Female Population of Syracuse?
Total Female Population of Syracuse is 836.
What is the Ratio of Males per 100 Females in Syracuse?
There are 80.74 Males per 100 Females in Syracuse.
What is the Ratio of Females per 100 Males in Syracuse?
There are 123.85 Females per 100 Males in Syracuse.
What is the Median Population Age in Syracuse?
Median Population Age in Syracuse is 34.8 Years.
What is the Average Family Size in Syracuse
Average Family Size in Syracuse is 3.8 People.
What is the Average Household Size in Syracuse
Average Household Size in Syracuse is 2.8 People.
How Large is the Labor Force in Syracuse?
There are 647 People in the Labor Forcein in Syracuse.
What is the Percentage of People in the Labor Force in Syracuse?
57.9% of People are in the Labor Force in Syracuse.