Sun City, KS Map & Demographics
Sun City Map
Sun City Overview
$25,292
PER CAPITA INCOME
$52,344
AVG FAMILY INCOME
$52,344
AVG HOUSEHOLD INCOME
58.8%
WAGE / INCOME GAP [ % ]
41.2¢/ $1
WAGE / INCOME GAP [ $ ]
0.19
INEQUALITY / GINI INDEX
52
TOTAL POPULATION
32
MALE POPULATION
20
FEMALE POPULATION
160.00
MALES / 100 FEMALES
62.50
FEMALES / 100 MALES
49.0
MEDIAN AGE
2.9
AVG FAMILY SIZE
2.7
AVG HOUSEHOLD SIZE
21
LABOR FORCE [ PEOPLE ]
50.0%
PERCENT IN LABOR FORCE
Sun City Zip Codes
Sun City Area Codes
Income in Sun City
Income Overview in Sun City
Per Capita Income in Sun City is $25,292, while median incomes of families and households are $52,344 and $52,344 respectively.
| Characteristic | Number | Measure |
| Per Capita Income | 52 | $25,292 |
| Median Family Income | 17 | $52,344 |
| Mean Family Income | 17 | $64,976 |
| Median Household Income | 19 | $52,344 |
| Mean Household Income | 19 | $62,842 |
| Income Deficit | 17 | $0 |
| Wage / Income Gap (%) | 52 | 58.79% |
| Wage / Income Gap ($) | 52 | 41.21¢ per $1 |
| Gini / Inequality Index | 52 | 0.19 |
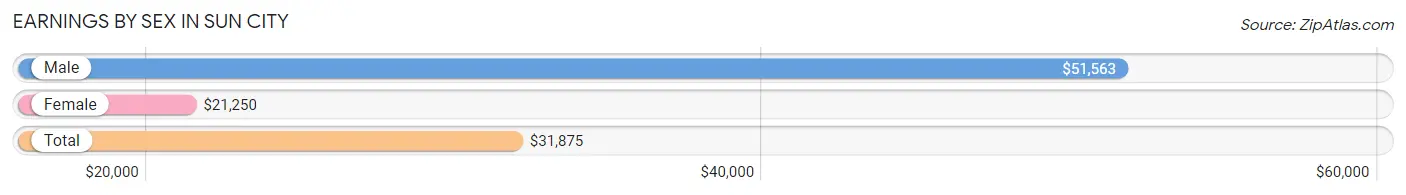
Earnings by Sex in Sun City
Average Earnings in Sun City are $31,875, $51,563 for men and $21,250 for women, a difference of 58.8%.
| Sex | Number | Average Earnings |
| Male | 13 (48.1%) | $51,563 |
| Female | 14 (51.8%) | $21,250 |
| Total | 27 (100.0%) | $31,875 |
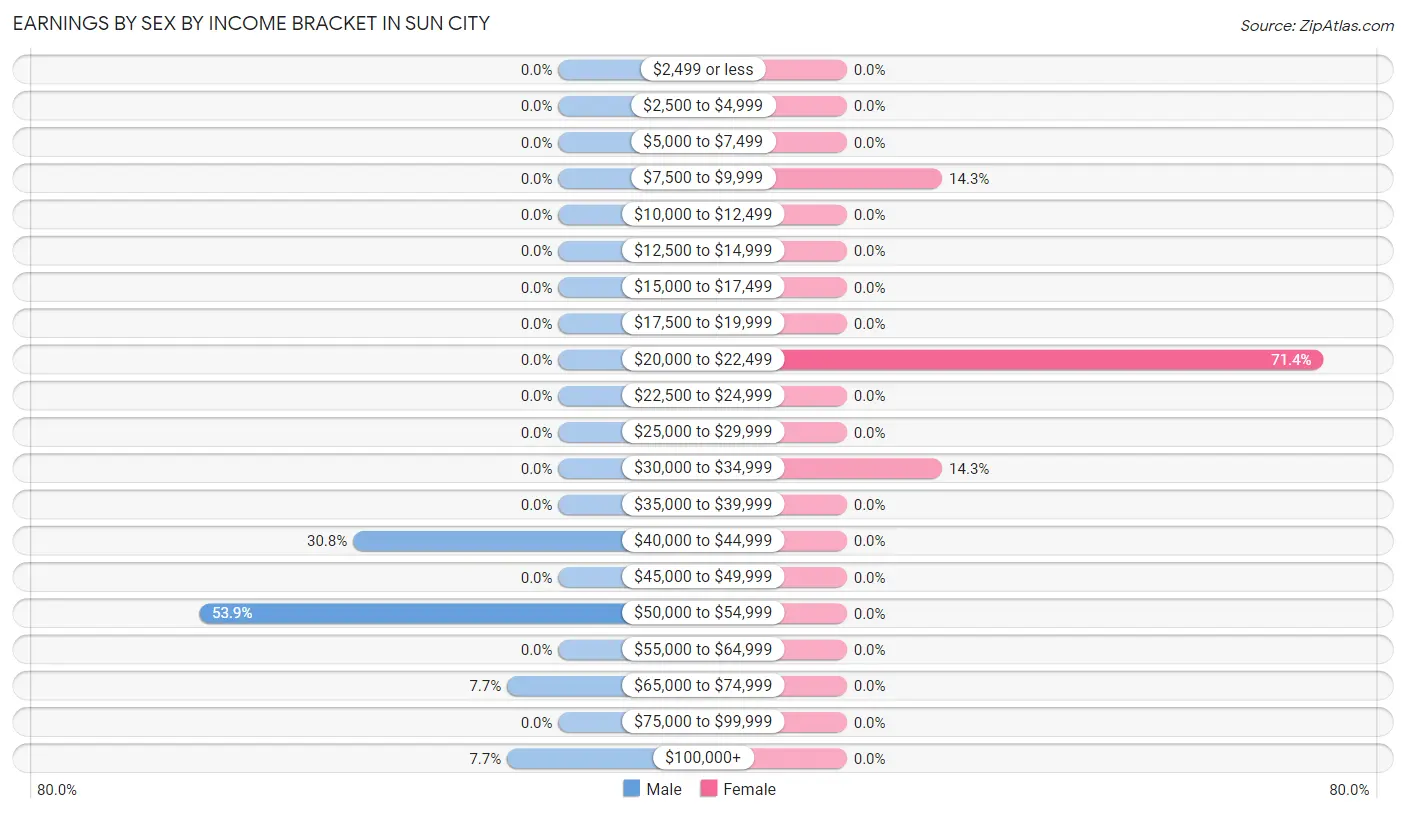
Earnings by Sex by Income Bracket in Sun City
The most common earnings brackets in Sun City are $50,000 to $54,999 for men (7 | 53.8%) and $20,000 to $22,499 for women (10 | 71.4%).
| Income | Male | Female |
| $2,499 or less | 0 (0.0%) | 0 (0.0%) |
| $2,500 to $4,999 | 0 (0.0%) | 0 (0.0%) |
| $5,000 to $7,499 | 0 (0.0%) | 0 (0.0%) |
| $7,500 to $9,999 | 0 (0.0%) | 2 (14.3%) |
| $10,000 to $12,499 | 0 (0.0%) | 0 (0.0%) |
| $12,500 to $14,999 | 0 (0.0%) | 0 (0.0%) |
| $15,000 to $17,499 | 0 (0.0%) | 0 (0.0%) |
| $17,500 to $19,999 | 0 (0.0%) | 0 (0.0%) |
| $20,000 to $22,499 | 0 (0.0%) | 10 (71.4%) |
| $22,500 to $24,999 | 0 (0.0%) | 0 (0.0%) |
| $25,000 to $29,999 | 0 (0.0%) | 0 (0.0%) |
| $30,000 to $34,999 | 0 (0.0%) | 2 (14.3%) |
| $35,000 to $39,999 | 0 (0.0%) | 0 (0.0%) |
| $40,000 to $44,999 | 4 (30.8%) | 0 (0.0%) |
| $45,000 to $49,999 | 0 (0.0%) | 0 (0.0%) |
| $50,000 to $54,999 | 7 (53.8%) | 0 (0.0%) |
| $55,000 to $64,999 | 0 (0.0%) | 0 (0.0%) |
| $65,000 to $74,999 | 1 (7.7%) | 0 (0.0%) |
| $75,000 to $99,999 | 0 (0.0%) | 0 (0.0%) |
| $100,000+ | 1 (7.7%) | 0 (0.0%) |
| Total | 13 (100.0%) | 14 (100.0%) |
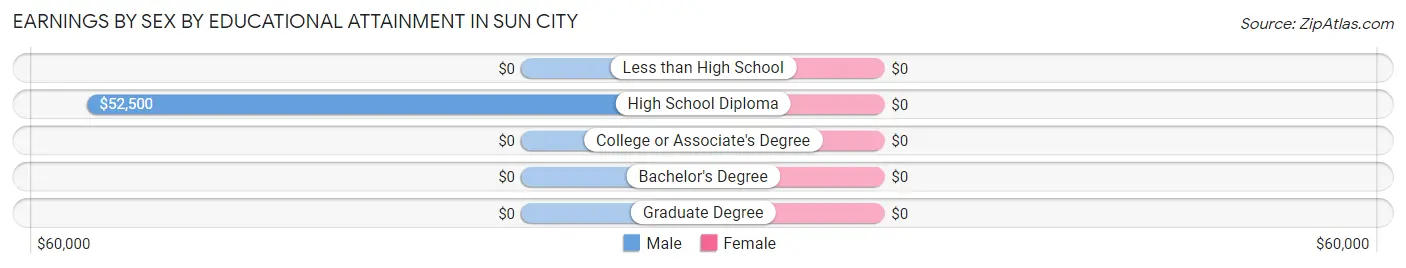
Earnings by Sex by Educational Attainment in Sun City
| Educational Attainment | Male Income | Female Income |
| Less than High School | - | - |
| High School Diploma | $52,500 | $0 |
| College or Associate's Degree | - | - |
| Bachelor's Degree | - | - |
| Graduate Degree | - | - |
| Total | $51,563 | $21,250 |
Family Income in Sun City
Family Income Brackets in Sun City
According to the Sun City family income data, there are 13 families falling into the $50,000 to $74,999 income range, which is the most common income bracket and makes up 76.5% of all families.
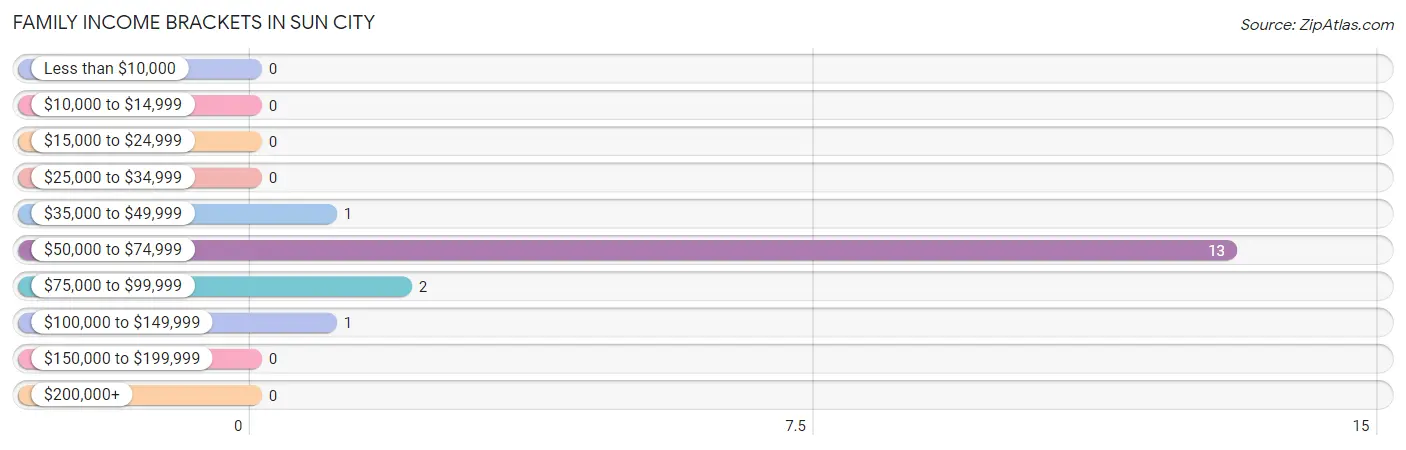
| Income Bracket | # Families | % Families |
| Less than $10,000 | 0 | 0.0% |
| $10,000 to $14,999 | 0 | 0.0% |
| $15,000 to $24,999 | 0 | 0.0% |
| $25,000 to $34,999 | 0 | 0.0% |
| $35,000 to $49,999 | 1 | 5.9% |
| $50,000 to $74,999 | 13 | 76.5% |
| $75,000 to $99,999 | 2 | 11.8% |
| $100,000 to $149,999 | 1 | 5.9% |
| $150,000 to $199,999 | 0 | 0.0% |
| $200,000+ | 0 | 0.0% |
Family Income by Famaliy Size in Sun City
2-person families (13 | 76.5%) account for the highest median family income in Sun City with $52,292 per family, while 2-person families (13 | 76.5%) have the highest median income of $26,146 per family member.
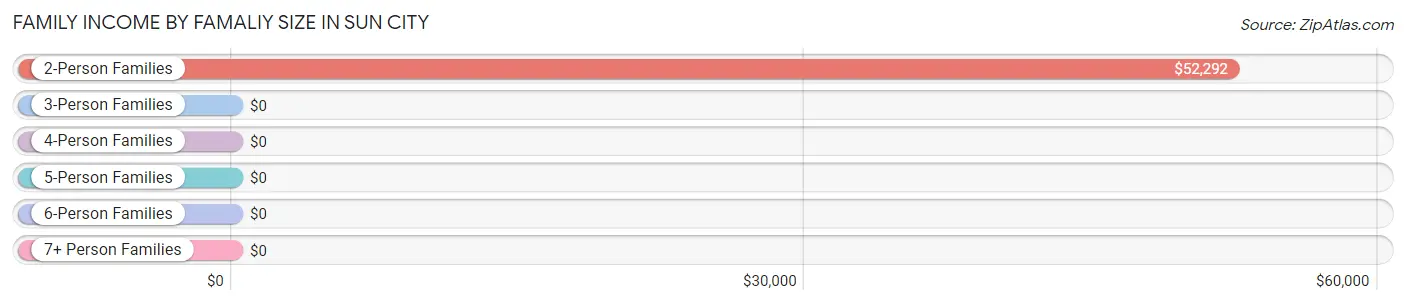
| Income Bracket | # Families | Median Income |
| 2-Person Families | 13 (76.5%) | $52,292 |
| 3-Person Families | 0 (0.0%) | $0 |
| 4-Person Families | 4 (23.5%) | $0 |
| 5-Person Families | 0 (0.0%) | $0 |
| 6-Person Families | 0 (0.0%) | $0 |
| 7+ Person Families | 0 (0.0%) | $0 |
| Total | 17 (100.0%) | $52,344 |
Family Income by Number of Earners in Sun City
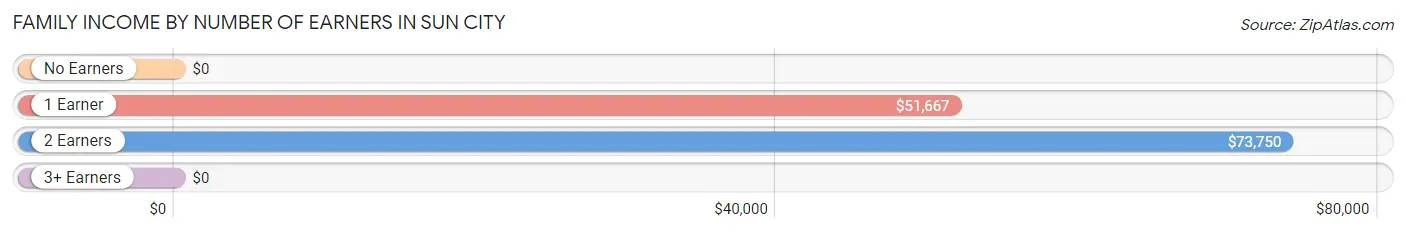
| Number of Earners | # Families | Median Income |
| No Earners | 1 (5.9%) | $0 |
| 1 Earner | 8 (47.1%) | $51,667 |
| 2 Earners | 8 (47.1%) | $73,750 |
| 3+ Earners | 0 (0.0%) | $0 |
| Total | 17 (100.0%) | $52,344 |
Household Income in Sun City
Household Income Brackets in Sun City
With 14 households falling in the category, the $50,000 to $74,999 income range is the most frequent in Sun City, accounting for 73.7% of all households.
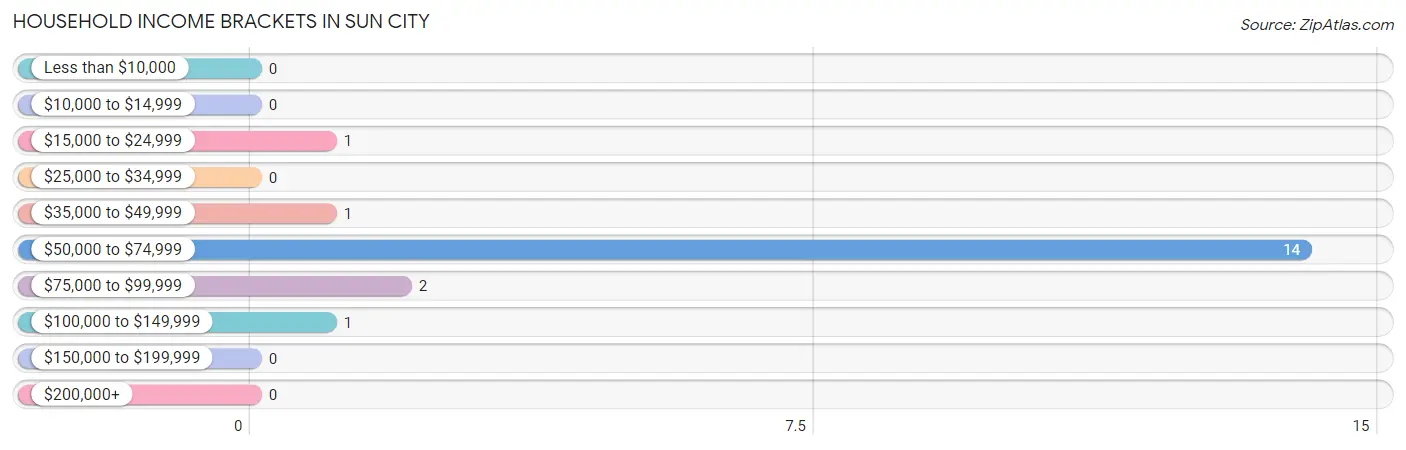
| Income Bracket | # Households | % Households |
| Less than $10,000 | 0 | 0.0% |
| $10,000 to $14,999 | 0 | 0.0% |
| $15,000 to $24,999 | 1 | 5.3% |
| $25,000 to $34,999 | 0 | 0.0% |
| $35,000 to $49,999 | 1 | 5.3% |
| $50,000 to $74,999 | 14 | 73.7% |
| $75,000 to $99,999 | 2 | 10.5% |
| $100,000 to $149,999 | 1 | 5.3% |
| $150,000 to $199,999 | 0 | 0.0% |
| $200,000+ | 0 | 0.0% |
Household Income by Householder Age in Sun City
The median household income in Sun City is $52,344, with the highest median household income of $73,438 found in the 45 to 64 years age bracket for the primary householder. A total of 7 households (36.8%) fall into this category.
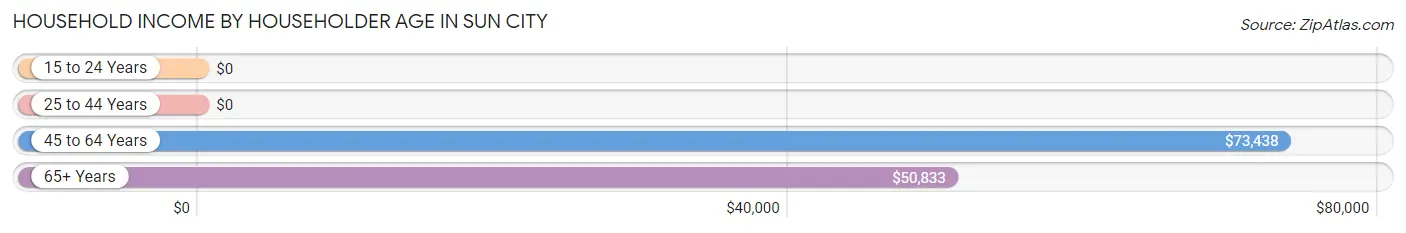
| Income Bracket | # Households | Median Income |
| 15 to 24 Years | 0 (0.0%) | $0 |
| 25 to 44 Years | 4 (21.0%) | $0 |
| 45 to 64 Years | 7 (36.8%) | $73,438 |
| 65+ Years | 8 (42.1%) | $50,833 |
| Total | 19 (100.0%) | $52,344 |
Poverty in Sun City
Income Below Poverty by Sex and Age in Sun City
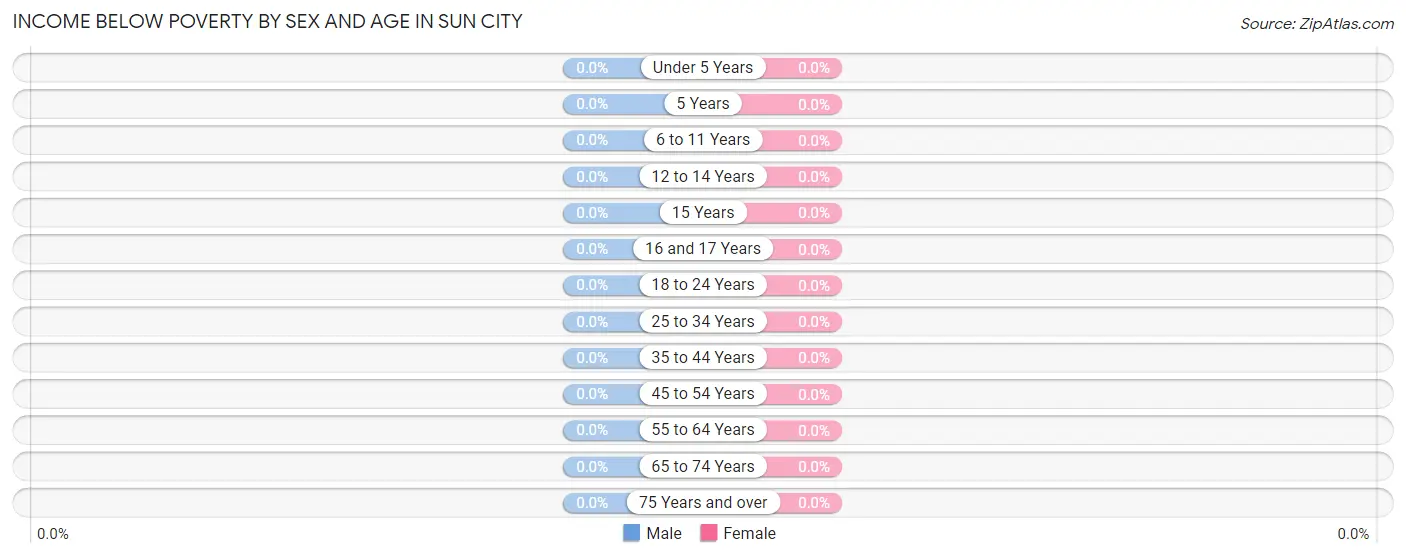
| Age Bracket | Male | Female |
| Under 5 Years | 0 (0.0%) | 0 (0.0%) |
| 5 Years | 0 (0.0%) | 0 (0.0%) |
| 6 to 11 Years | 0 (0.0%) | 0 (0.0%) |
| 12 to 14 Years | 0 (0.0%) | 0 (0.0%) |
| 15 Years | 0 (0.0%) | 0 (0.0%) |
| 16 and 17 Years | 0 (0.0%) | 0 (0.0%) |
| 18 to 24 Years | 0 (0.0%) | 0 (0.0%) |
| 25 to 34 Years | 0 (0.0%) | 0 (0.0%) |
| 35 to 44 Years | 0 (0.0%) | 0 (0.0%) |
| 45 to 54 Years | 0 (0.0%) | 0 (0.0%) |
| 55 to 64 Years | 0 (0.0%) | 0 (0.0%) |
| 65 to 74 Years | 0 (0.0%) | 0 (0.0%) |
| 75 Years and over | 0 (0.0%) | 0 (0.0%) |
| Total | 0 (0.0%) | 0 (0.0%) |
Income Above Poverty by Sex and Age in Sun City
According to the poverty statistics in Sun City, males aged 6 to 11 years and females aged 6 to 11 years are the age groups that are most secure financially, with 100.0% of males and 100.0% of females in these age groups living above the poverty line.
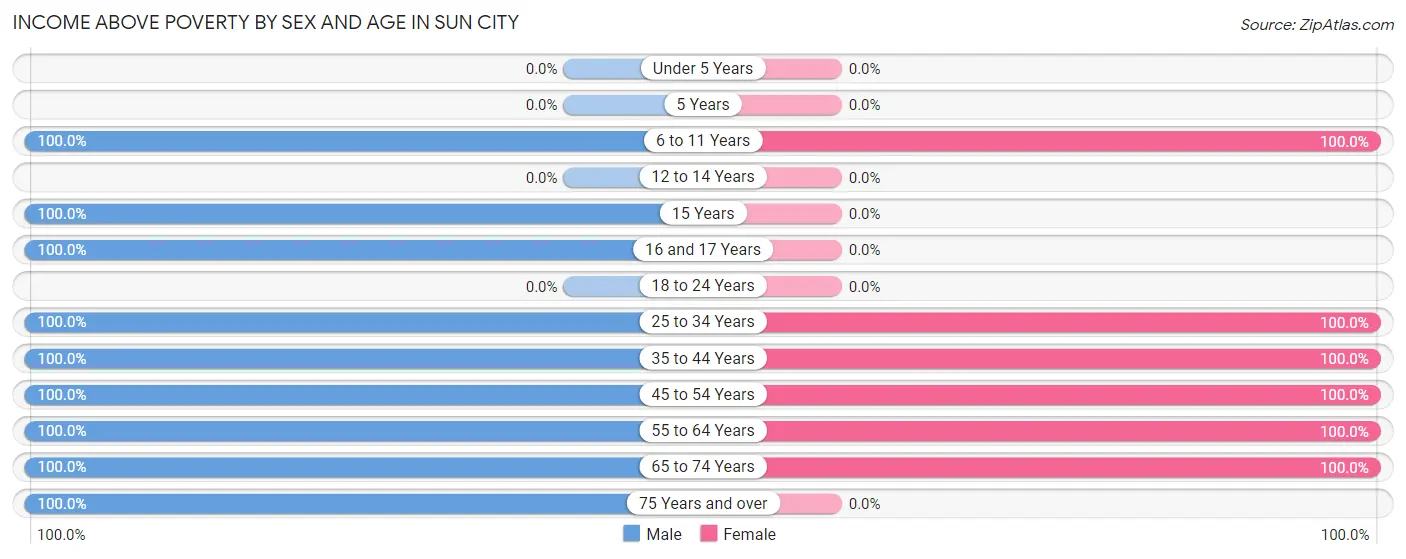
| Age Bracket | Male | Female |
| Under 5 Years | 0 (0.0%) | 0 (0.0%) |
| 5 Years | 0 (0.0%) | 0 (0.0%) |
| 6 to 11 Years | 5 (100.0%) | 3 (100.0%) |
| 12 to 14 Years | 0 (0.0%) | 0 (0.0%) |
| 15 Years | 2 (100.0%) | 0 (0.0%) |
| 16 and 17 Years | 2 (100.0%) | 0 (0.0%) |
| 18 to 24 Years | 0 (0.0%) | 0 (0.0%) |
| 25 to 34 Years | 4 (100.0%) | 2 (100.0%) |
| 35 to 44 Years | 2 (100.0%) | 2 (100.0%) |
| 45 to 54 Years | 5 (100.0%) | 4 (100.0%) |
| 55 to 64 Years | 2 (100.0%) | 2 (100.0%) |
| 65 to 74 Years | 9 (100.0%) | 7 (100.0%) |
| 75 Years and over | 1 (100.0%) | 0 (0.0%) |
| Total | 32 (100.0%) | 20 (100.0%) |
Income Below Poverty Among Married-Couple Families in Sun City
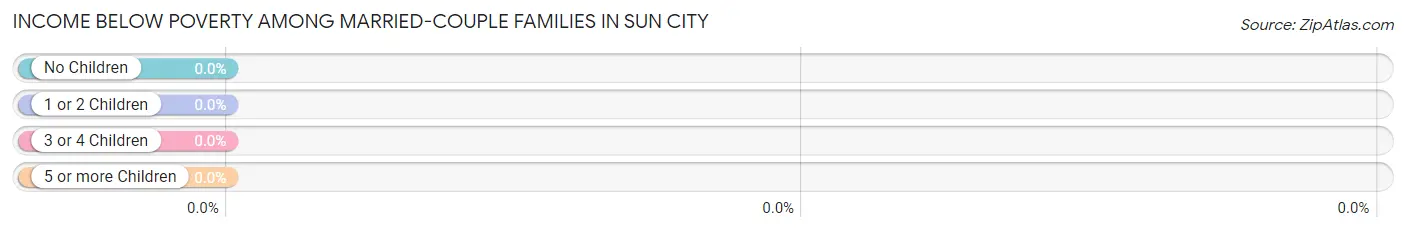
| Children | Above Poverty | Below Poverty |
| No Children | 13 (100.0%) | 0 (0.0%) |
| 1 or 2 Children | 4 (100.0%) | 0 (0.0%) |
| 3 or 4 Children | 0 (0.0%) | 0 (0.0%) |
| 5 or more Children | 0 (0.0%) | 0 (0.0%) |
| Total | 17 (100.0%) | 0 (0.0%) |
Income Below Poverty Among Single-Parent Households in Sun City
| Children | Single Father | Single Mother |
| No Children | 0 (0.0%) | 0 (0.0%) |
| 1 or 2 Children | 0 (0.0%) | 0 (0.0%) |
| 3 or 4 Children | 0 (0.0%) | 0 (0.0%) |
| 5 or more Children | 0 (0.0%) | 0 (0.0%) |
| Total | 0 (0.0%) | 0 (0.0%) |
Income Below Poverty Among Married-Couple vs Single-Parent Households in Sun City
| Children | Married-Couple Families | Single-Parent Households |
| No Children | 0 (0.0%) | 0 (0.0%) |
| 1 or 2 Children | 0 (0.0%) | 0 (0.0%) |
| 3 or 4 Children | 0 (0.0%) | 0 (0.0%) |
| 5 or more Children | 0 (0.0%) | 0 (0.0%) |
| Total | 0 (0.0%) | 0 (0.0%) |
Race in Sun City
The most populous races in Sun City are White / Caucasian (50 | 96.2%), Hispanic or Latino (5 | 9.6%), and Native / Alaskan (1 | 1.9%).
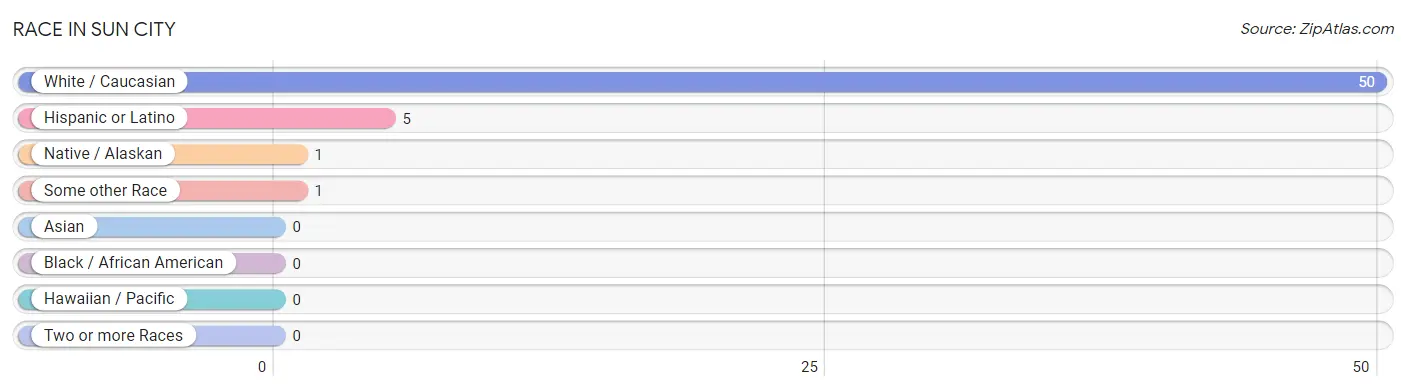
| Race | # Population | % Population |
| Asian | 0 | 0.0% |
| Black / African American | 0 | 0.0% |
| Hawaiian / Pacific | 0 | 0.0% |
| Hispanic or Latino | 5 | 9.6% |
| Native / Alaskan | 1 | 1.9% |
| White / Caucasian | 50 | 96.2% |
| Two or more Races | 0 | 0.0% |
| Some other Race | 1 | 1.9% |
| Total | 52 | 100.0% |
Ancestry in Sun City
The most populous ancestries reported in Sun City are German (17 | 32.7%), Irish (8 | 15.4%), American (7 | 13.5%), Swedish (6 | 11.5%), and Mexican (5 | 9.6%), together accounting for 82.7% of all Sun City residents.
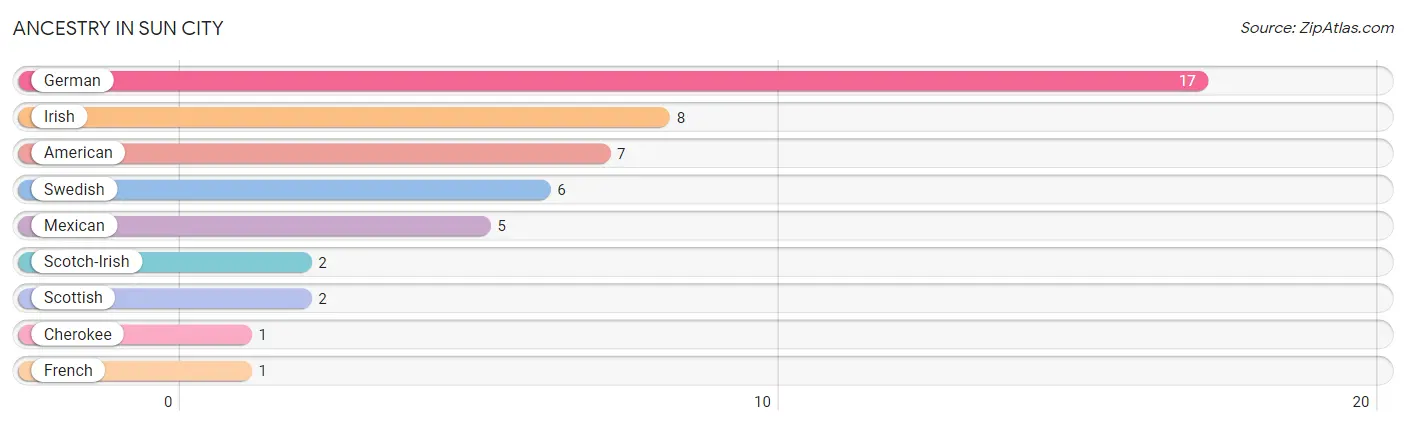
| Ancestry | # Population | % Population |
| American | 7 | 13.5% |
| Cherokee | 1 | 1.9% |
| French | 1 | 1.9% |
| German | 17 | 32.7% |
| Irish | 8 | 15.4% |
| Mexican | 5 | 9.6% |
| Scotch-Irish | 2 | 3.8% |
| Scottish | 2 | 3.8% |
| Swedish | 6 | 11.5% | View All 9 Rows |
Immigrants in Sun City

| Immigration Origin | # Population | % Population | View All 0 Rows |
Sex and Age in Sun City
Sex and Age in Sun City
The most populous age groups in Sun City are 65 to 69 Years (8 | 25.0%) for men and 70 to 74 Years (7 | 35.0%) for women.
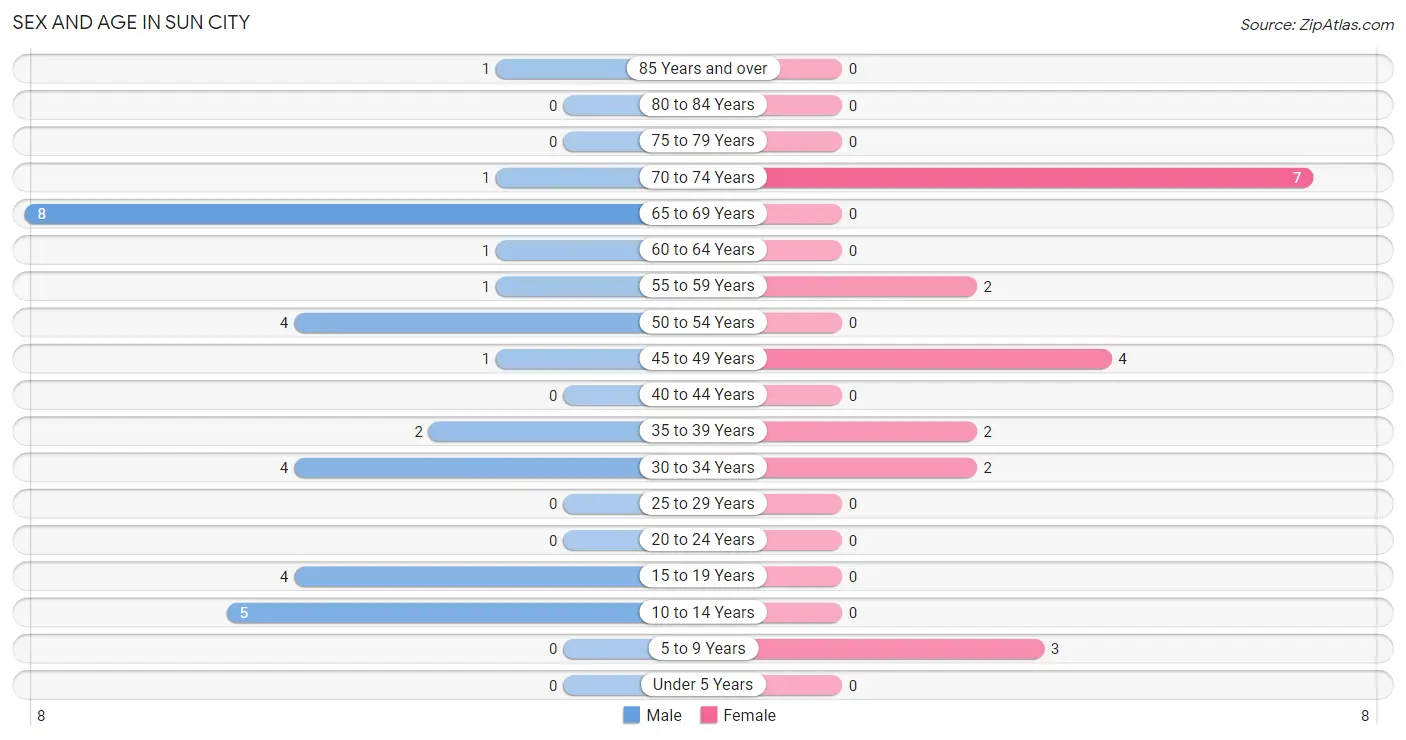
| Age Bracket | Male | Female |
| Under 5 Years | 0 (0.0%) | 0 (0.0%) |
| 5 to 9 Years | 0 (0.0%) | 3 (15.0%) |
| 10 to 14 Years | 5 (15.6%) | 0 (0.0%) |
| 15 to 19 Years | 4 (12.5%) | 0 (0.0%) |
| 20 to 24 Years | 0 (0.0%) | 0 (0.0%) |
| 25 to 29 Years | 0 (0.0%) | 0 (0.0%) |
| 30 to 34 Years | 4 (12.5%) | 2 (10.0%) |
| 35 to 39 Years | 2 (6.2%) | 2 (10.0%) |
| 40 to 44 Years | 0 (0.0%) | 0 (0.0%) |
| 45 to 49 Years | 1 (3.1%) | 4 (20.0%) |
| 50 to 54 Years | 4 (12.5%) | 0 (0.0%) |
| 55 to 59 Years | 1 (3.1%) | 2 (10.0%) |
| 60 to 64 Years | 1 (3.1%) | 0 (0.0%) |
| 65 to 69 Years | 8 (25.0%) | 0 (0.0%) |
| 70 to 74 Years | 1 (3.1%) | 7 (35.0%) |
| 75 to 79 Years | 0 (0.0%) | 0 (0.0%) |
| 80 to 84 Years | 0 (0.0%) | 0 (0.0%) |
| 85 Years and over | 1 (3.1%) | 0 (0.0%) |
| Total | 32 (100.0%) | 20 (100.0%) |
Families and Households in Sun City
Median Family Size in Sun City
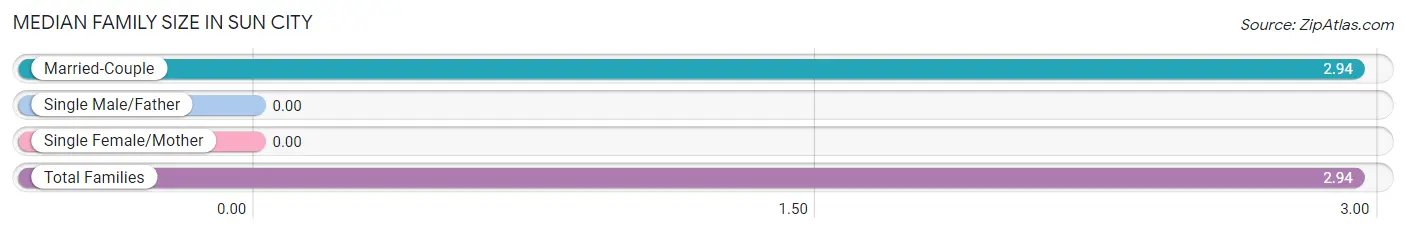
| Family Type | # Families | Family Size |
| Married-Couple | 17 (100.0%) | 2.94 |
| Single Male/Father | 0 (0.0%) | - |
| Single Female/Mother | 0 (0.0%) | - |
| Total Families | 17 (100.0%) | 2.94 |
Median Household Size in Sun City
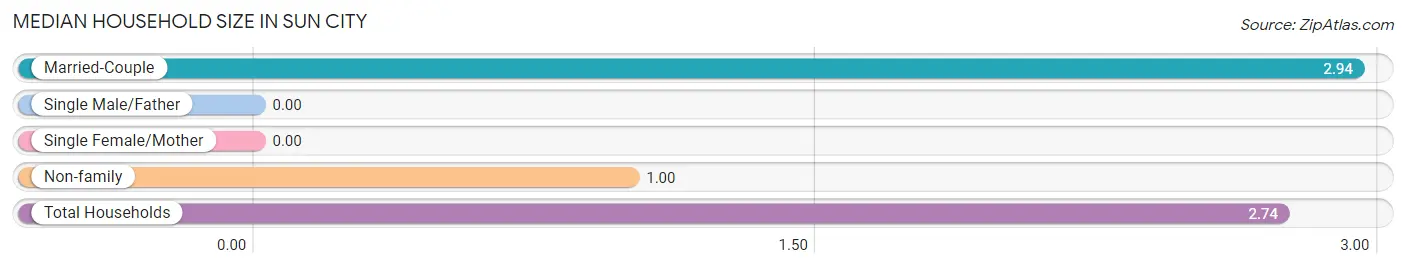
| Household Type | # Households | Household Size |
| Married-Couple | 17 (89.5%) | 2.94 |
| Single Male/Father | 0 (0.0%) | - |
| Single Female/Mother | 0 (0.0%) | - |
| Non-family | 2 (10.5%) | 1.00 |
| Total Households | 19 (100.0%) | 2.74 |
Household Size by Marriage Status in Sun City
Out of a total of 19 households in Sun City, 17 (89.5%) are family households, while 2 (10.5%) are nonfamily households. The most numerous type of family households are 2-person households, comprising 13, and the most common type of nonfamily households are 1-person households, comprising 2.
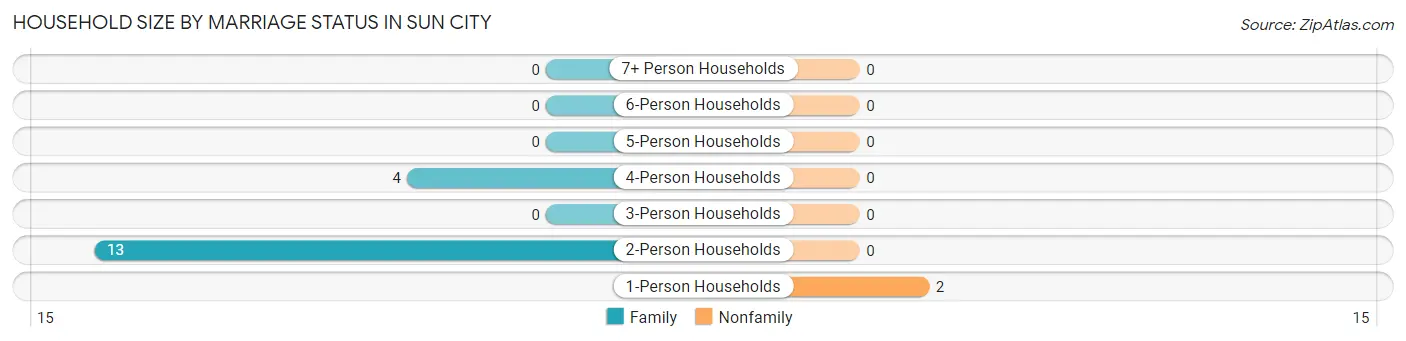
| Household Size | Family Households | Nonfamily Households |
| 1-Person Households | - | 2 (10.5%) |
| 2-Person Households | 13 (68.4%) | 0 (0.0%) |
| 3-Person Households | 0 (0.0%) | 0 (0.0%) |
| 4-Person Households | 4 (21.0%) | 0 (0.0%) |
| 5-Person Households | 0 (0.0%) | 0 (0.0%) |
| 6-Person Households | 0 (0.0%) | 0 (0.0%) |
| 7+ Person Households | 0 (0.0%) | 0 (0.0%) |
| Total | 17 (89.5%) | 2 (10.5%) |
Female Fertility in Sun City
Fertility by Age in Sun City
| Age Bracket | Women with Births | Births / 1,000 Women |
| 15 to 19 years | 0 (0.0%) | 0.0 |
| 20 to 34 years | 0 (0.0%) | 0.0 |
| 35 to 50 years | 0 (0.0%) | 0.0 |
| Total | 0 (0.0%) | 0.0 |
Fertility by Age by Marriage Status in Sun City
| Age Bracket | Married | Unmarried |
| 15 to 19 years | 0 (0.0%) | 0 (0.0%) |
| 20 to 34 years | 0 (0.0%) | 0 (0.0%) |
| 35 to 50 years | 0 (0.0%) | 0 (0.0%) |
| Total | 0 (0.0%) | 0 (0.0%) |
Fertility by Education in Sun City
| Educational Attainment | Women with Births | Births / 1,000 Women |
| Less than High School | 0 (0.0%) | 0.0 |
| High School Diploma | 0 (0.0%) | 0.0 |
| College or Associate's Degree | 0 (0.0%) | 0.0 |
| Bachelor's Degree | 0 (0.0%) | 0.0 |
| Graduate Degree | 0 (0.0%) | 0.0 |
| Total | 0 (0.0%) | 0.0 |
Fertility by Education by Marriage Status in Sun City
| Educational Attainment | Married | Unmarried |
| Less than High School | 0 (0.0%) | 0 (0.0%) |
| High School Diploma | 0 (0.0%) | 0 (0.0%) |
| College or Associate's Degree | 0 (0.0%) | 0 (0.0%) |
| Bachelor's Degree | 0 (0.0%) | 0 (0.0%) |
| Graduate Degree | 0 (0.0%) | 0 (0.0%) |
| Total | 0 (0.0%) | 0 (0.0%) |
Employment Characteristics in Sun City
Employment by Class of Employer in Sun City
Among the 19 employed individuals in Sun City, self-employed (not incorporated) (8 | 42.1%), private company employees (7 | 36.8%), and local government employees (4 | 21.0%) make up the most common classes of employment.
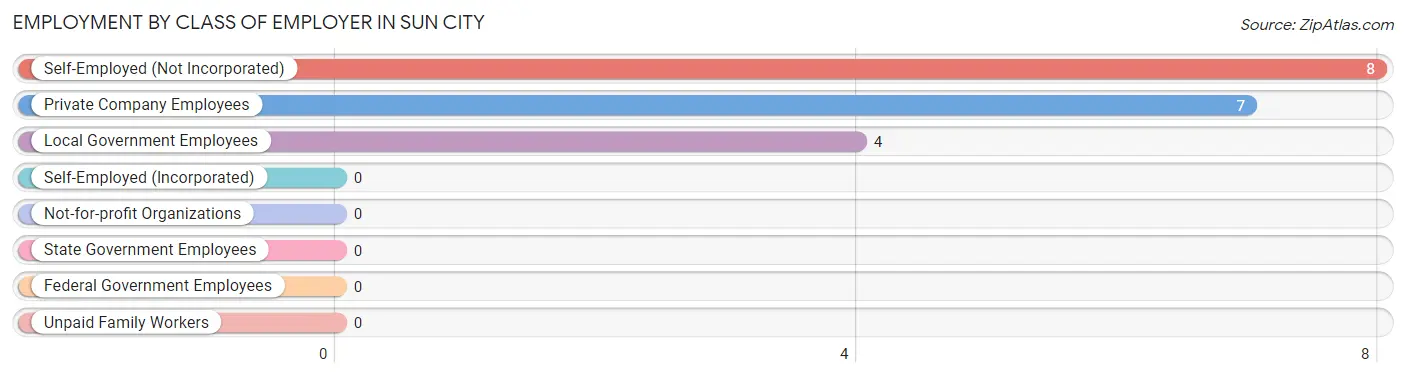
| Employer Class | # Employees | % Employees |
| Private Company Employees | 7 | 36.8% |
| Self-Employed (Incorporated) | 0 | 0.0% |
| Self-Employed (Not Incorporated) | 8 | 42.1% |
| Not-for-profit Organizations | 0 | 0.0% |
| Local Government Employees | 4 | 21.0% |
| State Government Employees | 0 | 0.0% |
| Federal Government Employees | 0 | 0.0% |
| Unpaid Family Workers | 0 | 0.0% |
| Total | 19 | 100.0% |
Employment Status by Age in Sun City
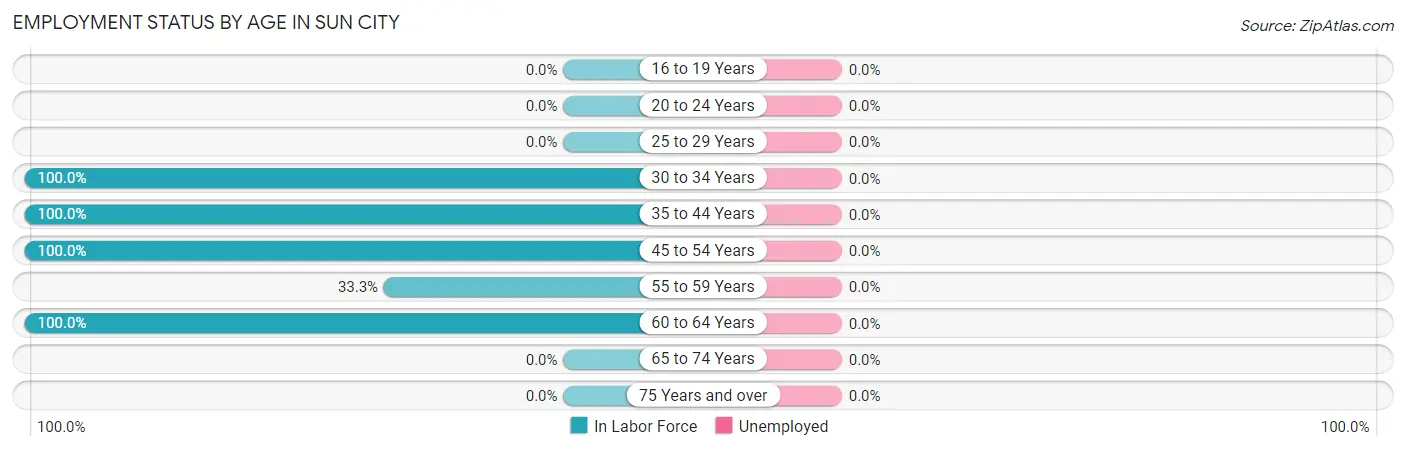
| Age Bracket | In Labor Force | Unemployed |
| 16 to 19 Years | 0 (0.0%) | 0 (0.0%) |
| 20 to 24 Years | 0 (0.0%) | 0 (0.0%) |
| 25 to 29 Years | 0 (0.0%) | 0 (0.0%) |
| 30 to 34 Years | 6 (100.0%) | 0 (0.0%) |
| 35 to 44 Years | 4 (100.0%) | 0 (0.0%) |
| 45 to 54 Years | 9 (100.0%) | 0 (0.0%) |
| 55 to 59 Years | 1 (33.3%) | 0 (0.0%) |
| 60 to 64 Years | 1 (100.0%) | 0 (0.0%) |
| 65 to 74 Years | 0 (0.0%) | 0 (0.0%) |
| 75 Years and over | 0 (0.0%) | 0 (0.0%) |
| Total | 21 (50.0%) | 0 (0.0%) |
Employment Status by Educational Attainment in Sun City
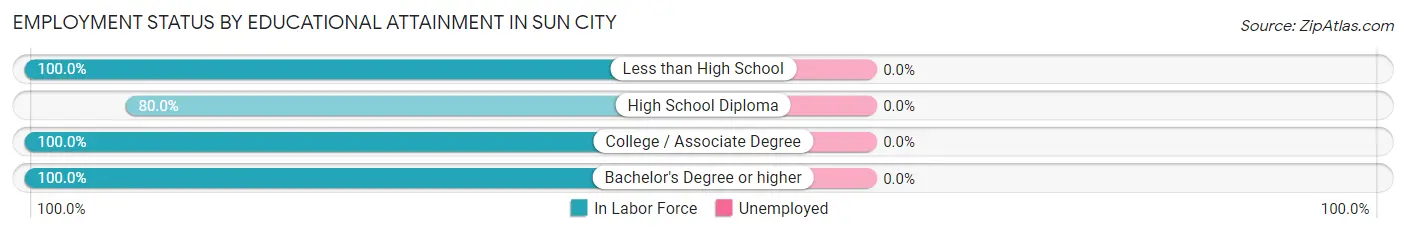
| Educational Attainment | In Labor Force | Unemployed |
| Less than High School | 4 (100.0%) | 0 (0.0%) |
| High School Diploma | 8 (80.0%) | 0 (0.0%) |
| College / Associate Degree | 6 (100.0%) | 0 (0.0%) |
| Bachelor's Degree or higher | 3 (100.0%) | 0 (0.0%) |
| Total | 21 (91.3%) | 0 (0.0%) |
Employment Occupations by Sex in Sun City
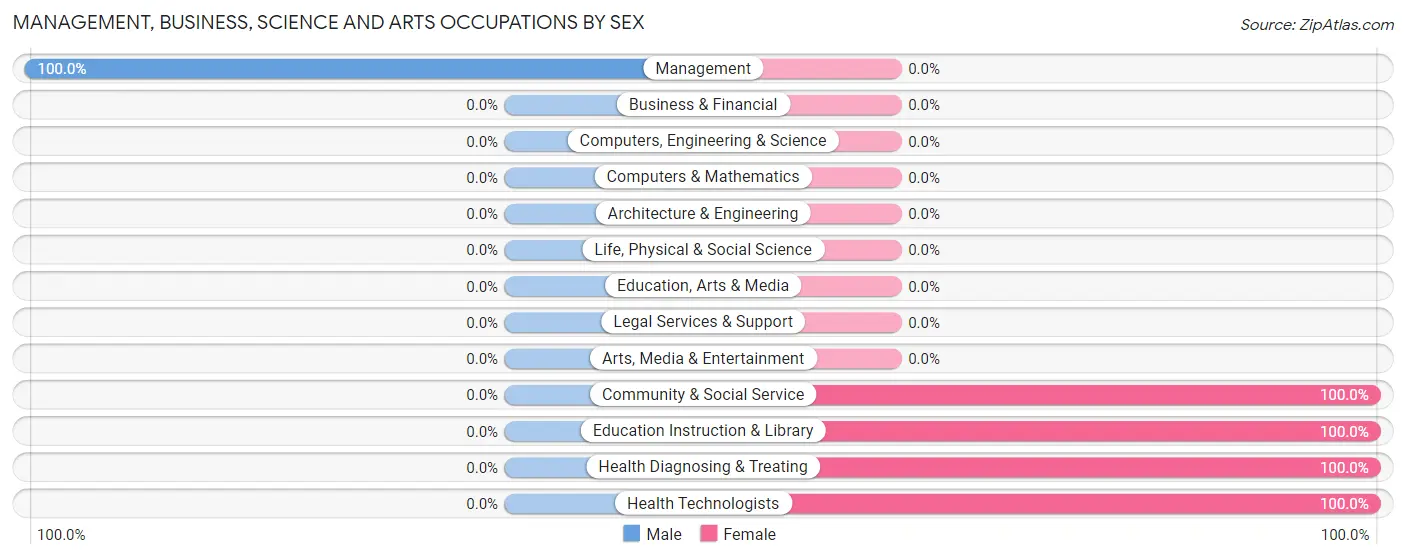
Management, Business, Science and Arts Occupations
The most common Management, Business, Science and Arts occupations in Sun City are Community & Social Service (2 | 9.5%), Education Instruction & Library (2 | 9.5%), Health Diagnosing & Treating (2 | 9.5%), Health Technologists (2 | 9.5%), and Management (1 | 4.8%).
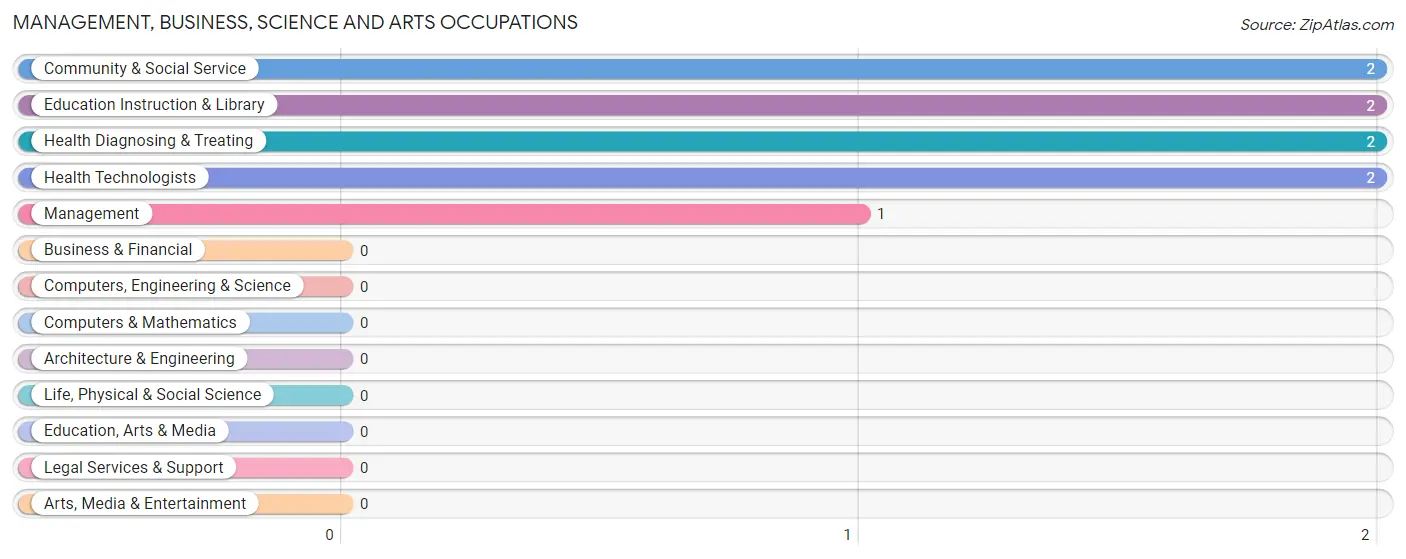
Management, Business, Science and Arts Occupations by Sex
| Occupation | Male | Female |
| Management | 1 (100.0%) | 0 (0.0%) |
| Business & Financial | 0 (0.0%) | 0 (0.0%) |
| Computers, Engineering & Science | 0 (0.0%) | 0 (0.0%) |
| Computers & Mathematics | 0 (0.0%) | 0 (0.0%) |
| Architecture & Engineering | 0 (0.0%) | 0 (0.0%) |
| Life, Physical & Social Science | 0 (0.0%) | 0 (0.0%) |
| Community & Social Service | 0 (0.0%) | 2 (100.0%) |
| Education, Arts & Media | 0 (0.0%) | 0 (0.0%) |
| Legal Services & Support | 0 (0.0%) | 0 (0.0%) |
| Education Instruction & Library | 0 (0.0%) | 2 (100.0%) |
| Arts, Media & Entertainment | 0 (0.0%) | 0 (0.0%) |
| Health Diagnosing & Treating | 0 (0.0%) | 2 (100.0%) |
| Health Technologists | 0 (0.0%) | 2 (100.0%) |
| Total (Category) | 1 (20.0%) | 4 (80.0%) |
| Total (Overall) | 13 (61.9%) | 8 (38.1%) |
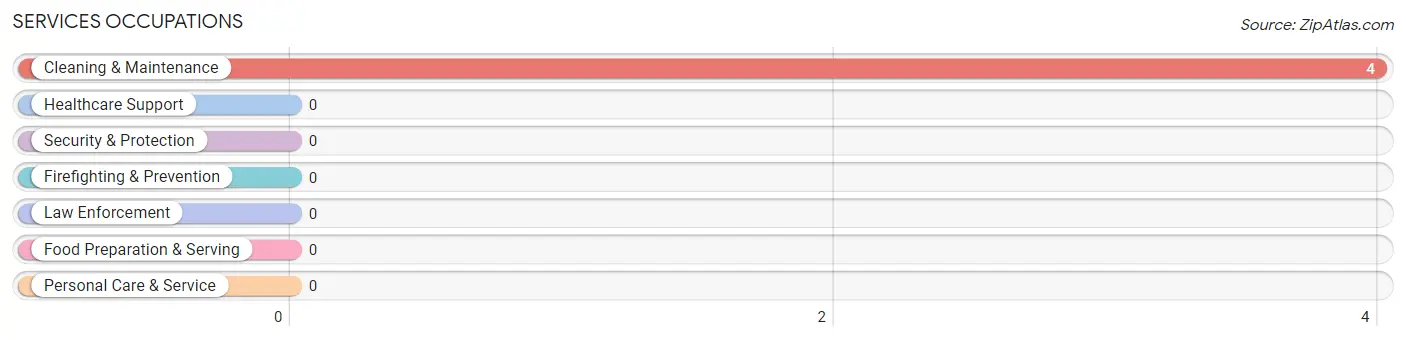
Services Occupations
The most common Services occupations in Sun City are , and Cleaning & Maintenance (4 | 19.1%).
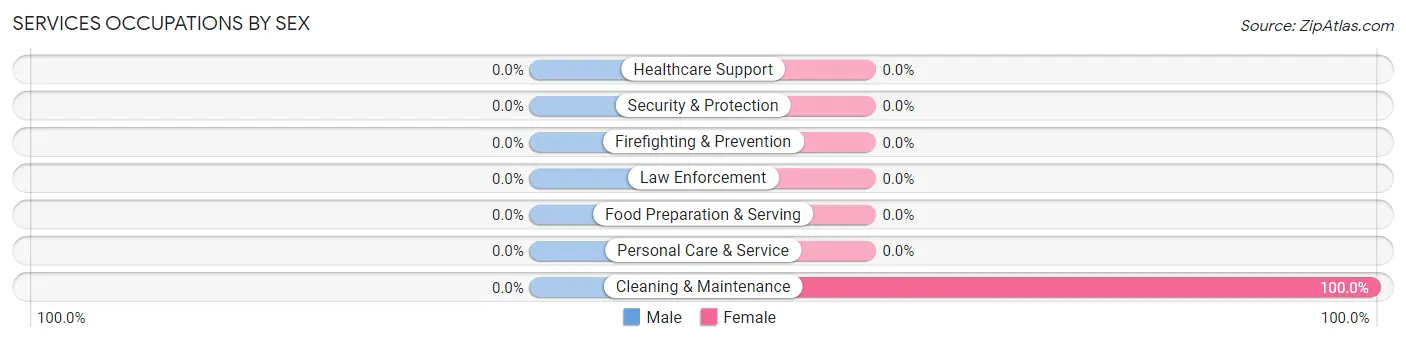
Services Occupations by Sex
| Occupation | Male | Female |
| Healthcare Support | 0 (0.0%) | 0 (0.0%) |
| Security & Protection | 0 (0.0%) | 0 (0.0%) |
| Firefighting & Prevention | 0 (0.0%) | 0 (0.0%) |
| Law Enforcement | 0 (0.0%) | 0 (0.0%) |
| Food Preparation & Serving | 0 (0.0%) | 0 (0.0%) |
| Cleaning & Maintenance | 0 (0.0%) | 4 (100.0%) |
| Personal Care & Service | 0 (0.0%) | 0 (0.0%) |
| Total (Category) | 0 (0.0%) | 4 (100.0%) |
| Total (Overall) | 13 (61.9%) | 8 (38.1%) |
Sales and Office Occupations
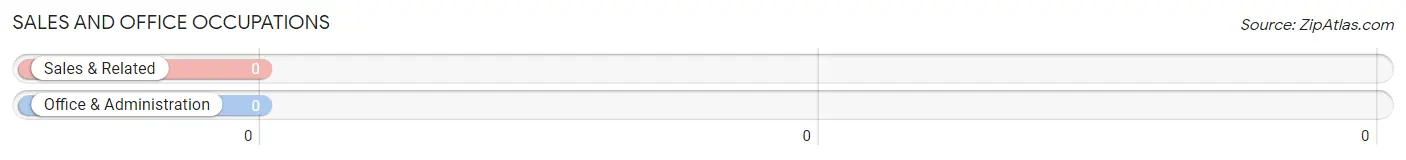
Sales and Office Occupations by Sex
| Occupation | Male | Female |
| Sales & Related | 0 (0.0%) | 0 (0.0%) |
| Office & Administration | 0 (0.0%) | 0 (0.0%) |
| Total (Category) | 0 (0.0%) | 0 (0.0%) |
| Total (Overall) | 13 (61.9%) | 8 (38.1%) |
Natural Resources, Construction and Maintenance Occupations
The most common Natural Resources, Construction and Maintenance occupations in Sun City are , and Construction & Extraction (9 | 42.9%).
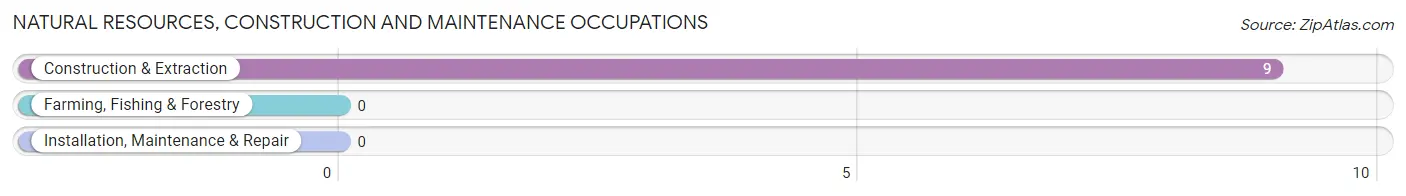
Natural Resources, Construction and Maintenance Occupations by Sex
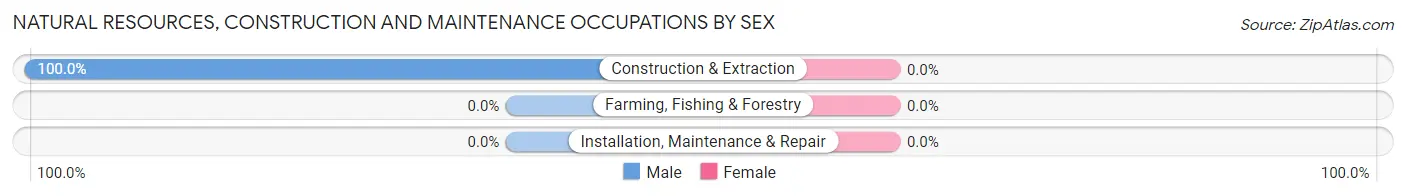
| Occupation | Male | Female |
| Farming, Fishing & Forestry | 0 (0.0%) | 0 (0.0%) |
| Construction & Extraction | 9 (100.0%) | 0 (0.0%) |
| Installation, Maintenance & Repair | 0 (0.0%) | 0 (0.0%) |
| Total (Category) | 9 (100.0%) | 0 (0.0%) |
| Total (Overall) | 13 (61.9%) | 8 (38.1%) |
Production, Transportation and Moving Occupations
The most common Production, Transportation and Moving occupations in Sun City are Transportation (2 | 9.5%), and Material Moving (1 | 4.8%).
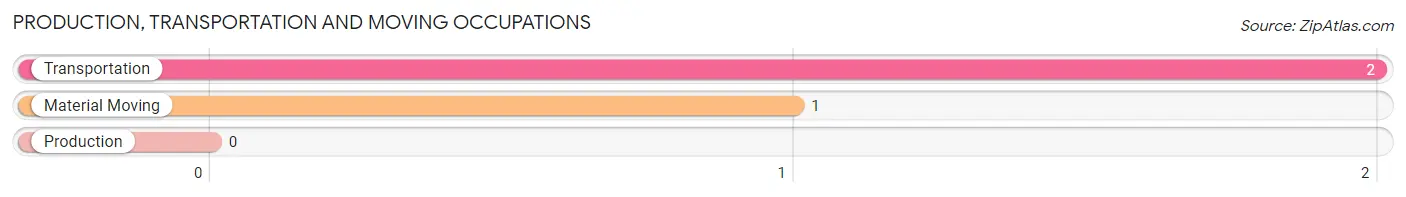
Production, Transportation and Moving Occupations by Sex
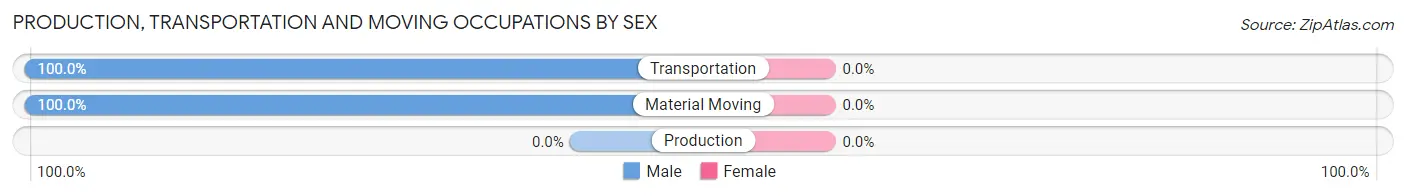
| Occupation | Male | Female |
| Production | 0 (0.0%) | 0 (0.0%) |
| Transportation | 2 (100.0%) | 0 (0.0%) |
| Material Moving | 1 (100.0%) | 0 (0.0%) |
| Total (Category) | 3 (100.0%) | 0 (0.0%) |
| Total (Overall) | 13 (61.9%) | 8 (38.1%) |
Employment Industries by Sex in Sun City
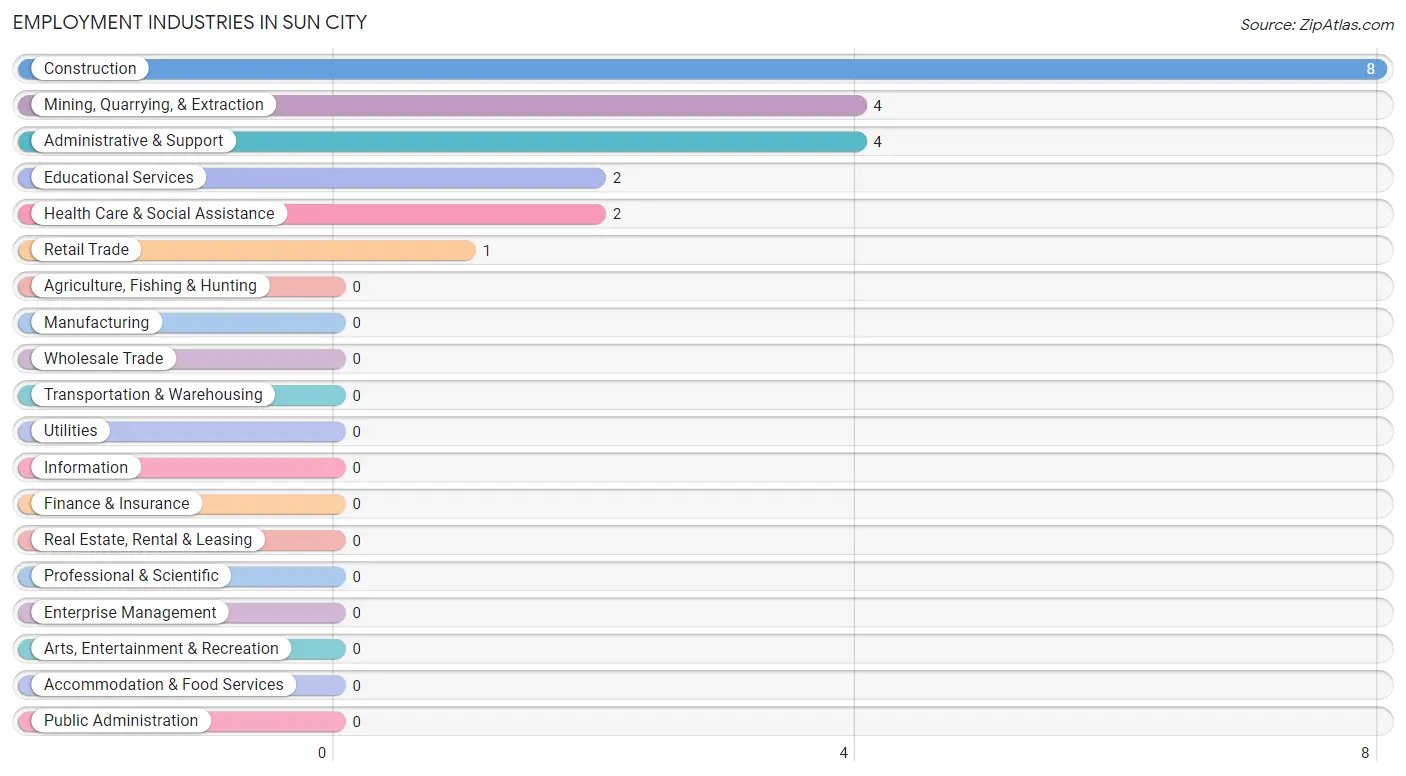
Employment Industries in Sun City
The major employment industries in Sun City include Construction (8 | 38.1%), Mining, Quarrying, & Extraction (4 | 19.1%), Administrative & Support (4 | 19.1%), Educational Services (2 | 9.5%), and Health Care & Social Assistance (2 | 9.5%).
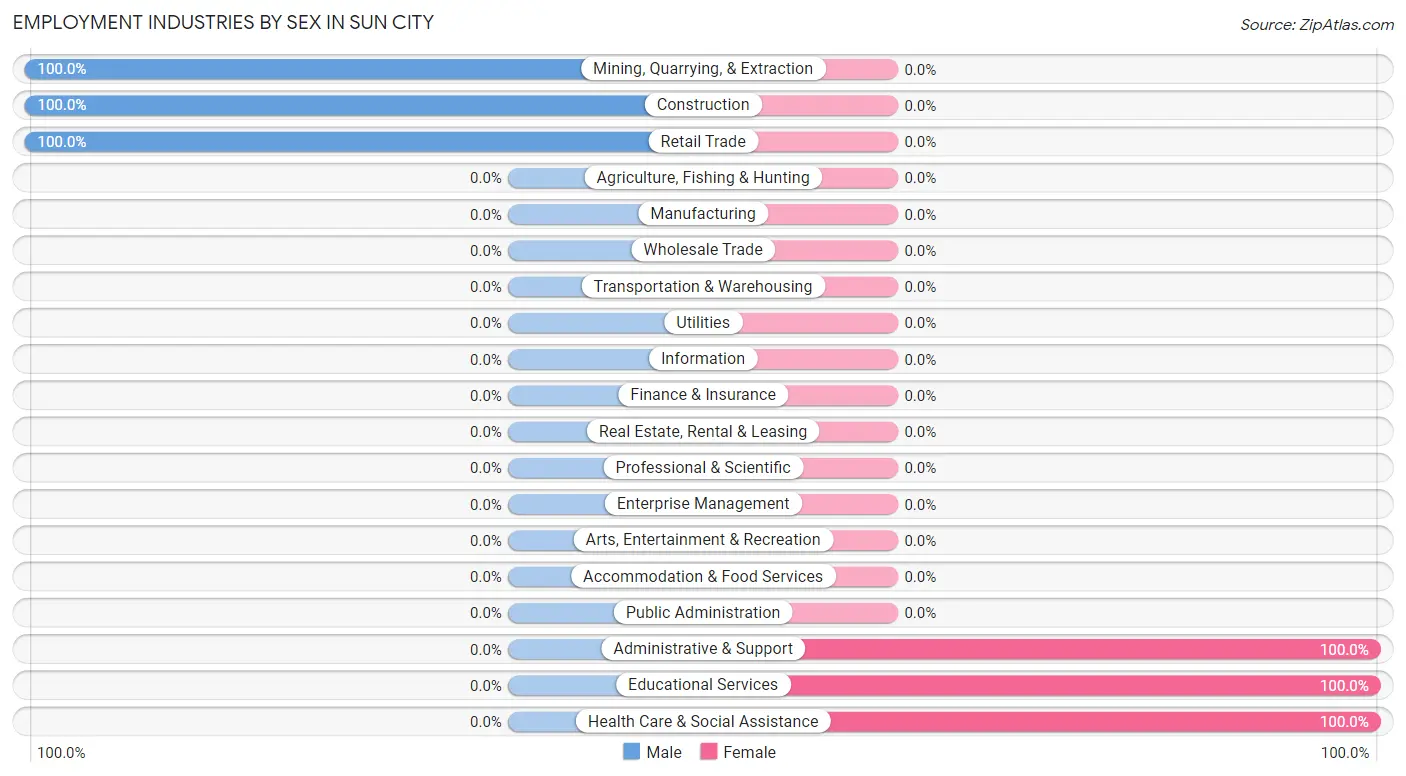
Employment Industries by Sex in Sun City
The Sun City industries that see more men than women are Mining, Quarrying, & Extraction (100.0%), Construction (100.0%), and Retail Trade (100.0%), whereas the industries that tend to have a higher number of women are Administrative & Support (100.0%), Educational Services (100.0%), and Health Care & Social Assistance (100.0%).
| Industry | Male | Female |
| Agriculture, Fishing & Hunting | 0 (0.0%) | 0 (0.0%) |
| Mining, Quarrying, & Extraction | 4 (100.0%) | 0 (0.0%) |
| Construction | 8 (100.0%) | 0 (0.0%) |
| Manufacturing | 0 (0.0%) | 0 (0.0%) |
| Wholesale Trade | 0 (0.0%) | 0 (0.0%) |
| Retail Trade | 1 (100.0%) | 0 (0.0%) |
| Transportation & Warehousing | 0 (0.0%) | 0 (0.0%) |
| Utilities | 0 (0.0%) | 0 (0.0%) |
| Information | 0 (0.0%) | 0 (0.0%) |
| Finance & Insurance | 0 (0.0%) | 0 (0.0%) |
| Real Estate, Rental & Leasing | 0 (0.0%) | 0 (0.0%) |
| Professional & Scientific | 0 (0.0%) | 0 (0.0%) |
| Enterprise Management | 0 (0.0%) | 0 (0.0%) |
| Administrative & Support | 0 (0.0%) | 4 (100.0%) |
| Educational Services | 0 (0.0%) | 2 (100.0%) |
| Health Care & Social Assistance | 0 (0.0%) | 2 (100.0%) |
| Arts, Entertainment & Recreation | 0 (0.0%) | 0 (0.0%) |
| Accommodation & Food Services | 0 (0.0%) | 0 (0.0%) |
| Public Administration | 0 (0.0%) | 0 (0.0%) |
| Total | 13 (61.9%) | 8 (38.1%) |
Education in Sun City
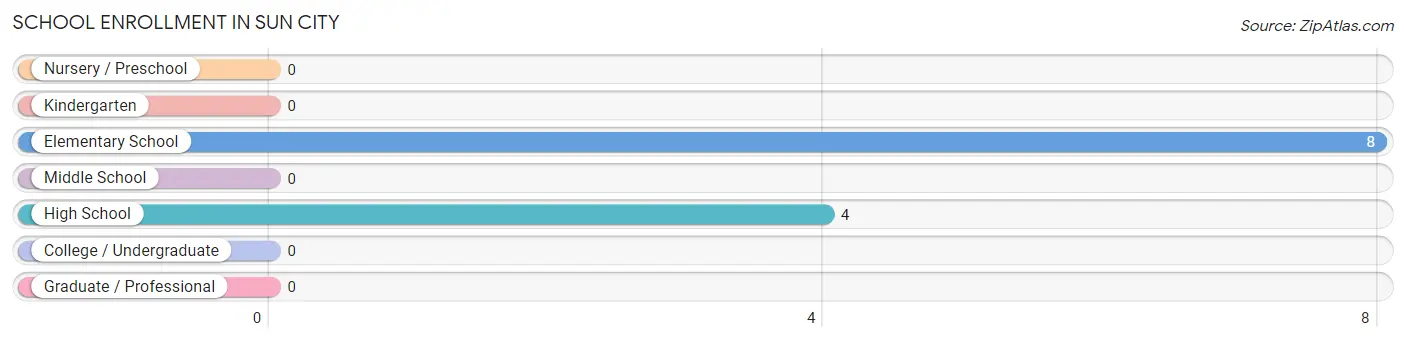
School Enrollment in Sun City
The most common levels of schooling among the 12 students in Sun City are elementary school (8 | 66.7%), and high school (4 | 33.3%).
| School Level | # Students | % Students |
| Nursery / Preschool | 0 | 0.0% |
| Kindergarten | 0 | 0.0% |
| Elementary School | 8 | 66.7% |
| Middle School | 0 | 0.0% |
| High School | 4 | 33.3% |
| College / Undergraduate | 0 | 0.0% |
| Graduate / Professional | 0 | 0.0% |
| Total | 12 | 100.0% |
School Enrollment by Age by Funding Source in Sun City
Out of a total of 12 students who are enrolled in schools in Sun City, 2 (16.7%) attend a private institution, while the remaining 10 (83.3%) are enrolled in public schools. The age group of 15 to 17 year olds has the highest likelihood of being enrolled in private schools, with 2 (50.0% in the age bracket) enrolled. Conversely, the age group of 5 to 9 year old has the lowest likelihood of being enrolled in a private school, with 3 (100.0% in the age bracket) attending a public institution.
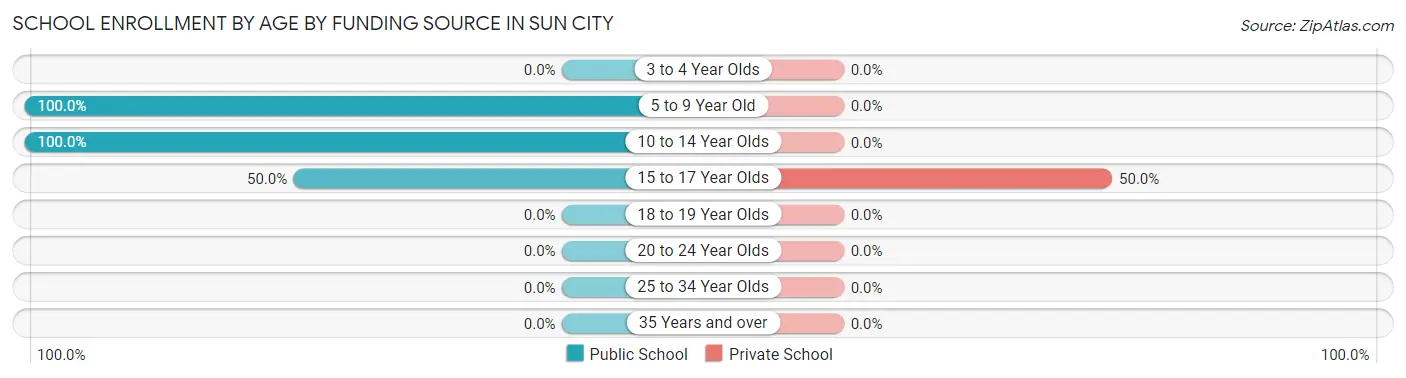
| Age Bracket | Public School | Private School |
| 3 to 4 Year Olds | 0 (0.0%) | 0 (0.0%) |
| 5 to 9 Year Old | 3 (100.0%) | 0 (0.0%) |
| 10 to 14 Year Olds | 5 (100.0%) | 0 (0.0%) |
| 15 to 17 Year Olds | 2 (50.0%) | 2 (50.0%) |
| 18 to 19 Year Olds | 0 (0.0%) | 0 (0.0%) |
| 20 to 24 Year Olds | 0 (0.0%) | 0 (0.0%) |
| 25 to 34 Year Olds | 0 (0.0%) | 0 (0.0%) |
| 35 Years and over | 0 (0.0%) | 0 (0.0%) |
| Total | 10 (83.3%) | 2 (16.7%) |
Educational Attainment by Field of Study in Sun City
Literature & languages (2 | 66.7%), and business (1 | 33.3%) are the most common fields of study among 3 individuals in Sun City who have obtained a bachelor's degree or higher.
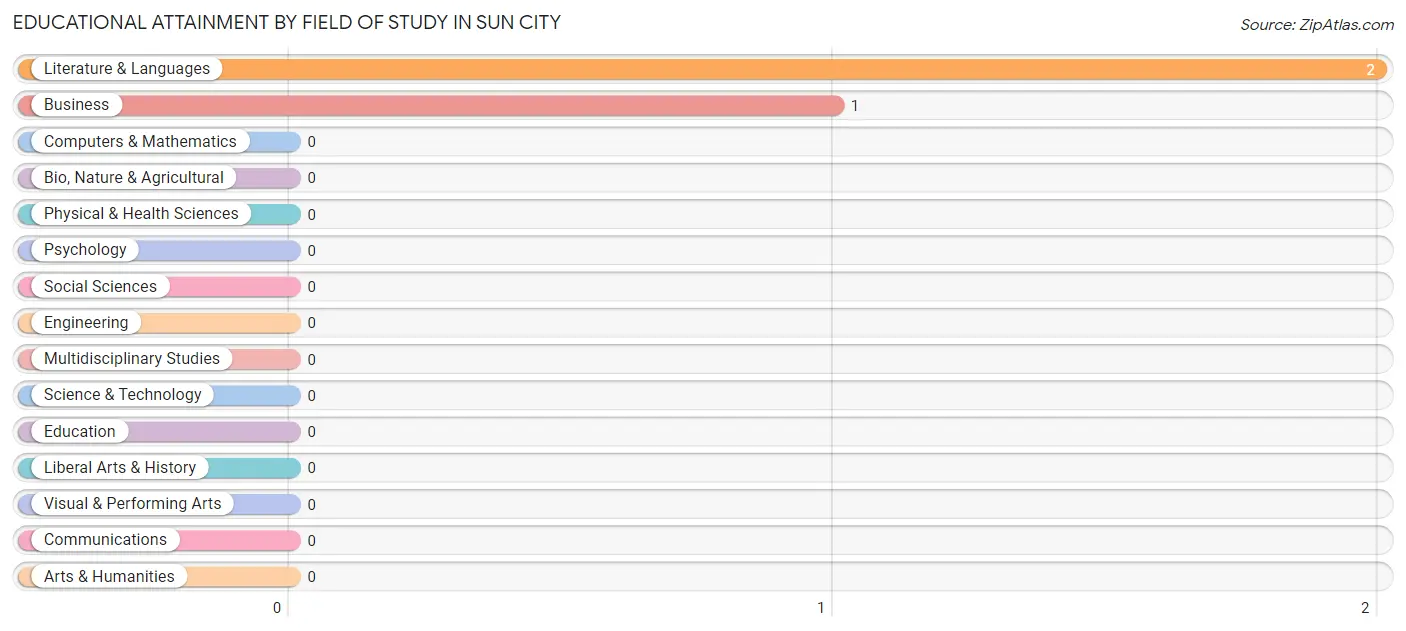
| Field of Study | # Graduates | % Graduates |
| Computers & Mathematics | 0 | 0.0% |
| Bio, Nature & Agricultural | 0 | 0.0% |
| Physical & Health Sciences | 0 | 0.0% |
| Psychology | 0 | 0.0% |
| Social Sciences | 0 | 0.0% |
| Engineering | 0 | 0.0% |
| Multidisciplinary Studies | 0 | 0.0% |
| Science & Technology | 0 | 0.0% |
| Business | 1 | 33.3% |
| Education | 0 | 0.0% |
| Literature & Languages | 2 | 66.7% |
| Liberal Arts & History | 0 | 0.0% |
| Visual & Performing Arts | 0 | 0.0% |
| Communications | 0 | 0.0% |
| Arts & Humanities | 0 | 0.0% |
| Total | 3 | 100.0% |
Transportation & Commute in Sun City
Vehicle Availability by Sex in Sun City
The most prevalent vehicle ownership categories in Sun City are males with 3 vehicles (11, accounting for 84.6%) and females with 3 vehicles (6, making up 183.3%).
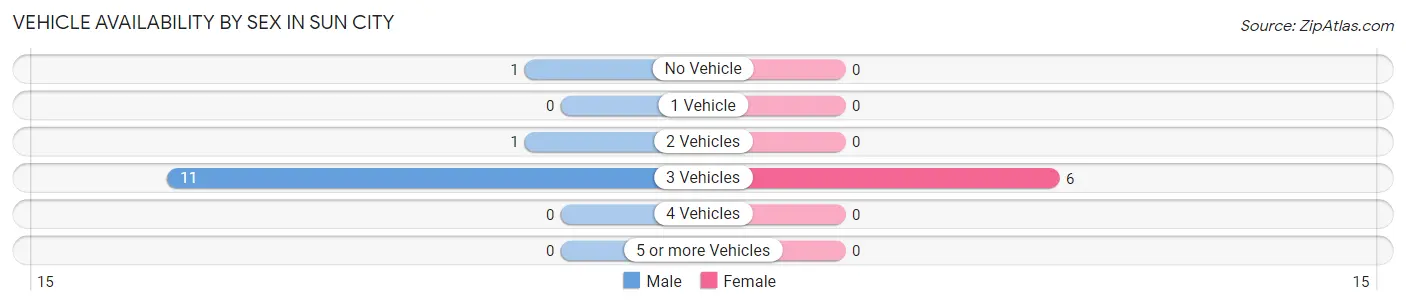
| Vehicles Available | Male | Female |
| No Vehicle | 1 (7.7%) | 0 (0.0%) |
| 1 Vehicle | 0 (0.0%) | 0 (0.0%) |
| 2 Vehicles | 1 (7.7%) | 0 (0.0%) |
| 3 Vehicles | 11 (84.6%) | 6 (100.0%) |
| 4 Vehicles | 0 (0.0%) | 0 (0.0%) |
| 5 or more Vehicles | 0 (0.0%) | 0 (0.0%) |
| Total | 13 (100.0%) | 6 (100.0%) |
Commute Time in Sun City
The most frequently occuring commute durations in Sun City are 30 to 34 minutes (8 commuters, 42.1%), 10 to 14 minutes (4 commuters, 21.0%), and 40 to 44 minutes (4 commuters, 21.0%).
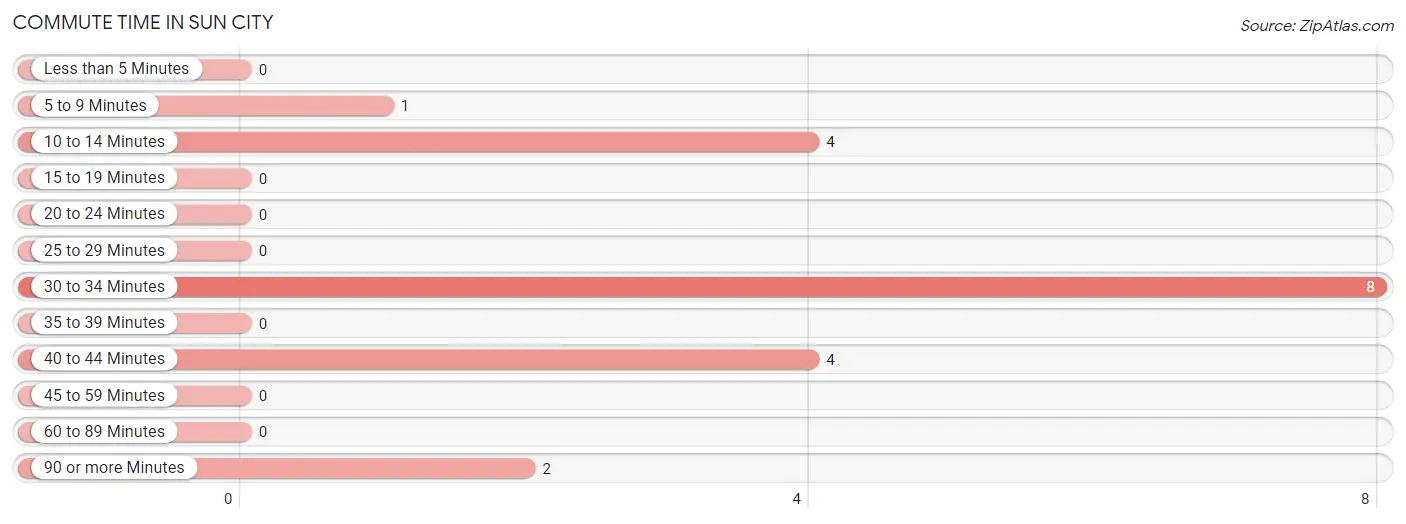
| Commute Time | # Commuters | % Commuters |
| Less than 5 Minutes | 0 | 0.0% |
| 5 to 9 Minutes | 1 | 5.3% |
| 10 to 14 Minutes | 4 | 21.0% |
| 15 to 19 Minutes | 0 | 0.0% |
| 20 to 24 Minutes | 0 | 0.0% |
| 25 to 29 Minutes | 0 | 0.0% |
| 30 to 34 Minutes | 8 | 42.1% |
| 35 to 39 Minutes | 0 | 0.0% |
| 40 to 44 Minutes | 4 | 21.0% |
| 45 to 59 Minutes | 0 | 0.0% |
| 60 to 89 Minutes | 0 | 0.0% |
| 90 or more Minutes | 2 | 10.5% |
Commute Time by Sex in Sun City
The most common commute times in Sun City are 30 to 34 minutes (8 commuters, 61.5%) for males and 40 to 44 minutes (4 commuters, 66.7%) for females.
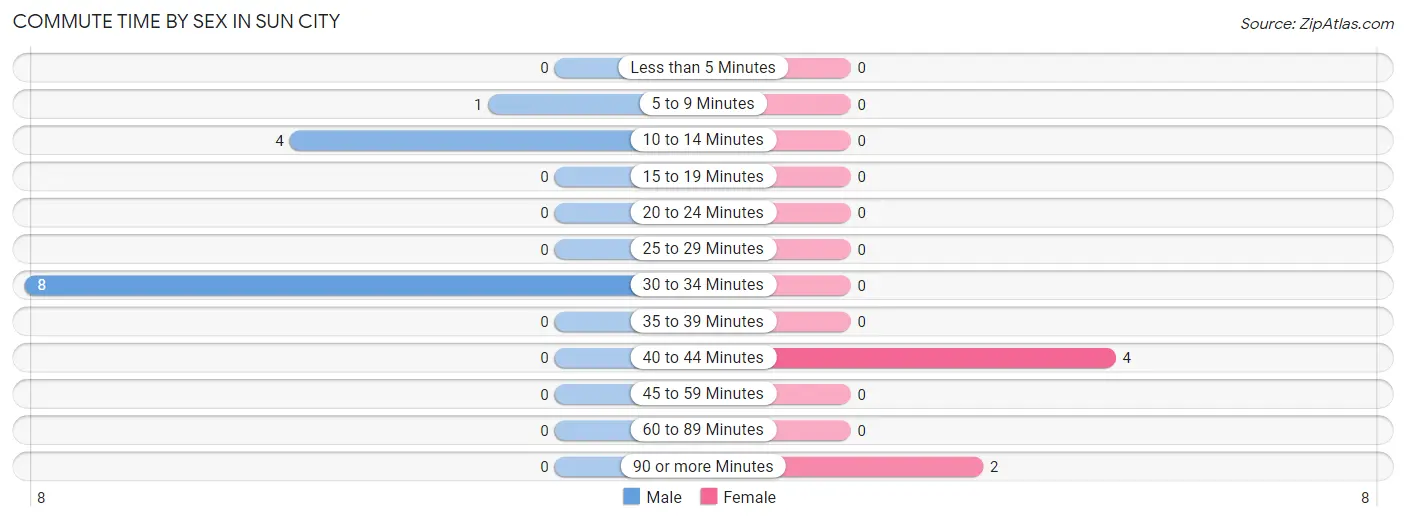
| Commute Time | Male | Female |
| Less than 5 Minutes | 0 (0.0%) | 0 (0.0%) |
| 5 to 9 Minutes | 1 (7.7%) | 0 (0.0%) |
| 10 to 14 Minutes | 4 (30.8%) | 0 (0.0%) |
| 15 to 19 Minutes | 0 (0.0%) | 0 (0.0%) |
| 20 to 24 Minutes | 0 (0.0%) | 0 (0.0%) |
| 25 to 29 Minutes | 0 (0.0%) | 0 (0.0%) |
| 30 to 34 Minutes | 8 (61.5%) | 0 (0.0%) |
| 35 to 39 Minutes | 0 (0.0%) | 0 (0.0%) |
| 40 to 44 Minutes | 0 (0.0%) | 4 (66.7%) |
| 45 to 59 Minutes | 0 (0.0%) | 0 (0.0%) |
| 60 to 89 Minutes | 0 (0.0%) | 0 (0.0%) |
| 90 or more Minutes | 0 (0.0%) | 2 (33.3%) |
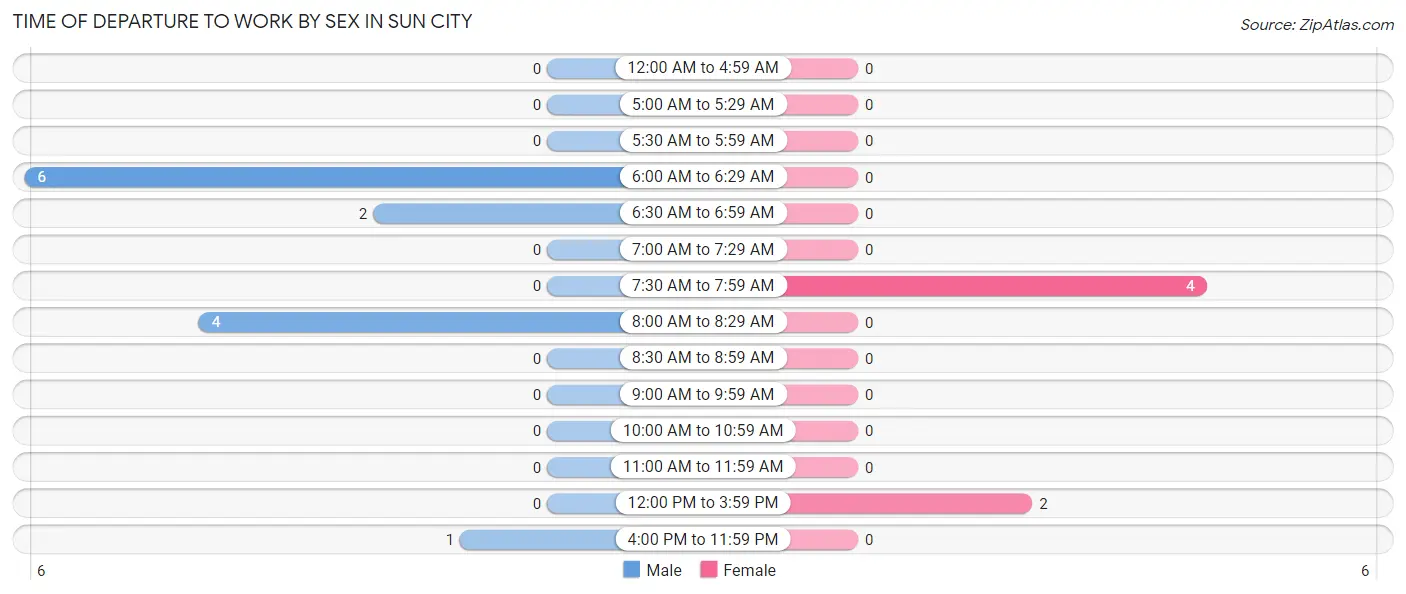
Time of Departure to Work by Sex in Sun City
The most frequent times of departure to work in Sun City are 6:00 AM to 6:29 AM (6, 46.2%) for males and 7:30 AM to 7:59 AM (4, 66.7%) for females.
| Time of Departure | Male | Female |
| 12:00 AM to 4:59 AM | 0 (0.0%) | 0 (0.0%) |
| 5:00 AM to 5:29 AM | 0 (0.0%) | 0 (0.0%) |
| 5:30 AM to 5:59 AM | 0 (0.0%) | 0 (0.0%) |
| 6:00 AM to 6:29 AM | 6 (46.2%) | 0 (0.0%) |
| 6:30 AM to 6:59 AM | 2 (15.4%) | 0 (0.0%) |
| 7:00 AM to 7:29 AM | 0 (0.0%) | 0 (0.0%) |
| 7:30 AM to 7:59 AM | 0 (0.0%) | 4 (66.7%) |
| 8:00 AM to 8:29 AM | 4 (30.8%) | 0 (0.0%) |
| 8:30 AM to 8:59 AM | 0 (0.0%) | 0 (0.0%) |
| 9:00 AM to 9:59 AM | 0 (0.0%) | 0 (0.0%) |
| 10:00 AM to 10:59 AM | 0 (0.0%) | 0 (0.0%) |
| 11:00 AM to 11:59 AM | 0 (0.0%) | 0 (0.0%) |
| 12:00 PM to 3:59 PM | 0 (0.0%) | 2 (33.3%) |
| 4:00 PM to 11:59 PM | 1 (7.7%) | 0 (0.0%) |
| Total | 13 (100.0%) | 6 (100.0%) |
Housing Occupancy in Sun City
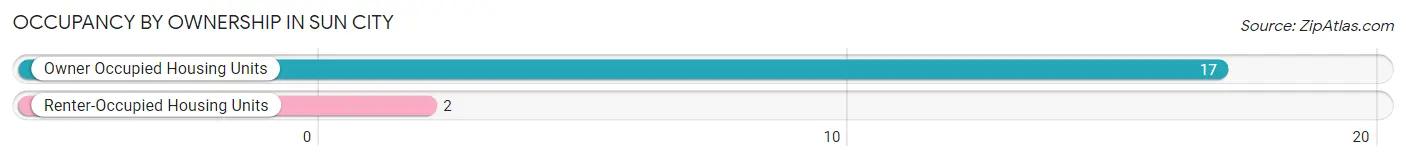
Occupancy by Ownership in Sun City
Of the total 19 dwellings in Sun City, owner-occupied units account for 17 (89.5%), while renter-occupied units make up 2 (10.5%).
| Occupancy | # Housing Units | % Housing Units |
| Owner Occupied Housing Units | 17 | 89.5% |
| Renter-Occupied Housing Units | 2 | 10.5% |
| Total Occupied Housing Units | 19 | 100.0% |
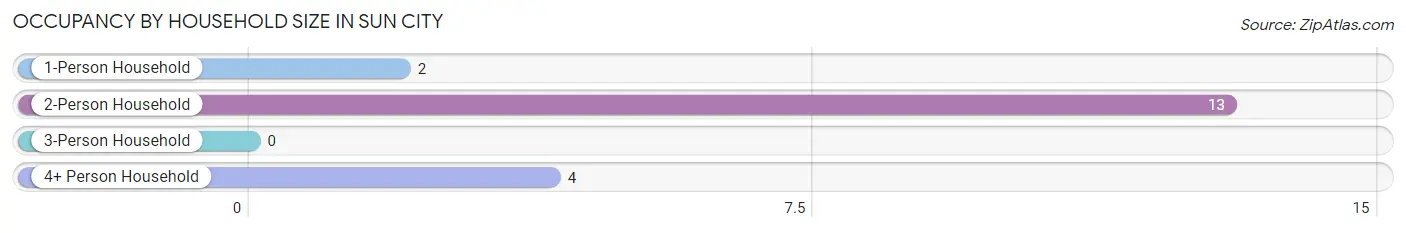
Occupancy by Household Size in Sun City
| Household Size | # Housing Units | % Housing Units |
| 1-Person Household | 2 | 10.5% |
| 2-Person Household | 13 | 68.4% |
| 3-Person Household | 0 | 0.0% |
| 4+ Person Household | 4 | 21.0% |
| Total Housing Units | 19 | 100.0% |
Occupancy by Ownership by Household Size in Sun City
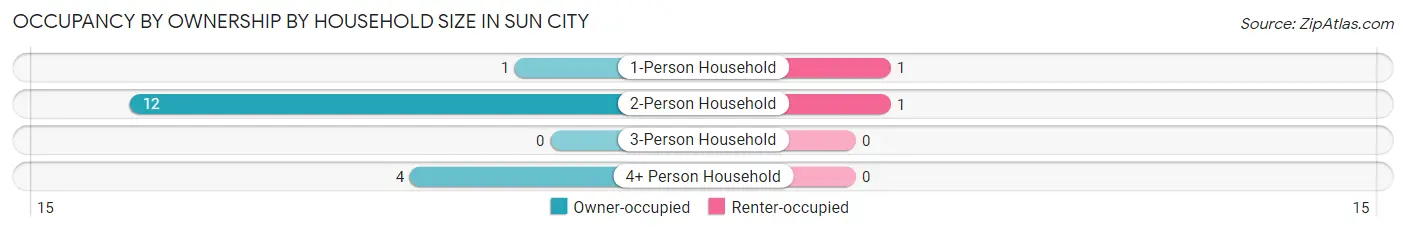
| Household Size | Owner-occupied | Renter-occupied |
| 1-Person Household | 1 (50.0%) | 1 (50.0%) |
| 2-Person Household | 12 (92.3%) | 1 (7.7%) |
| 3-Person Household | 0 (0.0%) | 0 (0.0%) |
| 4+ Person Household | 4 (100.0%) | 0 (0.0%) |
| Total Housing Units | 17 (89.5%) | 2 (10.5%) |
Occupancy by Educational Attainment in Sun City
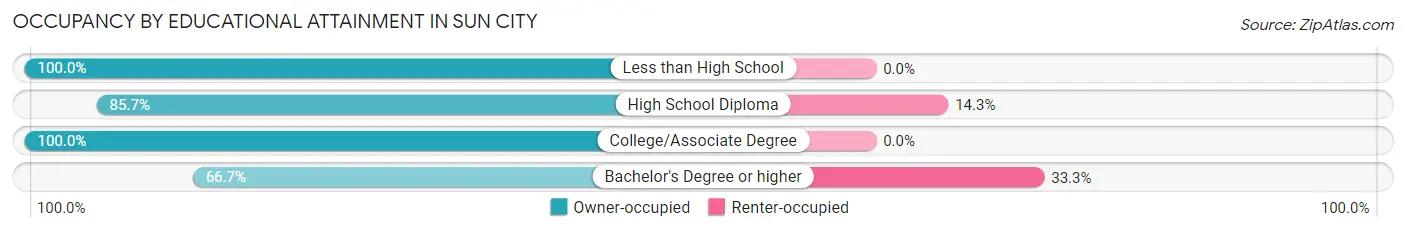
| Household Size | Owner-occupied | Renter-occupied |
| Less than High School | 1 (100.0%) | 0 (0.0%) |
| High School Diploma | 6 (85.7%) | 1 (14.3%) |
| College/Associate Degree | 8 (100.0%) | 0 (0.0%) |
| Bachelor's Degree or higher | 2 (66.7%) | 1 (33.3%) |
Occupancy by Age of Householder in Sun City
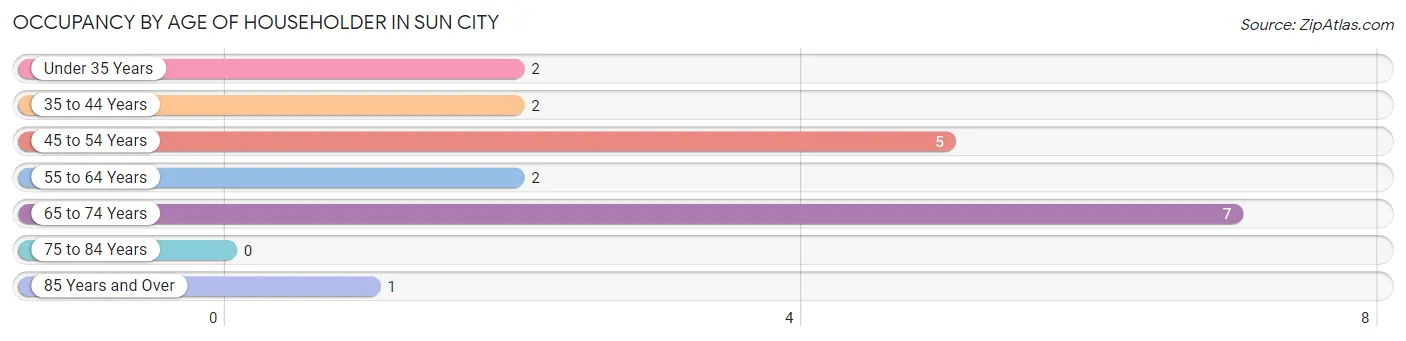
| Age Bracket | # Households | % Households |
| Under 35 Years | 2 | 10.5% |
| 35 to 44 Years | 2 | 10.5% |
| 45 to 54 Years | 5 | 26.3% |
| 55 to 64 Years | 2 | 10.5% |
| 65 to 74 Years | 7 | 36.8% |
| 75 to 84 Years | 0 | 0.0% |
| 85 Years and Over | 1 | 5.3% |
| Total | 19 | 100.0% |
Housing Finances in Sun City
Median Income by Occupancy in Sun City
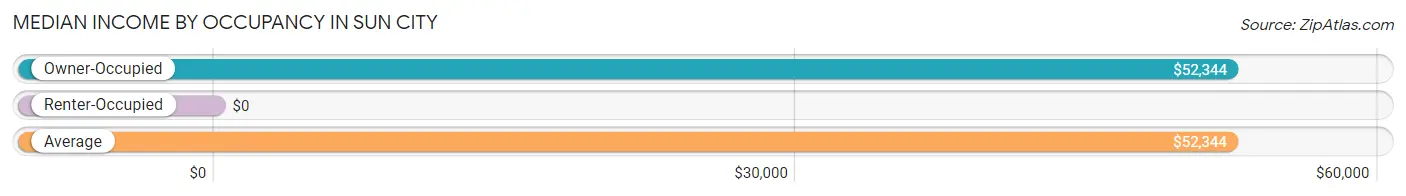
| Occupancy Type | # Households | Median Income |
| Owner-Occupied | 17 (89.5%) | $52,344 |
| Renter-Occupied | 2 (10.5%) | $0 |
| Average | 19 (100.0%) | $52,344 |
Occupancy by Householder Income Bracket in Sun City
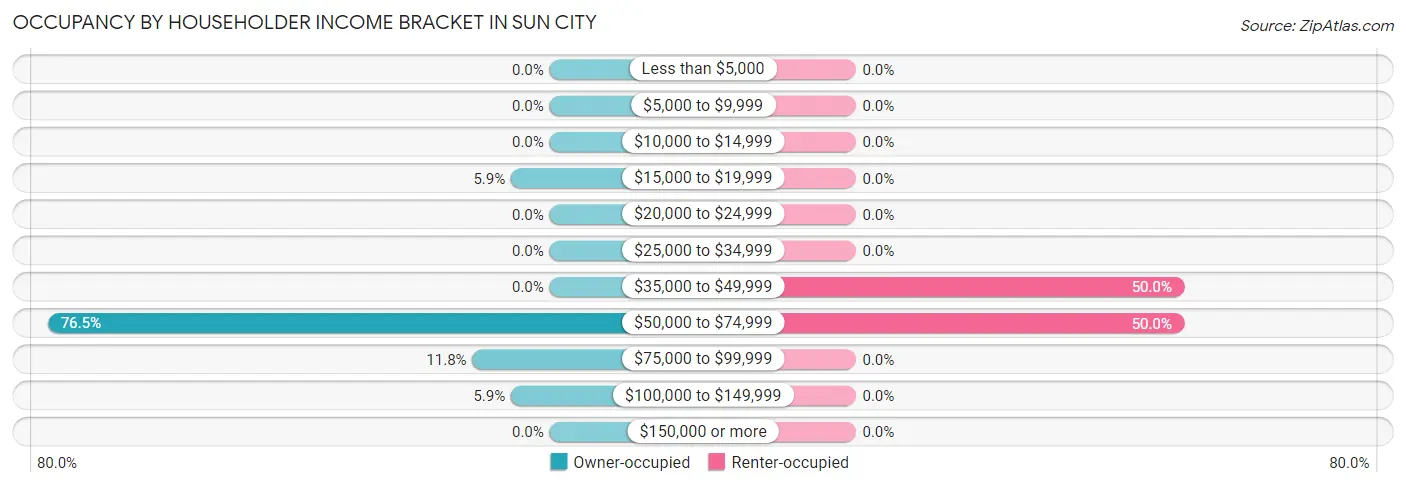
| Income Bracket | Owner-occupied | Renter-occupied |
| Less than $5,000 | 0 (0.0%) | 0 (0.0%) |
| $5,000 to $9,999 | 0 (0.0%) | 0 (0.0%) |
| $10,000 to $14,999 | 0 (0.0%) | 0 (0.0%) |
| $15,000 to $19,999 | 1 (5.9%) | 0 (0.0%) |
| $20,000 to $24,999 | 0 (0.0%) | 0 (0.0%) |
| $25,000 to $34,999 | 0 (0.0%) | 0 (0.0%) |
| $35,000 to $49,999 | 0 (0.0%) | 1 (50.0%) |
| $50,000 to $74,999 | 13 (76.5%) | 1 (50.0%) |
| $75,000 to $99,999 | 2 (11.8%) | 0 (0.0%) |
| $100,000 to $149,999 | 1 (5.9%) | 0 (0.0%) |
| $150,000 or more | 0 (0.0%) | 0 (0.0%) |
| Total | 17 (100.0%) | 2 (100.0%) |
Monthly Housing Cost Tiers in Sun City
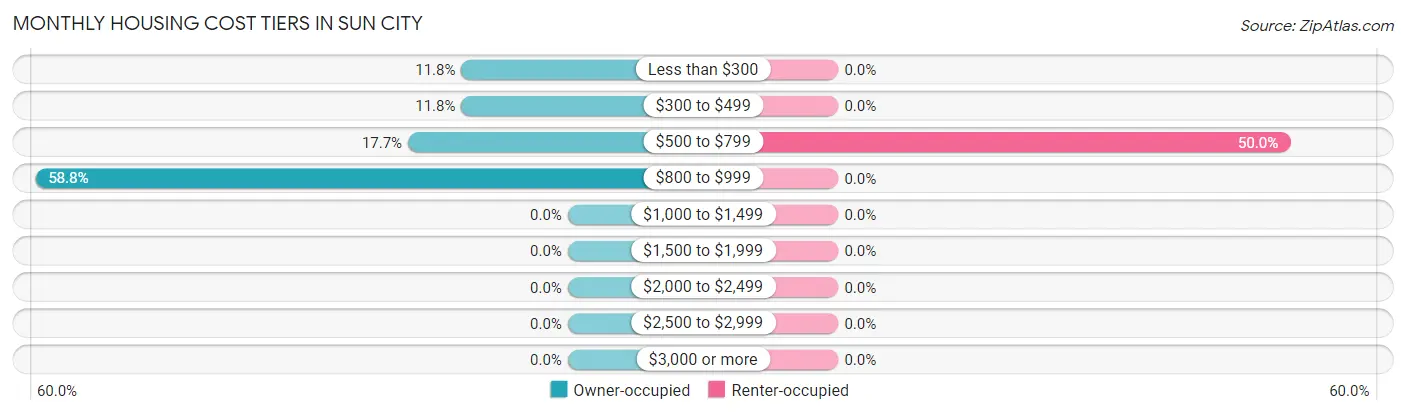
| Monthly Cost | Owner-occupied | Renter-occupied |
| Less than $300 | 2 (11.8%) | 0 (0.0%) |
| $300 to $499 | 2 (11.8%) | 0 (0.0%) |
| $500 to $799 | 3 (17.6%) | 1 (50.0%) |
| $800 to $999 | 10 (58.8%) | 0 (0.0%) |
| $1,000 to $1,499 | 0 (0.0%) | 0 (0.0%) |
| $1,500 to $1,999 | 0 (0.0%) | 0 (0.0%) |
| $2,000 to $2,499 | 0 (0.0%) | 0 (0.0%) |
| $2,500 to $2,999 | 0 (0.0%) | 0 (0.0%) |
| $3,000 or more | 0 (0.0%) | 0 (0.0%) |
| Total | 17 (100.0%) | 2 (100.0%) |
Physical Housing Characteristics in Sun City
Housing Structures in Sun City
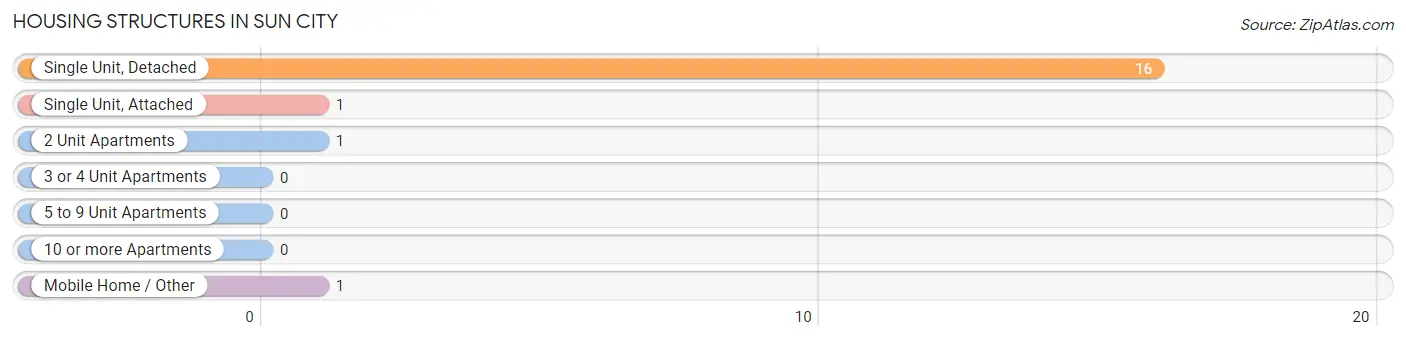
| Structure Type | # Housing Units | % Housing Units |
| Single Unit, Detached | 16 | 84.2% |
| Single Unit, Attached | 1 | 5.3% |
| 2 Unit Apartments | 1 | 5.3% |
| 3 or 4 Unit Apartments | 0 | 0.0% |
| 5 to 9 Unit Apartments | 0 | 0.0% |
| 10 or more Apartments | 0 | 0.0% |
| Mobile Home / Other | 1 | 5.3% |
| Total | 19 | 100.0% |
Housing Structures by Occupancy in Sun City
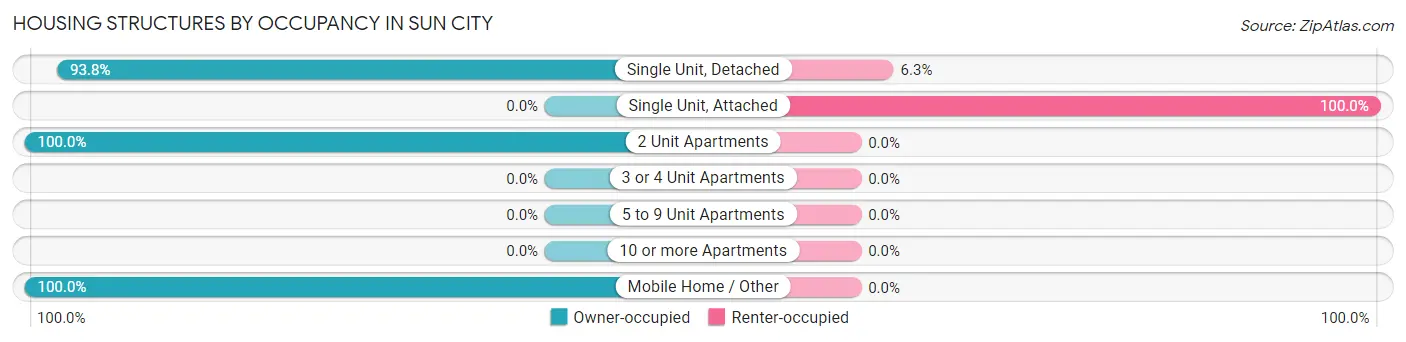
| Structure Type | Owner-occupied | Renter-occupied |
| Single Unit, Detached | 15 (93.8%) | 1 (6.2%) |
| Single Unit, Attached | 0 (0.0%) | 1 (100.0%) |
| 2 Unit Apartments | 1 (100.0%) | 0 (0.0%) |
| 3 or 4 Unit Apartments | 0 (0.0%) | 0 (0.0%) |
| 5 to 9 Unit Apartments | 0 (0.0%) | 0 (0.0%) |
| 10 or more Apartments | 0 (0.0%) | 0 (0.0%) |
| Mobile Home / Other | 1 (100.0%) | 0 (0.0%) |
| Total | 17 (89.5%) | 2 (10.5%) |
Housing Structures by Number of Rooms in Sun City
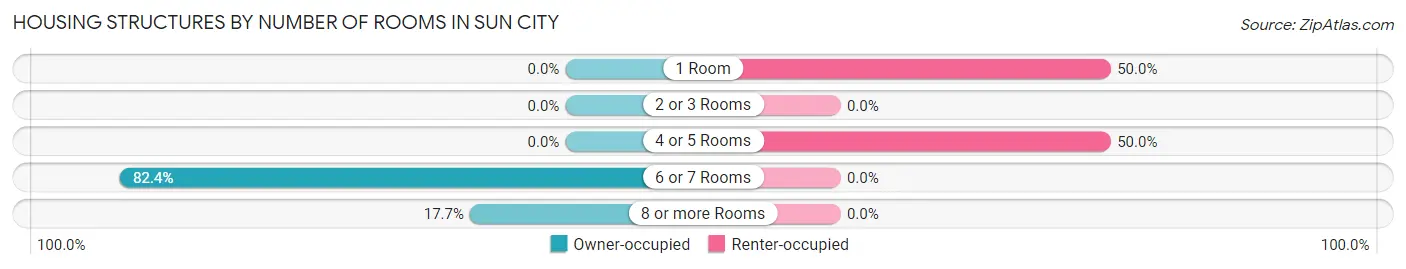
| Number of Rooms | Owner-occupied | Renter-occupied |
| 1 Room | 0 (0.0%) | 1 (50.0%) |
| 2 or 3 Rooms | 0 (0.0%) | 0 (0.0%) |
| 4 or 5 Rooms | 0 (0.0%) | 1 (50.0%) |
| 6 or 7 Rooms | 14 (82.4%) | 0 (0.0%) |
| 8 or more Rooms | 3 (17.6%) | 0 (0.0%) |
| Total | 17 (100.0%) | 2 (100.0%) |
Housing Structure by Heating Type in Sun City
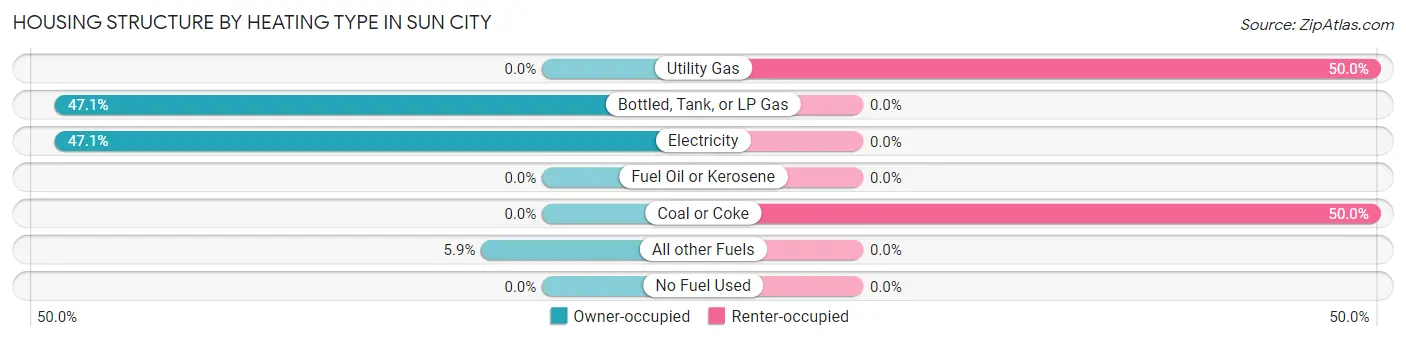
| Heating Type | Owner-occupied | Renter-occupied |
| Utility Gas | 0 (0.0%) | 1 (50.0%) |
| Bottled, Tank, or LP Gas | 8 (47.1%) | 0 (0.0%) |
| Electricity | 8 (47.1%) | 0 (0.0%) |
| Fuel Oil or Kerosene | 0 (0.0%) | 0 (0.0%) |
| Coal or Coke | 0 (0.0%) | 1 (50.0%) |
| All other Fuels | 1 (5.9%) | 0 (0.0%) |
| No Fuel Used | 0 (0.0%) | 0 (0.0%) |
| Total | 17 (100.0%) | 2 (100.0%) |
Household Vehicle Usage in Sun City
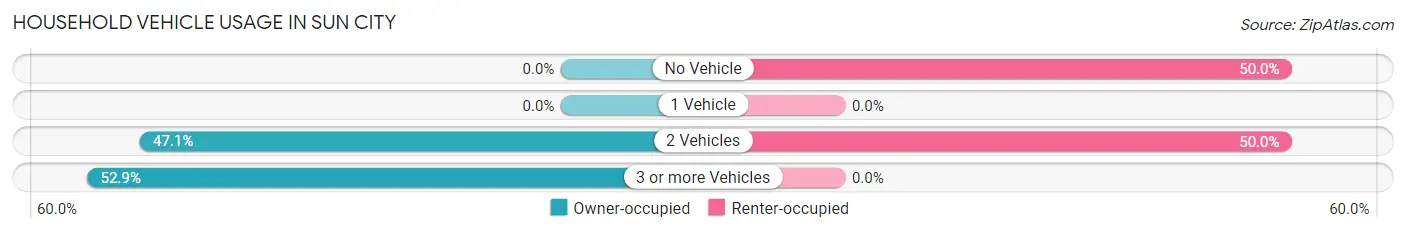
| Vehicles per Household | Owner-occupied | Renter-occupied |
| No Vehicle | 0 (0.0%) | 1 (50.0%) |
| 1 Vehicle | 0 (0.0%) | 0 (0.0%) |
| 2 Vehicles | 8 (47.1%) | 1 (50.0%) |
| 3 or more Vehicles | 9 (52.9%) | 0 (0.0%) |
| Total | 17 (100.0%) | 2 (100.0%) |
Real Estate & Mortgages in Sun City
Real Estate and Mortgage Overview in Sun City
| Characteristic | Without Mortgage | With Mortgage |
| Housing Units | 13 | 4 |
| Median Property Value | $156,300 | $0 |
| Median Household Income | $51,719 | $0 |
| Monthly Housing Costs | $683 | $0 |
| Real Estate Taxes | $2,188 | $0 |
Property Value by Mortgage Status in Sun City
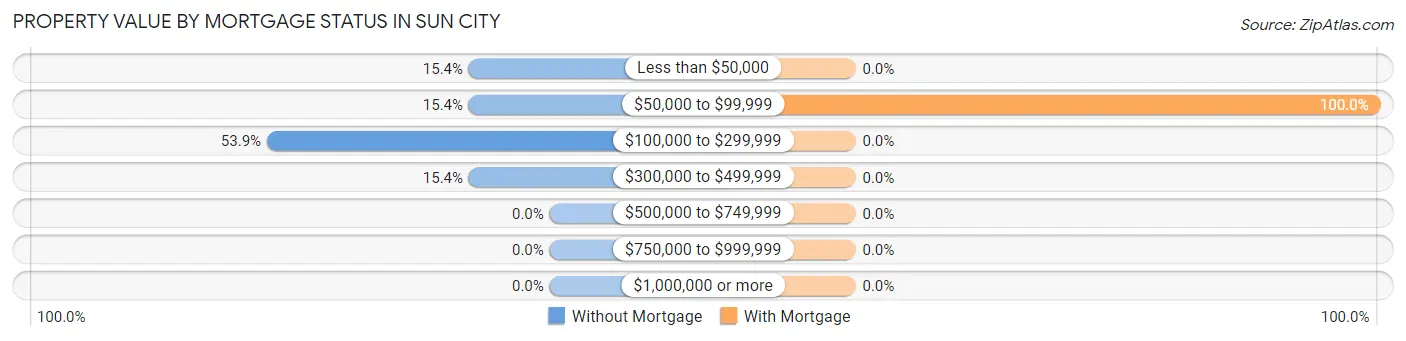
| Property Value | Without Mortgage | With Mortgage |
| Less than $50,000 | 2 (15.4%) | 0 (0.0%) |
| $50,000 to $99,999 | 2 (15.4%) | 4 (100.0%) |
| $100,000 to $299,999 | 7 (53.8%) | 0 (0.0%) |
| $300,000 to $499,999 | 2 (15.4%) | 0 (0.0%) |
| $500,000 to $749,999 | 0 (0.0%) | 0 (0.0%) |
| $750,000 to $999,999 | 0 (0.0%) | 0 (0.0%) |
| $1,000,000 or more | 0 (0.0%) | 0 (0.0%) |
| Total | 13 (100.0%) | 4 (100.0%) |
Household Income by Mortgage Status in Sun City
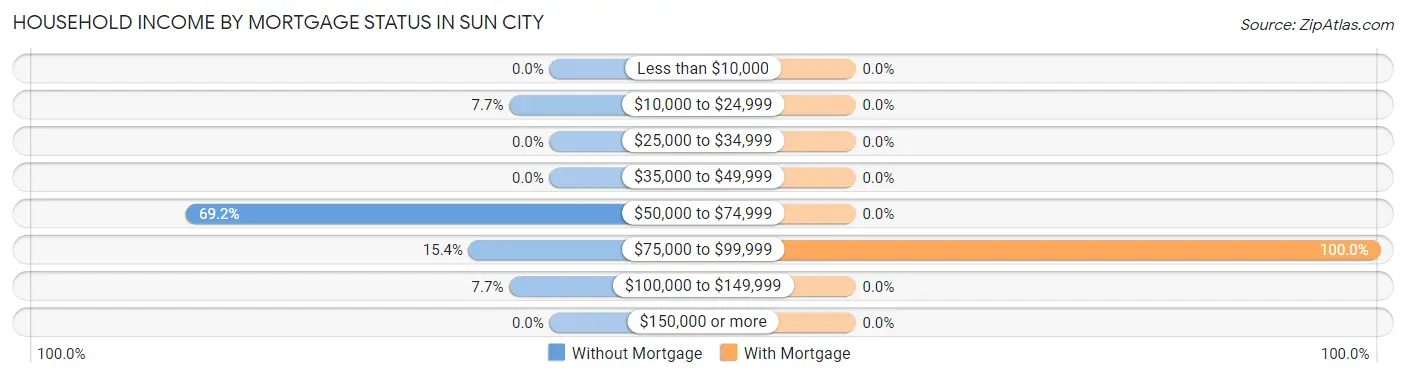
| Household Income | Without Mortgage | With Mortgage |
| Less than $10,000 | 0 (0.0%) | 0 (0.0%) |
| $10,000 to $24,999 | 1 (7.7%) | 0 (0.0%) |
| $25,000 to $34,999 | 0 (0.0%) | 0 (0.0%) |
| $35,000 to $49,999 | 0 (0.0%) | 0 (0.0%) |
| $50,000 to $74,999 | 9 (69.2%) | 0 (0.0%) |
| $75,000 to $99,999 | 2 (15.4%) | 4 (100.0%) |
| $100,000 to $149,999 | 1 (7.7%) | 0 (0.0%) |
| $150,000 or more | 0 (0.0%) | 0 (0.0%) |
| Total | 13 (100.0%) | 4 (100.0%) |
Property Value to Household Income Ratio in Sun City
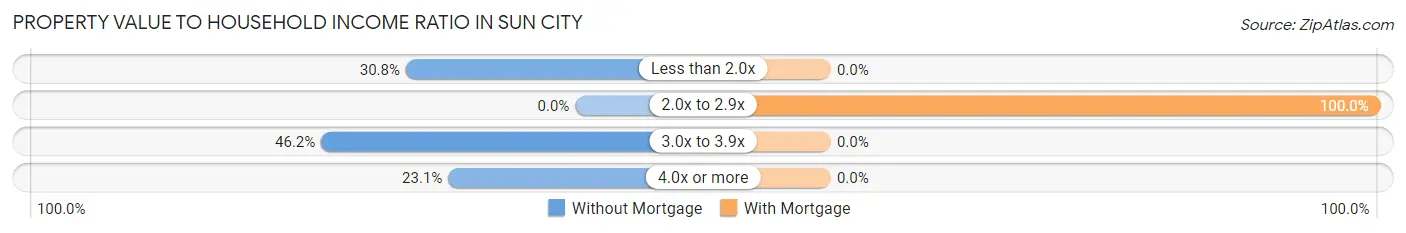
| Value-to-Income Ratio | Without Mortgage | With Mortgage |
| Less than 2.0x | 4 (30.8%) | 0 (0.0%) |
| 2.0x to 2.9x | 0 (0.0%) | 4 (100.0%) |
| 3.0x to 3.9x | 6 (46.2%) | 0 (0.0%) |
| 4.0x or more | 3 (23.1%) | 0 (0.0%) |
| Total | 13 (100.0%) | 4 (100.0%) |
Real Estate Taxes by Mortgage Status in Sun City
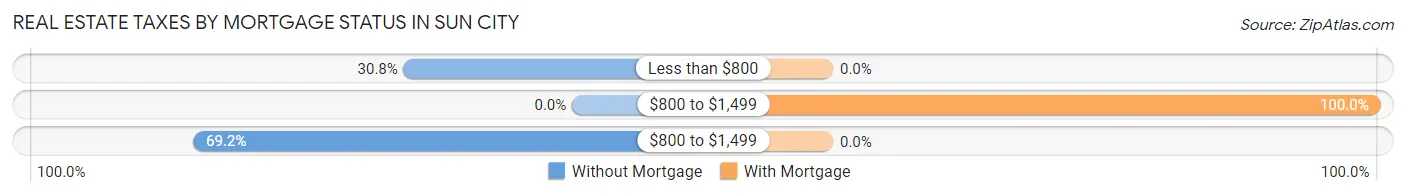
| Property Taxes | Without Mortgage | With Mortgage |
| Less than $800 | 4 (30.8%) | 0 (0.0%) |
| $800 to $1,499 | 0 (0.0%) | 4 (100.0%) |
| $800 to $1,499 | 9 (69.2%) | 0 (0.0%) |
| Total | 13 (100.0%) | 4 (100.0%) |
Health & Disability in Sun City
Health Insurance Coverage by Age in Sun City
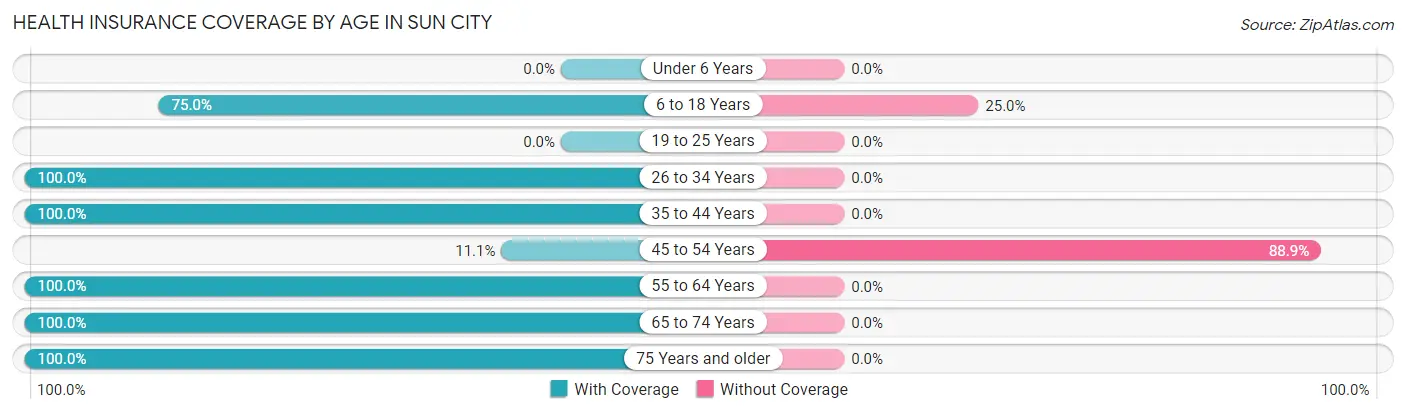
| Age Bracket | With Coverage | Without Coverage |
| Under 6 Years | 0 (0.0%) | 0 (0.0%) |
| 6 to 18 Years | 9 (75.0%) | 3 (25.0%) |
| 19 to 25 Years | 0 (0.0%) | 0 (0.0%) |
| 26 to 34 Years | 6 (100.0%) | 0 (0.0%) |
| 35 to 44 Years | 4 (100.0%) | 0 (0.0%) |
| 45 to 54 Years | 1 (11.1%) | 8 (88.9%) |
| 55 to 64 Years | 4 (100.0%) | 0 (0.0%) |
| 65 to 74 Years | 16 (100.0%) | 0 (0.0%) |
| 75 Years and older | 1 (100.0%) | 0 (0.0%) |
| Total | 41 (78.8%) | 11 (21.1%) |
Health Insurance Coverage by Citizenship Status in Sun City
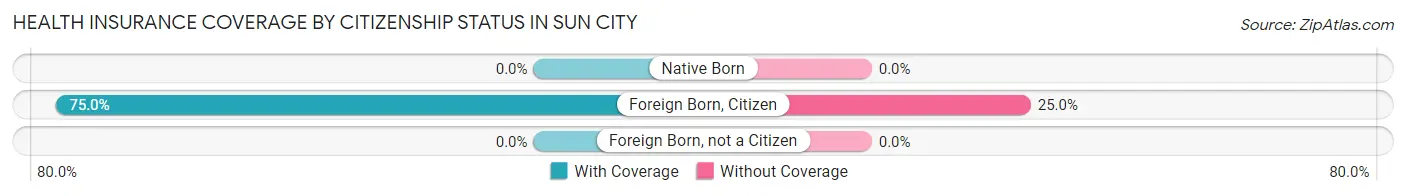
| Citizenship Status | With Coverage | Without Coverage |
| Native Born | 0 (0.0%) | 0 (0.0%) |
| Foreign Born, Citizen | 9 (75.0%) | 3 (25.0%) |
| Foreign Born, not a Citizen | 0 (0.0%) | 0 (0.0%) |
Health Insurance Coverage by Household Income in Sun City
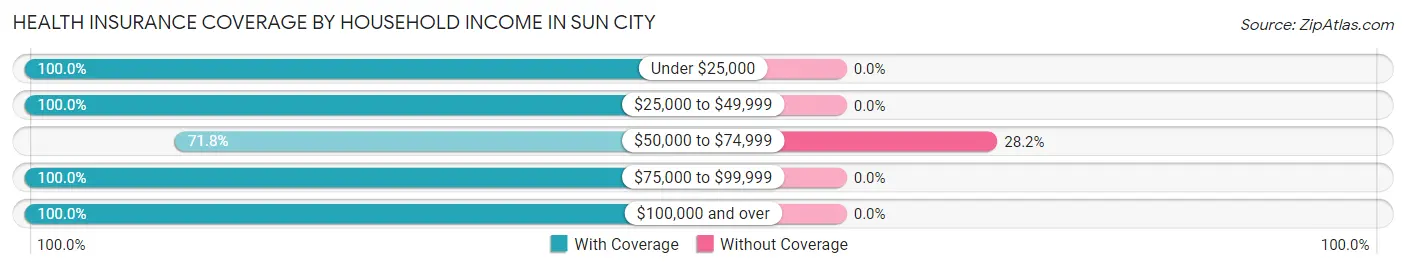
| Household Income | With Coverage | Without Coverage |
| Under $25,000 | 1 (100.0%) | 0 (0.0%) |
| $25,000 to $49,999 | 2 (100.0%) | 0 (0.0%) |
| $50,000 to $74,999 | 28 (71.8%) | 11 (28.2%) |
| $75,000 to $99,999 | 8 (100.0%) | 0 (0.0%) |
| $100,000 and over | 2 (100.0%) | 0 (0.0%) |
Public vs Private Health Insurance Coverage by Age in Sun City
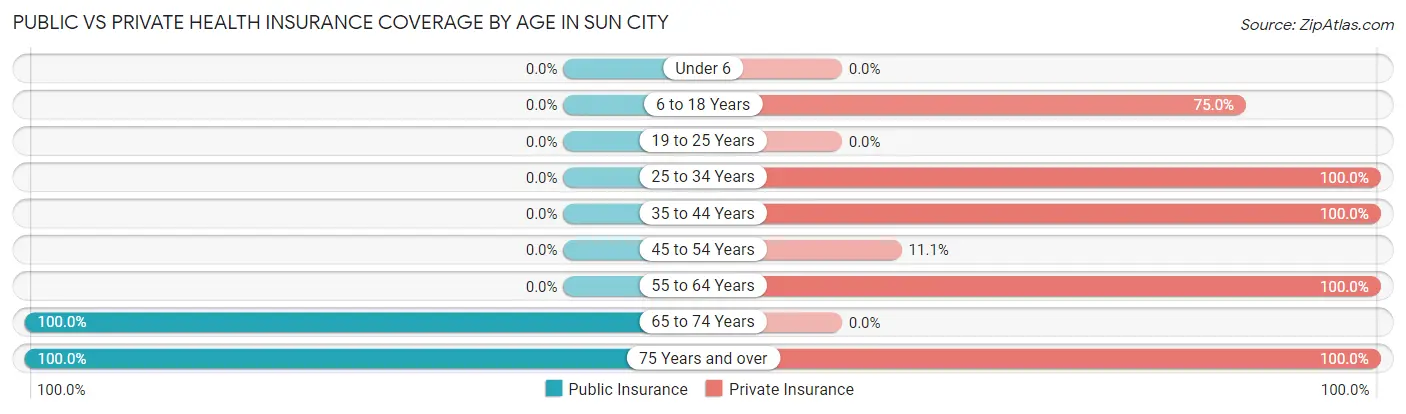
| Age Bracket | Public Insurance | Private Insurance |
| Under 6 | 0 (0.0%) | 0 (0.0%) |
| 6 to 18 Years | 0 (0.0%) | 9 (75.0%) |
| 19 to 25 Years | 0 (0.0%) | 0 (0.0%) |
| 25 to 34 Years | 0 (0.0%) | 6 (100.0%) |
| 35 to 44 Years | 0 (0.0%) | 4 (100.0%) |
| 45 to 54 Years | 0 (0.0%) | 1 (11.1%) |
| 55 to 64 Years | 0 (0.0%) | 4 (100.0%) |
| 65 to 74 Years | 16 (100.0%) | 0 (0.0%) |
| 75 Years and over | 1 (100.0%) | 1 (100.0%) |
| Total | 17 (32.7%) | 25 (48.1%) |
Disability Status by Sex by Age in Sun City
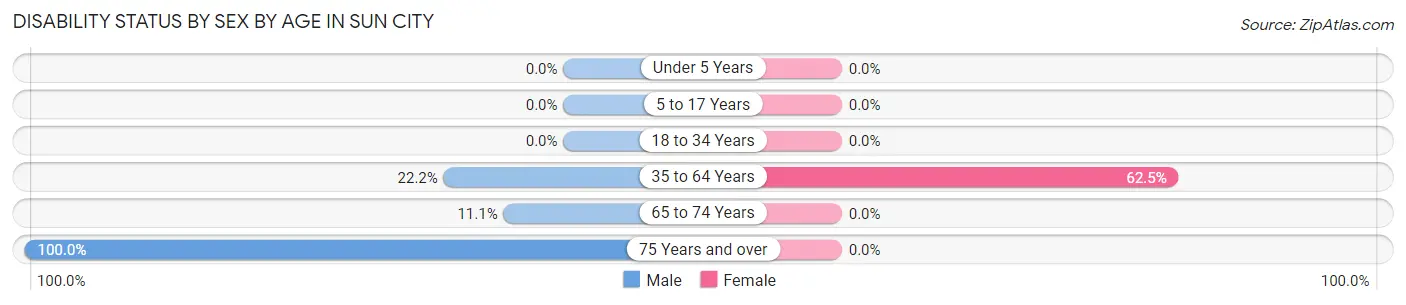
| Age Bracket | Male | Female |
| Under 5 Years | 0 (0.0%) | 0 (0.0%) |
| 5 to 17 Years | 0 (0.0%) | 0 (0.0%) |
| 18 to 34 Years | 0 (0.0%) | 0 (0.0%) |
| 35 to 64 Years | 2 (22.2%) | 5 (62.5%) |
| 65 to 74 Years | 1 (11.1%) | 0 (0.0%) |
| 75 Years and over | 1 (100.0%) | 0 (0.0%) |
Disability Class by Sex by Age in Sun City
Disability Class: Hearing Difficulty
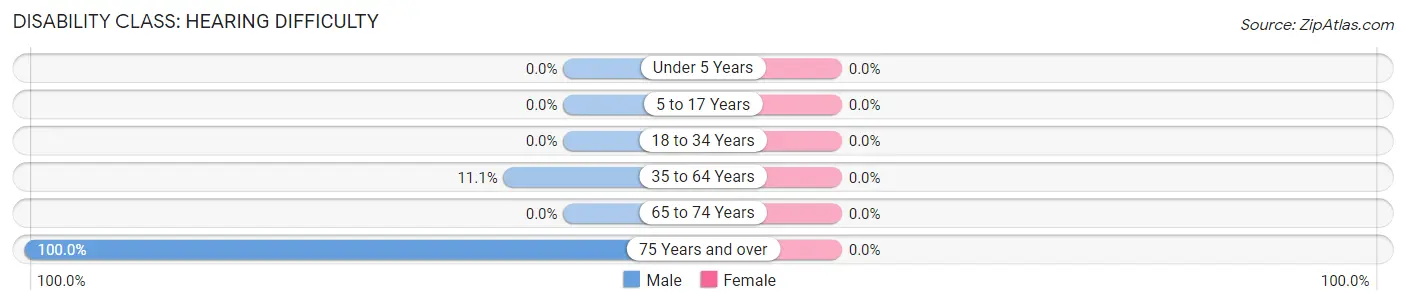
| Age Bracket | Male | Female |
| Under 5 Years | 0 (0.0%) | 0 (0.0%) |
| 5 to 17 Years | 0 (0.0%) | 0 (0.0%) |
| 18 to 34 Years | 0 (0.0%) | 0 (0.0%) |
| 35 to 64 Years | 1 (11.1%) | 0 (0.0%) |
| 65 to 74 Years | 0 (0.0%) | 0 (0.0%) |
| 75 Years and over | 1 (100.0%) | 0 (0.0%) |
Disability Class: Vision Difficulty
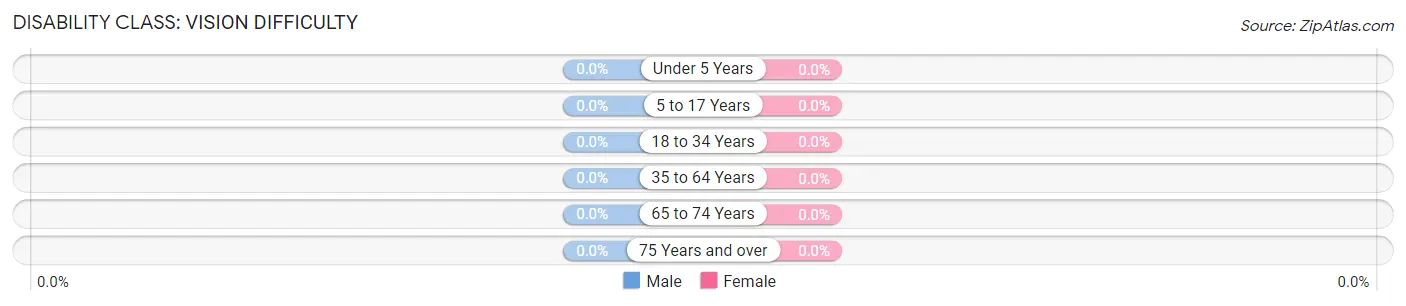
| Age Bracket | Male | Female |
| Under 5 Years | 0 (0.0%) | 0 (0.0%) |
| 5 to 17 Years | 0 (0.0%) | 0 (0.0%) |
| 18 to 34 Years | 0 (0.0%) | 0 (0.0%) |
| 35 to 64 Years | 0 (0.0%) | 0 (0.0%) |
| 65 to 74 Years | 0 (0.0%) | 0 (0.0%) |
| 75 Years and over | 0 (0.0%) | 0 (0.0%) |
Disability Class: Cognitive Difficulty
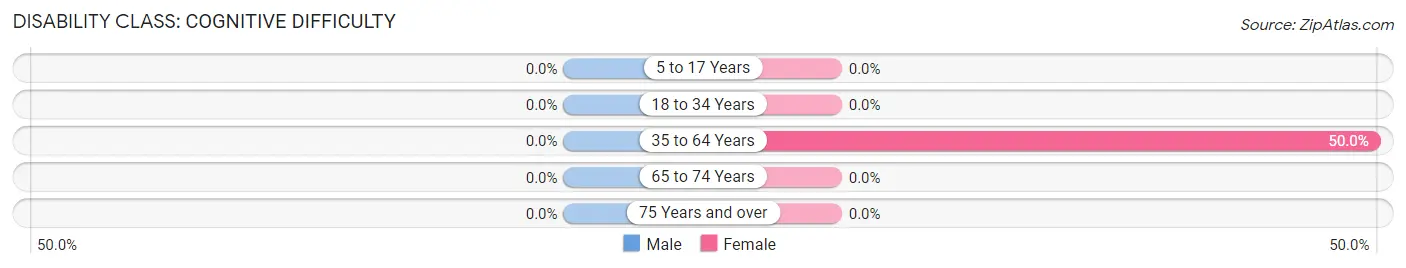
| Age Bracket | Male | Female |
| 5 to 17 Years | 0 (0.0%) | 0 (0.0%) |
| 18 to 34 Years | 0 (0.0%) | 0 (0.0%) |
| 35 to 64 Years | 0 (0.0%) | 4 (50.0%) |
| 65 to 74 Years | 0 (0.0%) | 0 (0.0%) |
| 75 Years and over | 0 (0.0%) | 0 (0.0%) |
Disability Class: Ambulatory Difficulty
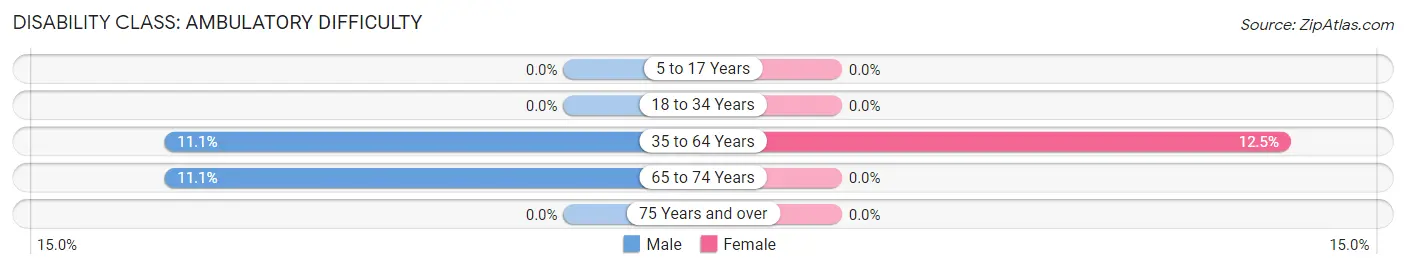
| Age Bracket | Male | Female |
| 5 to 17 Years | 0 (0.0%) | 0 (0.0%) |
| 18 to 34 Years | 0 (0.0%) | 0 (0.0%) |
| 35 to 64 Years | 1 (11.1%) | 1 (12.5%) |
| 65 to 74 Years | 1 (11.1%) | 0 (0.0%) |
| 75 Years and over | 0 (0.0%) | 0 (0.0%) |
Disability Class: Self-Care Difficulty
| Age Bracket | Male | Female |
| 5 to 17 Years | 0 (0.0%) | 0 (0.0%) |
| 18 to 34 Years | 0 (0.0%) | 0 (0.0%) |
| 35 to 64 Years | 0 (0.0%) | 0 (0.0%) |
| 65 to 74 Years | 0 (0.0%) | 0 (0.0%) |
| 75 Years and over | 0 (0.0%) | 0 (0.0%) |
Technology Access in Sun City
Computing Device Access in Sun City
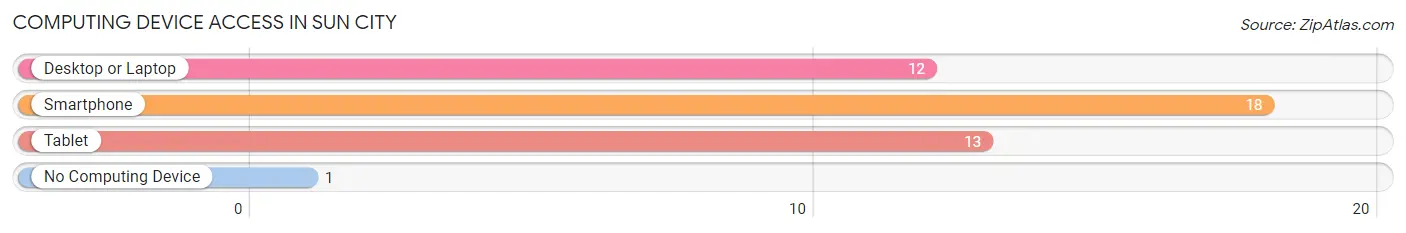
| Device Type | # Households | % Households |
| Desktop or Laptop | 12 | 63.2% |
| Smartphone | 18 | 94.7% |
| Tablet | 13 | 68.4% |
| No Computing Device | 1 | 5.3% |
| Total | 19 | 100.0% |
Internet Access in Sun City
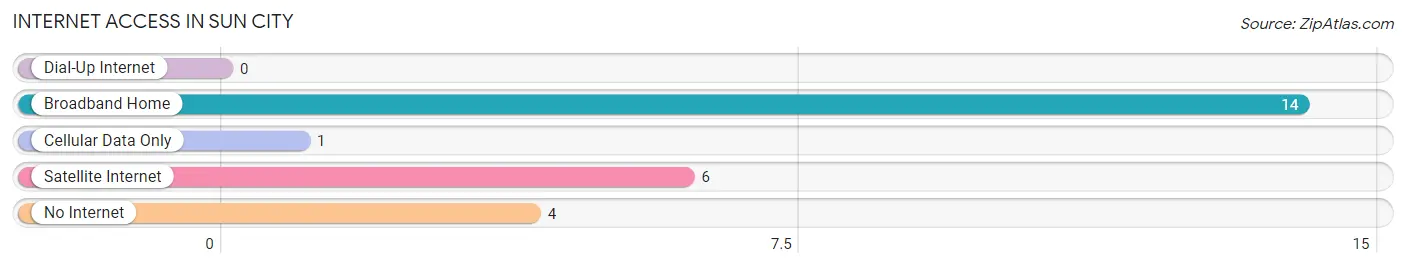
| Internet Type | # Households | % Households |
| Dial-Up Internet | 0 | 0.0% |
| Broadband Home | 14 | 73.7% |
| Cellular Data Only | 1 | 5.3% |
| Satellite Internet | 6 | 31.6% |
| No Internet | 4 | 21.0% |
| Total | 19 | 100.0% |
Sun City Summary
Sun City is a small town located in the state of Kansas, in the United States. It is situated in the south-central part of the state, in the county of Barber. The town has a population of approximately 1,000 people, and is located about 30 miles south of Medicine Lodge, the county seat.
History
Sun City was founded in 1887 by a group of settlers from the nearby town of Medicine Lodge. The town was named after the sun, which was seen as a symbol of hope and prosperity. The settlers were looking for a place to start a new life, and the area around Sun City was ideal for farming and ranching.
The town quickly grew, and by the early 1900s, it had become a thriving community. The town had a post office, a bank, a hotel, a general store, and several other businesses. The town also had a school, which was built in 1902.
In the early 1900s, Sun City was a popular destination for tourists, who came to enjoy the area's natural beauty. The town was also known for its rodeos, which were held every summer.
Geography
Sun City is located in the south-central part of Kansas, in the county of Barber. The town is situated on the banks of the Medicine Lodge River, which flows through the area. The town is surrounded by rolling hills and prairies, and is located about 30 miles south of Medicine Lodge, the county seat.
The climate in Sun City is generally mild, with hot summers and cold winters. The average temperature in the summer is around 80 degrees Fahrenheit, and in the winter it is around 40 degrees Fahrenheit. The town receives an average of about 20 inches of rain per year.
Economy
The economy of Sun City is largely based on agriculture. The town is home to several farms and ranches, which produce a variety of crops, including wheat, corn, and soybeans. The town also has a few small businesses, including a general store, a gas station, and a few restaurants.
Demographics
As of the 2010 census, the population of Sun City was 1,000 people. The town is predominantly white, with about 95% of the population being Caucasian. The median household income in the town is around $35,000, and the median age is around 40 years old.
Conclusion
Sun City is a small town located in the south-central part of Kansas. The town has a population of about 1,000 people, and is known for its agricultural economy and its natural beauty. The town is predominantly white, with a median household income of around $35,000. Sun City is a great place to live, work, and raise a family.
Common Questions
What is Per Capita Income in Sun City?
Per Capita income in Sun City is $25,292.
What is the Median Family Income in Sun City?
Median Family Income in Sun City is $52,344.
What is the Median Household income in Sun City?
Median Household Income in Sun City is $52,344.
What is Income or Wage Gap in Sun City?
Income or Wage Gap in Sun City is 58.8%.
Women in Sun City earn 41.2 cents for every dollar earned by a man.
What is Inequality or Gini Index in Sun City?
Inequality or Gini Index in Sun City is 0.19.
What is the Total Population of Sun City?
Total Population of Sun City is 52.
What is the Total Male Population of Sun City?
Total Male Population of Sun City is 32.
What is the Total Female Population of Sun City?
Total Female Population of Sun City is 20.
What is the Ratio of Males per 100 Females in Sun City?
There are 160.00 Males per 100 Females in Sun City.
What is the Ratio of Females per 100 Males in Sun City?
There are 62.50 Females per 100 Males in Sun City.
What is the Median Population Age in Sun City?
Median Population Age in Sun City is 49.0 Years.
What is the Average Family Size in Sun City
Average Family Size in Sun City is 2.9 People.
What is the Average Household Size in Sun City
Average Household Size in Sun City is 2.7 People.
How Large is the Labor Force in Sun City?
There are 21 People in the Labor Forcein in Sun City.
What is the Percentage of People in the Labor Force in Sun City?
50.0% of People are in the Labor Force in Sun City.