South Hutchinson, KS Map & Demographics
South Hutchinson Map
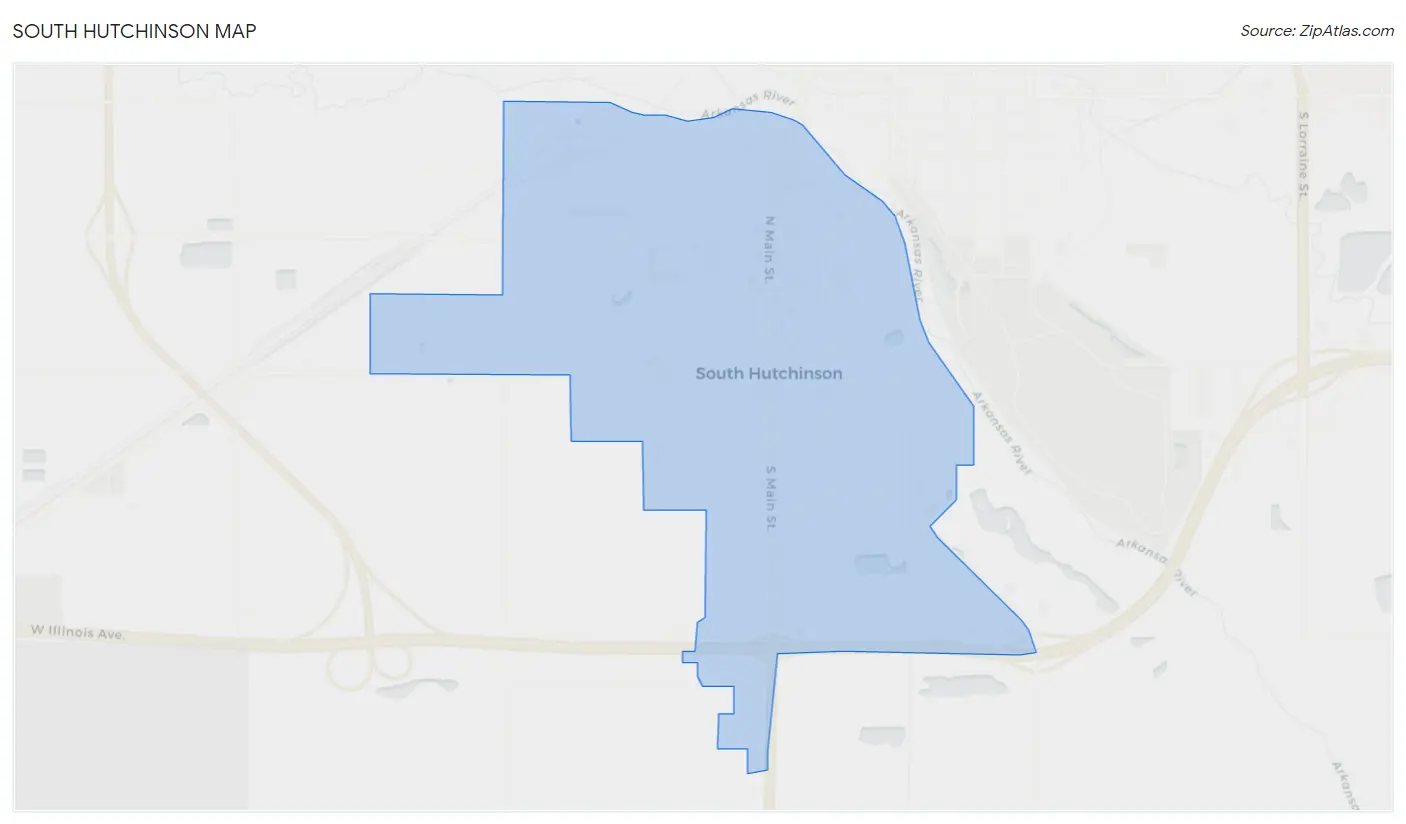
South Hutchinson Overview
$32,854
PER CAPITA INCOME
$63,043
AVG FAMILY INCOME
$41,936
AVG HOUSEHOLD INCOME
35.1%
WAGE / INCOME GAP [ % ]
64.9¢/ $1
WAGE / INCOME GAP [ $ ]
0.48
INEQUALITY / GINI INDEX
2,820
TOTAL POPULATION
1,338
MALE POPULATION
1,482
FEMALE POPULATION
90.28
MALES / 100 FEMALES
110.76
FEMALES / 100 MALES
44.9
MEDIAN AGE
2.9
AVG FAMILY SIZE
2.1
AVG HOUSEHOLD SIZE
1,415
LABOR FORCE [ PEOPLE ]
56.3%
PERCENT IN LABOR FORCE
4.2%
UNEMPLOYMENT RATE
South Hutchinson Zip Codes
South Hutchinson Area Codes
Income in South Hutchinson
Income Overview in South Hutchinson
Per Capita Income in South Hutchinson is $32,854, while median incomes of families and households are $63,043 and $41,936 respectively.
| Characteristic | Number | Measure |
| Per Capita Income | 2,820 | $32,854 |
| Median Family Income | 656 | $63,043 |
| Mean Family Income | 656 | $86,429 |
| Median Household Income | 1,276 | $41,936 |
| Mean Household Income | 1,276 | $62,411 |
| Income Deficit | 656 | $0 |
| Wage / Income Gap (%) | 2,820 | 35.07% |
| Wage / Income Gap ($) | 2,820 | 64.93¢ per $1 |
| Gini / Inequality Index | 2,820 | 0.48 |
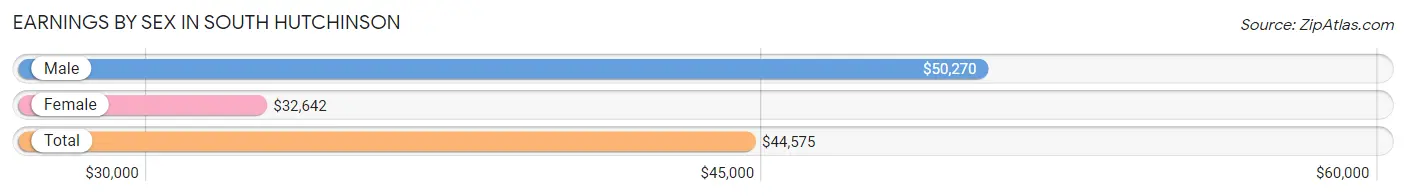
Earnings by Sex in South Hutchinson
Average Earnings in South Hutchinson are $44,575, $50,270 for men and $32,642 for women, a difference of 35.1%.
| Sex | Number | Average Earnings |
| Male | 778 (50.9%) | $50,270 |
| Female | 750 (49.1%) | $32,642 |
| Total | 1,528 (100.0%) | $44,575 |
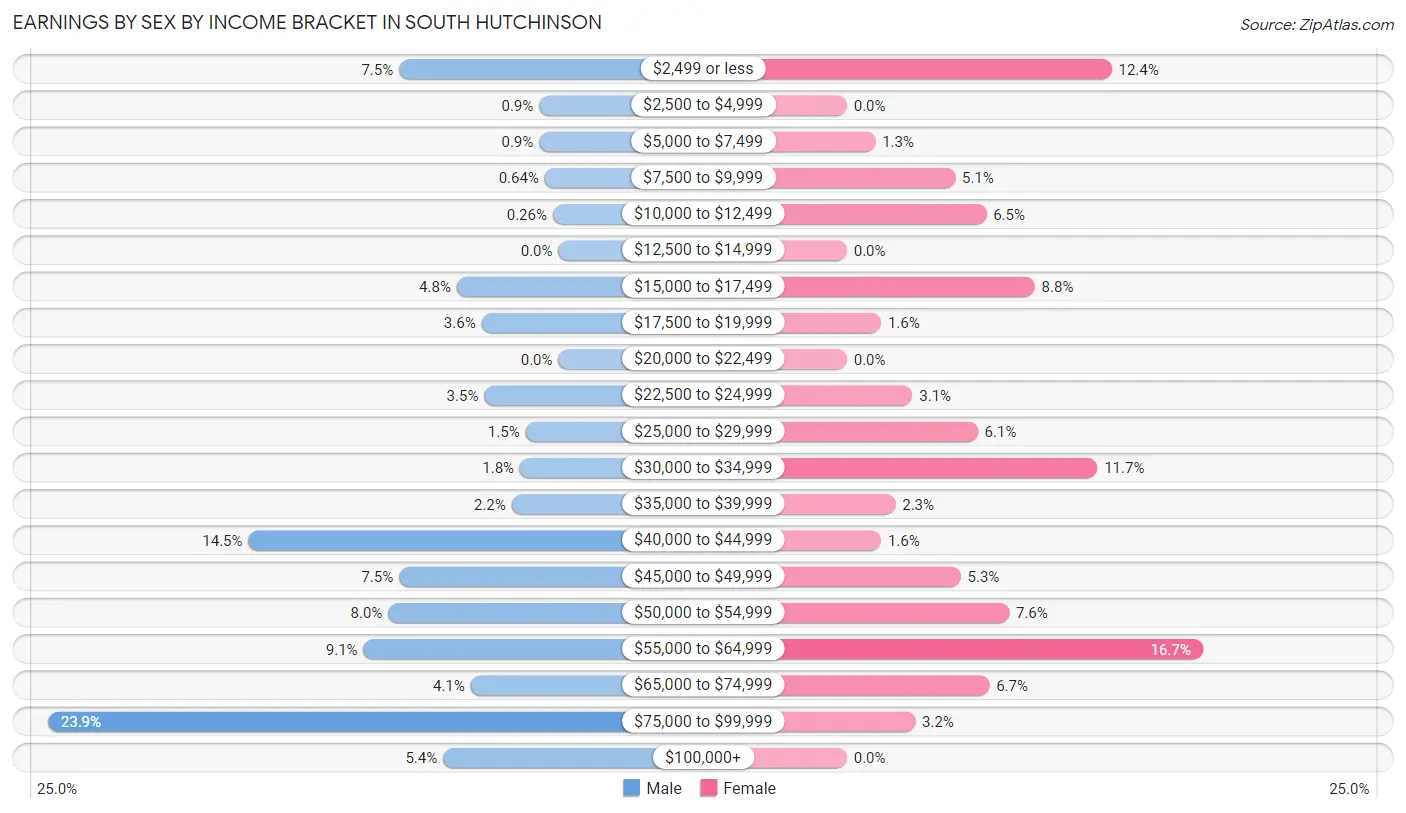
Earnings by Sex by Income Bracket in South Hutchinson
The most common earnings brackets in South Hutchinson are $75,000 to $99,999 for men (186 | 23.9%) and $55,000 to $64,999 for women (125 | 16.7%).
| Income | Male | Female |
| $2,499 or less | 58 (7.5%) | 93 (12.4%) |
| $2,500 to $4,999 | 7 (0.9%) | 0 (0.0%) |
| $5,000 to $7,499 | 7 (0.9%) | 10 (1.3%) |
| $7,500 to $9,999 | 5 (0.6%) | 38 (5.1%) |
| $10,000 to $12,499 | 2 (0.3%) | 49 (6.5%) |
| $12,500 to $14,999 | 0 (0.0%) | 0 (0.0%) |
| $15,000 to $17,499 | 37 (4.8%) | 66 (8.8%) |
| $17,500 to $19,999 | 28 (3.6%) | 12 (1.6%) |
| $20,000 to $22,499 | 0 (0.0%) | 0 (0.0%) |
| $22,500 to $24,999 | 27 (3.5%) | 23 (3.1%) |
| $25,000 to $29,999 | 12 (1.5%) | 46 (6.1%) |
| $30,000 to $34,999 | 14 (1.8%) | 88 (11.7%) |
| $35,000 to $39,999 | 17 (2.2%) | 17 (2.3%) |
| $40,000 to $44,999 | 113 (14.5%) | 12 (1.6%) |
| $45,000 to $49,999 | 58 (7.5%) | 40 (5.3%) |
| $50,000 to $54,999 | 62 (8.0%) | 57 (7.6%) |
| $55,000 to $64,999 | 71 (9.1%) | 125 (16.7%) |
| $65,000 to $74,999 | 32 (4.1%) | 50 (6.7%) |
| $75,000 to $99,999 | 186 (23.9%) | 24 (3.2%) |
| $100,000+ | 42 (5.4%) | 0 (0.0%) |
| Total | 778 (100.0%) | 750 (100.0%) |
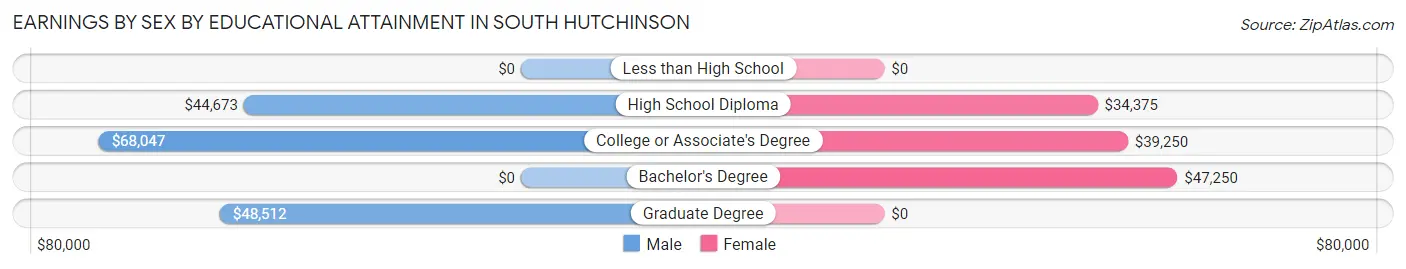
Earnings by Sex by Educational Attainment in South Hutchinson
Average earnings in South Hutchinson are $52,800 for men and $44,583 for women, a difference of 15.6%. Men with an educational attainment of college or associate's degree enjoy the highest average annual earnings of $68,047, while those with high school diploma education earn the least with $44,673. Women with an educational attainment of bachelor's degree earn the most with the average annual earnings of $47,250, while those with high school diploma education have the smallest earnings of $34,375.
| Educational Attainment | Male Income | Female Income |
| Less than High School | - | - |
| High School Diploma | $44,673 | $34,375 |
| College or Associate's Degree | $68,047 | $39,250 |
| Bachelor's Degree | - | - |
| Graduate Degree | $48,512 | $0 |
| Total | $52,800 | $44,583 |
Family Income in South Hutchinson
Family Income Brackets in South Hutchinson
According to the South Hutchinson family income data, there are 165 families falling into the $35,000 to $49,999 income range, which is the most common income bracket and makes up 25.2% of all families.
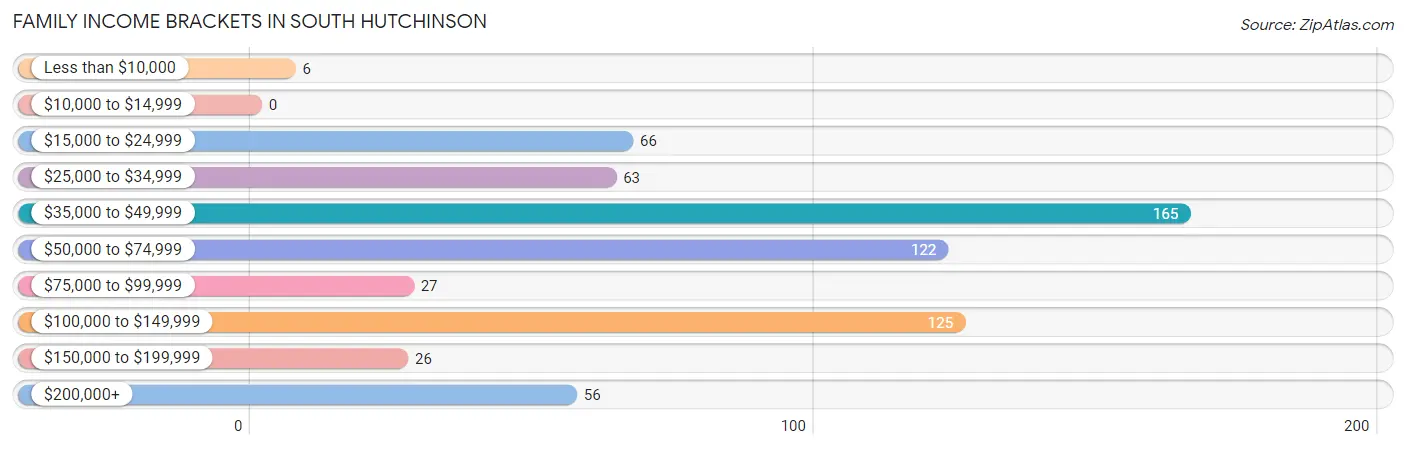
| Income Bracket | # Families | % Families |
| Less than $10,000 | 6 | 0.9% |
| $10,000 to $14,999 | 0 | 0.0% |
| $15,000 to $24,999 | 66 | 10.1% |
| $25,000 to $34,999 | 63 | 9.6% |
| $35,000 to $49,999 | 165 | 25.2% |
| $50,000 to $74,999 | 122 | 18.6% |
| $75,000 to $99,999 | 27 | 4.1% |
| $100,000 to $149,999 | 125 | 19.1% |
| $150,000 to $199,999 | 26 | 4.0% |
| $200,000+ | 56 | 8.5% |
Family Income by Famaliy Size in South Hutchinson
3-person families (66 | 10.1%) account for the highest median family income in South Hutchinson with $120,313 per family, while 3-person families (66 | 10.1%) have the highest median income of $40,104 per family member.
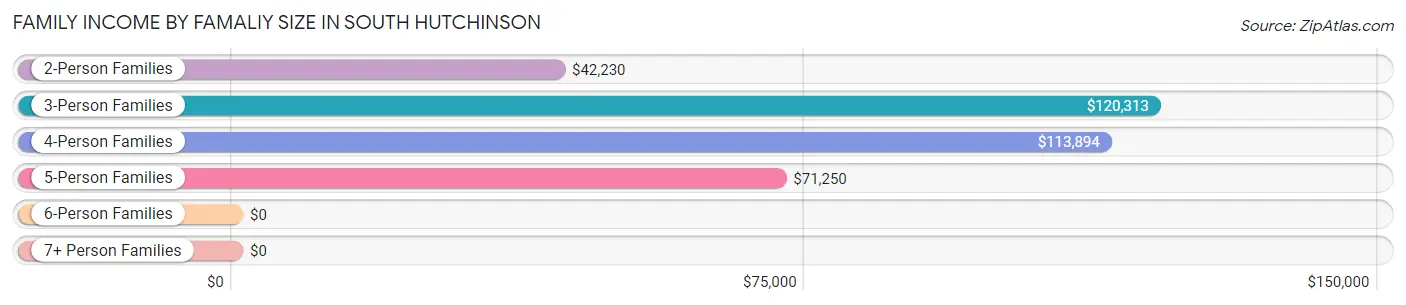
| Income Bracket | # Families | Median Income |
| 2-Person Families | 432 (65.8%) | $42,230 |
| 3-Person Families | 66 (10.1%) | $120,313 |
| 4-Person Families | 121 (18.4%) | $113,894 |
| 5-Person Families | 22 (3.4%) | $71,250 |
| 6-Person Families | 1 (0.2%) | $0 |
| 7+ Person Families | 14 (2.1%) | $0 |
| Total | 656 (100.0%) | $63,043 |
Family Income by Number of Earners in South Hutchinson
The median family income in South Hutchinson is $63,043, with families comprising 3+ earners (106) having the highest median family income of $250,001, while families with 1 earner (128) have the lowest median family income of $29,934, accounting for 16.2% and 19.5% of families, respectively.
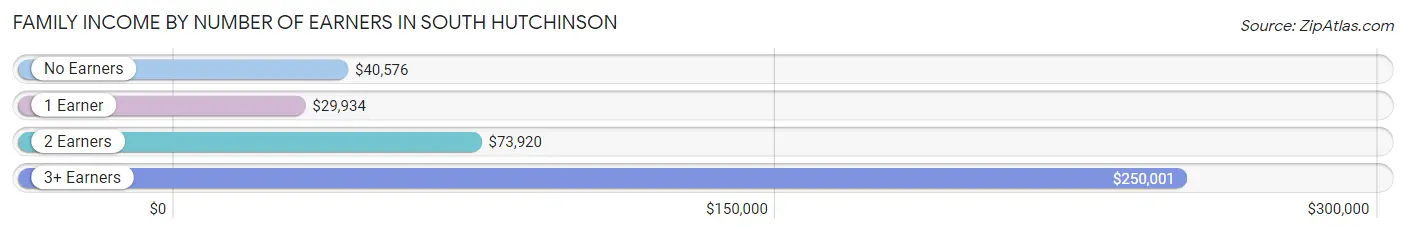
| Number of Earners | # Families | Median Income |
| No Earners | 173 (26.4%) | $40,576 |
| 1 Earner | 128 (19.5%) | $29,934 |
| 2 Earners | 249 (38.0%) | $73,920 |
| 3+ Earners | 106 (16.2%) | $250,001 |
| Total | 656 (100.0%) | $63,043 |
Household Income in South Hutchinson
Household Income Brackets in South Hutchinson
With 226 households falling in the category, the $35,000 to $49,999 income range is the most frequent in South Hutchinson, accounting for 17.7% of all households. In contrast, only 28 households (2.2%) fall into the less than $10,000 income bracket, making it the least populous group.
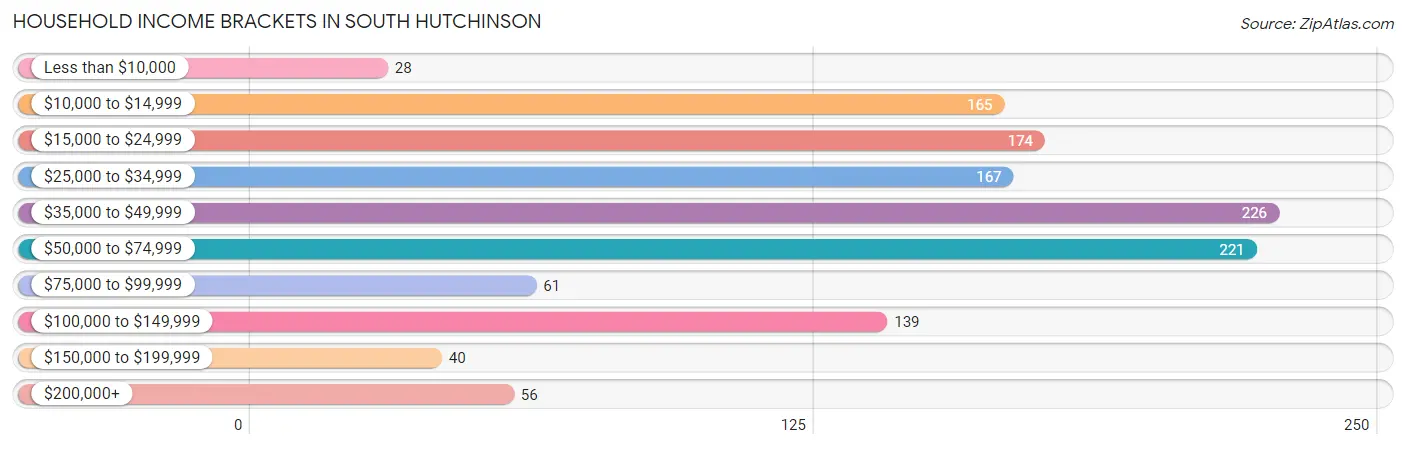
| Income Bracket | # Households | % Households |
| Less than $10,000 | 28 | 2.2% |
| $10,000 to $14,999 | 165 | 12.9% |
| $15,000 to $24,999 | 174 | 13.6% |
| $25,000 to $34,999 | 167 | 13.1% |
| $35,000 to $49,999 | 226 | 17.7% |
| $50,000 to $74,999 | 221 | 17.3% |
| $75,000 to $99,999 | 61 | 4.8% |
| $100,000 to $149,999 | 139 | 10.9% |
| $150,000 to $199,999 | 40 | 3.1% |
| $200,000+ | 56 | 4.4% |
Household Income by Householder Age in South Hutchinson
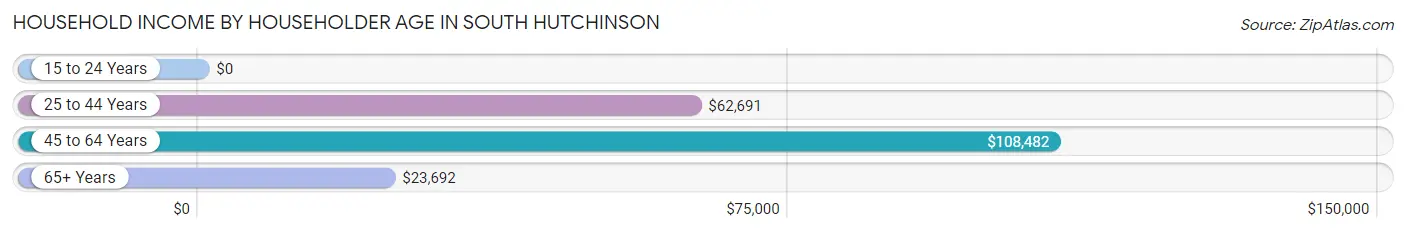
The median household income in South Hutchinson is $41,936, with the highest median household income of $108,482 found in the 45 to 64 years age bracket for the primary householder. A total of 317 households (24.8%) fall into this category. Meanwhile, the 15 to 24 years age bracket for the primary householder has the lowest median household income of $0, with 9 households (0.7%) in this group.
| Income Bracket | # Households | Median Income |
| 15 to 24 Years | 9 (0.7%) | $0 |
| 25 to 44 Years | 405 (31.7%) | $62,691 |
| 45 to 64 Years | 317 (24.8%) | $108,482 |
| 65+ Years | 545 (42.7%) | $23,692 |
| Total | 1,276 (100.0%) | $41,936 |
Poverty in South Hutchinson
Income Below Poverty by Sex and Age in South Hutchinson
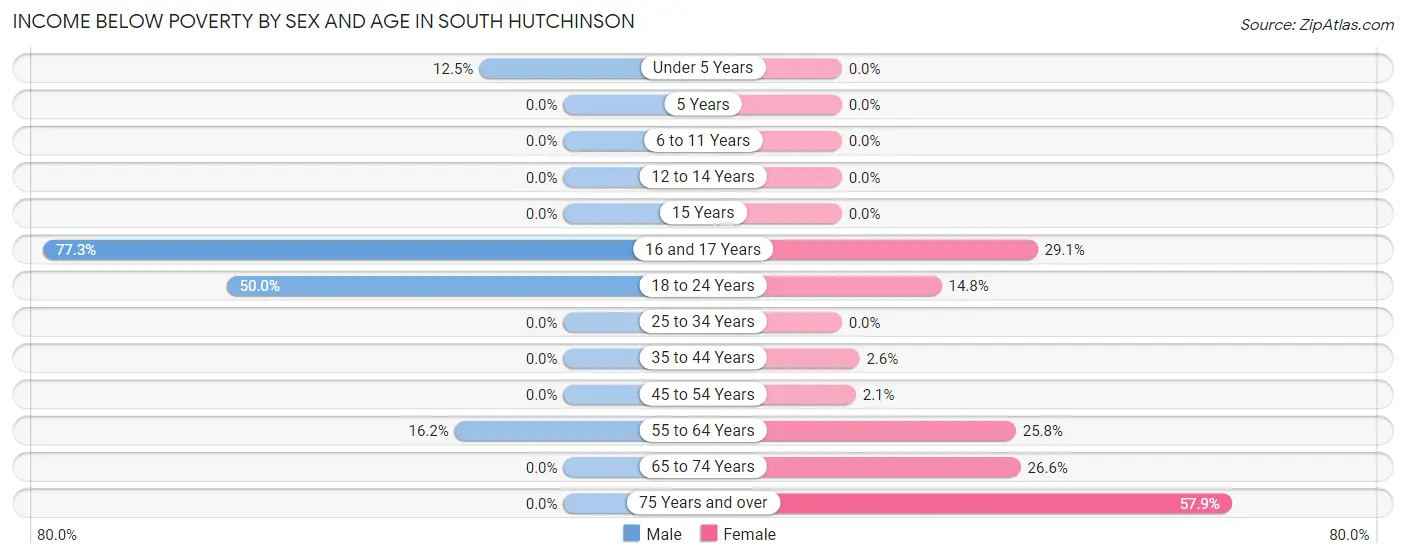
With 6.5% poverty level for males and 17.9% for females among the residents of South Hutchinson, 16 and 17 year old males and 75 year old and over females are the most vulnerable to poverty, with 17 males (77.3%) and 99 females (57.9%) in their respective age groups living below the poverty level.
| Age Bracket | Male | Female |
| Under 5 Years | 7 (12.5%) | 0 (0.0%) |
| 5 Years | 0 (0.0%) | 0 (0.0%) |
| 6 to 11 Years | 0 (0.0%) | 0 (0.0%) |
| 12 to 14 Years | 0 (0.0%) | 0 (0.0%) |
| 15 Years | 0 (0.0%) | 0 (0.0%) |
| 16 and 17 Years | 17 (77.3%) | 41 (29.1%) |
| 18 to 24 Years | 34 (50.0%) | 8 (14.8%) |
| 25 to 34 Years | 0 (0.0%) | 0 (0.0%) |
| 35 to 44 Years | 0 (0.0%) | 6 (2.6%) |
| 45 to 54 Years | 0 (0.0%) | 4 (2.1%) |
| 55 to 64 Years | 26 (16.2%) | 46 (25.8%) |
| 65 to 74 Years | 0 (0.0%) | 51 (26.6%) |
| 75 Years and over | 0 (0.0%) | 99 (57.9%) |
| Total | 84 (6.5%) | 255 (17.9%) |
Income Above Poverty by Sex and Age in South Hutchinson
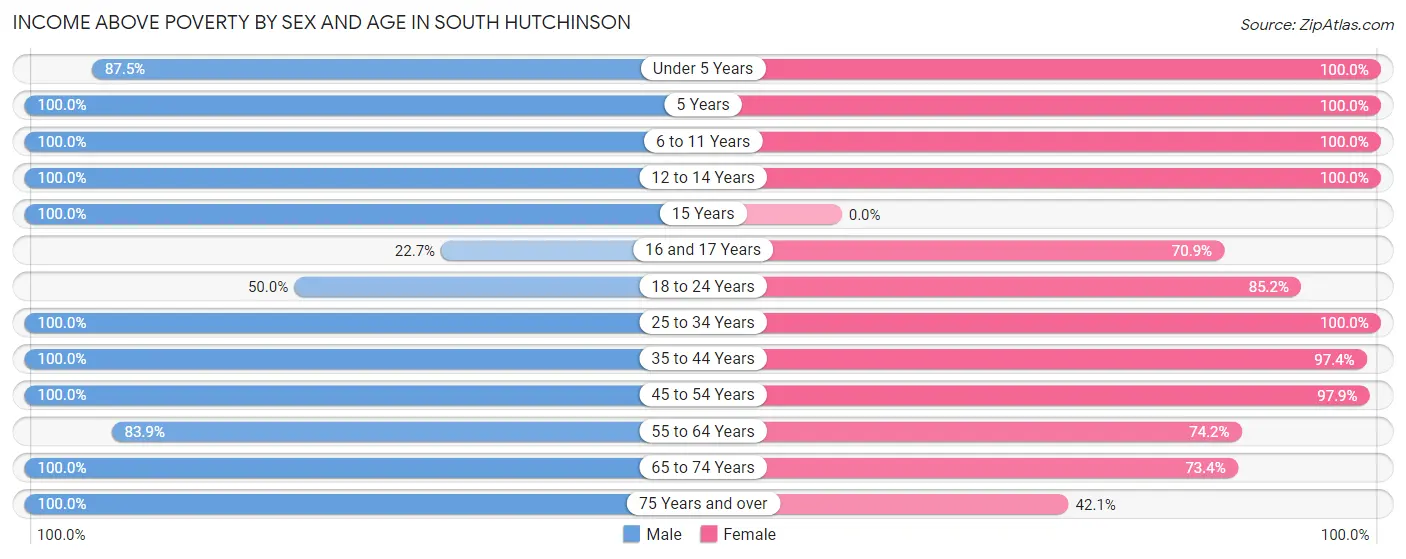
According to the poverty statistics in South Hutchinson, males aged 5 years and females aged under 5 years are the age groups that are most secure financially, with 100.0% of males and 100.0% of females in these age groups living above the poverty line.
| Age Bracket | Male | Female |
| Under 5 Years | 49 (87.5%) | 11 (100.0%) |
| 5 Years | 12 (100.0%) | 36 (100.0%) |
| 6 to 11 Years | 66 (100.0%) | 67 (100.0%) |
| 12 to 14 Years | 35 (100.0%) | 5 (100.0%) |
| 15 Years | 10 (100.0%) | 0 (0.0%) |
| 16 and 17 Years | 5 (22.7%) | 100 (70.9%) |
| 18 to 24 Years | 34 (50.0%) | 46 (85.2%) |
| 25 to 34 Years | 269 (100.0%) | 147 (100.0%) |
| 35 to 44 Years | 185 (100.0%) | 222 (97.4%) |
| 45 to 54 Years | 73 (100.0%) | 188 (97.9%) |
| 55 to 64 Years | 135 (83.9%) | 132 (74.2%) |
| 65 to 74 Years | 149 (100.0%) | 141 (73.4%) |
| 75 Years and over | 179 (100.0%) | 72 (42.1%) |
| Total | 1,201 (93.5%) | 1,167 (82.1%) |
Income Below Poverty Among Married-Couple Families in South Hutchinson
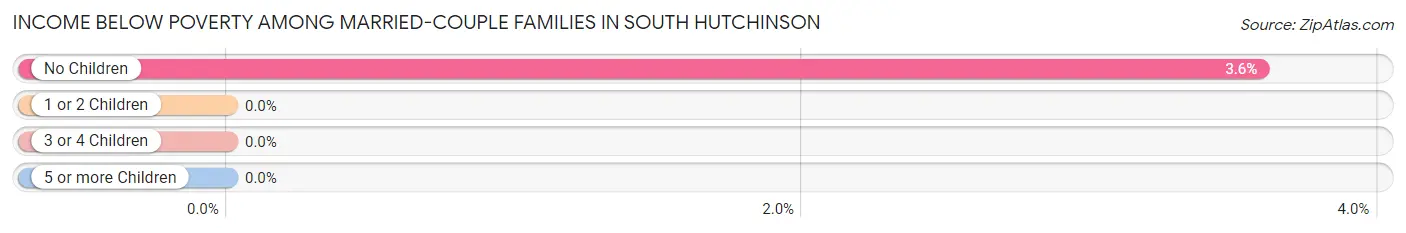
The poverty statistics for married-couple families in South Hutchinson show that 2.4% or 12 of the total 495 families live below the poverty line. Families with no children have the highest poverty rate of 3.6%, comprising of 12 families. On the other hand, families with 1 or 2 children have the lowest poverty rate of 0.0%, which includes 0 families.
| Children | Above Poverty | Below Poverty |
| No Children | 322 (96.4%) | 12 (3.6%) |
| 1 or 2 Children | 138 (100.0%) | 0 (0.0%) |
| 3 or 4 Children | 23 (100.0%) | 0 (0.0%) |
| 5 or more Children | 0 (0.0%) | 0 (0.0%) |
| Total | 483 (97.6%) | 12 (2.4%) |
Income Below Poverty Among Single-Parent Households in South Hutchinson
According to the poverty data in South Hutchinson, 81.8% or 9 single-father households and 8.7% or 13 single-mother households are living below the poverty line. Among single-father households, those with 1 or 2 children have the highest poverty rate, with 9 households (81.8%) experiencing poverty. Likewise, among single-mother households, those with 1 or 2 children have the highest poverty rate, with 13 households (9.6%) falling below the poverty line.
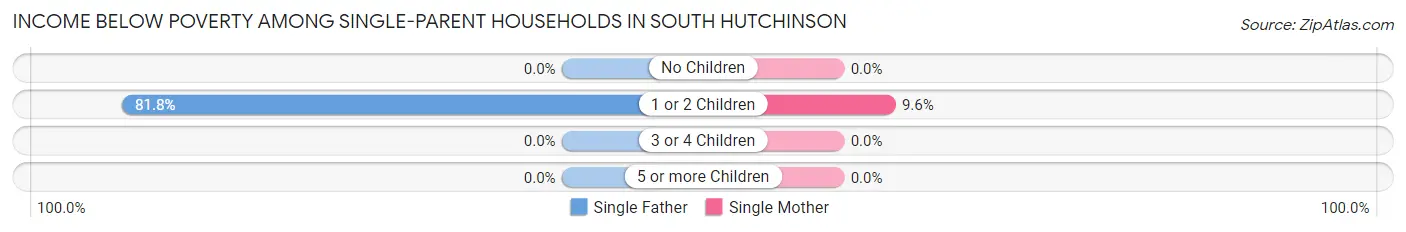
| Children | Single Father | Single Mother |
| No Children | 0 (0.0%) | 0 (0.0%) |
| 1 or 2 Children | 9 (81.8%) | 13 (9.6%) |
| 3 or 4 Children | 0 (0.0%) | 0 (0.0%) |
| 5 or more Children | 0 (0.0%) | 0 (0.0%) |
| Total | 9 (81.8%) | 13 (8.7%) |
Income Below Poverty Among Married-Couple vs Single-Parent Households in South Hutchinson
The poverty data for South Hutchinson shows that 12 of the married-couple family households (2.4%) and 22 of the single-parent households (13.7%) are living below the poverty level. Within the married-couple family households, those with no children have the highest poverty rate, with 12 households (3.6%) falling below the poverty line. Among the single-parent households, those with 1 or 2 children have the highest poverty rate, with 22 household (15.0%) living below poverty.
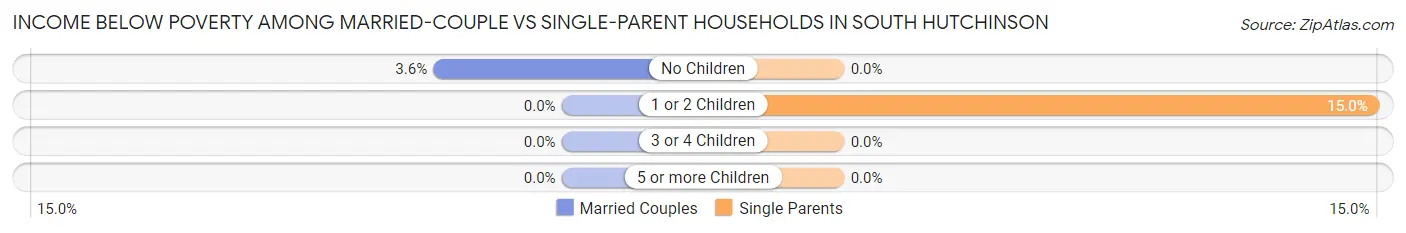
| Children | Married-Couple Families | Single-Parent Households |
| No Children | 12 (3.6%) | 0 (0.0%) |
| 1 or 2 Children | 0 (0.0%) | 22 (15.0%) |
| 3 or 4 Children | 0 (0.0%) | 0 (0.0%) |
| 5 or more Children | 0 (0.0%) | 0 (0.0%) |
| Total | 12 (2.4%) | 22 (13.7%) |
Race in South Hutchinson
The most populous races in South Hutchinson are White / Caucasian (2,416 | 85.7%), Hawaiian / Pacific (227 | 8.1%), and Hispanic or Latino (103 | 3.6%).
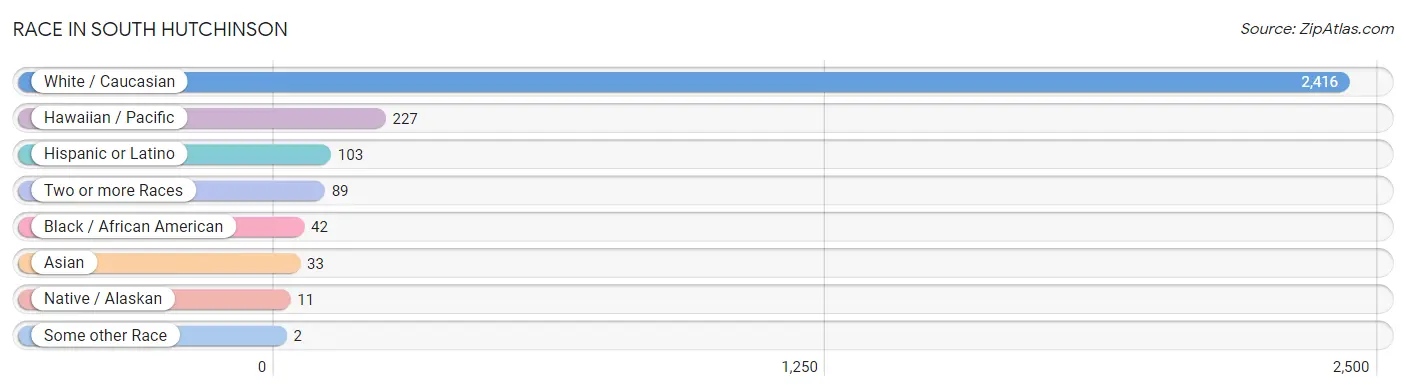
| Race | # Population | % Population |
| Asian | 33 | 1.2% |
| Black / African American | 42 | 1.5% |
| Hawaiian / Pacific | 227 | 8.1% |
| Hispanic or Latino | 103 | 3.6% |
| Native / Alaskan | 11 | 0.4% |
| White / Caucasian | 2,416 | 85.7% |
| Two or more Races | 89 | 3.2% |
| Some other Race | 2 | 0.1% |
| Total | 2,820 | 100.0% |
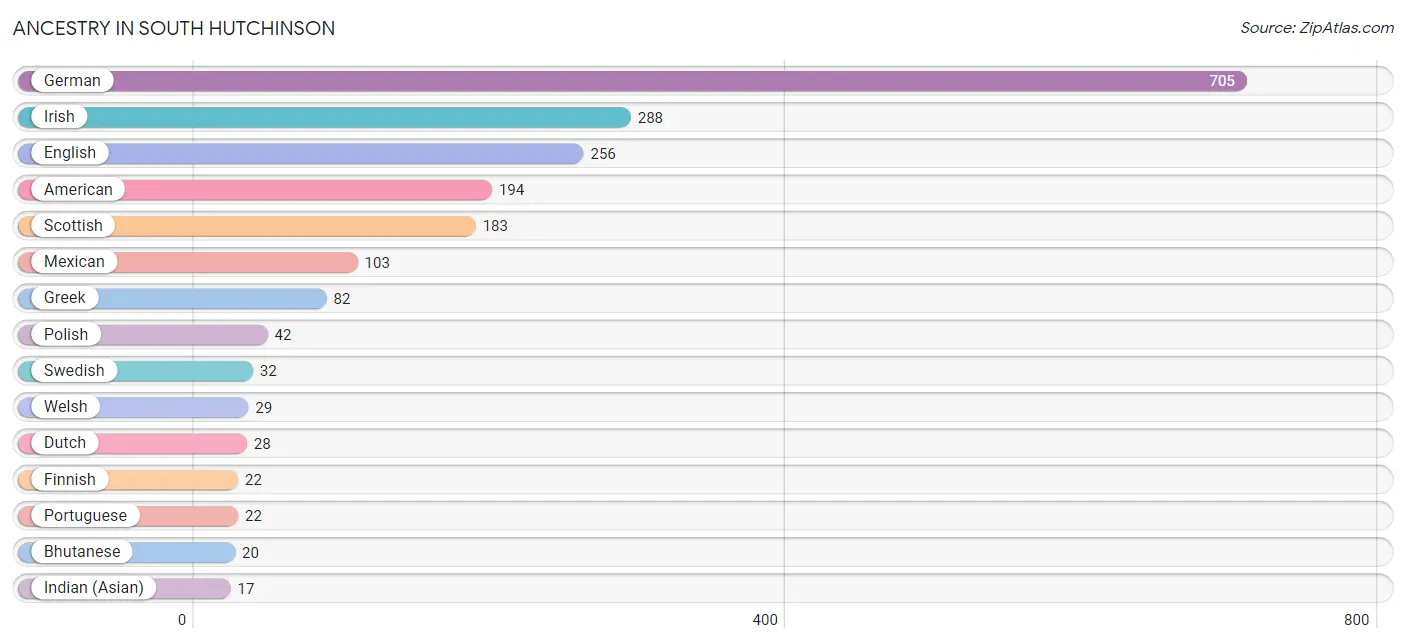
Ancestry in South Hutchinson
The most populous ancestries reported in South Hutchinson are German (705 | 25.0%), Irish (288 | 10.2%), English (256 | 9.1%), American (194 | 6.9%), and Scottish (183 | 6.5%), together accounting for 57.7% of all South Hutchinson residents.
| Ancestry | # Population | % Population |
| African | 5 | 0.2% |
| American | 194 | 6.9% |
| Apache | 7 | 0.3% |
| Bhutanese | 20 | 0.7% |
| Cherokee | 4 | 0.1% |
| Delaware | 9 | 0.3% |
| Dutch | 28 | 1.0% |
| English | 256 | 9.1% |
| European | 10 | 0.4% |
| Finnish | 22 | 0.8% |
| French | 11 | 0.4% |
| German | 705 | 25.0% |
| Greek | 82 | 2.9% |
| Indian (Asian) | 17 | 0.6% |
| Irish | 288 | 10.2% |
| Iroquois | 1 | 0.0% |
| Italian | 13 | 0.5% |
| Mexican | 103 | 3.6% |
| Northern European | 16 | 0.6% |
| Pennsylvania German | 6 | 0.2% |
| Polish | 42 | 1.5% |
| Portuguese | 22 | 0.8% |
| Russian | 6 | 0.2% |
| Scandinavian | 17 | 0.6% |
| Scotch-Irish | 8 | 0.3% |
| Scottish | 183 | 6.5% |
| Sioux | 11 | 0.4% |
| Slovak | 13 | 0.5% |
| Sri Lankan | 16 | 0.6% |
| Subsaharan African | 5 | 0.2% |
| Swedish | 32 | 1.1% |
| Swiss | 13 | 0.5% |
| Welsh | 29 | 1.0% | View All 33 Rows |
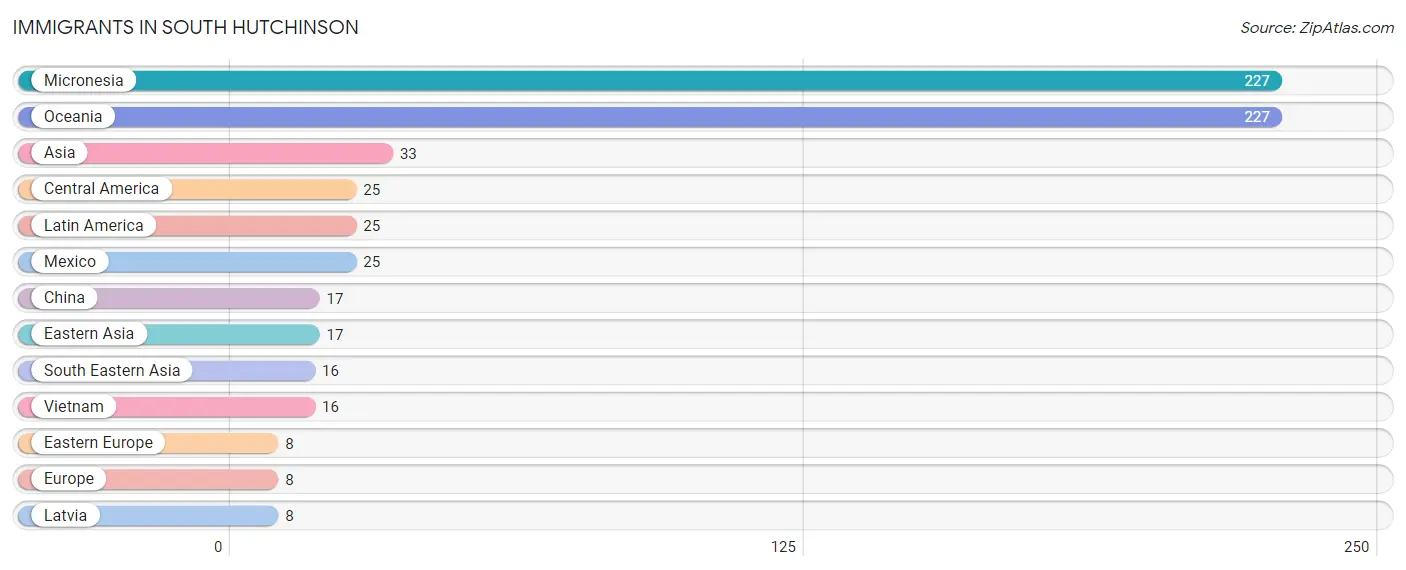
Immigrants in South Hutchinson
The most numerous immigrant groups reported in South Hutchinson came from Micronesia (227 | 8.1%), Oceania (227 | 8.1%), Asia (33 | 1.2%), Central America (25 | 0.9%), and Latin America (25 | 0.9%), together accounting for 19.0% of all South Hutchinson residents.
| Immigration Origin | # Population | % Population |
| Asia | 33 | 1.2% |
| Central America | 25 | 0.9% |
| China | 17 | 0.6% |
| Eastern Asia | 17 | 0.6% |
| Eastern Europe | 8 | 0.3% |
| Europe | 8 | 0.3% |
| Latin America | 25 | 0.9% |
| Latvia | 8 | 0.3% |
| Mexico | 25 | 0.9% |
| Micronesia | 227 | 8.1% |
| Oceania | 227 | 8.1% |
| South Eastern Asia | 16 | 0.6% |
| Vietnam | 16 | 0.6% | View All 13 Rows |
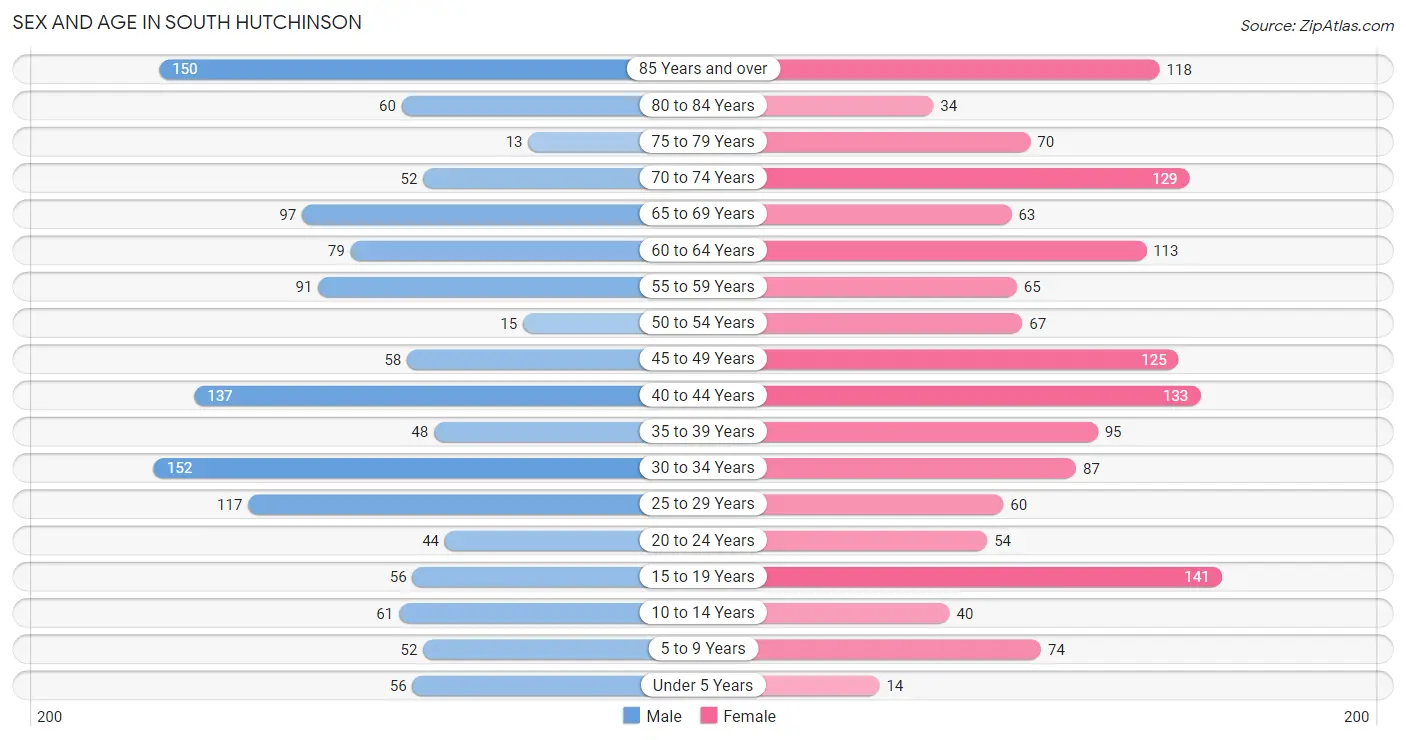
Sex and Age in South Hutchinson
Sex and Age in South Hutchinson
The most populous age groups in South Hutchinson are 30 to 34 Years (152 | 11.4%) for men and 15 to 19 Years (141 | 9.5%) for women.
| Age Bracket | Male | Female |
| Under 5 Years | 56 (4.2%) | 14 (0.9%) |
| 5 to 9 Years | 52 (3.9%) | 74 (5.0%) |
| 10 to 14 Years | 61 (4.6%) | 40 (2.7%) |
| 15 to 19 Years | 56 (4.2%) | 141 (9.5%) |
| 20 to 24 Years | 44 (3.3%) | 54 (3.6%) |
| 25 to 29 Years | 117 (8.7%) | 60 (4.1%) |
| 30 to 34 Years | 152 (11.4%) | 87 (5.9%) |
| 35 to 39 Years | 48 (3.6%) | 95 (6.4%) |
| 40 to 44 Years | 137 (10.2%) | 133 (9.0%) |
| 45 to 49 Years | 58 (4.3%) | 125 (8.4%) |
| 50 to 54 Years | 15 (1.1%) | 67 (4.5%) |
| 55 to 59 Years | 91 (6.8%) | 65 (4.4%) |
| 60 to 64 Years | 79 (5.9%) | 113 (7.6%) |
| 65 to 69 Years | 97 (7.2%) | 63 (4.3%) |
| 70 to 74 Years | 52 (3.9%) | 129 (8.7%) |
| 75 to 79 Years | 13 (1.0%) | 70 (4.7%) |
| 80 to 84 Years | 60 (4.5%) | 34 (2.3%) |
| 85 Years and over | 150 (11.2%) | 118 (8.0%) |
| Total | 1,338 (100.0%) | 1,482 (100.0%) |
Families and Households in South Hutchinson
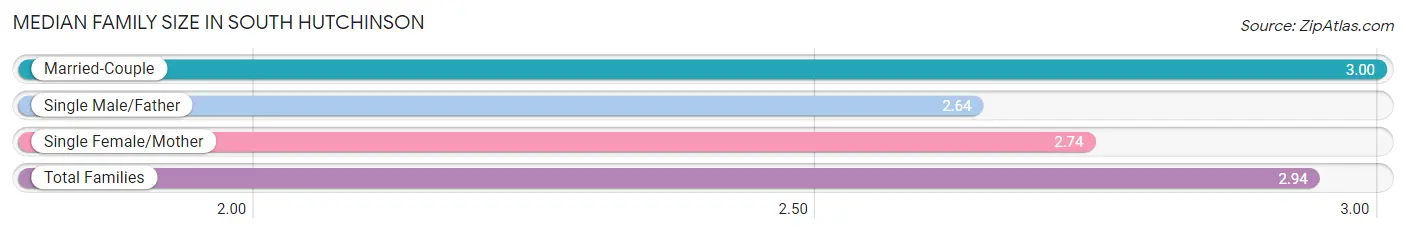
Median Family Size in South Hutchinson
The median family size in South Hutchinson is 2.94 persons per family, with married-couple families (495 | 75.5%) accounting for the largest median family size of 3 persons per family. On the other hand, single male/father families (11 | 1.7%) represent the smallest median family size with 2.64 persons per family.
| Family Type | # Families | Family Size |
| Married-Couple | 495 (75.5%) | 3.00 |
| Single Male/Father | 11 (1.7%) | 2.64 |
| Single Female/Mother | 150 (22.9%) | 2.74 |
| Total Families | 656 (100.0%) | 2.94 |
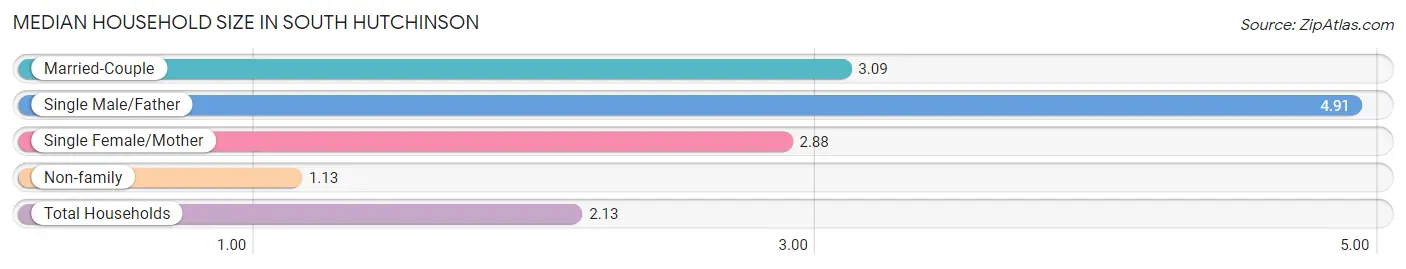
Median Household Size in South Hutchinson
The median household size in South Hutchinson is 2.13 persons per household, with single male/father households (11 | 0.9%) accounting for the largest median household size of 4.91 persons per household. non-family households (620 | 48.6%) represent the smallest median household size with 1.13 persons per household.
| Household Type | # Households | Household Size |
| Married-Couple | 495 (38.8%) | 3.09 |
| Single Male/Father | 11 (0.9%) | 4.91 |
| Single Female/Mother | 150 (11.8%) | 2.88 |
| Non-family | 620 (48.6%) | 1.13 |
| Total Households | 1,276 (100.0%) | 2.13 |
Household Size by Marriage Status in South Hutchinson
Out of a total of 1,276 households in South Hutchinson, 656 (51.4%) are family households, while 620 (48.6%) are nonfamily households. The most numerous type of family households are 2-person households, comprising 413, and the most common type of nonfamily households are 1-person households, comprising 554.
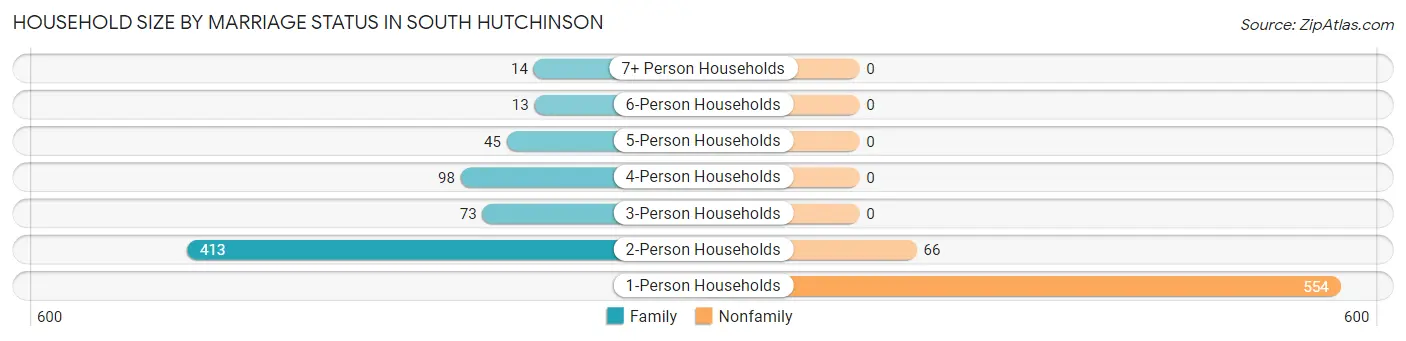
| Household Size | Family Households | Nonfamily Households |
| 1-Person Households | - | 554 (43.4%) |
| 2-Person Households | 413 (32.4%) | 66 (5.2%) |
| 3-Person Households | 73 (5.7%) | 0 (0.0%) |
| 4-Person Households | 98 (7.7%) | 0 (0.0%) |
| 5-Person Households | 45 (3.5%) | 0 (0.0%) |
| 6-Person Households | 13 (1.0%) | 0 (0.0%) |
| 7+ Person Households | 14 (1.1%) | 0 (0.0%) |
| Total | 656 (51.4%) | 620 (48.6%) |
Female Fertility in South Hutchinson
Fertility by Age in South Hutchinson
Average fertility rate in South Hutchinson is 137.0 births per 1,000 women. Women in the age bracket of 35 to 50 years have the highest fertility rate with 246.0 births per 1,000 women. Women in the age bracket of 35 to 50 years acount for 91.6% of all women with births.
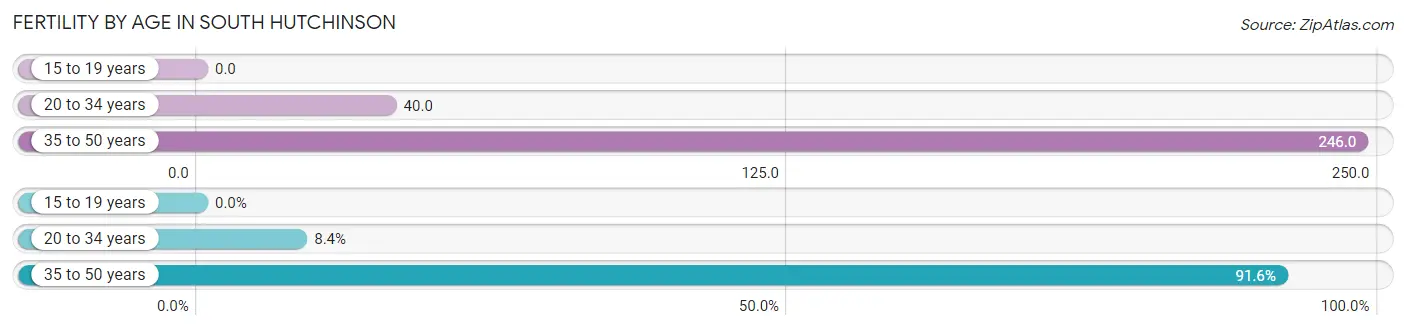
| Age Bracket | Women with Births | Births / 1,000 Women |
| 15 to 19 years | 0 (0.0%) | 0.0 |
| 20 to 34 years | 8 (8.4%) | 40.0 |
| 35 to 50 years | 87 (91.6%) | 246.0 |
| Total | 95 (100.0%) | 137.0 |
Fertility by Age by Marriage Status in South Hutchinson
91.6% of women with births (95) in South Hutchinson are married. The highest percentage of unmarried women with births falls into 20 to 34 years age bracket with 100.0% of them unmarried at the time of birth, while the lowest percentage of unmarried women with births belong to 35 to 50 years age bracket with 0.0% of them unmarried.
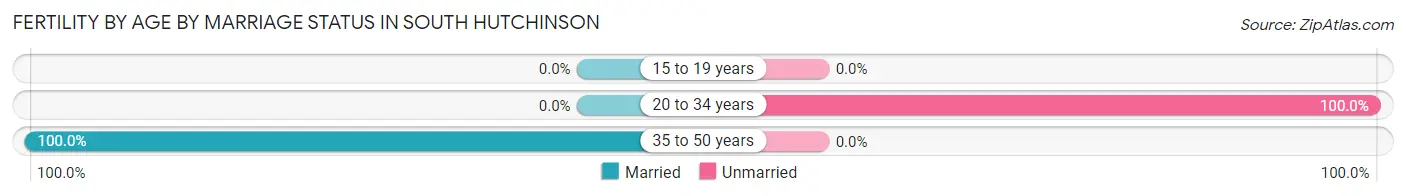
| Age Bracket | Married | Unmarried |
| 15 to 19 years | 0 (0.0%) | 0 (0.0%) |
| 20 to 34 years | 0 (0.0%) | 8 (100.0%) |
| 35 to 50 years | 87 (100.0%) | 0 (0.0%) |
| Total | 87 (91.6%) | 8 (8.4%) |
Fertility by Education in South Hutchinson
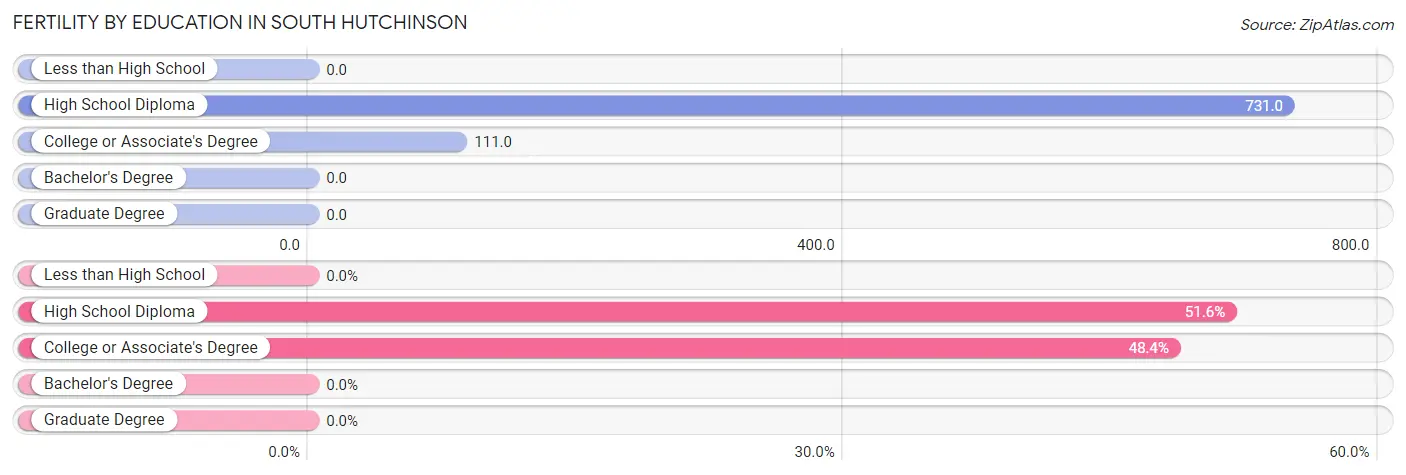
| Educational Attainment | Women with Births | Births / 1,000 Women |
| Less than High School | 0 (0.0%) | 0.0 |
| High School Diploma | 49 (51.6%) | 731.0 |
| College or Associate's Degree | 46 (48.4%) | 111.0 |
| Bachelor's Degree | 0 (0.0%) | 0.0 |
| Graduate Degree | 0 (0.0%) | 0.0 |
| Total | 95 (100.0%) | 137.0 |
Fertility by Education by Marriage Status in South Hutchinson
8.4% of women with births in South Hutchinson are unmarried. Women with the educational attainment of college or associate's degree are most likely to be married with 100.0% of them married at childbirth, while women with the educational attainment of high school diploma are least likely to be married with 16.3% of them unmarried at childbirth.
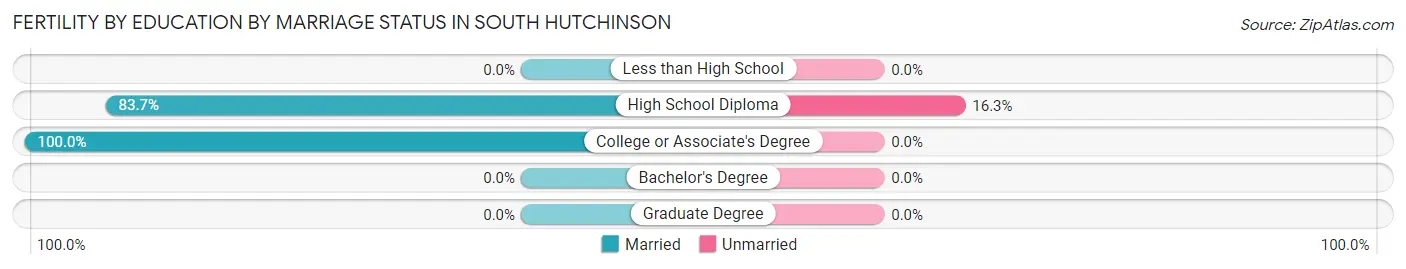
| Educational Attainment | Married | Unmarried |
| Less than High School | 0 (0.0%) | 0 (0.0%) |
| High School Diploma | 41 (83.7%) | 8 (16.3%) |
| College or Associate's Degree | 46 (100.0%) | 0 (0.0%) |
| Bachelor's Degree | 0 (0.0%) | 0 (0.0%) |
| Graduate Degree | 0 (0.0%) | 0 (0.0%) |
| Total | 87 (91.6%) | 8 (8.4%) |
Employment Characteristics in South Hutchinson
Employment by Class of Employer in South Hutchinson
Among the 1,339 employed individuals in South Hutchinson, private company employees (1,060 | 79.2%), self-employed (not incorporated) (75 | 5.6%), and local government employees (66 | 4.9%) make up the most common classes of employment.
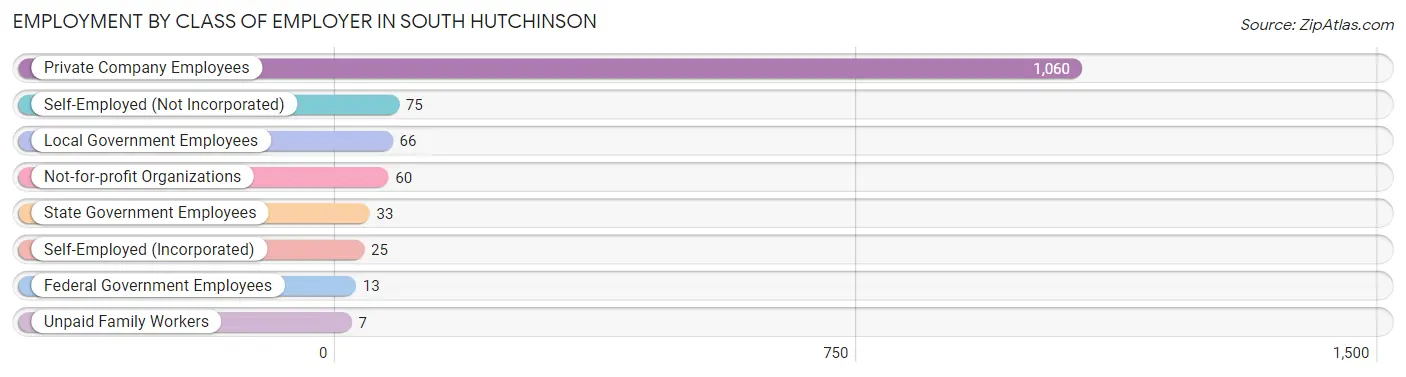
| Employer Class | # Employees | % Employees |
| Private Company Employees | 1,060 | 79.2% |
| Self-Employed (Incorporated) | 25 | 1.9% |
| Self-Employed (Not Incorporated) | 75 | 5.6% |
| Not-for-profit Organizations | 60 | 4.5% |
| Local Government Employees | 66 | 4.9% |
| State Government Employees | 33 | 2.5% |
| Federal Government Employees | 13 | 1.0% |
| Unpaid Family Workers | 7 | 0.5% |
| Total | 1,339 | 100.0% |
Employment Status by Age in South Hutchinson
According to the labor force statistics for South Hutchinson, out of the total population over 16 years of age (2,513), 56.3% or 1,415 individuals are in the labor force, with 4.2% or 59 of them unemployed. The age group with the highest labor force participation rate is 25 to 29 years, with 100.0% or 177 individuals in the labor force. Within the labor force, the 55 to 59 years age range has the highest percentage of unemployed individuals, with 15.0% or 16 of them being unemployed.
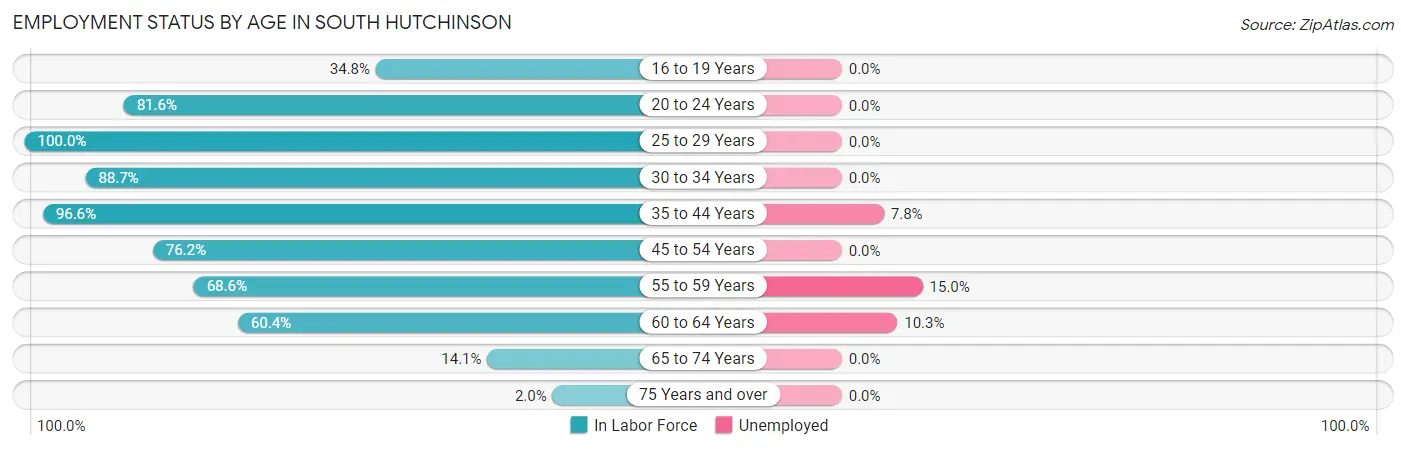
| Age Bracket | In Labor Force | Unemployed |
| 16 to 19 Years | 65 (34.8%) | 0 (0.0%) |
| 20 to 24 Years | 80 (81.6%) | 0 (0.0%) |
| 25 to 29 Years | 177 (100.0%) | 0 (0.0%) |
| 30 to 34 Years | 212 (88.7%) | 0 (0.0%) |
| 35 to 44 Years | 399 (96.6%) | 31 (7.8%) |
| 45 to 54 Years | 202 (76.2%) | 0 (0.0%) |
| 55 to 59 Years | 107 (68.6%) | 16 (15.0%) |
| 60 to 64 Years | 116 (60.4%) | 12 (10.3%) |
| 65 to 74 Years | 48 (14.1%) | 0 (0.0%) |
| 75 Years and over | 9 (2.0%) | 0 (0.0%) |
| Total | 1,415 (56.3%) | 59 (4.2%) |
Employment Status by Educational Attainment in South Hutchinson
According to labor force statistics for South Hutchinson, 84.1% of individuals (1,213) out of the total population between 25 and 64 years of age (1,442) are in the labor force, with 4.9% or 59 of them being unemployed. The group with the highest labor force participation rate are those with the educational attainment of college / associate degree, with 91.3% or 695 individuals in the labor force. Within the labor force, individuals with college / associate degree education have the highest percentage of unemployment, with 8.5% or 59 of them being unemployed.
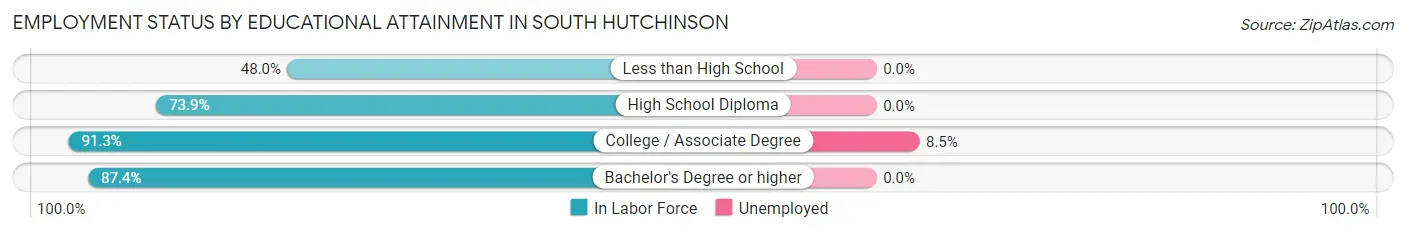
| Educational Attainment | In Labor Force | Unemployed |
| Less than High School | 24 (48.0%) | 0 (0.0%) |
| High School Diploma | 314 (73.9%) | 0 (0.0%) |
| College / Associate Degree | 695 (91.3%) | 65 (8.5%) |
| Bachelor's Degree or higher | 180 (87.4%) | 0 (0.0%) |
| Total | 1,213 (84.1%) | 71 (4.9%) |
Employment Occupations by Sex in South Hutchinson
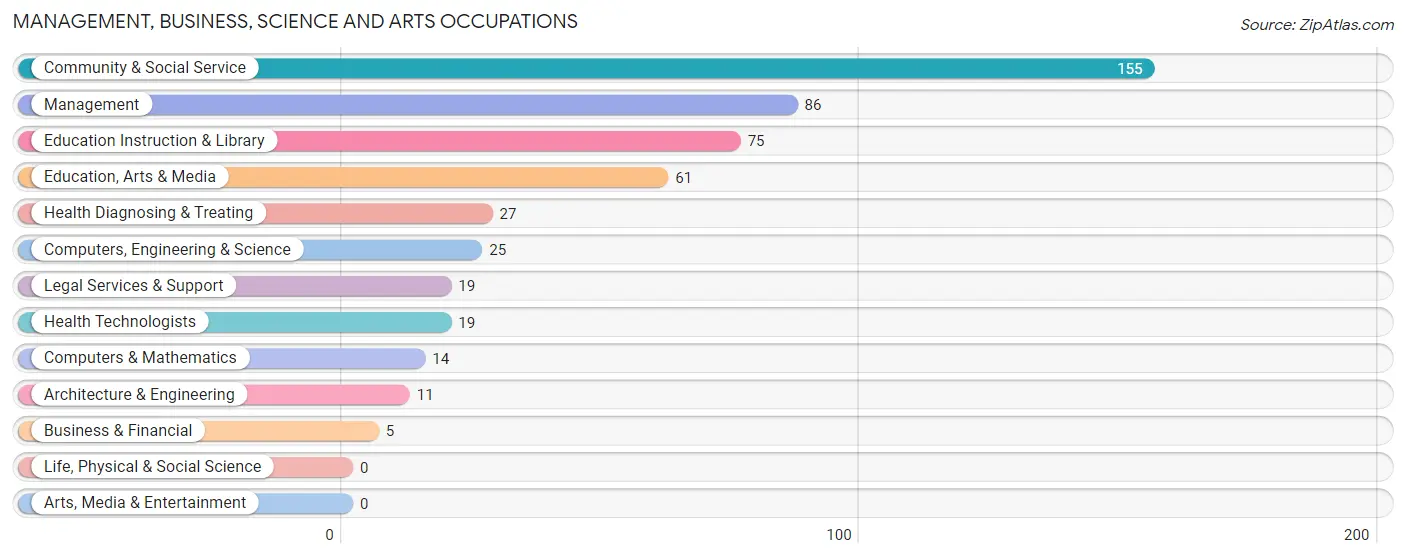
Management, Business, Science and Arts Occupations
The most common Management, Business, Science and Arts occupations in South Hutchinson are Community & Social Service (155 | 11.4%), Management (86 | 6.3%), Education Instruction & Library (75 | 5.5%), Education, Arts & Media (61 | 4.5%), and Health Diagnosing & Treating (27 | 2.0%).
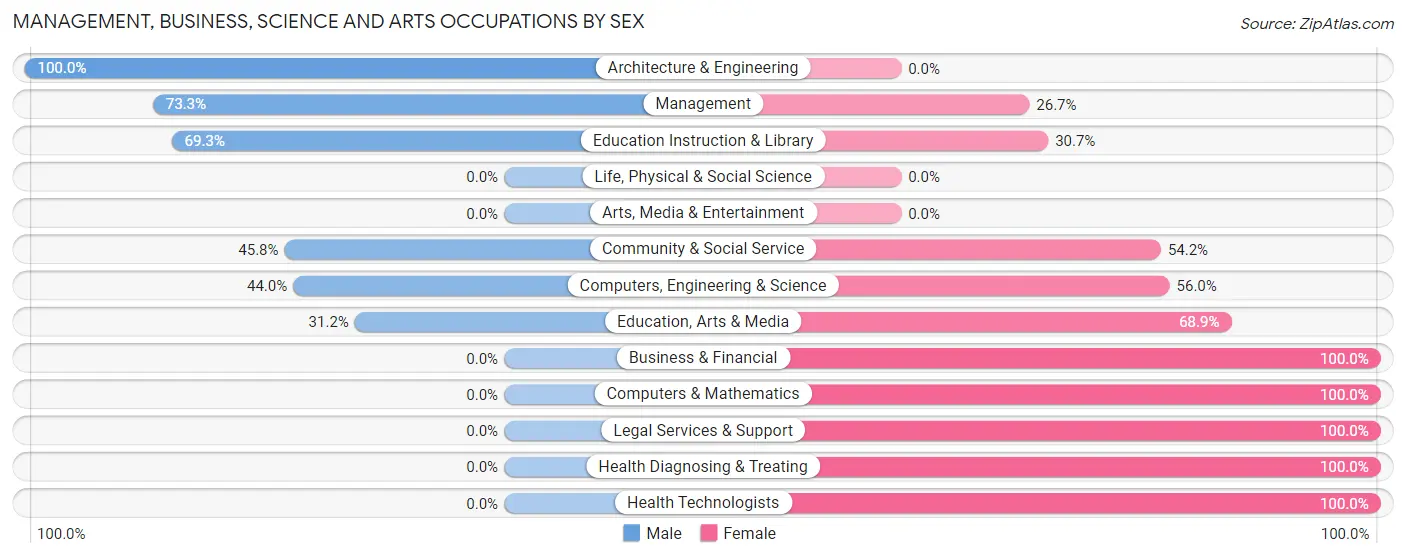
Management, Business, Science and Arts Occupations by Sex
Within the Management, Business, Science and Arts occupations in South Hutchinson, the most male-oriented occupations are Architecture & Engineering (100.0%), Management (73.3%), and Education Instruction & Library (69.3%), while the most female-oriented occupations are Business & Financial (100.0%), Computers & Mathematics (100.0%), and Legal Services & Support (100.0%).
| Occupation | Male | Female |
| Management | 63 (73.3%) | 23 (26.7%) |
| Business & Financial | 0 (0.0%) | 5 (100.0%) |
| Computers, Engineering & Science | 11 (44.0%) | 14 (56.0%) |
| Computers & Mathematics | 0 (0.0%) | 14 (100.0%) |
| Architecture & Engineering | 11 (100.0%) | 0 (0.0%) |
| Life, Physical & Social Science | 0 (0.0%) | 0 (0.0%) |
| Community & Social Service | 71 (45.8%) | 84 (54.2%) |
| Education, Arts & Media | 19 (31.1%) | 42 (68.9%) |
| Legal Services & Support | 0 (0.0%) | 19 (100.0%) |
| Education Instruction & Library | 52 (69.3%) | 23 (30.7%) |
| Arts, Media & Entertainment | 0 (0.0%) | 0 (0.0%) |
| Health Diagnosing & Treating | 0 (0.0%) | 27 (100.0%) |
| Health Technologists | 0 (0.0%) | 19 (100.0%) |
| Total (Category) | 145 (48.7%) | 153 (51.3%) |
| Total (Overall) | 738 (54.4%) | 618 (45.6%) |
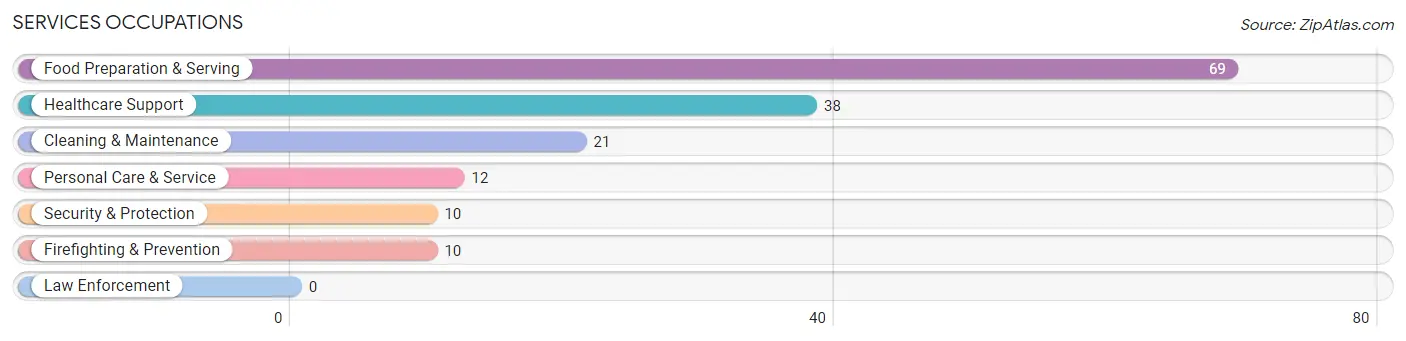
Services Occupations
The most common Services occupations in South Hutchinson are Food Preparation & Serving (69 | 5.1%), Healthcare Support (38 | 2.8%), Cleaning & Maintenance (21 | 1.5%), Personal Care & Service (12 | 0.9%), and Security & Protection (10 | 0.7%).
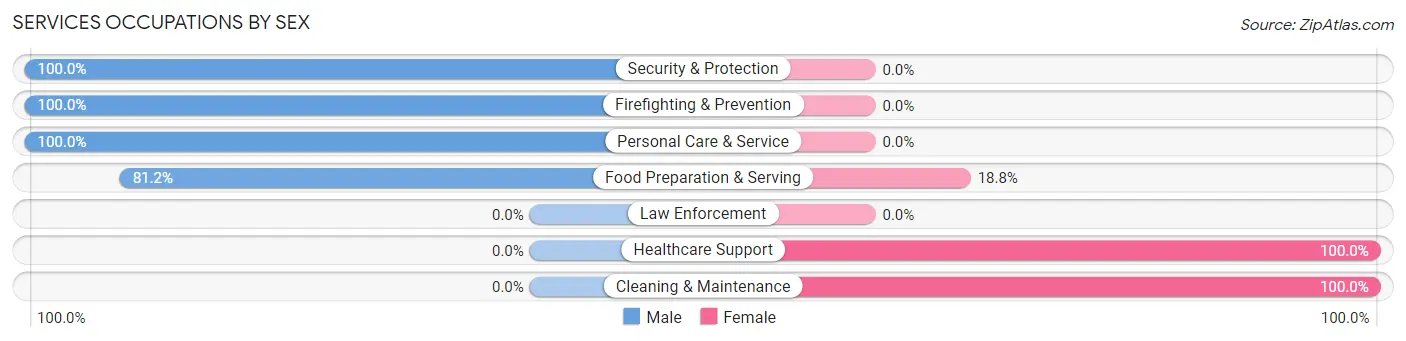
Services Occupations by Sex
Within the Services occupations in South Hutchinson, the most male-oriented occupations are Security & Protection (100.0%), Firefighting & Prevention (100.0%), and Personal Care & Service (100.0%), while the most female-oriented occupations are Healthcare Support (100.0%), Cleaning & Maintenance (100.0%), and Food Preparation & Serving (18.8%).
| Occupation | Male | Female |
| Healthcare Support | 0 (0.0%) | 38 (100.0%) |
| Security & Protection | 10 (100.0%) | 0 (0.0%) |
| Firefighting & Prevention | 10 (100.0%) | 0 (0.0%) |
| Law Enforcement | 0 (0.0%) | 0 (0.0%) |
| Food Preparation & Serving | 56 (81.2%) | 13 (18.8%) |
| Cleaning & Maintenance | 0 (0.0%) | 21 (100.0%) |
| Personal Care & Service | 12 (100.0%) | 0 (0.0%) |
| Total (Category) | 78 (52.0%) | 72 (48.0%) |
| Total (Overall) | 738 (54.4%) | 618 (45.6%) |
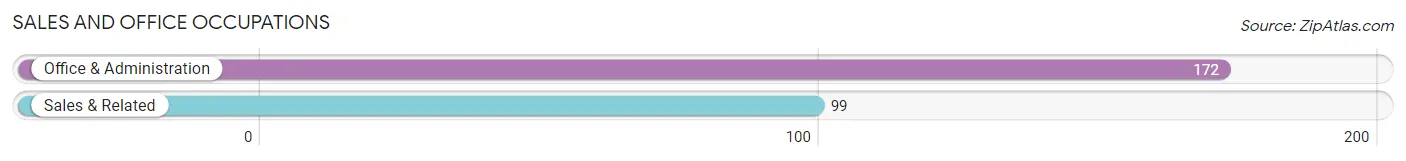
Sales and Office Occupations
The most common Sales and Office occupations in South Hutchinson are Office & Administration (172 | 12.7%), and Sales & Related (99 | 7.3%).
Sales and Office Occupations by Sex
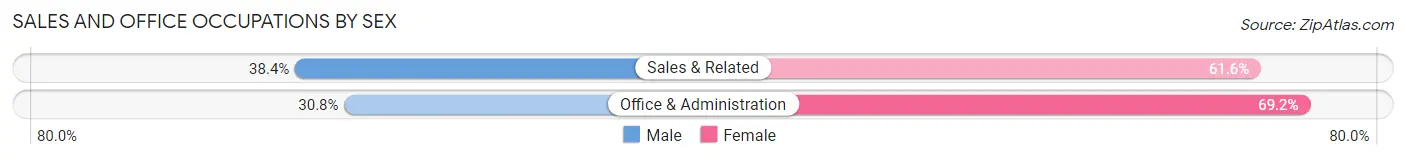
| Occupation | Male | Female |
| Sales & Related | 38 (38.4%) | 61 (61.6%) |
| Office & Administration | 53 (30.8%) | 119 (69.2%) |
| Total (Category) | 91 (33.6%) | 180 (66.4%) |
| Total (Overall) | 738 (54.4%) | 618 (45.6%) |
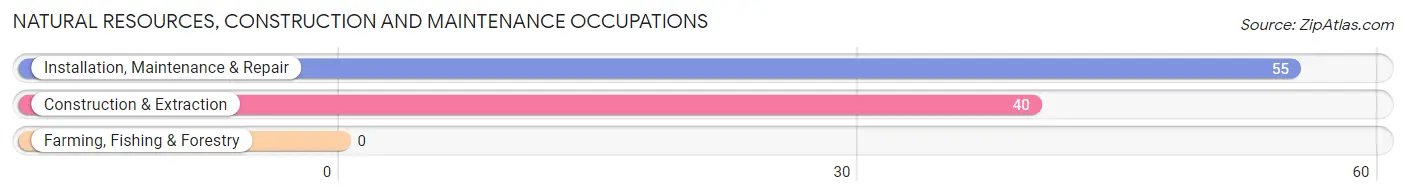
Natural Resources, Construction and Maintenance Occupations
The most common Natural Resources, Construction and Maintenance occupations in South Hutchinson are Installation, Maintenance & Repair (55 | 4.1%), and Construction & Extraction (40 | 2.9%).
Natural Resources, Construction and Maintenance Occupations by Sex
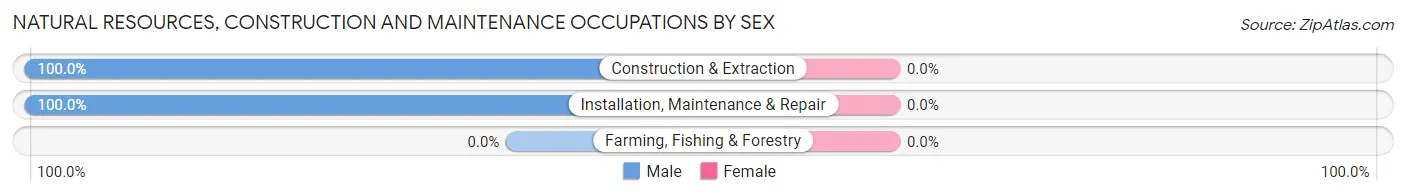
| Occupation | Male | Female |
| Farming, Fishing & Forestry | 0 (0.0%) | 0 (0.0%) |
| Construction & Extraction | 40 (100.0%) | 0 (0.0%) |
| Installation, Maintenance & Repair | 55 (100.0%) | 0 (0.0%) |
| Total (Category) | 95 (100.0%) | 0 (0.0%) |
| Total (Overall) | 738 (54.4%) | 618 (45.6%) |
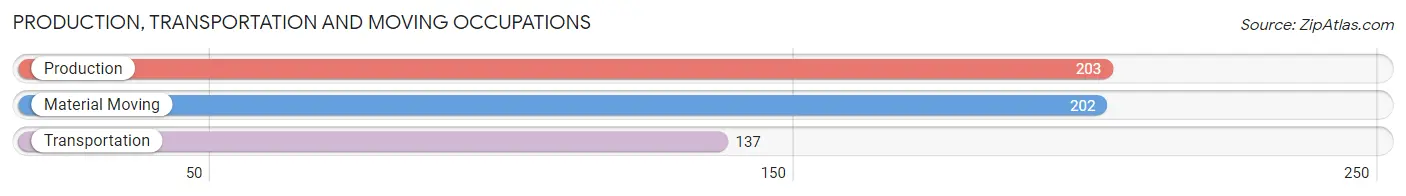
Production, Transportation and Moving Occupations
The most common Production, Transportation and Moving occupations in South Hutchinson are Production (203 | 15.0%), Material Moving (202 | 14.9%), and Transportation (137 | 10.1%).
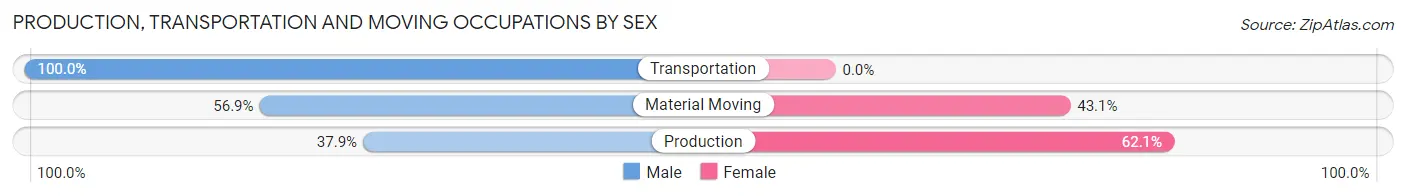
Production, Transportation and Moving Occupations by Sex
| Occupation | Male | Female |
| Production | 77 (37.9%) | 126 (62.1%) |
| Transportation | 137 (100.0%) | 0 (0.0%) |
| Material Moving | 115 (56.9%) | 87 (43.1%) |
| Total (Category) | 329 (60.7%) | 213 (39.3%) |
| Total (Overall) | 738 (54.4%) | 618 (45.6%) |
Employment Industries by Sex in South Hutchinson
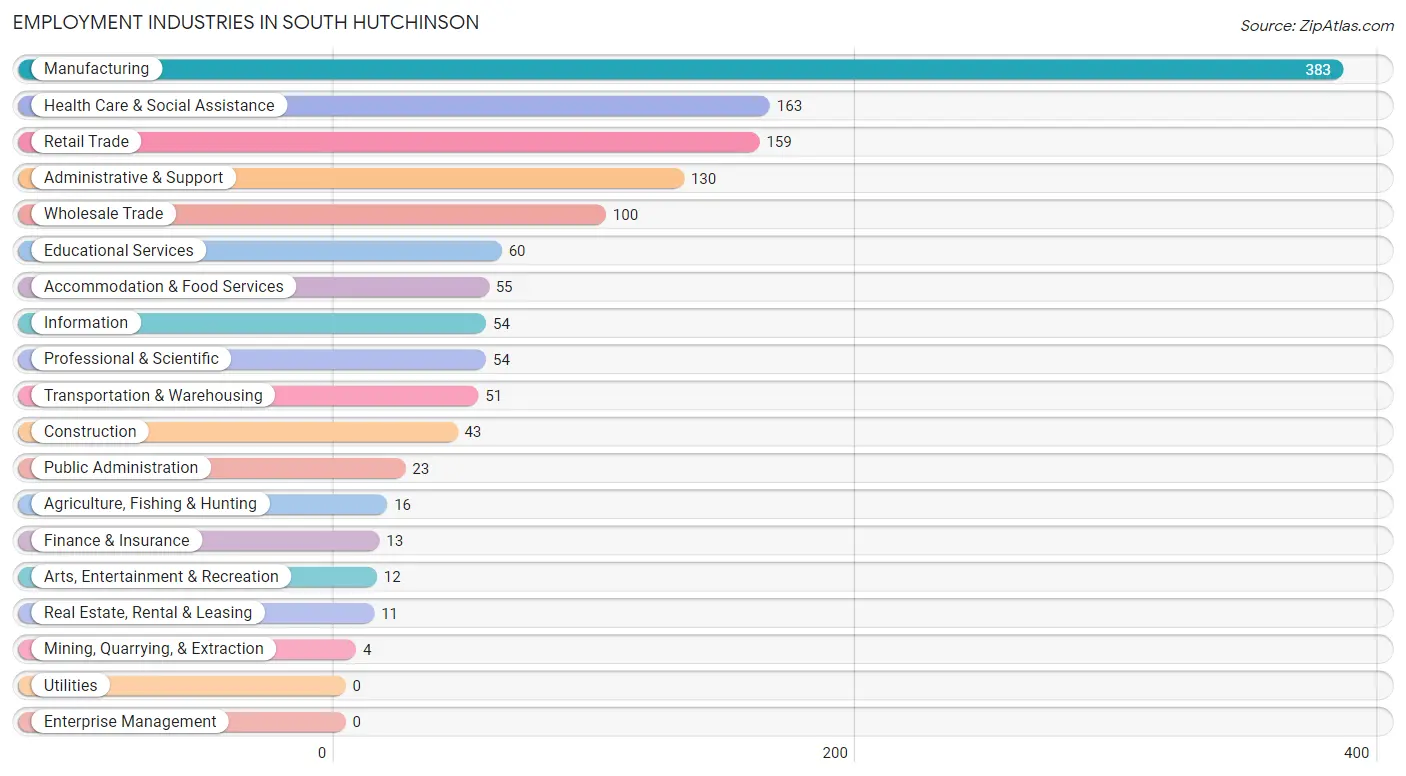
Employment Industries in South Hutchinson
The major employment industries in South Hutchinson include Manufacturing (383 | 28.2%), Health Care & Social Assistance (163 | 12.0%), Retail Trade (159 | 11.7%), Administrative & Support (130 | 9.6%), and Wholesale Trade (100 | 7.4%).
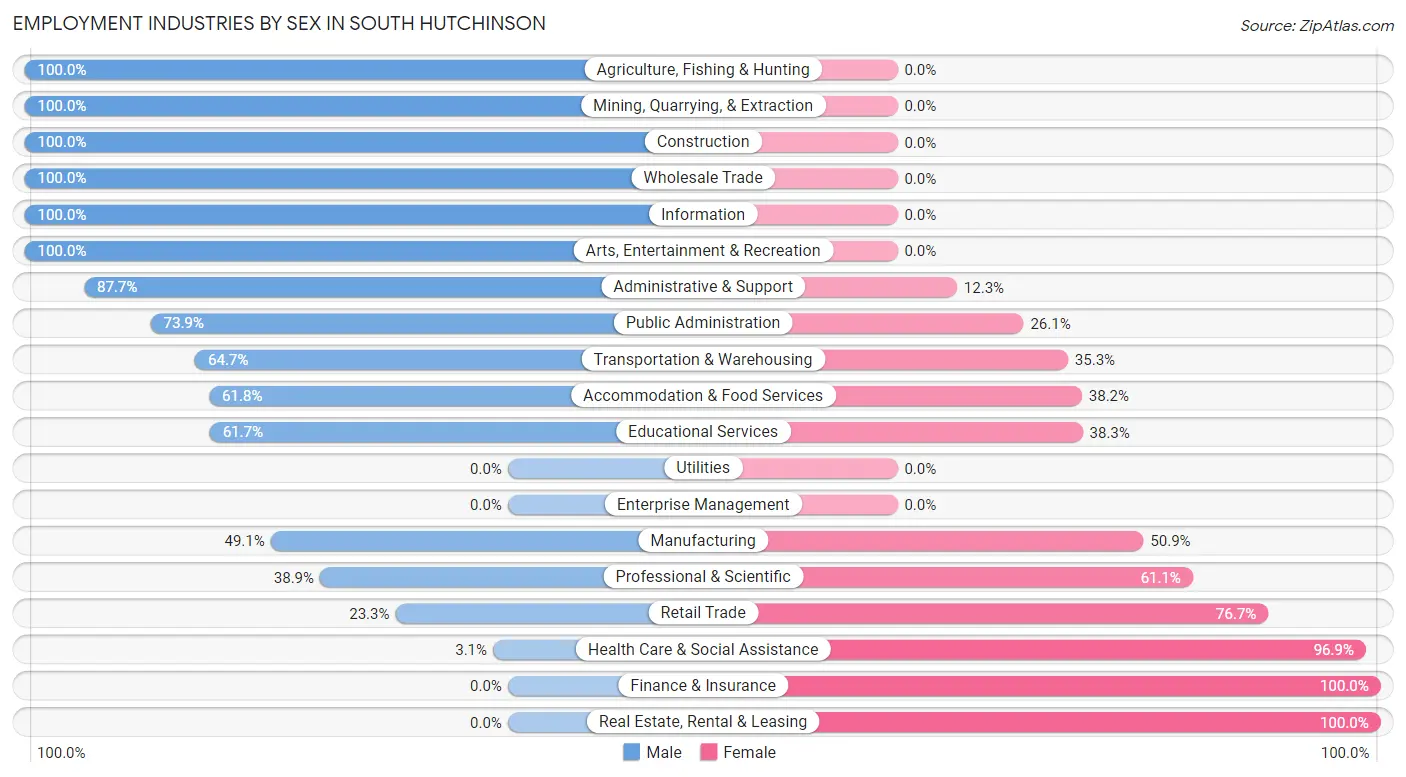
Employment Industries by Sex in South Hutchinson
The South Hutchinson industries that see more men than women are Agriculture, Fishing & Hunting (100.0%), Mining, Quarrying, & Extraction (100.0%), and Construction (100.0%), whereas the industries that tend to have a higher number of women are Finance & Insurance (100.0%), Real Estate, Rental & Leasing (100.0%), and Health Care & Social Assistance (96.9%).
| Industry | Male | Female |
| Agriculture, Fishing & Hunting | 16 (100.0%) | 0 (0.0%) |
| Mining, Quarrying, & Extraction | 4 (100.0%) | 0 (0.0%) |
| Construction | 43 (100.0%) | 0 (0.0%) |
| Manufacturing | 188 (49.1%) | 195 (50.9%) |
| Wholesale Trade | 100 (100.0%) | 0 (0.0%) |
| Retail Trade | 37 (23.3%) | 122 (76.7%) |
| Transportation & Warehousing | 33 (64.7%) | 18 (35.3%) |
| Utilities | 0 (0.0%) | 0 (0.0%) |
| Information | 54 (100.0%) | 0 (0.0%) |
| Finance & Insurance | 0 (0.0%) | 13 (100.0%) |
| Real Estate, Rental & Leasing | 0 (0.0%) | 11 (100.0%) |
| Professional & Scientific | 21 (38.9%) | 33 (61.1%) |
| Enterprise Management | 0 (0.0%) | 0 (0.0%) |
| Administrative & Support | 114 (87.7%) | 16 (12.3%) |
| Educational Services | 37 (61.7%) | 23 (38.3%) |
| Health Care & Social Assistance | 5 (3.1%) | 158 (96.9%) |
| Arts, Entertainment & Recreation | 12 (100.0%) | 0 (0.0%) |
| Accommodation & Food Services | 34 (61.8%) | 21 (38.2%) |
| Public Administration | 17 (73.9%) | 6 (26.1%) |
| Total | 738 (54.4%) | 618 (45.6%) |
Education in South Hutchinson
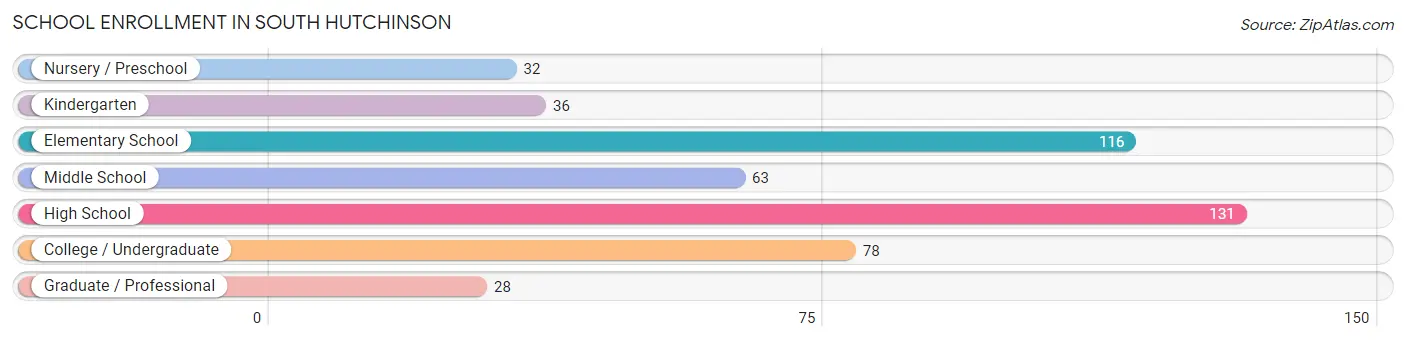
School Enrollment in South Hutchinson
The most common levels of schooling among the 484 students in South Hutchinson are high school (131 | 27.1%), elementary school (116 | 24.0%), and college / undergraduate (78 | 16.1%).
| School Level | # Students | % Students |
| Nursery / Preschool | 32 | 6.6% |
| Kindergarten | 36 | 7.4% |
| Elementary School | 116 | 24.0% |
| Middle School | 63 | 13.0% |
| High School | 131 | 27.1% |
| College / Undergraduate | 78 | 16.1% |
| Graduate / Professional | 28 | 5.8% |
| Total | 484 | 100.0% |
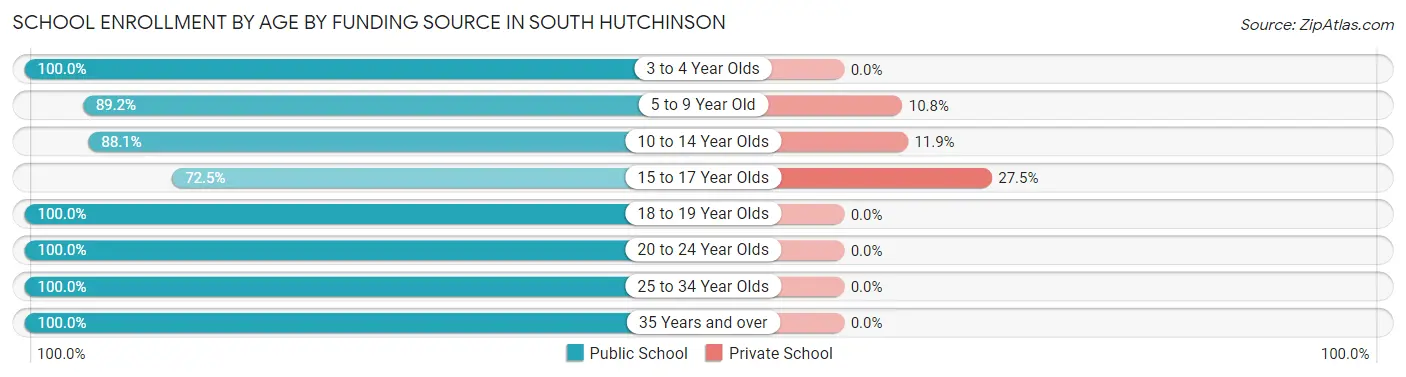
School Enrollment by Age by Funding Source in South Hutchinson
Out of a total of 484 students who are enrolled in schools in South Hutchinson, 58 (12.0%) attend a private institution, while the remaining 426 (88.0%) are enrolled in public schools. The age group of 15 to 17 year olds has the highest likelihood of being enrolled in private schools, with 33 (27.5% in the age bracket) enrolled. Conversely, the age group of 3 to 4 year olds has the lowest likelihood of being enrolled in a private school, with 26 (100.0% in the age bracket) attending a public institution.
| Age Bracket | Public School | Private School |
| 3 to 4 Year Olds | 26 (100.0%) | 0 (0.0%) |
| 5 to 9 Year Old | 107 (89.2%) | 13 (10.8%) |
| 10 to 14 Year Olds | 89 (88.1%) | 12 (11.9%) |
| 15 to 17 Year Olds | 87 (72.5%) | 33 (27.5%) |
| 18 to 19 Year Olds | 18 (100.0%) | 0 (0.0%) |
| 20 to 24 Year Olds | 64 (100.0%) | 0 (0.0%) |
| 25 to 34 Year Olds | 28 (100.0%) | 0 (0.0%) |
| 35 Years and over | 7 (100.0%) | 0 (0.0%) |
| Total | 426 (88.0%) | 58 (12.0%) |
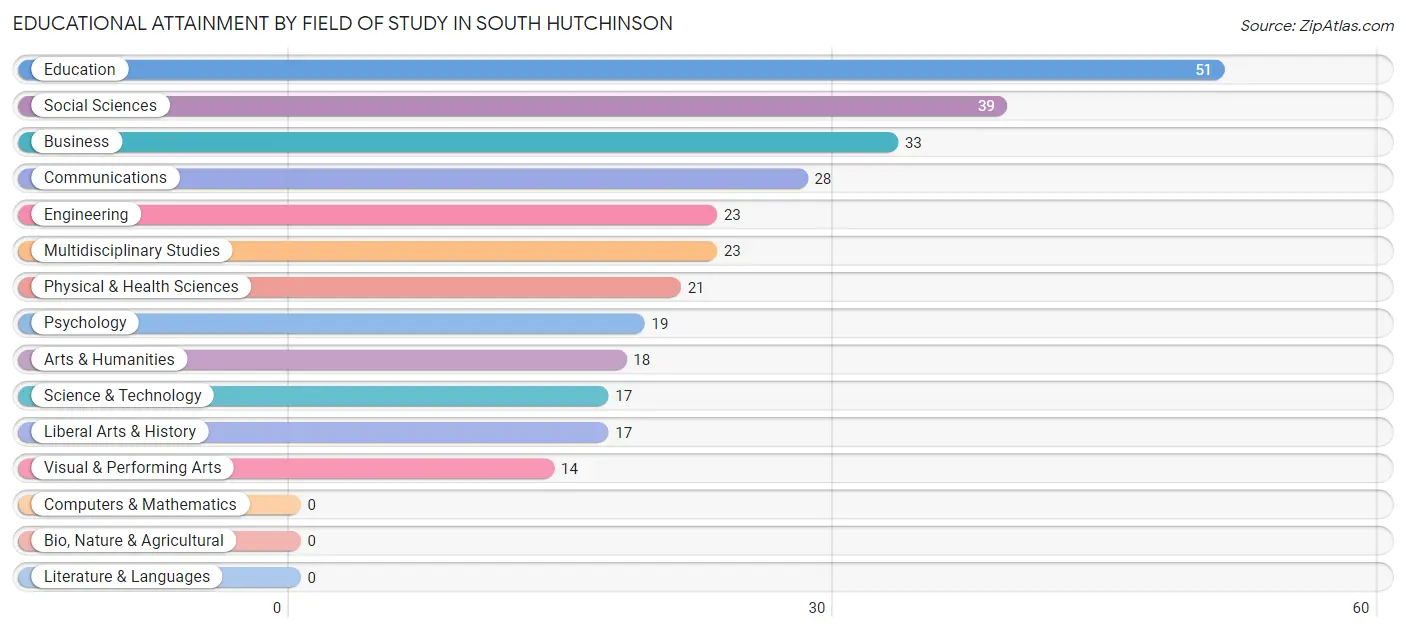
Educational Attainment by Field of Study in South Hutchinson
Education (51 | 16.8%), social sciences (39 | 12.9%), business (33 | 10.9%), communications (28 | 9.2%), and engineering (23 | 7.6%) are the most common fields of study among 303 individuals in South Hutchinson who have obtained a bachelor's degree or higher.
| Field of Study | # Graduates | % Graduates |
| Computers & Mathematics | 0 | 0.0% |
| Bio, Nature & Agricultural | 0 | 0.0% |
| Physical & Health Sciences | 21 | 6.9% |
| Psychology | 19 | 6.3% |
| Social Sciences | 39 | 12.9% |
| Engineering | 23 | 7.6% |
| Multidisciplinary Studies | 23 | 7.6% |
| Science & Technology | 17 | 5.6% |
| Business | 33 | 10.9% |
| Education | 51 | 16.8% |
| Literature & Languages | 0 | 0.0% |
| Liberal Arts & History | 17 | 5.6% |
| Visual & Performing Arts | 14 | 4.6% |
| Communications | 28 | 9.2% |
| Arts & Humanities | 18 | 5.9% |
| Total | 303 | 100.0% |
Transportation & Commute in South Hutchinson
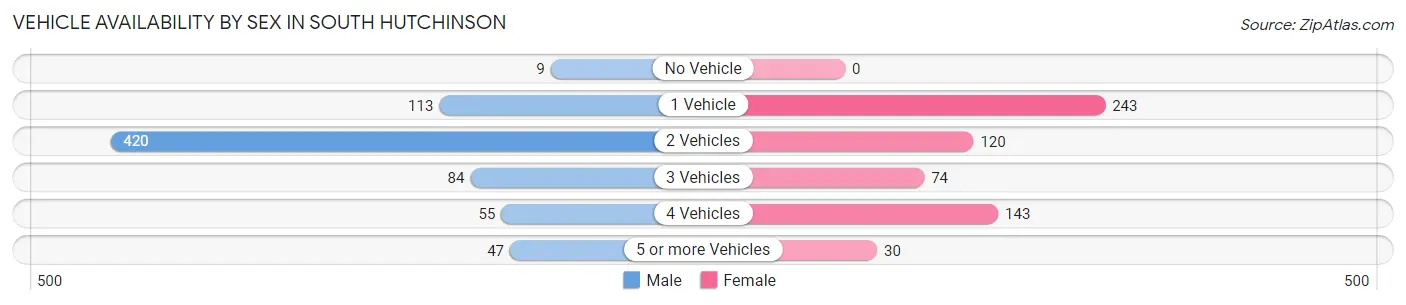
Vehicle Availability by Sex in South Hutchinson
The most prevalent vehicle ownership categories in South Hutchinson are males with 2 vehicles (420, accounting for 57.7%) and females with 2 vehicles (120, making up 68.9%).
| Vehicles Available | Male | Female |
| No Vehicle | 9 (1.2%) | 0 (0.0%) |
| 1 Vehicle | 113 (15.5%) | 243 (39.8%) |
| 2 Vehicles | 420 (57.7%) | 120 (19.7%) |
| 3 Vehicles | 84 (11.5%) | 74 (12.1%) |
| 4 Vehicles | 55 (7.5%) | 143 (23.4%) |
| 5 or more Vehicles | 47 (6.5%) | 30 (4.9%) |
| Total | 728 (100.0%) | 610 (100.0%) |
Commute Time in South Hutchinson
The most frequently occuring commute durations in South Hutchinson are 15 to 19 minutes (341 commuters, 28.5%), 10 to 14 minutes (316 commuters, 26.4%), and 5 to 9 minutes (229 commuters, 19.2%).
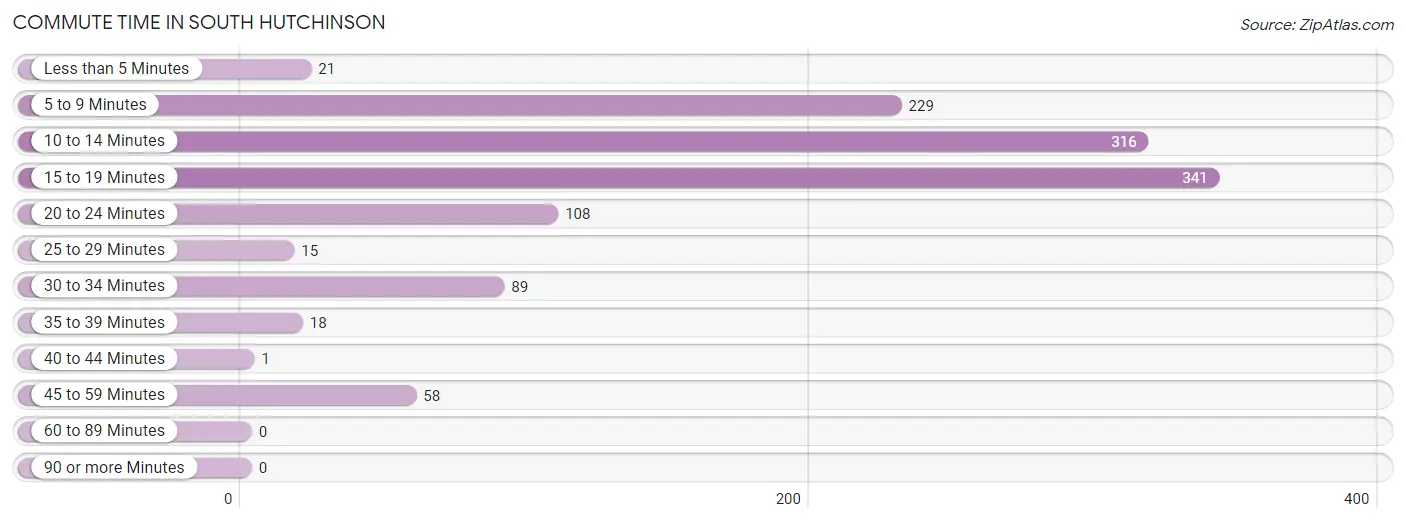
| Commute Time | # Commuters | % Commuters |
| Less than 5 Minutes | 21 | 1.8% |
| 5 to 9 Minutes | 229 | 19.2% |
| 10 to 14 Minutes | 316 | 26.4% |
| 15 to 19 Minutes | 341 | 28.5% |
| 20 to 24 Minutes | 108 | 9.0% |
| 25 to 29 Minutes | 15 | 1.3% |
| 30 to 34 Minutes | 89 | 7.4% |
| 35 to 39 Minutes | 18 | 1.5% |
| 40 to 44 Minutes | 1 | 0.1% |
| 45 to 59 Minutes | 58 | 4.9% |
| 60 to 89 Minutes | 0 | 0.0% |
| 90 or more Minutes | 0 | 0.0% |
Commute Time by Sex in South Hutchinson
The most common commute times in South Hutchinson are 10 to 14 minutes (187 commuters, 30.9%) for males and 15 to 19 minutes (201 commuters, 34.1%) for females.
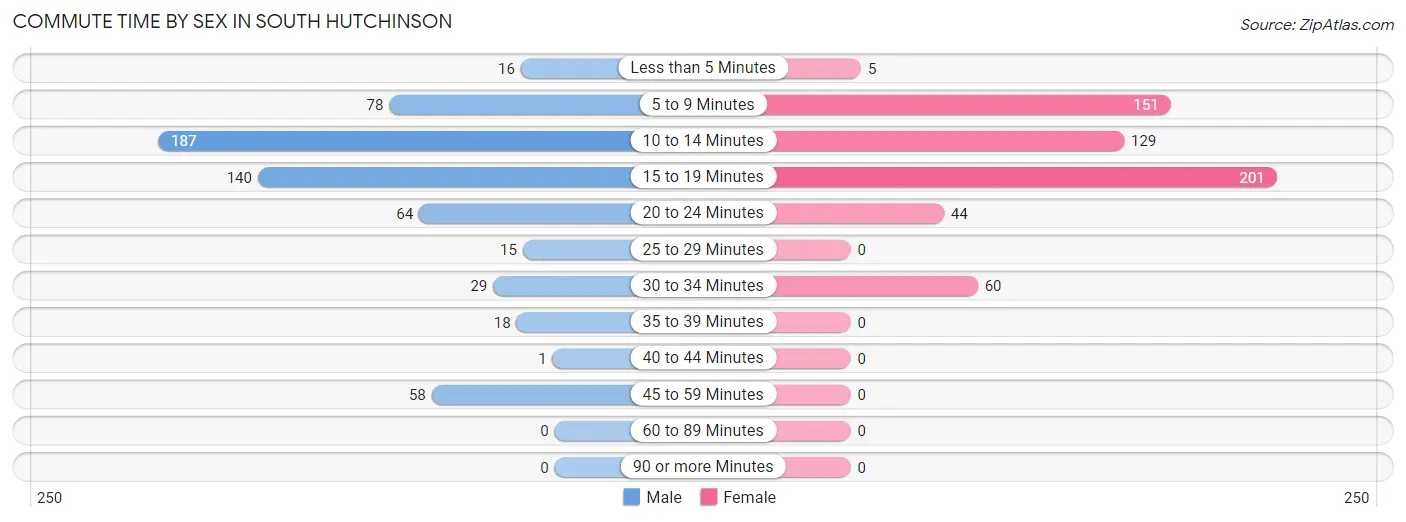
| Commute Time | Male | Female |
| Less than 5 Minutes | 16 (2.6%) | 5 (0.9%) |
| 5 to 9 Minutes | 78 (12.9%) | 151 (25.6%) |
| 10 to 14 Minutes | 187 (30.9%) | 129 (21.9%) |
| 15 to 19 Minutes | 140 (23.1%) | 201 (34.1%) |
| 20 to 24 Minutes | 64 (10.6%) | 44 (7.5%) |
| 25 to 29 Minutes | 15 (2.5%) | 0 (0.0%) |
| 30 to 34 Minutes | 29 (4.8%) | 60 (10.2%) |
| 35 to 39 Minutes | 18 (3.0%) | 0 (0.0%) |
| 40 to 44 Minutes | 1 (0.2%) | 0 (0.0%) |
| 45 to 59 Minutes | 58 (9.6%) | 0 (0.0%) |
| 60 to 89 Minutes | 0 (0.0%) | 0 (0.0%) |
| 90 or more Minutes | 0 (0.0%) | 0 (0.0%) |
Time of Departure to Work by Sex in South Hutchinson
The most frequent times of departure to work in South Hutchinson are 5:30 AM to 5:59 AM (137, 22.6%) for males and 7:30 AM to 7:59 AM (142, 24.1%) for females.
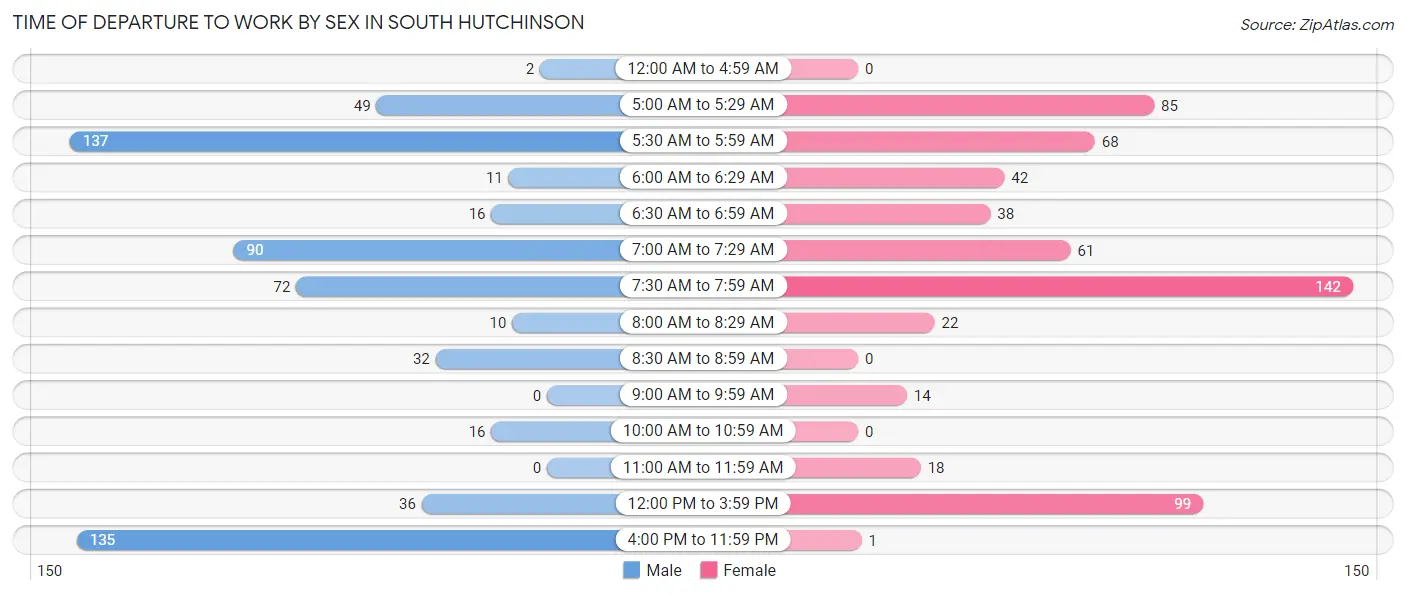
| Time of Departure | Male | Female |
| 12:00 AM to 4:59 AM | 2 (0.3%) | 0 (0.0%) |
| 5:00 AM to 5:29 AM | 49 (8.1%) | 85 (14.4%) |
| 5:30 AM to 5:59 AM | 137 (22.6%) | 68 (11.5%) |
| 6:00 AM to 6:29 AM | 11 (1.8%) | 42 (7.1%) |
| 6:30 AM to 6:59 AM | 16 (2.6%) | 38 (6.4%) |
| 7:00 AM to 7:29 AM | 90 (14.8%) | 61 (10.3%) |
| 7:30 AM to 7:59 AM | 72 (11.9%) | 142 (24.1%) |
| 8:00 AM to 8:29 AM | 10 (1.7%) | 22 (3.7%) |
| 8:30 AM to 8:59 AM | 32 (5.3%) | 0 (0.0%) |
| 9:00 AM to 9:59 AM | 0 (0.0%) | 14 (2.4%) |
| 10:00 AM to 10:59 AM | 16 (2.6%) | 0 (0.0%) |
| 11:00 AM to 11:59 AM | 0 (0.0%) | 18 (3.0%) |
| 12:00 PM to 3:59 PM | 36 (5.9%) | 99 (16.8%) |
| 4:00 PM to 11:59 PM | 135 (22.3%) | 1 (0.2%) |
| Total | 606 (100.0%) | 590 (100.0%) |
Housing Occupancy in South Hutchinson
Occupancy by Ownership in South Hutchinson
Of the total 1,276 dwellings in South Hutchinson, owner-occupied units account for 756 (59.3%), while renter-occupied units make up 520 (40.7%).
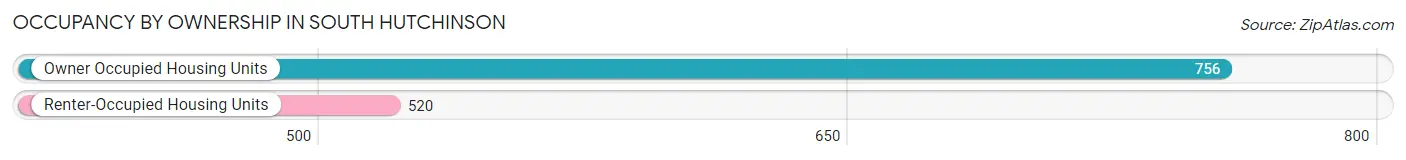
| Occupancy | # Housing Units | % Housing Units |
| Owner Occupied Housing Units | 756 | 59.3% |
| Renter-Occupied Housing Units | 520 | 40.7% |
| Total Occupied Housing Units | 1,276 | 100.0% |
Occupancy by Household Size in South Hutchinson
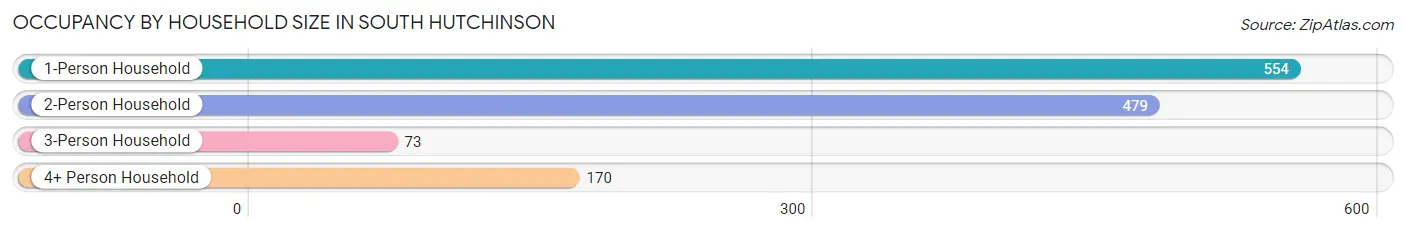
| Household Size | # Housing Units | % Housing Units |
| 1-Person Household | 554 | 43.4% |
| 2-Person Household | 479 | 37.5% |
| 3-Person Household | 73 | 5.7% |
| 4+ Person Household | 170 | 13.3% |
| Total Housing Units | 1,276 | 100.0% |
Occupancy by Ownership by Household Size in South Hutchinson
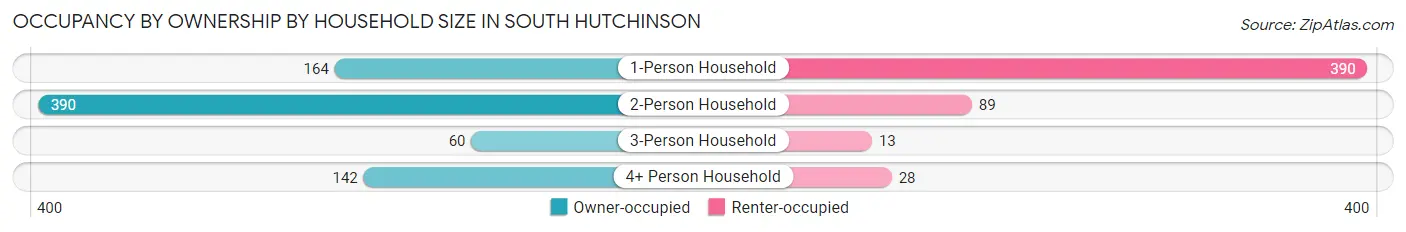
| Household Size | Owner-occupied | Renter-occupied |
| 1-Person Household | 164 (29.6%) | 390 (70.4%) |
| 2-Person Household | 390 (81.4%) | 89 (18.6%) |
| 3-Person Household | 60 (82.2%) | 13 (17.8%) |
| 4+ Person Household | 142 (83.5%) | 28 (16.5%) |
| Total Housing Units | 756 (59.3%) | 520 (40.7%) |
Occupancy by Educational Attainment in South Hutchinson
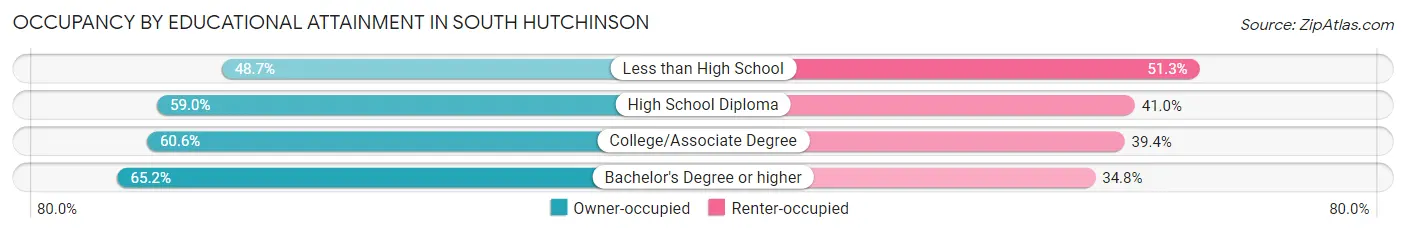
| Household Size | Owner-occupied | Renter-occupied |
| Less than High School | 77 (48.7%) | 81 (51.3%) |
| High School Diploma | 220 (59.0%) | 153 (41.0%) |
| College/Associate Degree | 352 (60.6%) | 229 (39.4%) |
| Bachelor's Degree or higher | 107 (65.2%) | 57 (34.8%) |
Occupancy by Age of Householder in South Hutchinson
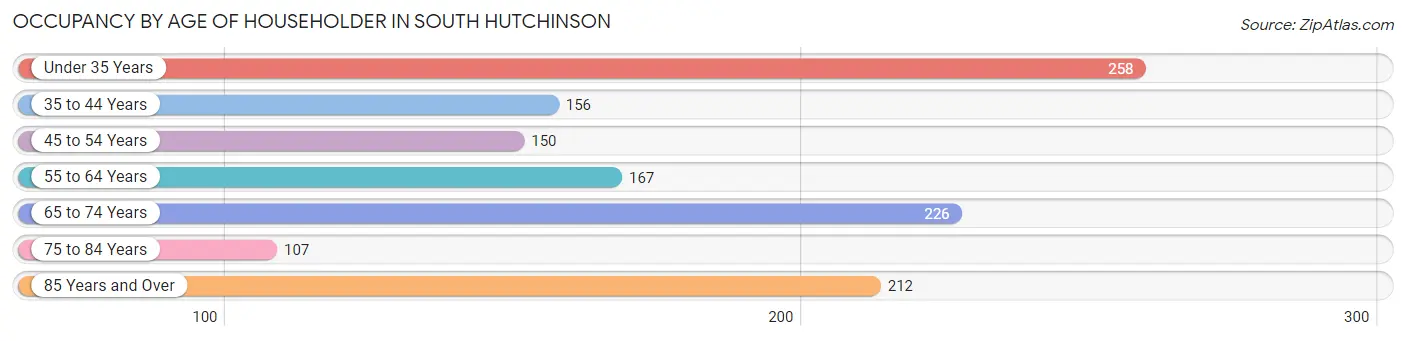
| Age Bracket | # Households | % Households |
| Under 35 Years | 258 | 20.2% |
| 35 to 44 Years | 156 | 12.2% |
| 45 to 54 Years | 150 | 11.8% |
| 55 to 64 Years | 167 | 13.1% |
| 65 to 74 Years | 226 | 17.7% |
| 75 to 84 Years | 107 | 8.4% |
| 85 Years and Over | 212 | 16.6% |
| Total | 1,276 | 100.0% |
Housing Finances in South Hutchinson
Median Income by Occupancy in South Hutchinson
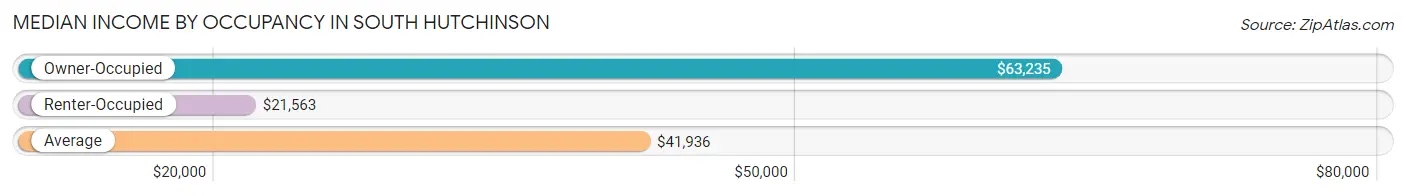
| Occupancy Type | # Households | Median Income |
| Owner-Occupied | 756 (59.3%) | $63,235 |
| Renter-Occupied | 520 (40.7%) | $21,563 |
| Average | 1,276 (100.0%) | $41,936 |
Occupancy by Householder Income Bracket in South Hutchinson
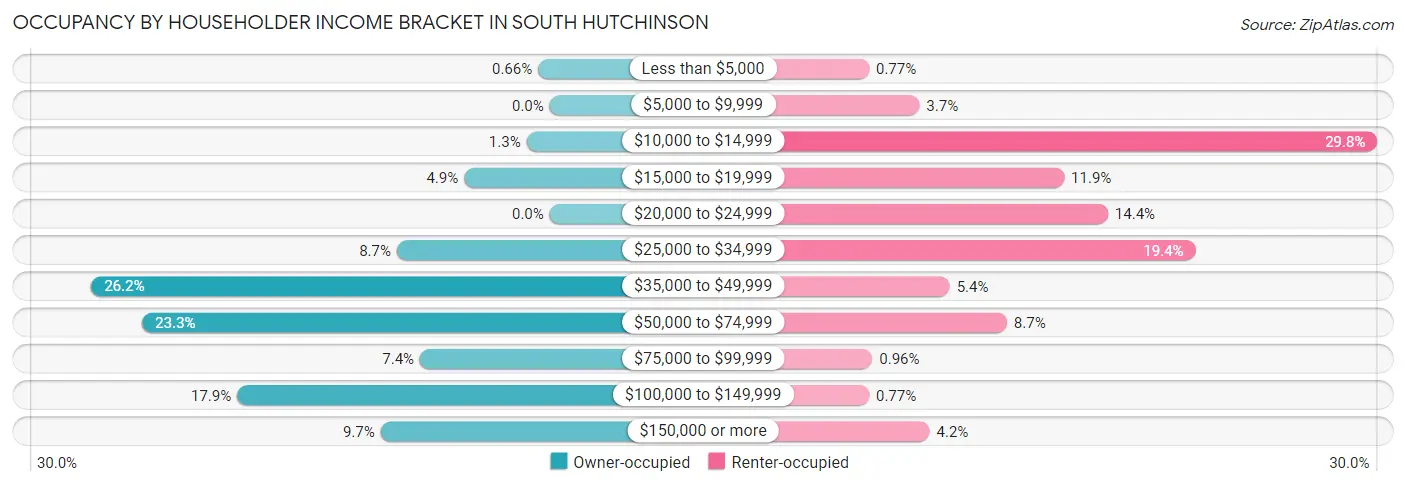
| Income Bracket | Owner-occupied | Renter-occupied |
| Less than $5,000 | 5 (0.7%) | 4 (0.8%) |
| $5,000 to $9,999 | 0 (0.0%) | 19 (3.6%) |
| $10,000 to $14,999 | 10 (1.3%) | 155 (29.8%) |
| $15,000 to $19,999 | 37 (4.9%) | 62 (11.9%) |
| $20,000 to $24,999 | 0 (0.0%) | 75 (14.4%) |
| $25,000 to $34,999 | 66 (8.7%) | 101 (19.4%) |
| $35,000 to $49,999 | 198 (26.2%) | 28 (5.4%) |
| $50,000 to $74,999 | 176 (23.3%) | 45 (8.6%) |
| $75,000 to $99,999 | 56 (7.4%) | 5 (1.0%) |
| $100,000 to $149,999 | 135 (17.9%) | 4 (0.8%) |
| $150,000 or more | 73 (9.7%) | 22 (4.2%) |
| Total | 756 (100.0%) | 520 (100.0%) |
Monthly Housing Cost Tiers in South Hutchinson
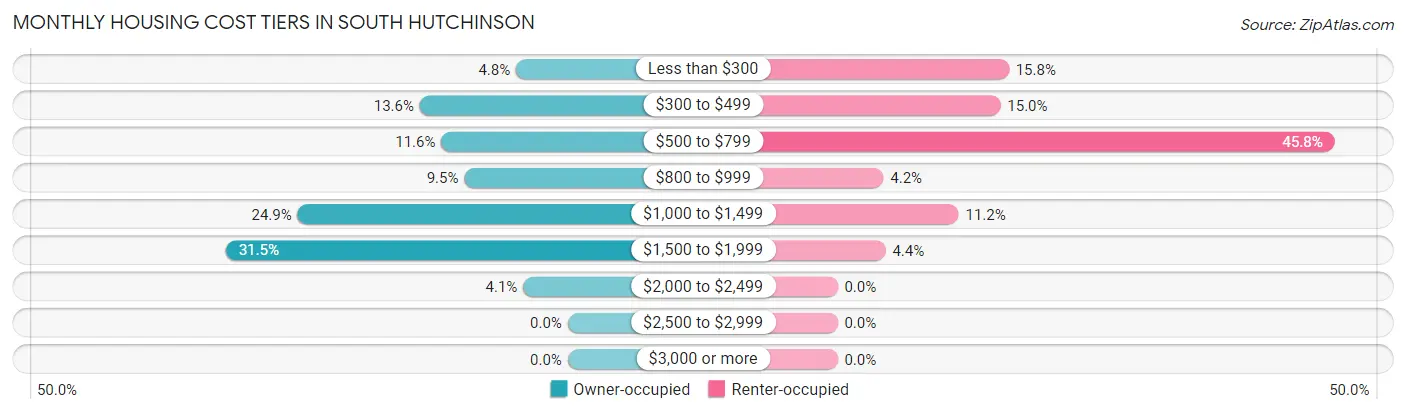
| Monthly Cost | Owner-occupied | Renter-occupied |
| Less than $300 | 36 (4.8%) | 82 (15.8%) |
| $300 to $499 | 103 (13.6%) | 78 (15.0%) |
| $500 to $799 | 88 (11.6%) | 238 (45.8%) |
| $800 to $999 | 72 (9.5%) | 22 (4.2%) |
| $1,000 to $1,499 | 188 (24.9%) | 58 (11.2%) |
| $1,500 to $1,999 | 238 (31.5%) | 23 (4.4%) |
| $2,000 to $2,499 | 31 (4.1%) | 0 (0.0%) |
| $2,500 to $2,999 | 0 (0.0%) | 0 (0.0%) |
| $3,000 or more | 0 (0.0%) | 0 (0.0%) |
| Total | 756 (100.0%) | 520 (100.0%) |
Physical Housing Characteristics in South Hutchinson
Housing Structures in South Hutchinson
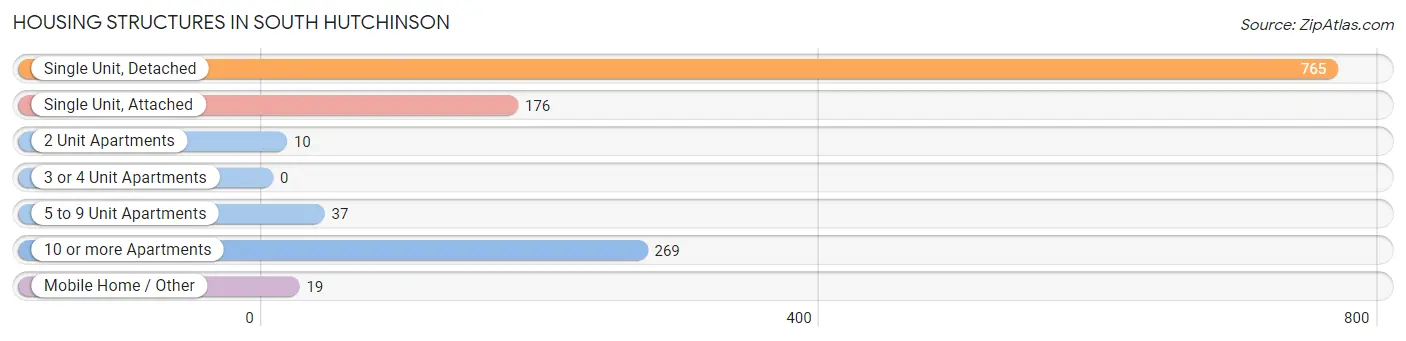
| Structure Type | # Housing Units | % Housing Units |
| Single Unit, Detached | 765 | 60.0% |
| Single Unit, Attached | 176 | 13.8% |
| 2 Unit Apartments | 10 | 0.8% |
| 3 or 4 Unit Apartments | 0 | 0.0% |
| 5 to 9 Unit Apartments | 37 | 2.9% |
| 10 or more Apartments | 269 | 21.1% |
| Mobile Home / Other | 19 | 1.5% |
| Total | 1,276 | 100.0% |
Housing Structures by Occupancy in South Hutchinson
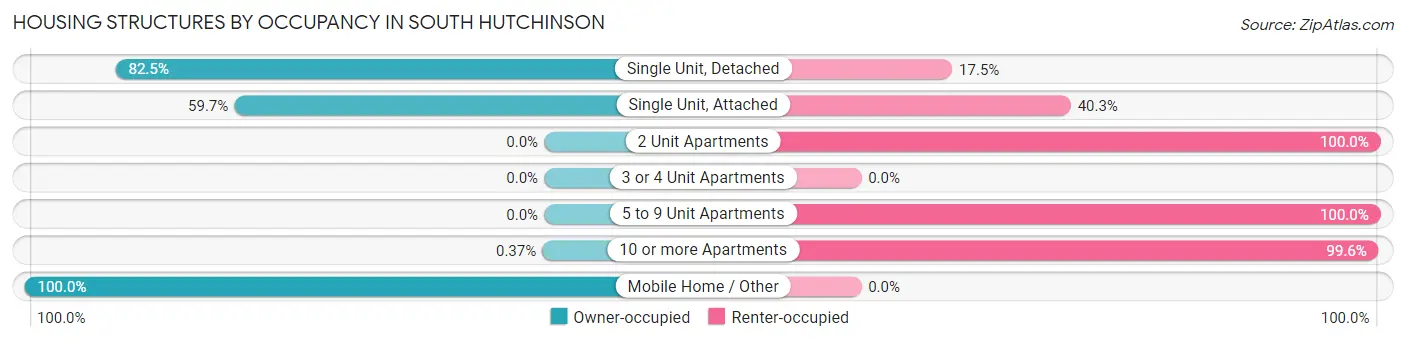
| Structure Type | Owner-occupied | Renter-occupied |
| Single Unit, Detached | 631 (82.5%) | 134 (17.5%) |
| Single Unit, Attached | 105 (59.7%) | 71 (40.3%) |
| 2 Unit Apartments | 0 (0.0%) | 10 (100.0%) |
| 3 or 4 Unit Apartments | 0 (0.0%) | 0 (0.0%) |
| 5 to 9 Unit Apartments | 0 (0.0%) | 37 (100.0%) |
| 10 or more Apartments | 1 (0.4%) | 268 (99.6%) |
| Mobile Home / Other | 19 (100.0%) | 0 (0.0%) |
| Total | 756 (59.3%) | 520 (40.7%) |
Housing Structures by Number of Rooms in South Hutchinson
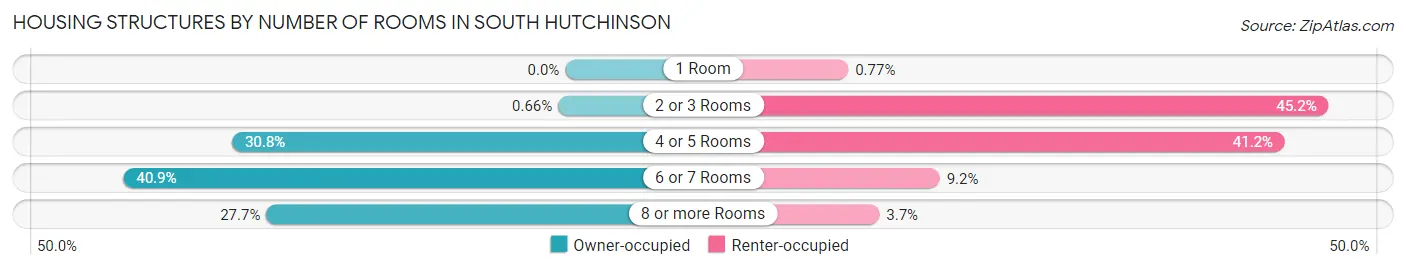
| Number of Rooms | Owner-occupied | Renter-occupied |
| 1 Room | 0 (0.0%) | 4 (0.8%) |
| 2 or 3 Rooms | 5 (0.7%) | 235 (45.2%) |
| 4 or 5 Rooms | 233 (30.8%) | 214 (41.1%) |
| 6 or 7 Rooms | 309 (40.9%) | 48 (9.2%) |
| 8 or more Rooms | 209 (27.7%) | 19 (3.6%) |
| Total | 756 (100.0%) | 520 (100.0%) |
Housing Structure by Heating Type in South Hutchinson
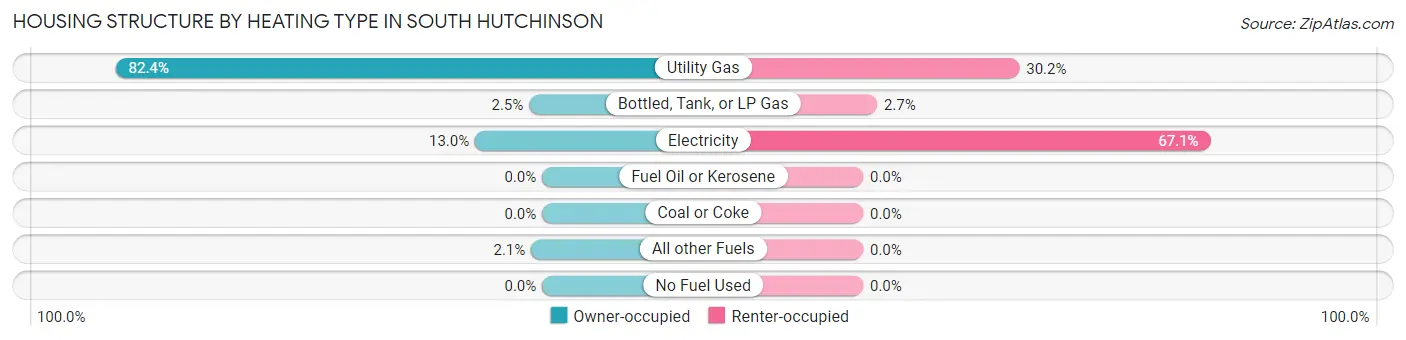
| Heating Type | Owner-occupied | Renter-occupied |
| Utility Gas | 623 (82.4%) | 157 (30.2%) |
| Bottled, Tank, or LP Gas | 19 (2.5%) | 14 (2.7%) |
| Electricity | 98 (13.0%) | 349 (67.1%) |
| Fuel Oil or Kerosene | 0 (0.0%) | 0 (0.0%) |
| Coal or Coke | 0 (0.0%) | 0 (0.0%) |
| All other Fuels | 16 (2.1%) | 0 (0.0%) |
| No Fuel Used | 0 (0.0%) | 0 (0.0%) |
| Total | 756 (100.0%) | 520 (100.0%) |
Household Vehicle Usage in South Hutchinson
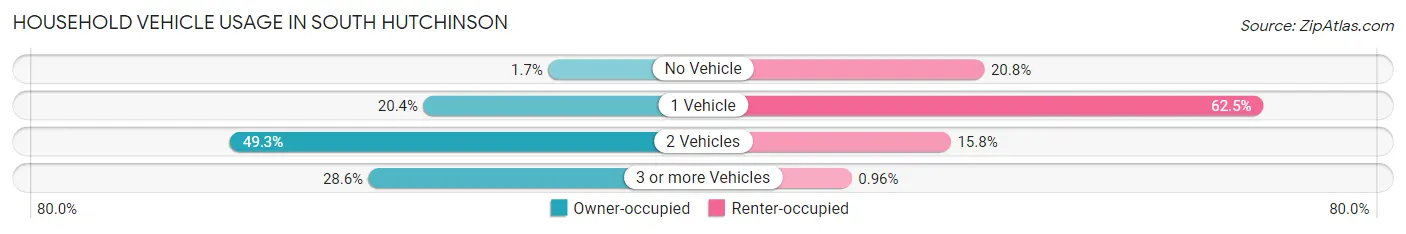
| Vehicles per Household | Owner-occupied | Renter-occupied |
| No Vehicle | 13 (1.7%) | 108 (20.8%) |
| 1 Vehicle | 154 (20.4%) | 325 (62.5%) |
| 2 Vehicles | 373 (49.3%) | 82 (15.8%) |
| 3 or more Vehicles | 216 (28.6%) | 5 (1.0%) |
| Total | 756 (100.0%) | 520 (100.0%) |
Real Estate & Mortgages in South Hutchinson
Real Estate and Mortgage Overview in South Hutchinson
| Characteristic | Without Mortgage | With Mortgage |
| Housing Units | 322 | 434 |
| Median Property Value | $147,000 | $128,500 |
| Median Household Income | $40,784 | $59 |
| Monthly Housing Costs | - | - |
| Real Estate Taxes | $1,976 | $0 |
Property Value by Mortgage Status in South Hutchinson
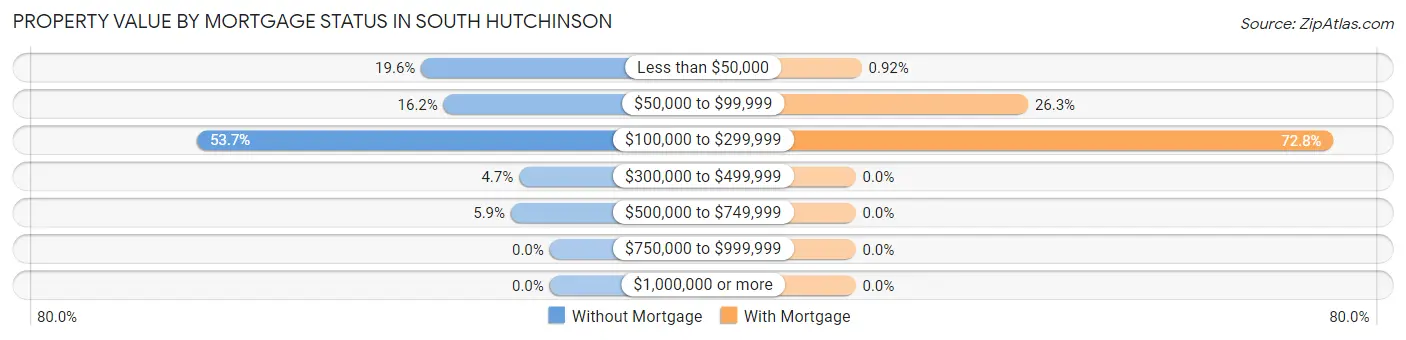
| Property Value | Without Mortgage | With Mortgage |
| Less than $50,000 | 63 (19.6%) | 4 (0.9%) |
| $50,000 to $99,999 | 52 (16.2%) | 114 (26.3%) |
| $100,000 to $299,999 | 173 (53.7%) | 316 (72.8%) |
| $300,000 to $499,999 | 15 (4.7%) | 0 (0.0%) |
| $500,000 to $749,999 | 19 (5.9%) | 0 (0.0%) |
| $750,000 to $999,999 | 0 (0.0%) | 0 (0.0%) |
| $1,000,000 or more | 0 (0.0%) | 0 (0.0%) |
| Total | 322 (100.0%) | 434 (100.0%) |
Household Income by Mortgage Status in South Hutchinson
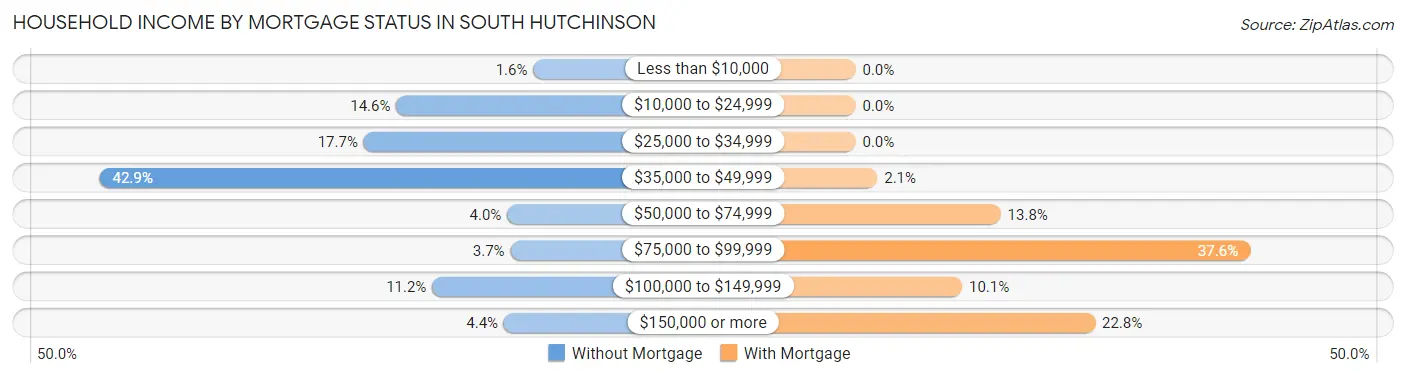
| Household Income | Without Mortgage | With Mortgage |
| Less than $10,000 | 5 (1.5%) | 0 (0.0%) |
| $10,000 to $24,999 | 47 (14.6%) | 0 (0.0%) |
| $25,000 to $34,999 | 57 (17.7%) | 0 (0.0%) |
| $35,000 to $49,999 | 138 (42.9%) | 9 (2.1%) |
| $50,000 to $74,999 | 13 (4.0%) | 60 (13.8%) |
| $75,000 to $99,999 | 12 (3.7%) | 163 (37.6%) |
| $100,000 to $149,999 | 36 (11.2%) | 44 (10.1%) |
| $150,000 or more | 14 (4.3%) | 99 (22.8%) |
| Total | 322 (100.0%) | 434 (100.0%) |
Property Value to Household Income Ratio in South Hutchinson
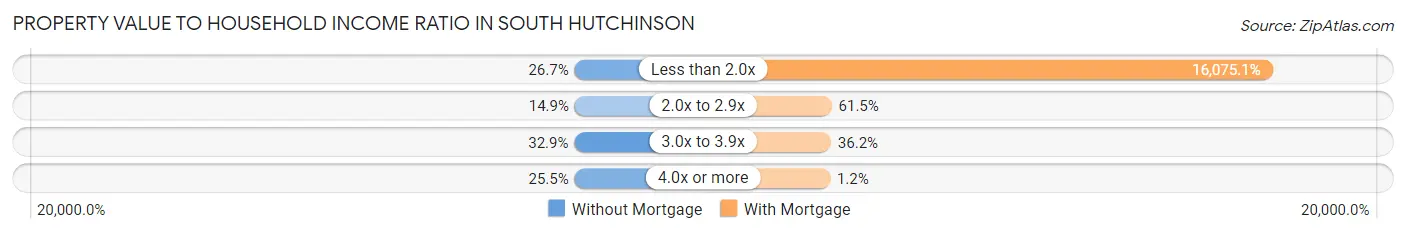
| Value-to-Income Ratio | Without Mortgage | With Mortgage |
| Less than 2.0x | 86 (26.7%) | 69,766 (16,075.1%) |
| 2.0x to 2.9x | 48 (14.9%) | 267 (61.5%) |
| 3.0x to 3.9x | 106 (32.9%) | 157 (36.2%) |
| 4.0x or more | 82 (25.5%) | 5 (1.1%) |
| Total | 322 (100.0%) | 434 (100.0%) |
Real Estate Taxes by Mortgage Status in South Hutchinson
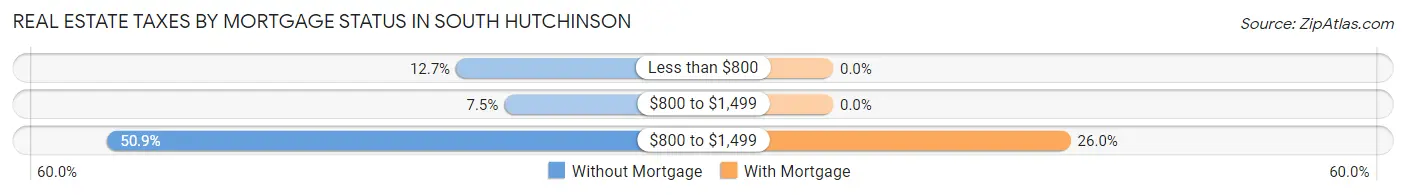
| Property Taxes | Without Mortgage | With Mortgage |
| Less than $800 | 41 (12.7%) | 0 (0.0%) |
| $800 to $1,499 | 24 (7.4%) | 0 (0.0%) |
| $800 to $1,499 | 164 (50.9%) | 113 (26.0%) |
| Total | 322 (100.0%) | 434 (100.0%) |
Health & Disability in South Hutchinson
Health Insurance Coverage by Age in South Hutchinson
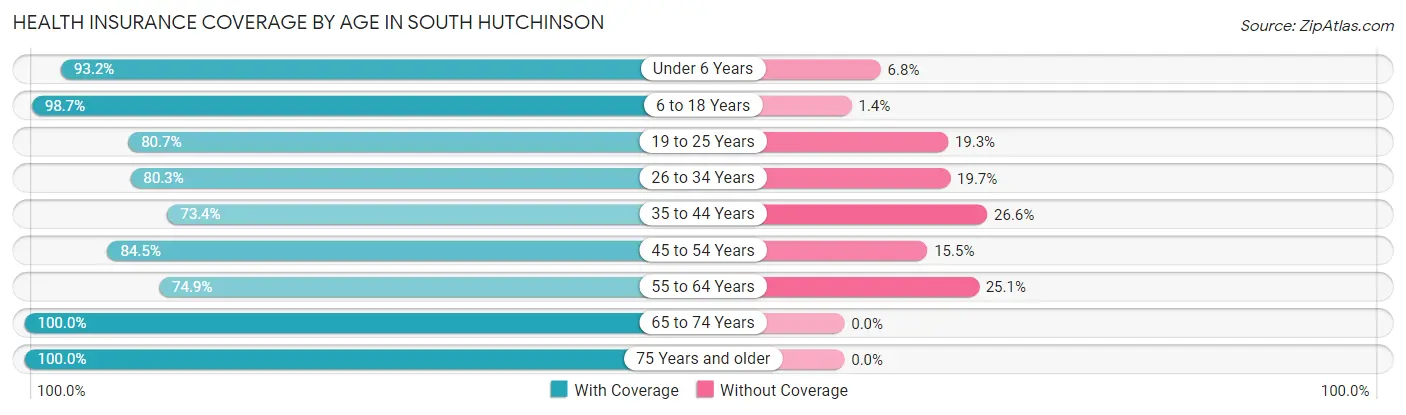
| Age Bracket | With Coverage | Without Coverage |
| Under 6 Years | 110 (93.2%) | 8 (6.8%) |
| 6 to 18 Years | 365 (98.7%) | 5 (1.3%) |
| 19 to 25 Years | 121 (80.7%) | 29 (19.3%) |
| 26 to 34 Years | 297 (80.3%) | 73 (19.7%) |
| 35 to 44 Years | 303 (73.4%) | 110 (26.6%) |
| 45 to 54 Years | 224 (84.5%) | 41 (15.5%) |
| 55 to 64 Years | 254 (74.9%) | 85 (25.1%) |
| 65 to 74 Years | 341 (100.0%) | 0 (0.0%) |
| 75 Years and older | 350 (100.0%) | 0 (0.0%) |
| Total | 2,365 (87.1%) | 351 (12.9%) |
Health Insurance Coverage by Citizenship Status in South Hutchinson
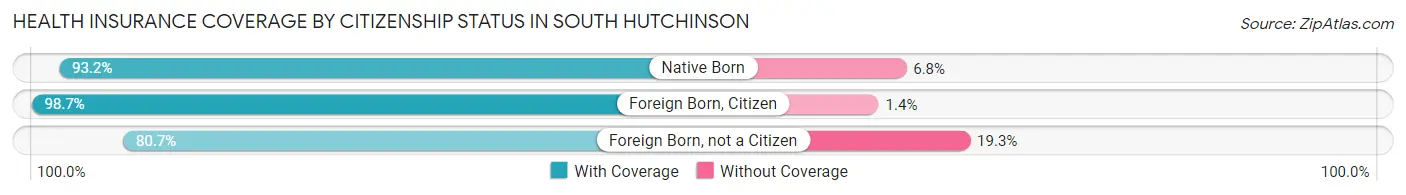
| Citizenship Status | With Coverage | Without Coverage |
| Native Born | 110 (93.2%) | 8 (6.8%) |
| Foreign Born, Citizen | 365 (98.7%) | 5 (1.3%) |
| Foreign Born, not a Citizen | 121 (80.7%) | 29 (19.3%) |
Health Insurance Coverage by Household Income in South Hutchinson
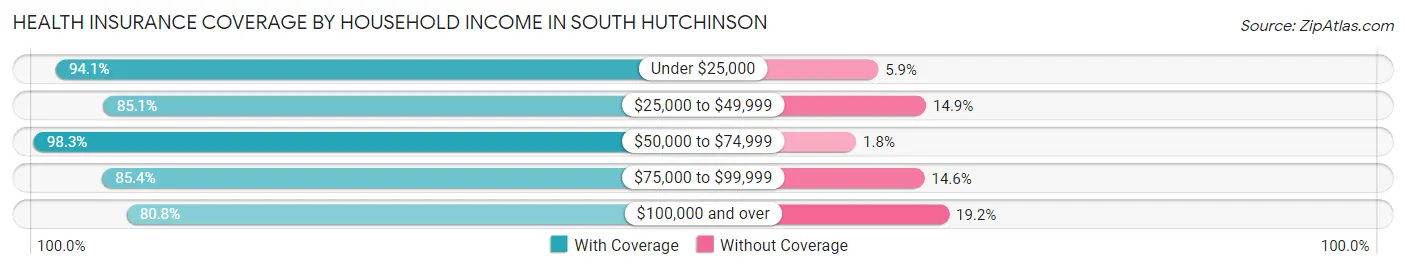
| Household Income | With Coverage | Without Coverage |
| Under $25,000 | 431 (94.1%) | 27 (5.9%) |
| $25,000 to $49,999 | 533 (85.1%) | 93 (14.9%) |
| $50,000 to $74,999 | 394 (98.3%) | 7 (1.8%) |
| $75,000 to $99,999 | 217 (85.4%) | 37 (14.6%) |
| $100,000 and over | 789 (80.8%) | 187 (19.2%) |
Public vs Private Health Insurance Coverage by Age in South Hutchinson
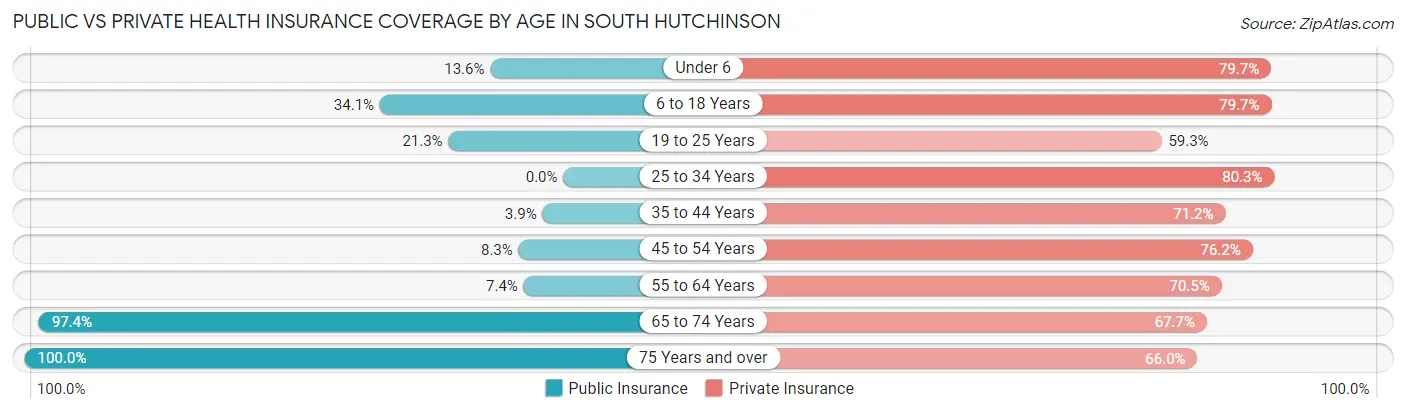
| Age Bracket | Public Insurance | Private Insurance |
| Under 6 | 16 (13.6%) | 94 (79.7%) |
| 6 to 18 Years | 126 (34.1%) | 295 (79.7%) |
| 19 to 25 Years | 32 (21.3%) | 89 (59.3%) |
| 25 to 34 Years | 0 (0.0%) | 297 (80.3%) |
| 35 to 44 Years | 16 (3.9%) | 294 (71.2%) |
| 45 to 54 Years | 22 (8.3%) | 202 (76.2%) |
| 55 to 64 Years | 25 (7.4%) | 239 (70.5%) |
| 65 to 74 Years | 332 (97.4%) | 231 (67.7%) |
| 75 Years and over | 350 (100.0%) | 231 (66.0%) |
| Total | 919 (33.8%) | 1,972 (72.6%) |
Disability Status by Sex by Age in South Hutchinson
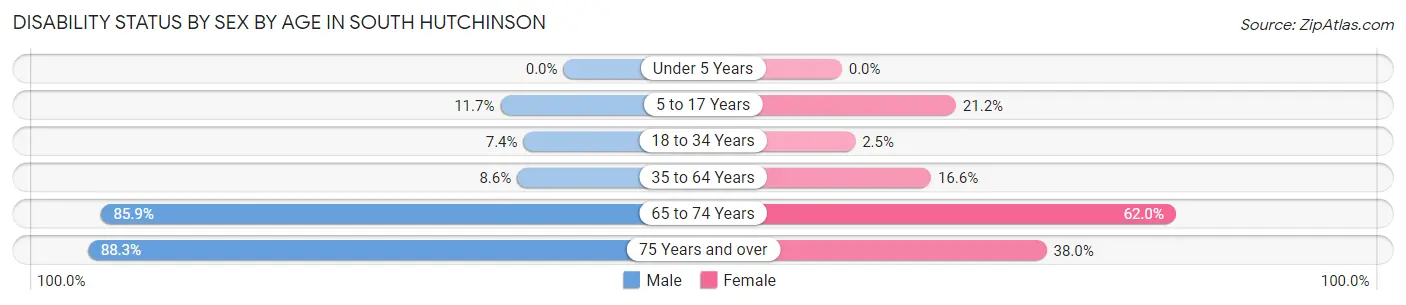
| Age Bracket | Male | Female |
| Under 5 Years | 0 (0.0%) | 0 (0.0%) |
| 5 to 17 Years | 17 (11.7%) | 54 (21.2%) |
| 18 to 34 Years | 25 (7.4%) | 5 (2.5%) |
| 35 to 64 Years | 36 (8.6%) | 99 (16.6%) |
| 65 to 74 Years | 128 (85.9%) | 119 (62.0%) |
| 75 Years and over | 158 (88.3%) | 65 (38.0%) |
Disability Class by Sex by Age in South Hutchinson
Disability Class: Hearing Difficulty
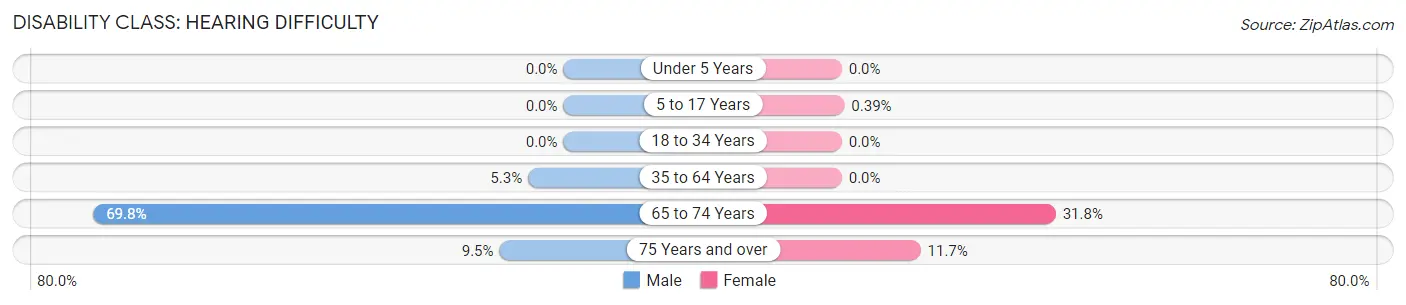
| Age Bracket | Male | Female |
| Under 5 Years | 0 (0.0%) | 0 (0.0%) |
| 5 to 17 Years | 0 (0.0%) | 1 (0.4%) |
| 18 to 34 Years | 0 (0.0%) | 0 (0.0%) |
| 35 to 64 Years | 22 (5.2%) | 0 (0.0%) |
| 65 to 74 Years | 104 (69.8%) | 61 (31.8%) |
| 75 Years and over | 17 (9.5%) | 20 (11.7%) |
Disability Class: Vision Difficulty
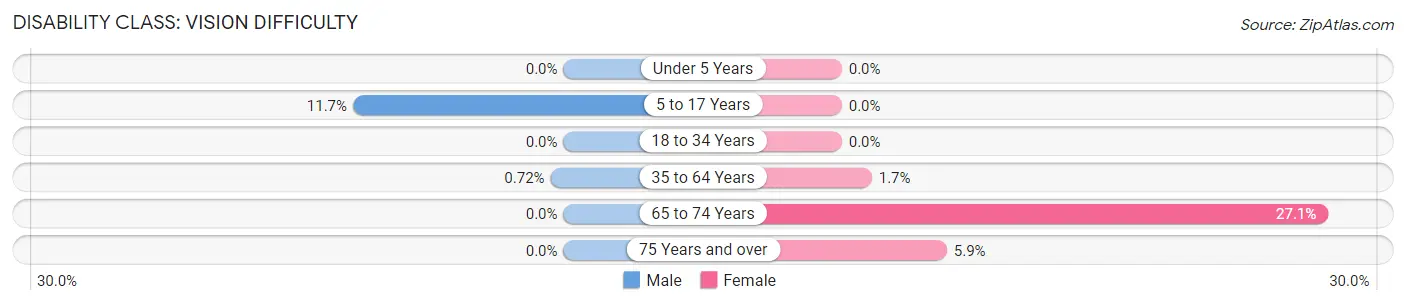
| Age Bracket | Male | Female |
| Under 5 Years | 0 (0.0%) | 0 (0.0%) |
| 5 to 17 Years | 17 (11.7%) | 0 (0.0%) |
| 18 to 34 Years | 0 (0.0%) | 0 (0.0%) |
| 35 to 64 Years | 3 (0.7%) | 10 (1.7%) |
| 65 to 74 Years | 0 (0.0%) | 52 (27.1%) |
| 75 Years and over | 0 (0.0%) | 10 (5.9%) |
Disability Class: Cognitive Difficulty
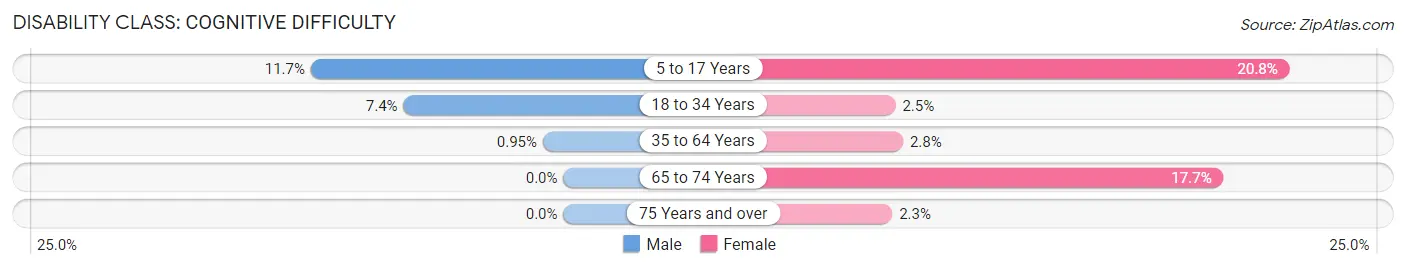
| Age Bracket | Male | Female |
| 5 to 17 Years | 17 (11.7%) | 53 (20.8%) |
| 18 to 34 Years | 25 (7.4%) | 5 (2.5%) |
| 35 to 64 Years | 4 (0.9%) | 17 (2.8%) |
| 65 to 74 Years | 0 (0.0%) | 34 (17.7%) |
| 75 Years and over | 0 (0.0%) | 4 (2.3%) |
Disability Class: Ambulatory Difficulty
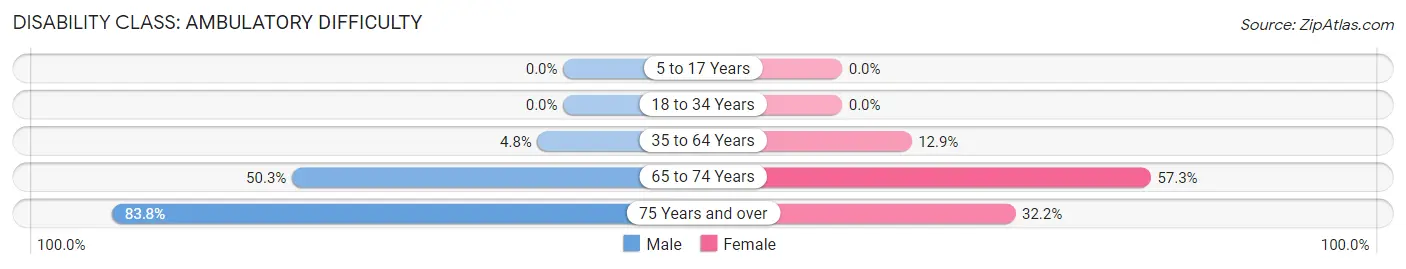
| Age Bracket | Male | Female |
| 5 to 17 Years | 0 (0.0%) | 0 (0.0%) |
| 18 to 34 Years | 0 (0.0%) | 0 (0.0%) |
| 35 to 64 Years | 20 (4.8%) | 77 (12.9%) |
| 65 to 74 Years | 75 (50.3%) | 110 (57.3%) |
| 75 Years and over | 150 (83.8%) | 55 (32.2%) |
Disability Class: Self-Care Difficulty
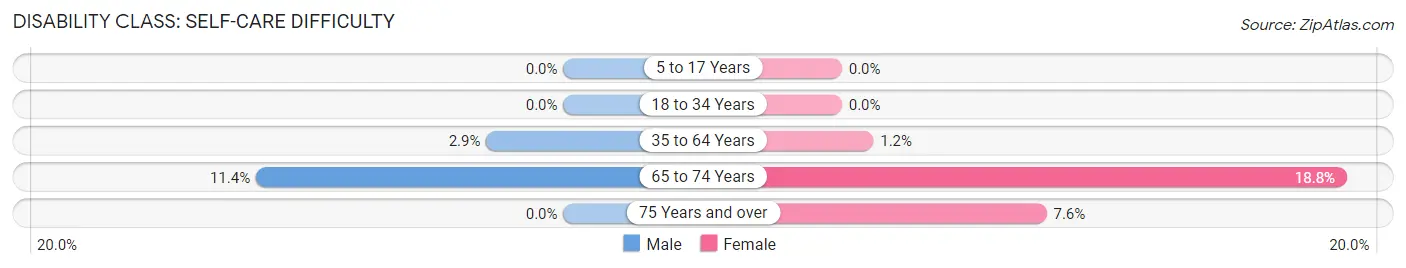
| Age Bracket | Male | Female |
| 5 to 17 Years | 0 (0.0%) | 0 (0.0%) |
| 18 to 34 Years | 0 (0.0%) | 0 (0.0%) |
| 35 to 64 Years | 12 (2.9%) | 7 (1.2%) |
| 65 to 74 Years | 17 (11.4%) | 36 (18.8%) |
| 75 Years and over | 0 (0.0%) | 13 (7.6%) |
Technology Access in South Hutchinson
Computing Device Access in South Hutchinson
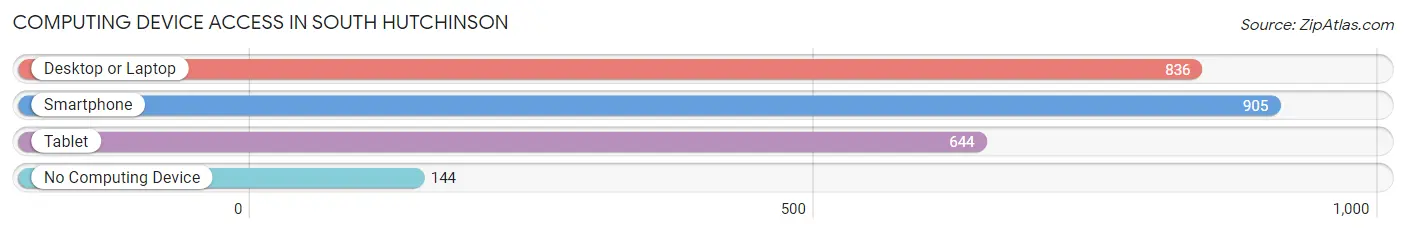
| Device Type | # Households | % Households |
| Desktop or Laptop | 836 | 65.5% |
| Smartphone | 905 | 70.9% |
| Tablet | 644 | 50.5% |
| No Computing Device | 144 | 11.3% |
| Total | 1,276 | 100.0% |
Internet Access in South Hutchinson
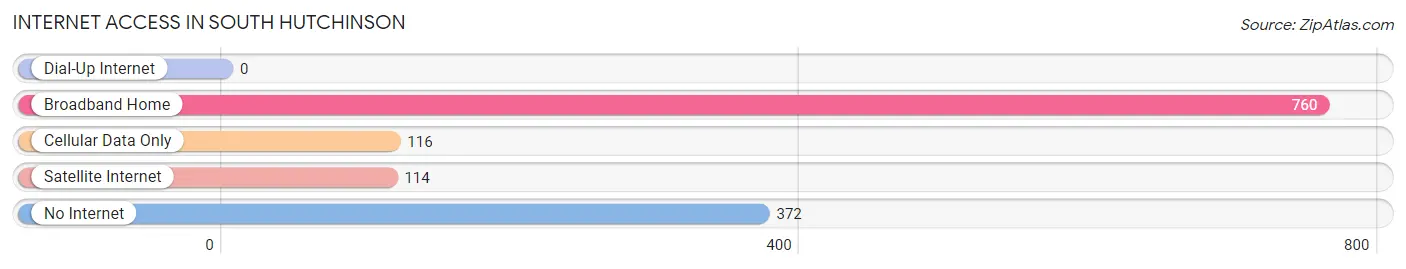
| Internet Type | # Households | % Households |
| Dial-Up Internet | 0 | 0.0% |
| Broadband Home | 760 | 59.6% |
| Cellular Data Only | 116 | 9.1% |
| Satellite Internet | 114 | 8.9% |
| No Internet | 372 | 29.1% |
| Total | 1,276 | 100.0% |
South Hutchinson Summary
History
South Hutchinson is a city located in Reno County, Kansas, United States. It is part of the Hutchinson, Kansas Metropolitan Statistical Area. The city was founded in 1887 and incorporated in 1891. It is located on the south side of the Arkansas River, across from the city of Hutchinson.
The area that is now South Hutchinson was originally inhabited by the Osage and Kaw Native American tribes. The first white settlers arrived in the area in the late 1870s. The town was founded in 1887 by the Hutchinson Land and Town Company, which was formed by a group of investors from Hutchinson. The town was named after the nearby city of Hutchinson.
The town grew rapidly in the late 19th century, and by 1900, it had a population of over 1,000. The town was incorporated in 1891, and by 1910, its population had grown to over 2,000.
The town was a major center for the oil industry in the early 20th century. The first oil well was drilled in the area in 1901, and by the 1920s, the town was home to several oil refineries. The oil industry provided jobs and economic growth for the town, and by the 1930s, the population had grown to over 4,000.
The town was also home to several manufacturing plants, including a flour mill, a brick plant, and a canning factory. The town also had a large number of retail stores, including several department stores.
The town was also home to several churches, including the First Presbyterian Church, which was founded in 1887. The town also had several schools, including South Hutchinson High School, which was founded in 1891.
The town was also home to several parks, including the South Hutchinson Park, which was established in 1910. The park was home to a swimming pool, a baseball diamond, and a playground.
The town was also home to several newspapers, including the South Hutchinson News, which was founded in 1891.
Geography
South Hutchinson is located in Reno County, Kansas, United States. It is located on the south side of the Arkansas River, across from the city of Hutchinson. The city has a total area of 2.2 square miles, all of which is land.
The city is located in the Central Plains region of the United States. The climate is characterized by hot, humid summers and cold, dry winters. The average annual temperature is 54°F, and the average annual precipitation is 28 inches.
Economy
The economy of South Hutchinson is largely based on agriculture and manufacturing. The city is home to several manufacturing plants, including a flour mill, a brick plant, and a canning factory. The city is also home to several retail stores, including several department stores.
The city is also home to several oil refineries, which provide jobs and economic growth for the city. The city is also home to several churches, schools, and parks.
Demographics
As of the 2010 census, the population of South Hutchinson was 4,845. The racial makeup of the city was 95.3% White, 0.7% African American, 0.3% Native American, 0.5% Asian, 0.1% Pacific Islander, 1.2% from other races, and 2.0% from two or more races. Hispanic or Latino of any race were 3.2% of the population.
The median household income in South Hutchinson was $41,944, and the median family income was $50,938. The per capita income was $20,945. About 8.3% of families and 10.7% of the population were below the poverty line, including 14.2% of those under age 18 and 8.2% of those age 65 or over.
Common Questions
What is Per Capita Income in South Hutchinson?
Per Capita income in South Hutchinson is $32,854.
What is the Median Family Income in South Hutchinson?
Median Family Income in South Hutchinson is $63,043.
What is the Median Household income in South Hutchinson?
Median Household Income in South Hutchinson is $41,936.
What is Income or Wage Gap in South Hutchinson?
Income or Wage Gap in South Hutchinson is 35.1%.
Women in South Hutchinson earn 64.9 cents for every dollar earned by a man.
What is Inequality or Gini Index in South Hutchinson?
Inequality or Gini Index in South Hutchinson is 0.48.
What is the Total Population of South Hutchinson?
Total Population of South Hutchinson is 2,820.
What is the Total Male Population of South Hutchinson?
Total Male Population of South Hutchinson is 1,338.
What is the Total Female Population of South Hutchinson?
Total Female Population of South Hutchinson is 1,482.
What is the Ratio of Males per 100 Females in South Hutchinson?
There are 90.28 Males per 100 Females in South Hutchinson.
What is the Ratio of Females per 100 Males in South Hutchinson?
There are 110.76 Females per 100 Males in South Hutchinson.
What is the Median Population Age in South Hutchinson?
Median Population Age in South Hutchinson is 44.9 Years.
What is the Average Family Size in South Hutchinson
Average Family Size in South Hutchinson is 2.9 People.
What is the Average Household Size in South Hutchinson
Average Household Size in South Hutchinson is 2.1 People.
How Large is the Labor Force in South Hutchinson?
There are 1,415 People in the Labor Forcein in South Hutchinson.
What is the Percentage of People in the Labor Force in South Hutchinson?
56.3% of People are in the Labor Force in South Hutchinson.
What is the Unemployment Rate in South Hutchinson?
Unemployment Rate in South Hutchinson is 4.2%.