Rosalia, KS Map & Demographics
Rosalia Map
Rosalia Overview
$50,205
PER CAPITA INCOME
0.59
INEQUALITY / GINI INDEX
152
TOTAL POPULATION
71
MALE POPULATION
81
FEMALE POPULATION
87.65
MALES / 100 FEMALES
114.08
FEMALES / 100 MALES
28.4
MEDIAN AGE
3.4
AVG FAMILY SIZE
3.1
AVG HOUSEHOLD SIZE
63
LABOR FORCE [ PEOPLE ]
64.9%
PERCENT IN LABOR FORCE
Rosalia Zip Codes
Rosalia Area Codes
Income in Rosalia
Income Overview in Rosalia
| Characteristic | Number | Measure |
| Per Capita Income | 152 | $50,205 |
| Median Family Income | 43 | $0 |
| Mean Family Income | 43 | $82,195 |
| Median Household Income | 49 | $0 |
| Mean Household Income | 49 | $149,576 |
| Income Deficit | 43 | $0 |
| Wage / Income Gap (%) | 152 | 0.00% |
| Wage / Income Gap ($) | 152 | 100.00¢ per $1 |
| Gini / Inequality Index | 152 | 0.59 |
Earnings by Sex in Rosalia
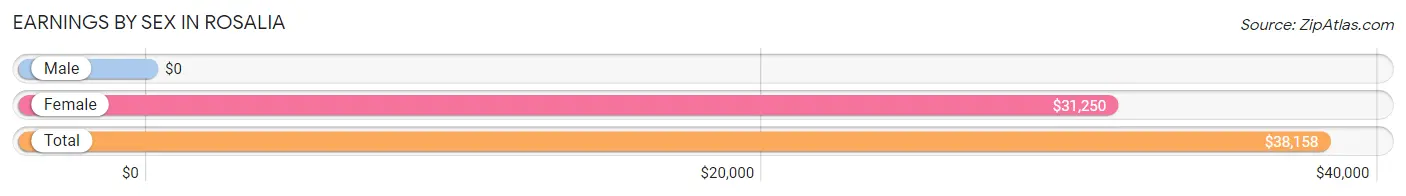
| Sex | Number | Average Earnings |
| Male | 40 (60.6%) | $0 |
| Female | 26 (39.4%) | $31,250 |
| Total | 66 (100.0%) | $38,158 |
Earnings by Sex by Income Bracket in Rosalia
The most common earnings brackets in Rosalia are $35,000 to $39,999 for men (19 | 47.5%) and $22,500 to $24,999 for women (10 | 38.5%).
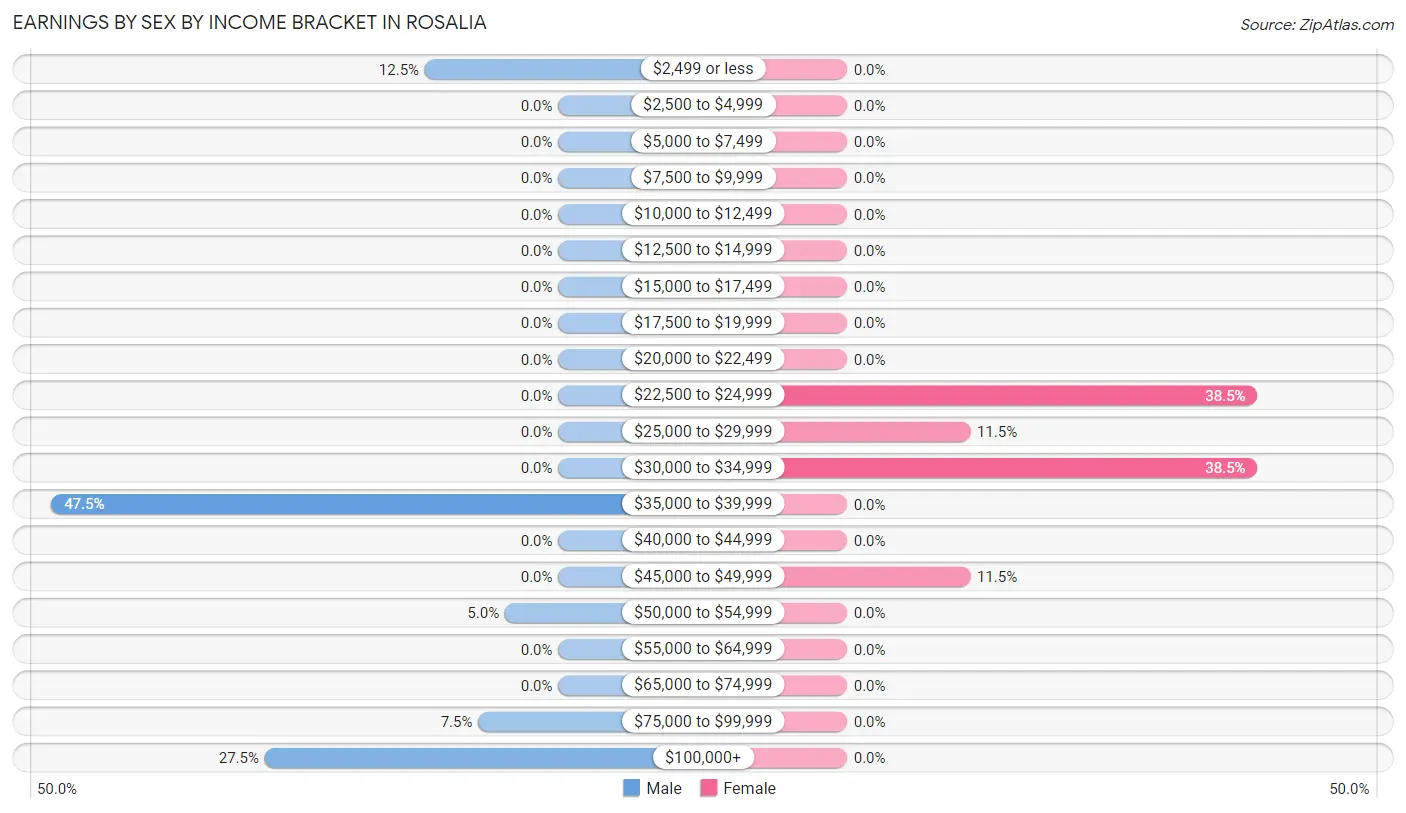
| Income | Male | Female |
| $2,499 or less | 5 (12.5%) | 0 (0.0%) |
| $2,500 to $4,999 | 0 (0.0%) | 0 (0.0%) |
| $5,000 to $7,499 | 0 (0.0%) | 0 (0.0%) |
| $7,500 to $9,999 | 0 (0.0%) | 0 (0.0%) |
| $10,000 to $12,499 | 0 (0.0%) | 0 (0.0%) |
| $12,500 to $14,999 | 0 (0.0%) | 0 (0.0%) |
| $15,000 to $17,499 | 0 (0.0%) | 0 (0.0%) |
| $17,500 to $19,999 | 0 (0.0%) | 0 (0.0%) |
| $20,000 to $22,499 | 0 (0.0%) | 0 (0.0%) |
| $22,500 to $24,999 | 0 (0.0%) | 10 (38.5%) |
| $25,000 to $29,999 | 0 (0.0%) | 3 (11.5%) |
| $30,000 to $34,999 | 0 (0.0%) | 10 (38.5%) |
| $35,000 to $39,999 | 19 (47.5%) | 0 (0.0%) |
| $40,000 to $44,999 | 0 (0.0%) | 0 (0.0%) |
| $45,000 to $49,999 | 0 (0.0%) | 3 (11.5%) |
| $50,000 to $54,999 | 2 (5.0%) | 0 (0.0%) |
| $55,000 to $64,999 | 0 (0.0%) | 0 (0.0%) |
| $65,000 to $74,999 | 0 (0.0%) | 0 (0.0%) |
| $75,000 to $99,999 | 3 (7.5%) | 0 (0.0%) |
| $100,000+ | 11 (27.5%) | 0 (0.0%) |
| Total | 40 (100.0%) | 26 (100.0%) |
Earnings by Sex by Educational Attainment in Rosalia
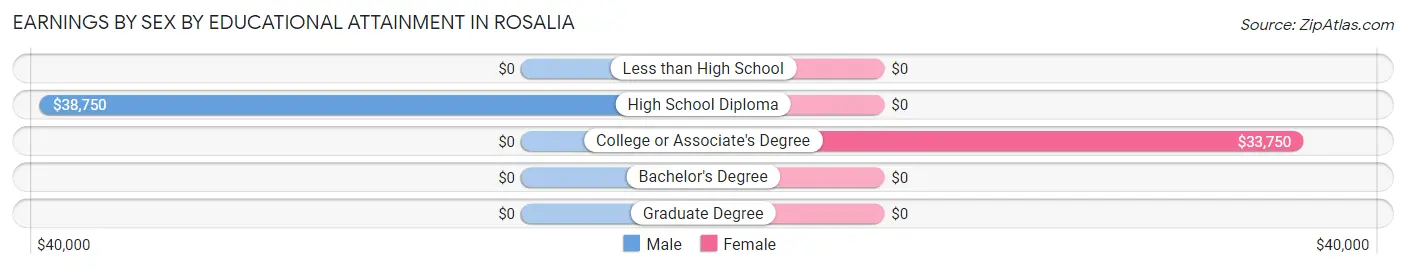
| Educational Attainment | Male Income | Female Income |
| Less than High School | - | - |
| High School Diploma | $38,750 | $0 |
| College or Associate's Degree | - | - |
| Bachelor's Degree | - | - |
| Graduate Degree | - | - |
| Total | - | - |
Family Income in Rosalia
Family Income Brackets in Rosalia
According to the Rosalia family income data, there are 15 families falling into the $100,000 to $149,999 income range, which is the most common income bracket and makes up 34.9% of all families.
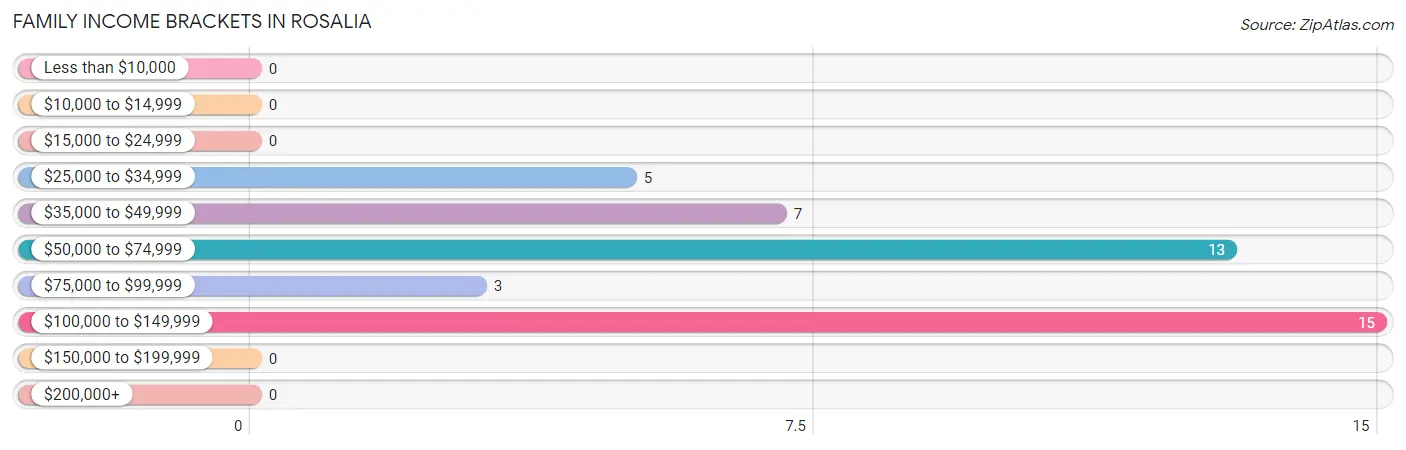
| Income Bracket | # Families | % Families |
| Less than $10,000 | 0 | 0.0% |
| $10,000 to $14,999 | 0 | 0.0% |
| $15,000 to $24,999 | 0 | 0.0% |
| $25,000 to $34,999 | 5 | 11.6% |
| $35,000 to $49,999 | 7 | 16.3% |
| $50,000 to $74,999 | 13 | 30.2% |
| $75,000 to $99,999 | 3 | 7.0% |
| $100,000 to $149,999 | 15 | 34.9% |
| $150,000 to $199,999 | 0 | 0.0% |
| $200,000+ | 0 | 0.0% |
Family Income by Famaliy Size in Rosalia
2-person families (15 | 34.9%) account for the highest median family income in Rosalia with $64,375 per family, while 2-person families (15 | 34.9%) have the highest median income of $32,188 per family member.
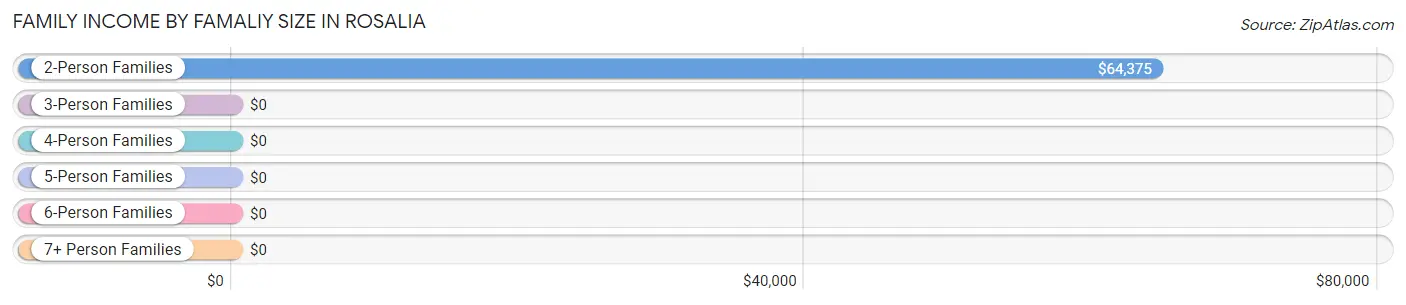
| Income Bracket | # Families | Median Income |
| 2-Person Families | 15 (34.9%) | $64,375 |
| 3-Person Families | 8 (18.6%) | $0 |
| 4-Person Families | 14 (32.6%) | $0 |
| 5-Person Families | 2 (4.6%) | $0 |
| 6-Person Families | 4 (9.3%) | $0 |
| 7+ Person Families | 0 (0.0%) | $0 |
| Total | 43 (100.0%) | $0 |
Family Income by Number of Earners in Rosalia
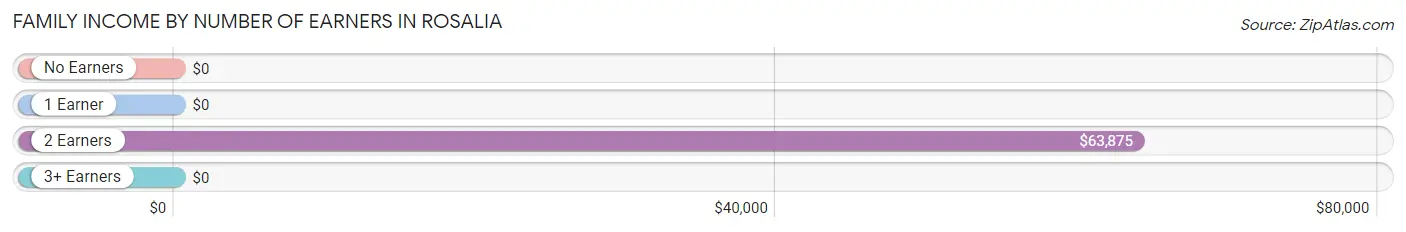
| Number of Earners | # Families | Median Income |
| No Earners | 0 (0.0%) | $0 |
| 1 Earner | 26 (60.5%) | $0 |
| 2 Earners | 17 (39.5%) | $63,875 |
| 3+ Earners | 0 (0.0%) | $0 |
| Total | 43 (100.0%) | $0 |
Household Income in Rosalia
Household Income Brackets in Rosalia
With 15 households falling in the category, the $100,000 to $149,999 income range is the most frequent in Rosalia, accounting for 30.6% of all households.
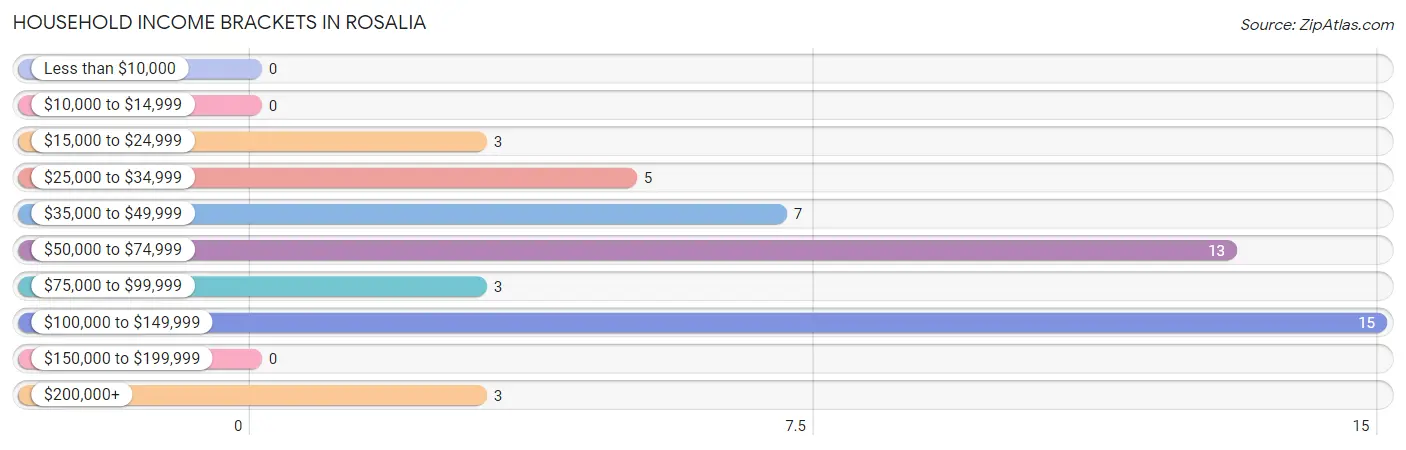
| Income Bracket | # Households | % Households |
| Less than $10,000 | 0 | 0.0% |
| $10,000 to $14,999 | 0 | 0.0% |
| $15,000 to $24,999 | 3 | 6.1% |
| $25,000 to $34,999 | 5 | 10.2% |
| $35,000 to $49,999 | 7 | 14.3% |
| $50,000 to $74,999 | 13 | 26.5% |
| $75,000 to $99,999 | 3 | 6.1% |
| $100,000 to $149,999 | 15 | 30.6% |
| $150,000 to $199,999 | 0 | 0.0% |
| $200,000+ | 3 | 6.1% |
Household Income by Householder Age in Rosalia
| Income Bracket | # Households | Median Income |
| 15 to 24 Years | 0 (0.0%) | $0 |
| 25 to 44 Years | 38 (77.5%) | $0 |
| 45 to 64 Years | 0 (0.0%) | $0 |
| 65+ Years | 11 (22.5%) | $0 |
| Total | 49 (100.0%) | $0 |
Poverty in Rosalia
Income Below Poverty by Sex and Age in Rosalia
With 7.0% poverty level for males and 23.5% for females among the residents of Rosalia, 25 to 34 year old males and 5 year old females are the most vulnerable to poverty, with 5 males (16.7%) and 4 females (100.0%) in their respective age groups living below the poverty level.
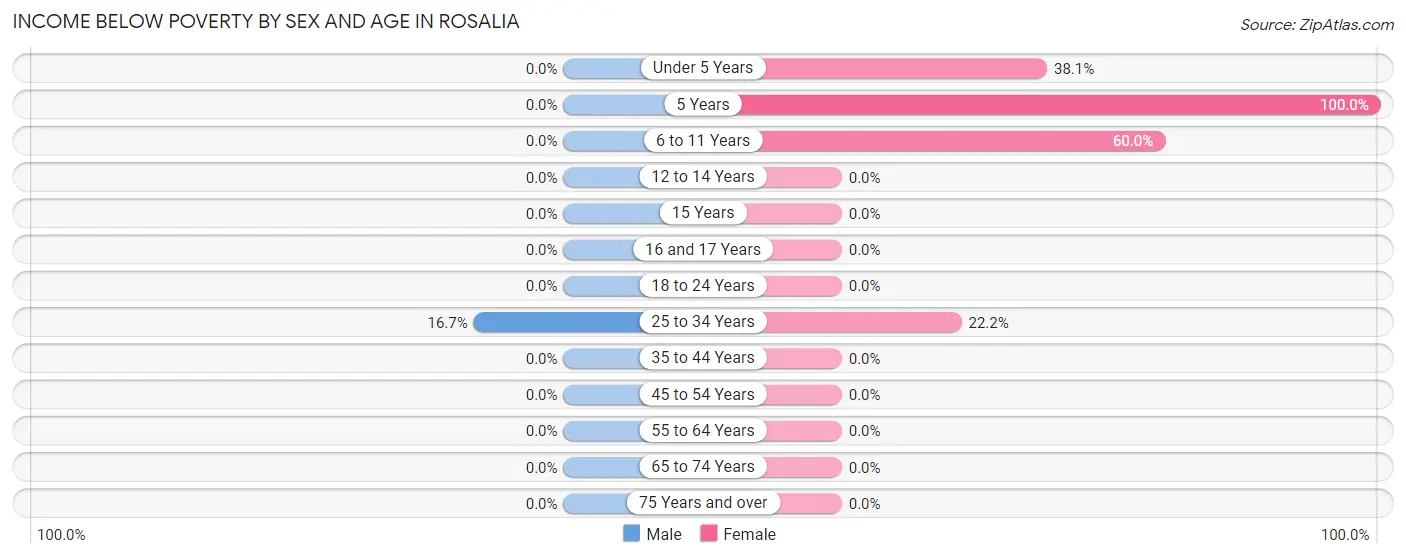
| Age Bracket | Male | Female |
| Under 5 Years | 0 (0.0%) | 8 (38.1%) |
| 5 Years | 0 (0.0%) | 4 (100.0%) |
| 6 to 11 Years | 0 (0.0%) | 3 (60.0%) |
| 12 to 14 Years | 0 (0.0%) | 0 (0.0%) |
| 15 Years | 0 (0.0%) | 0 (0.0%) |
| 16 and 17 Years | 0 (0.0%) | 0 (0.0%) |
| 18 to 24 Years | 0 (0.0%) | 0 (0.0%) |
| 25 to 34 Years | 5 (16.7%) | 4 (22.2%) |
| 35 to 44 Years | 0 (0.0%) | 0 (0.0%) |
| 45 to 54 Years | 0 (0.0%) | 0 (0.0%) |
| 55 to 64 Years | 0 (0.0%) | 0 (0.0%) |
| 65 to 74 Years | 0 (0.0%) | 0 (0.0%) |
| 75 Years and over | 0 (0.0%) | 0 (0.0%) |
| Total | 5 (7.0%) | 19 (23.5%) |
Income Above Poverty by Sex and Age in Rosalia
According to the poverty statistics in Rosalia, males aged under 5 years and females aged 12 to 14 years are the age groups that are most secure financially, with 100.0% of males and 100.0% of females in these age groups living above the poverty line.
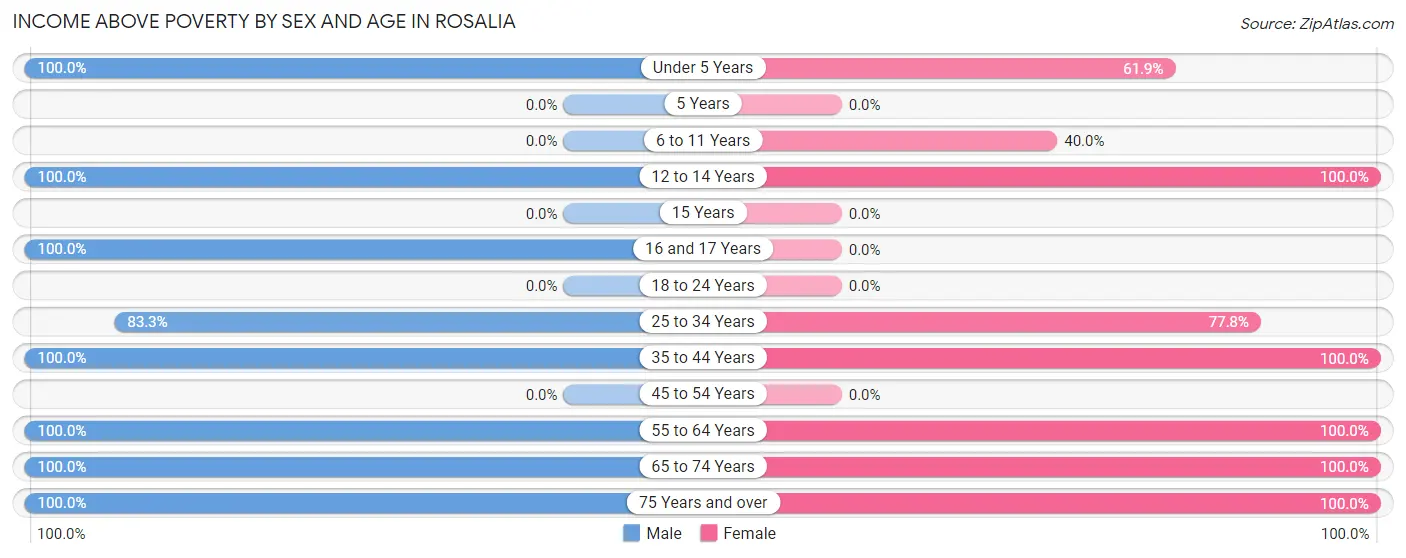
| Age Bracket | Male | Female |
| Under 5 Years | 15 (100.0%) | 13 (61.9%) |
| 5 Years | 0 (0.0%) | 0 (0.0%) |
| 6 to 11 Years | 0 (0.0%) | 2 (40.0%) |
| 12 to 14 Years | 7 (100.0%) | 3 (100.0%) |
| 15 Years | 0 (0.0%) | 0 (0.0%) |
| 16 and 17 Years | 3 (100.0%) | 0 (0.0%) |
| 18 to 24 Years | 0 (0.0%) | 0 (0.0%) |
| 25 to 34 Years | 25 (83.3%) | 14 (77.8%) |
| 35 to 44 Years | 2 (100.0%) | 21 (100.0%) |
| 45 to 54 Years | 0 (0.0%) | 0 (0.0%) |
| 55 to 64 Years | 3 (100.0%) | 3 (100.0%) |
| 65 to 74 Years | 5 (100.0%) | 3 (100.0%) |
| 75 Years and over | 6 (100.0%) | 3 (100.0%) |
| Total | 66 (93.0%) | 62 (76.5%) |
Income Below Poverty Among Married-Couple Families in Rosalia
The poverty statistics for married-couple families in Rosalia show that 12.1% or 4 of the total 33 families live below the poverty line. Families with 3 or 4 children have the highest poverty rate of 100.0%, comprising of 4 families. On the other hand, families with no children have the lowest poverty rate of 0.0%, which includes 0 families.
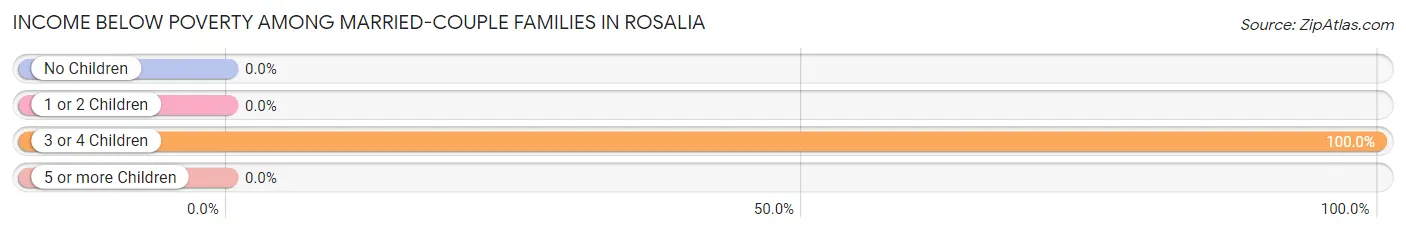
| Children | Above Poverty | Below Poverty |
| No Children | 15 (100.0%) | 0 (0.0%) |
| 1 or 2 Children | 14 (100.0%) | 0 (0.0%) |
| 3 or 4 Children | 0 (0.0%) | 4 (100.0%) |
| 5 or more Children | 0 (0.0%) | 0 (0.0%) |
| Total | 29 (87.9%) | 4 (12.1%) |
Income Below Poverty Among Single-Parent Households in Rosalia
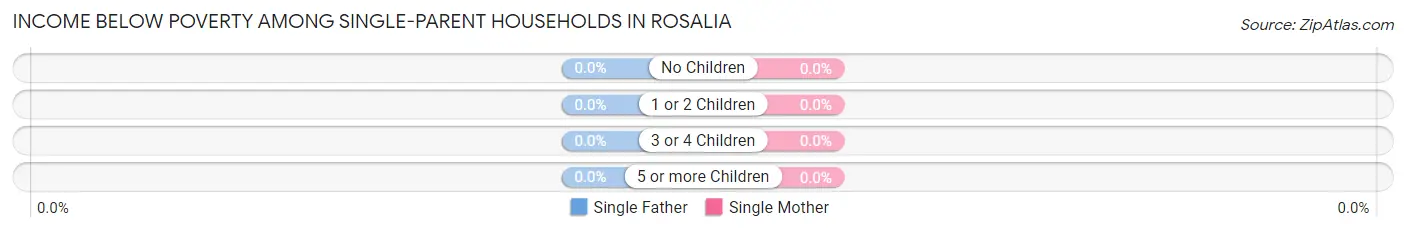
| Children | Single Father | Single Mother |
| No Children | 0 (0.0%) | 0 (0.0%) |
| 1 or 2 Children | 0 (0.0%) | 0 (0.0%) |
| 3 or 4 Children | 0 (0.0%) | 0 (0.0%) |
| 5 or more Children | 0 (0.0%) | 0 (0.0%) |
| Total | 0 (0.0%) | 0 (0.0%) |
Income Below Poverty Among Married-Couple vs Single-Parent Households in Rosalia
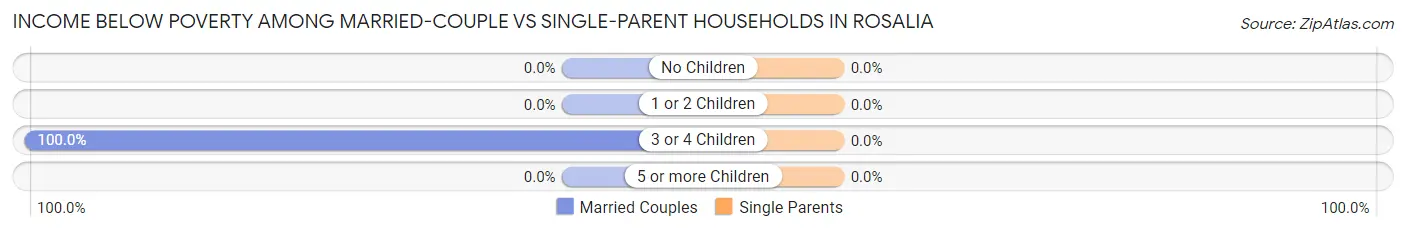
| Children | Married-Couple Families | Single-Parent Households |
| No Children | 0 (0.0%) | 0 (0.0%) |
| 1 or 2 Children | 0 (0.0%) | 0 (0.0%) |
| 3 or 4 Children | 4 (100.0%) | 0 (0.0%) |
| 5 or more Children | 0 (0.0%) | 0 (0.0%) |
| Total | 4 (12.1%) | 0 (0.0%) |
Race in Rosalia
The most populous races in Rosalia are , and White / Caucasian (152 | 100.0%).
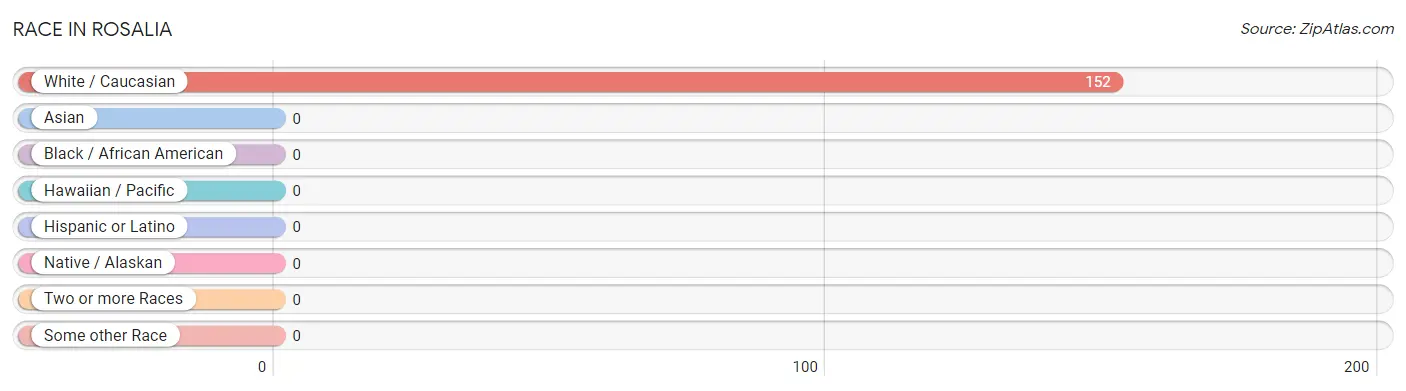
| Race | # Population | % Population |
| Asian | 0 | 0.0% |
| Black / African American | 0 | 0.0% |
| Hawaiian / Pacific | 0 | 0.0% |
| Hispanic or Latino | 0 | 0.0% |
| Native / Alaskan | 0 | 0.0% |
| White / Caucasian | 152 | 100.0% |
| Two or more Races | 0 | 0.0% |
| Some other Race | 0 | 0.0% |
| Total | 152 | 100.0% |
Ancestry in Rosalia
The most populous ancestries reported in Rosalia are American (81 | 53.3%), German (24 | 15.8%), Italian (14 | 9.2%), English (9 | 5.9%), and Dutch (3 | 2.0%), together accounting for 86.2% of all Rosalia residents.
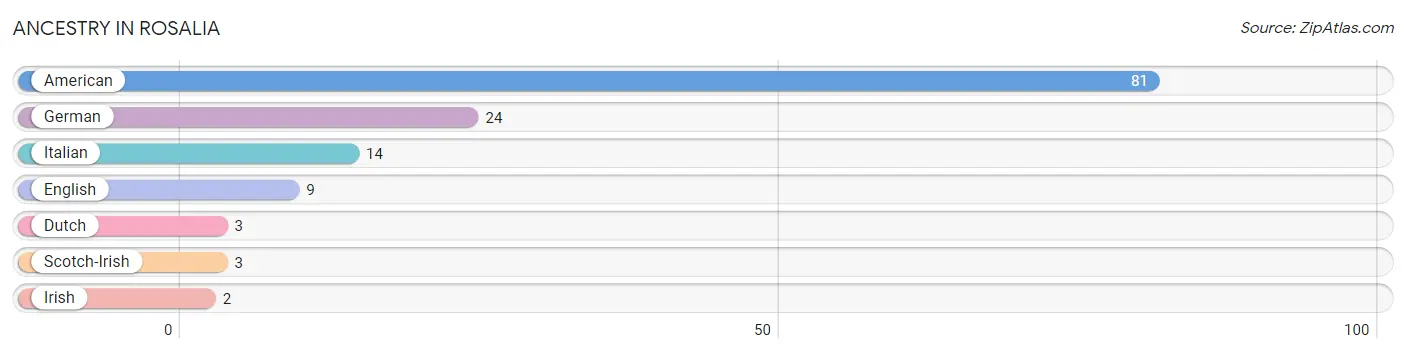
| Ancestry | # Population | % Population |
| American | 81 | 53.3% |
| Dutch | 3 | 2.0% |
| English | 9 | 5.9% |
| German | 24 | 15.8% |
| Irish | 2 | 1.3% |
| Italian | 14 | 9.2% |
| Scotch-Irish | 3 | 2.0% | View All 7 Rows |
Immigrants in Rosalia

| Immigration Origin | # Population | % Population | View All 0 Rows |
Sex and Age in Rosalia
Sex and Age in Rosalia
The most populous age groups in Rosalia are 25 to 29 Years (19 | 26.8%) for men and Under 5 Years (21 | 25.9%) for women.
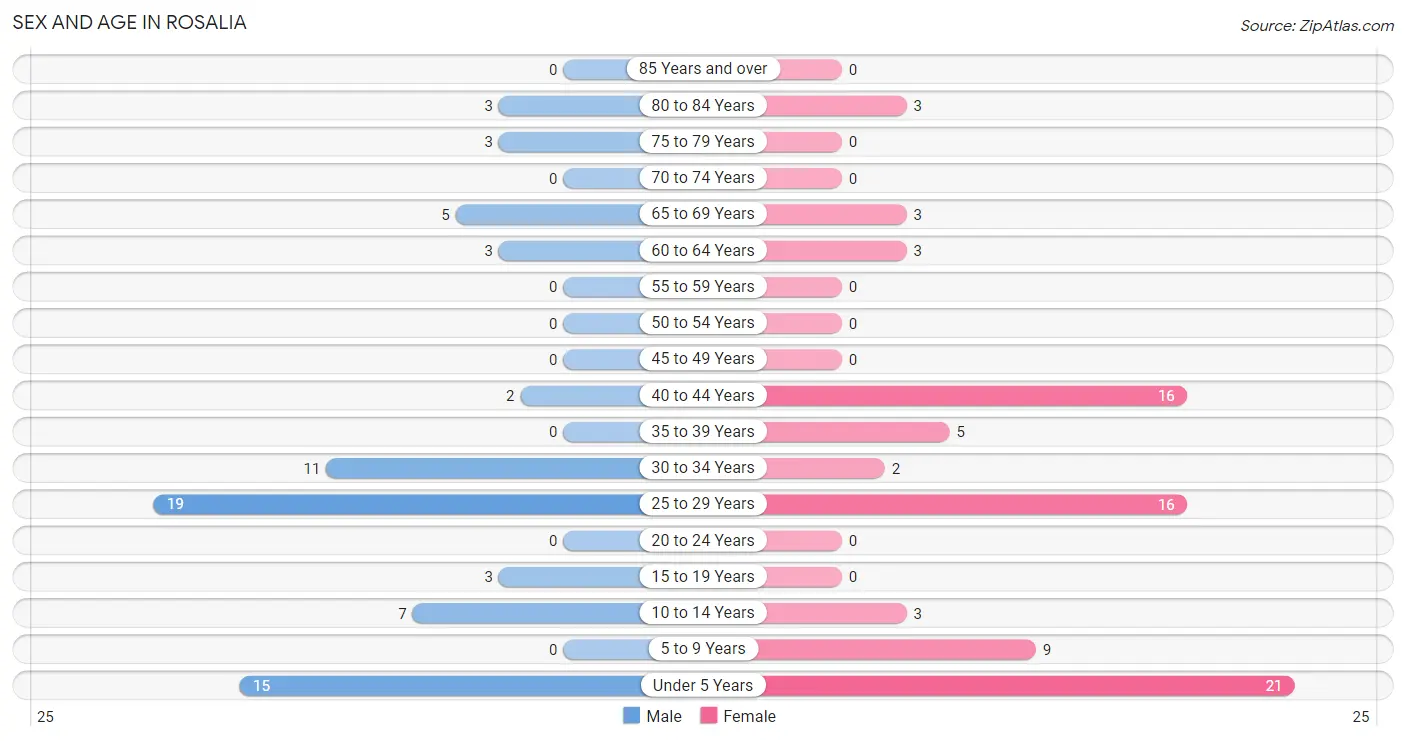
| Age Bracket | Male | Female |
| Under 5 Years | 15 (21.1%) | 21 (25.9%) |
| 5 to 9 Years | 0 (0.0%) | 9 (11.1%) |
| 10 to 14 Years | 7 (9.9%) | 3 (3.7%) |
| 15 to 19 Years | 3 (4.2%) | 0 (0.0%) |
| 20 to 24 Years | 0 (0.0%) | 0 (0.0%) |
| 25 to 29 Years | 19 (26.8%) | 16 (19.8%) |
| 30 to 34 Years | 11 (15.5%) | 2 (2.5%) |
| 35 to 39 Years | 0 (0.0%) | 5 (6.2%) |
| 40 to 44 Years | 2 (2.8%) | 16 (19.8%) |
| 45 to 49 Years | 0 (0.0%) | 0 (0.0%) |
| 50 to 54 Years | 0 (0.0%) | 0 (0.0%) |
| 55 to 59 Years | 0 (0.0%) | 0 (0.0%) |
| 60 to 64 Years | 3 (4.2%) | 3 (3.7%) |
| 65 to 69 Years | 5 (7.0%) | 3 (3.7%) |
| 70 to 74 Years | 0 (0.0%) | 0 (0.0%) |
| 75 to 79 Years | 3 (4.2%) | 0 (0.0%) |
| 80 to 84 Years | 3 (4.2%) | 3 (3.7%) |
| 85 Years and over | 0 (0.0%) | 0 (0.0%) |
| Total | 71 (100.0%) | 81 (100.0%) |
Families and Households in Rosalia
Median Family Size in Rosalia
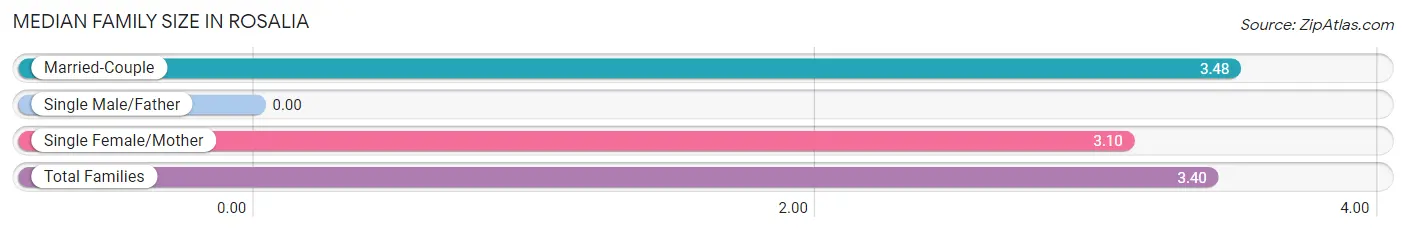
| Family Type | # Families | Family Size |
| Married-Couple | 33 (76.7%) | 3.48 |
| Single Male/Father | 0 (0.0%) | - |
| Single Female/Mother | 10 (23.3%) | 3.10 |
| Total Families | 43 (100.0%) | 3.40 |
Median Household Size in Rosalia
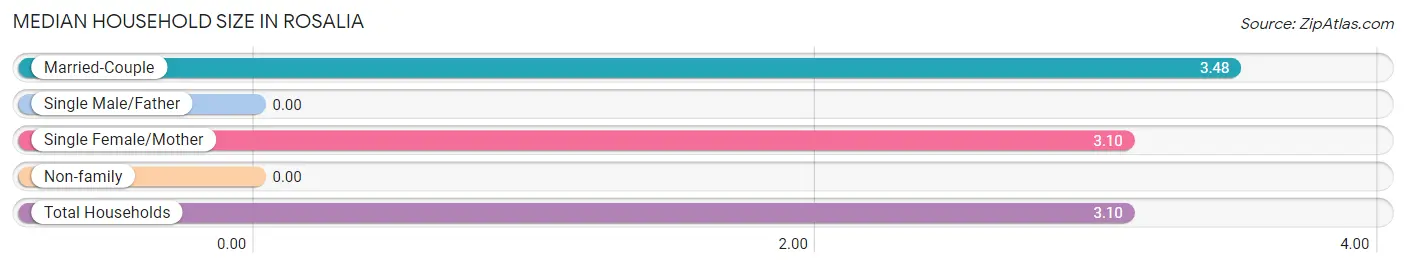
| Household Type | # Households | Household Size |
| Married-Couple | 33 (67.3%) | 3.48 |
| Single Male/Father | 0 (0.0%) | - |
| Single Female/Mother | 10 (20.4%) | 3.10 |
| Non-family | 6 (12.2%) | - |
| Total Households | 49 (100.0%) | 3.10 |
Household Size by Marriage Status in Rosalia
Out of a total of 49 households in Rosalia, 43 (87.8%) are family households, while 6 (12.2%) are nonfamily households. The most numerous type of family households are 2-person households, comprising 15, and the most common type of nonfamily households are 1-person households, comprising 6.
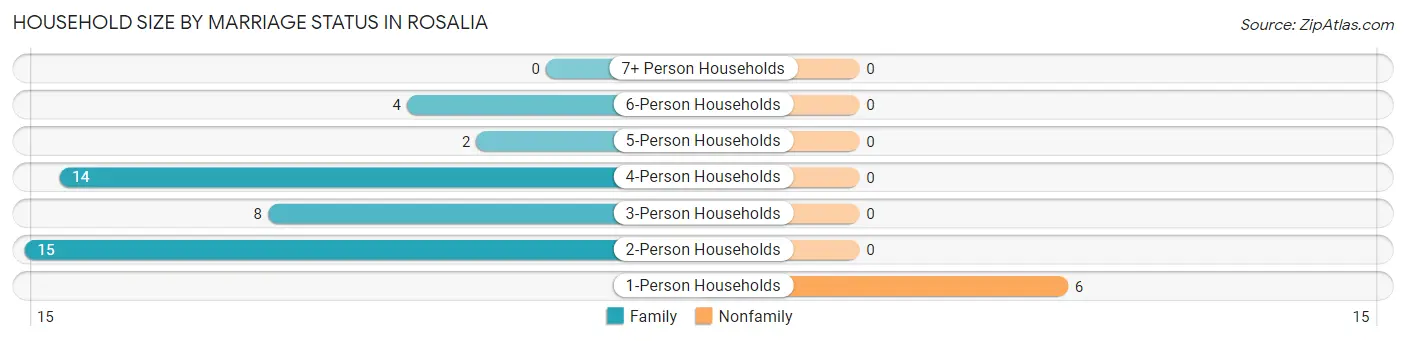
| Household Size | Family Households | Nonfamily Households |
| 1-Person Households | - | 6 (12.2%) |
| 2-Person Households | 15 (30.6%) | 0 (0.0%) |
| 3-Person Households | 8 (16.3%) | 0 (0.0%) |
| 4-Person Households | 14 (28.6%) | 0 (0.0%) |
| 5-Person Households | 2 (4.1%) | 0 (0.0%) |
| 6-Person Households | 4 (8.2%) | 0 (0.0%) |
| 7+ Person Households | 0 (0.0%) | 0 (0.0%) |
| Total | 43 (87.8%) | 6 (12.2%) |
Female Fertility in Rosalia
Fertility by Age in Rosalia
Average fertility rate in Rosalia is 410.0 births per 1,000 women. Women in the age bracket of 20 to 34 years have the highest fertility rate with 889.0 births per 1,000 women. Women in the age bracket of 20 to 34 years acount for 100.0% of all women with births.
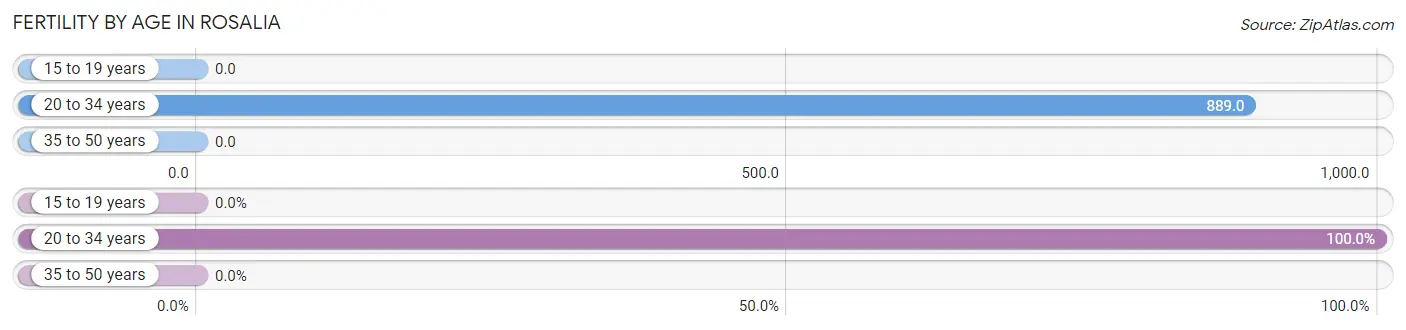
| Age Bracket | Women with Births | Births / 1,000 Women |
| 15 to 19 years | 0 (0.0%) | 0.0 |
| 20 to 34 years | 16 (100.0%) | 889.0 |
| 35 to 50 years | 0 (0.0%) | 0.0 |
| Total | 16 (100.0%) | 410.0 |
Fertility by Age by Marriage Status in Rosalia
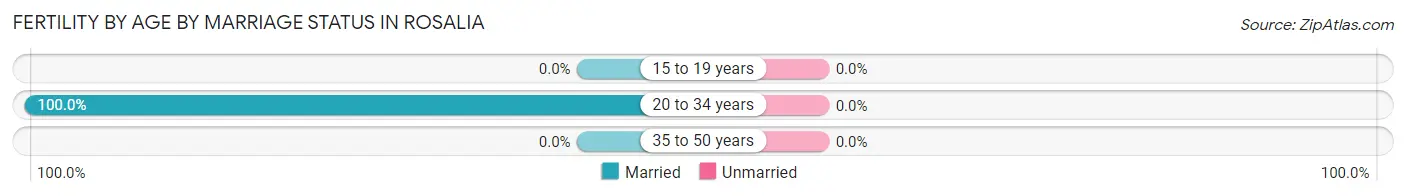
| Age Bracket | Married | Unmarried |
| 15 to 19 years | 0 (0.0%) | 0 (0.0%) |
| 20 to 34 years | 16 (100.0%) | 0 (0.0%) |
| 35 to 50 years | 0 (0.0%) | 0 (0.0%) |
| Total | 16 (100.0%) | 0 (0.0%) |
Fertility by Education in Rosalia
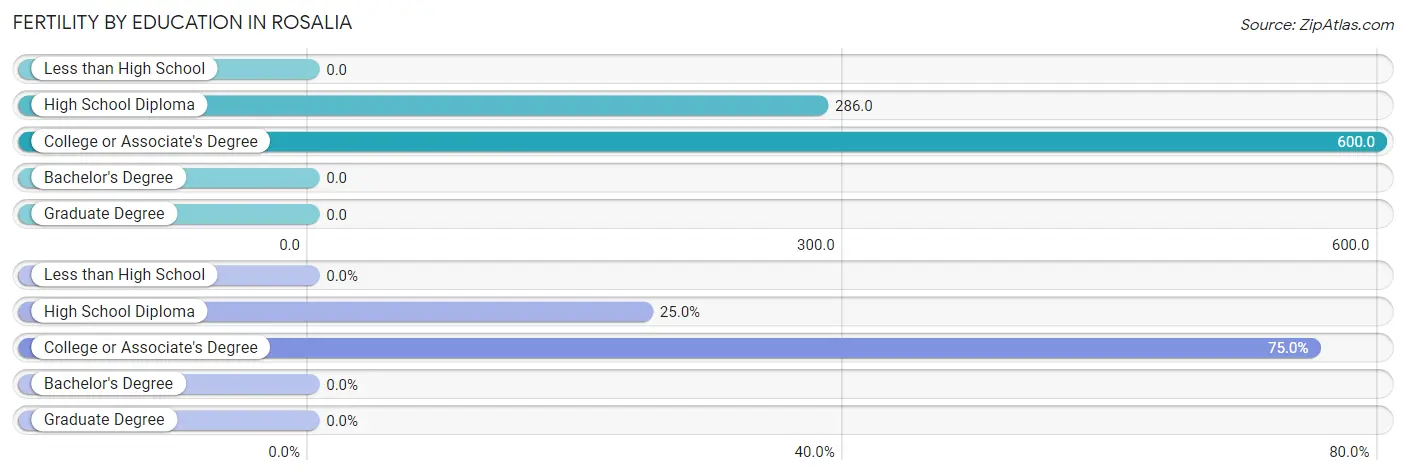
| Educational Attainment | Women with Births | Births / 1,000 Women |
| Less than High School | 0 (0.0%) | 0.0 |
| High School Diploma | 4 (25.0%) | 286.0 |
| College or Associate's Degree | 12 (75.0%) | 600.0 |
| Bachelor's Degree | 0 (0.0%) | 0.0 |
| Graduate Degree | 0 (0.0%) | 0.0 |
| Total | 16 (100.0%) | 410.0 |
Fertility by Education by Marriage Status in Rosalia
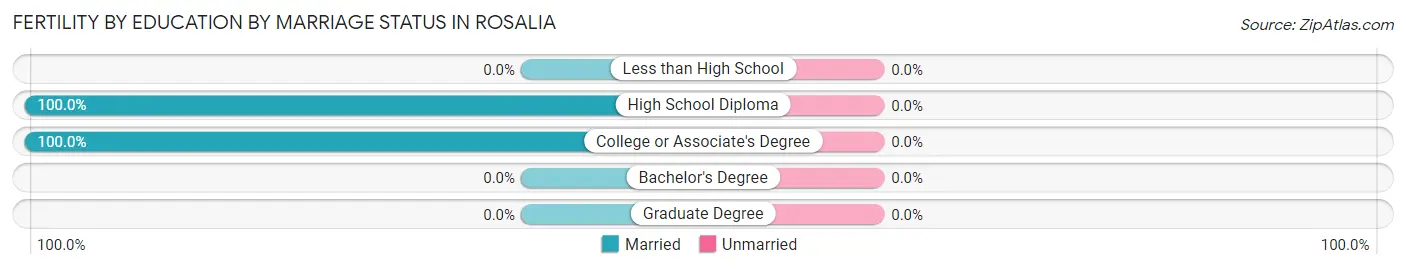
| Educational Attainment | Married | Unmarried |
| Less than High School | 0 (0.0%) | 0 (0.0%) |
| High School Diploma | 4 (100.0%) | 0 (0.0%) |
| College or Associate's Degree | 12 (100.0%) | 0 (0.0%) |
| Bachelor's Degree | 0 (0.0%) | 0 (0.0%) |
| Graduate Degree | 0 (0.0%) | 0 (0.0%) |
| Total | 16 (100.0%) | 0 (0.0%) |
Employment Characteristics in Rosalia
Employment by Class of Employer in Rosalia
Among the 63 employed individuals in Rosalia, private company employees (29 | 46.0%), not-for-profit organizations (19 | 30.2%), and state government employees (10 | 15.9%) make up the most common classes of employment.
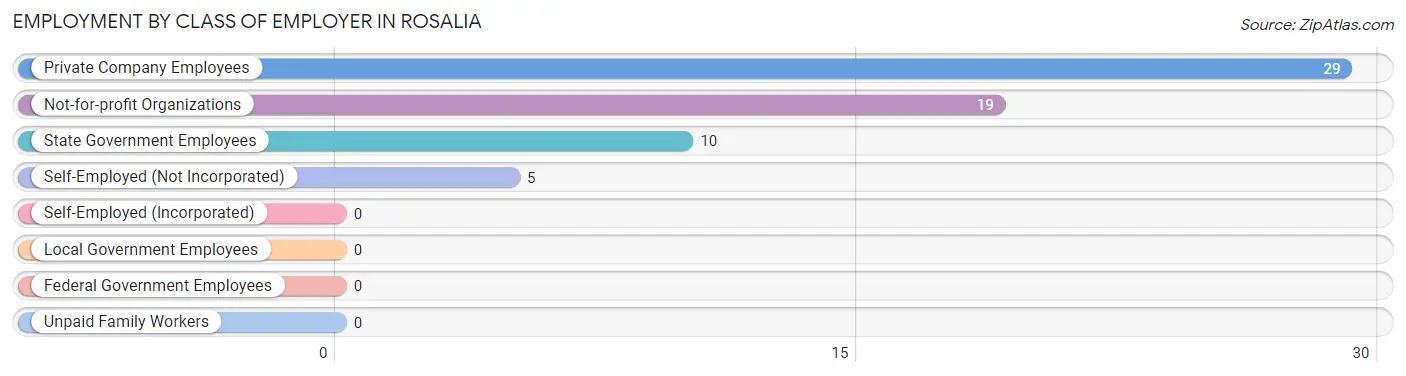
| Employer Class | # Employees | % Employees |
| Private Company Employees | 29 | 46.0% |
| Self-Employed (Incorporated) | 0 | 0.0% |
| Self-Employed (Not Incorporated) | 5 | 7.9% |
| Not-for-profit Organizations | 19 | 30.2% |
| Local Government Employees | 0 | 0.0% |
| State Government Employees | 10 | 15.9% |
| Federal Government Employees | 0 | 0.0% |
| Unpaid Family Workers | 0 | 0.0% |
| Total | 63 | 100.0% |
Employment Status by Age in Rosalia
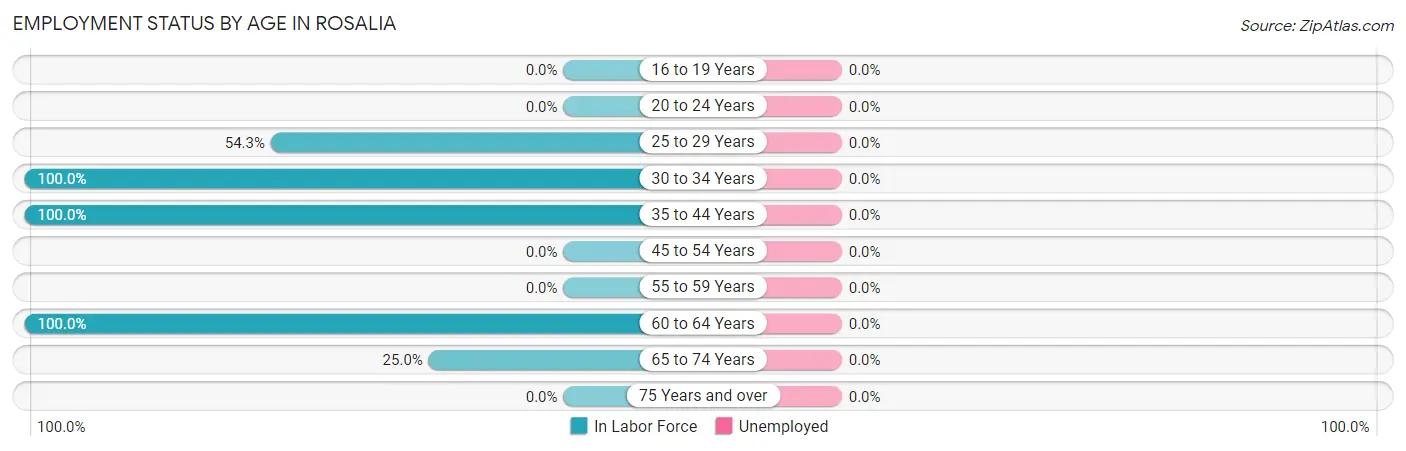
| Age Bracket | In Labor Force | Unemployed |
| 16 to 19 Years | 0 (0.0%) | 0 (0.0%) |
| 20 to 24 Years | 0 (0.0%) | 0 (0.0%) |
| 25 to 29 Years | 19 (54.3%) | 0 (0.0%) |
| 30 to 34 Years | 13 (100.0%) | 0 (0.0%) |
| 35 to 44 Years | 23 (100.0%) | 0 (0.0%) |
| 45 to 54 Years | 0 (0.0%) | 0 (0.0%) |
| 55 to 59 Years | 0 (0.0%) | 0 (0.0%) |
| 60 to 64 Years | 6 (100.0%) | 0 (0.0%) |
| 65 to 74 Years | 2 (25.0%) | 0 (0.0%) |
| 75 Years and over | 0 (0.0%) | 0 (0.0%) |
| Total | 63 (64.9%) | 0 (0.0%) |
Employment Status by Educational Attainment in Rosalia
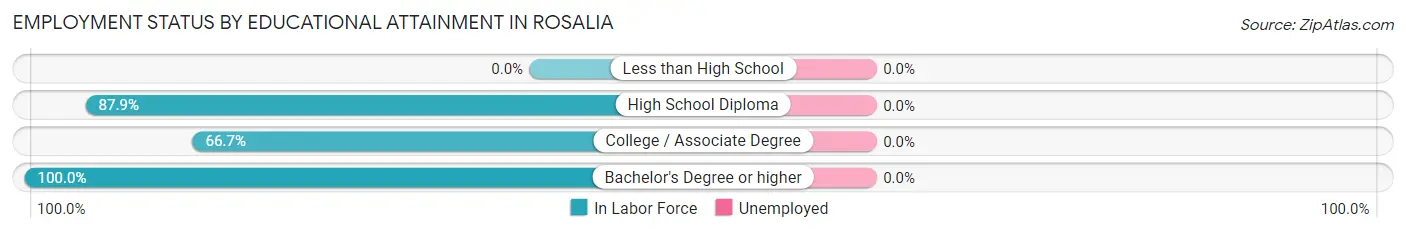
| Educational Attainment | In Labor Force | Unemployed |
| Less than High School | 0 (0.0%) | 0 (0.0%) |
| High School Diploma | 29 (87.9%) | 0 (0.0%) |
| College / Associate Degree | 24 (66.7%) | 0 (0.0%) |
| Bachelor's Degree or higher | 8 (100.0%) | 0 (0.0%) |
| Total | 61 (79.2%) | 0 (0.0%) |
Employment Occupations by Sex in Rosalia
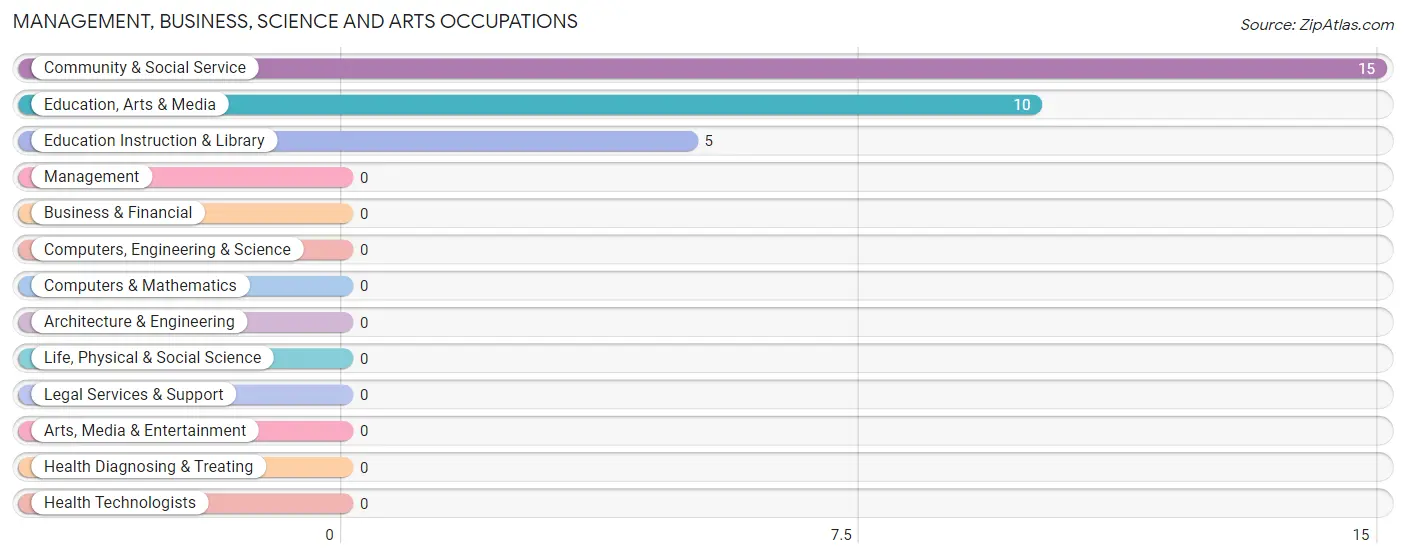
Management, Business, Science and Arts Occupations
The most common Management, Business, Science and Arts occupations in Rosalia are Community & Social Service (15 | 23.8%), Education, Arts & Media (10 | 15.9%), and Education Instruction & Library (5 | 7.9%).
Management, Business, Science and Arts Occupations by Sex
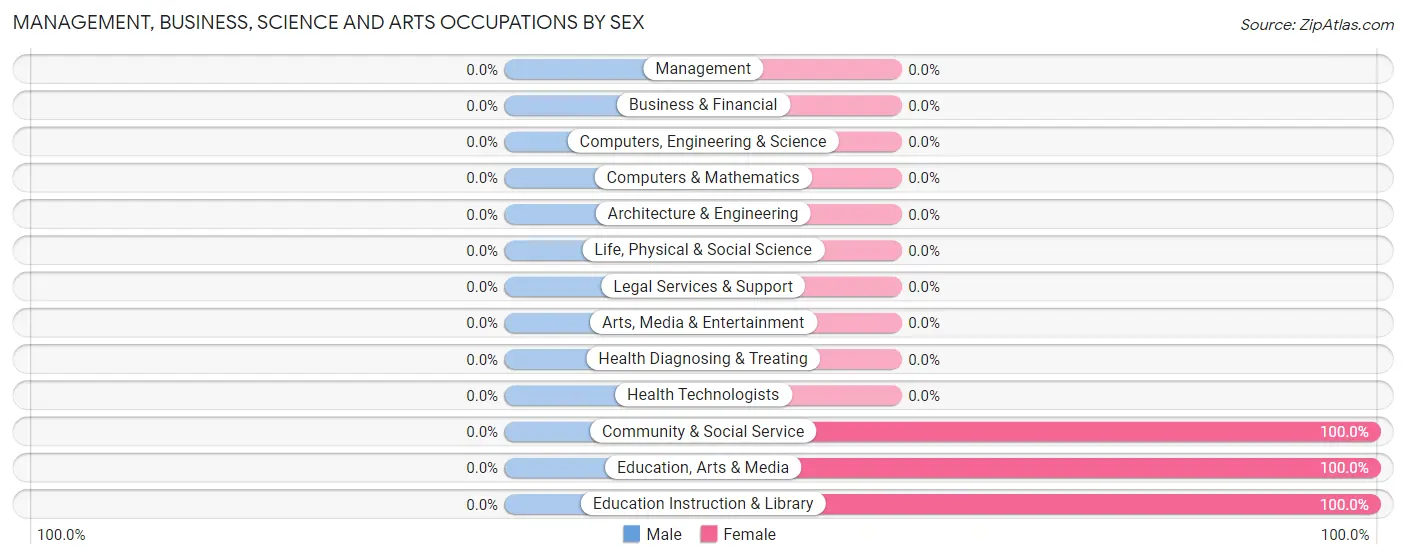
| Occupation | Male | Female |
| Management | 0 (0.0%) | 0 (0.0%) |
| Business & Financial | 0 (0.0%) | 0 (0.0%) |
| Computers, Engineering & Science | 0 (0.0%) | 0 (0.0%) |
| Computers & Mathematics | 0 (0.0%) | 0 (0.0%) |
| Architecture & Engineering | 0 (0.0%) | 0 (0.0%) |
| Life, Physical & Social Science | 0 (0.0%) | 0 (0.0%) |
| Community & Social Service | 0 (0.0%) | 15 (100.0%) |
| Education, Arts & Media | 0 (0.0%) | 10 (100.0%) |
| Legal Services & Support | 0 (0.0%) | 0 (0.0%) |
| Education Instruction & Library | 0 (0.0%) | 5 (100.0%) |
| Arts, Media & Entertainment | 0 (0.0%) | 0 (0.0%) |
| Health Diagnosing & Treating | 0 (0.0%) | 0 (0.0%) |
| Health Technologists | 0 (0.0%) | 0 (0.0%) |
| Total (Category) | 0 (0.0%) | 15 (100.0%) |
| Total (Overall) | 37 (58.7%) | 26 (41.3%) |
Services Occupations
The most common Services occupations in Rosalia are , and Healthcare Support (5 | 7.9%).
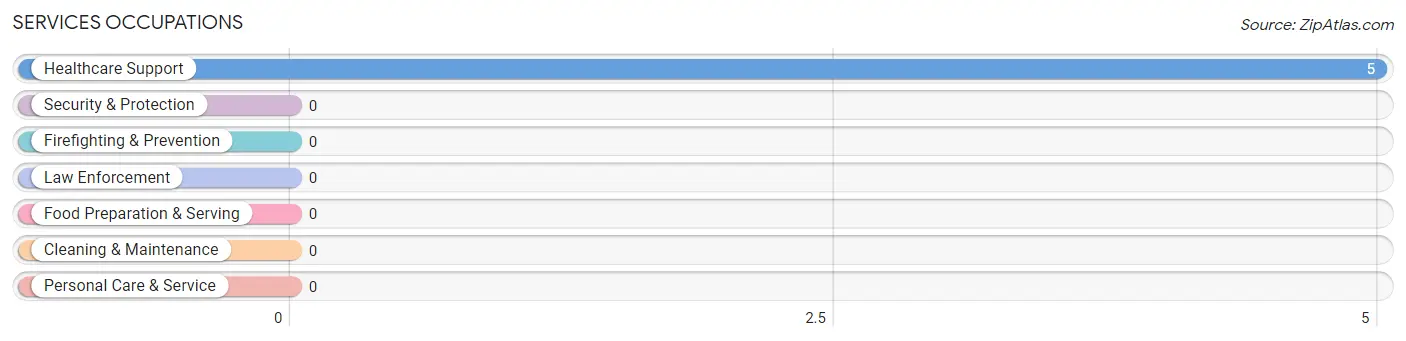
Services Occupations by Sex
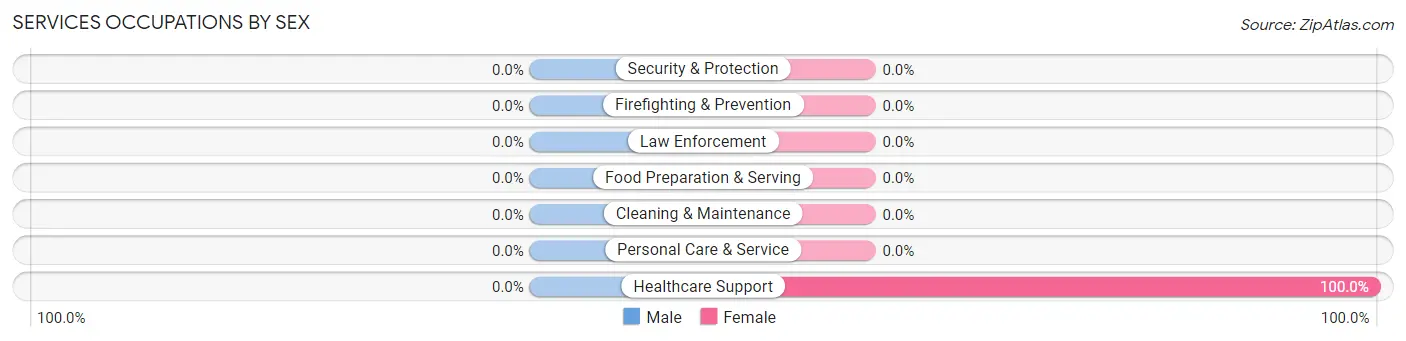
| Occupation | Male | Female |
| Healthcare Support | 0 (0.0%) | 5 (100.0%) |
| Security & Protection | 0 (0.0%) | 0 (0.0%) |
| Firefighting & Prevention | 0 (0.0%) | 0 (0.0%) |
| Law Enforcement | 0 (0.0%) | 0 (0.0%) |
| Food Preparation & Serving | 0 (0.0%) | 0 (0.0%) |
| Cleaning & Maintenance | 0 (0.0%) | 0 (0.0%) |
| Personal Care & Service | 0 (0.0%) | 0 (0.0%) |
| Total (Category) | 0 (0.0%) | 5 (100.0%) |
| Total (Overall) | 37 (58.7%) | 26 (41.3%) |
Sales and Office Occupations
The most common Sales and Office occupations in Rosalia are , and Office & Administration (6 | 9.5%).
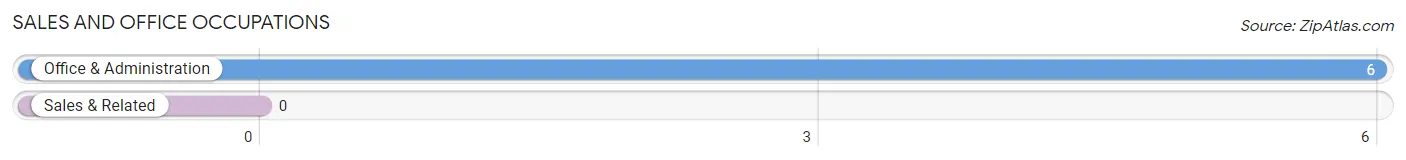
Sales and Office Occupations by Sex
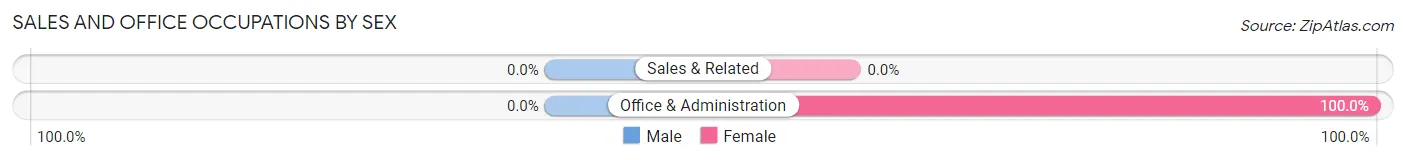
| Occupation | Male | Female |
| Sales & Related | 0 (0.0%) | 0 (0.0%) |
| Office & Administration | 0 (0.0%) | 6 (100.0%) |
| Total (Category) | 0 (0.0%) | 6 (100.0%) |
| Total (Overall) | 37 (58.7%) | 26 (41.3%) |
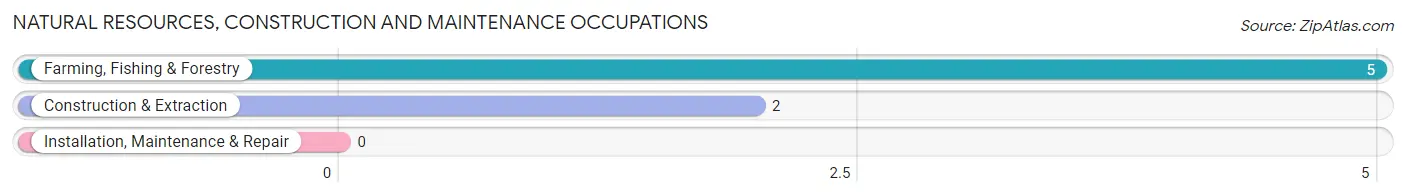
Natural Resources, Construction and Maintenance Occupations
The most common Natural Resources, Construction and Maintenance occupations in Rosalia are Farming, Fishing & Forestry (5 | 7.9%), and Construction & Extraction (2 | 3.2%).
Natural Resources, Construction and Maintenance Occupations by Sex
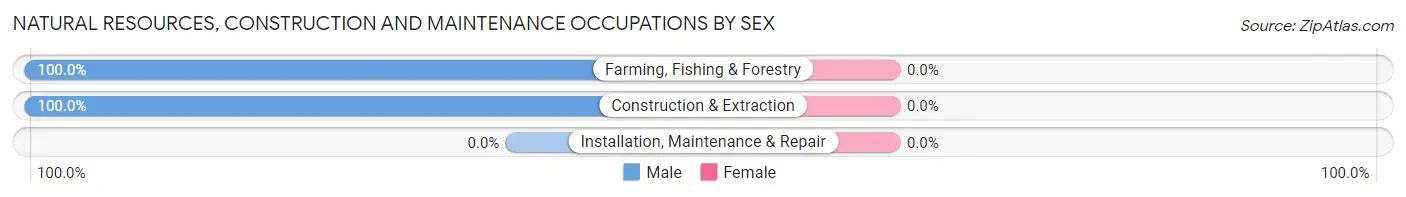
| Occupation | Male | Female |
| Farming, Fishing & Forestry | 5 (100.0%) | 0 (0.0%) |
| Construction & Extraction | 2 (100.0%) | 0 (0.0%) |
| Installation, Maintenance & Repair | 0 (0.0%) | 0 (0.0%) |
| Total (Category) | 7 (100.0%) | 0 (0.0%) |
| Total (Overall) | 37 (58.7%) | 26 (41.3%) |
Production, Transportation and Moving Occupations
The most common Production, Transportation and Moving occupations in Rosalia are Material Moving (14 | 22.2%), Production (11 | 17.5%), and Transportation (5 | 7.9%).
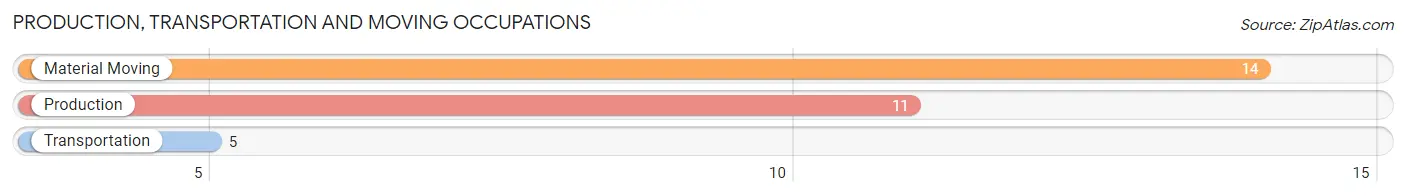
Production, Transportation and Moving Occupations by Sex
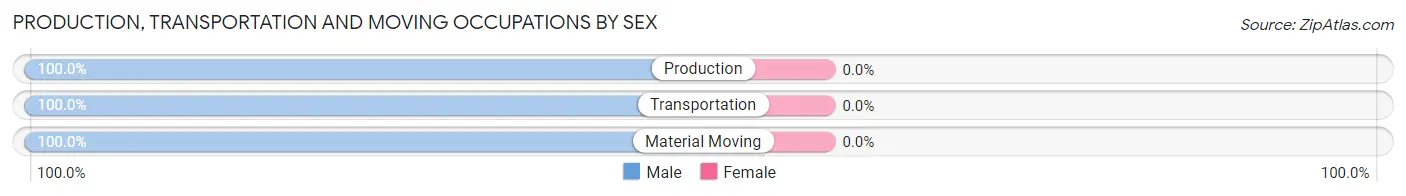
| Occupation | Male | Female |
| Production | 11 (100.0%) | 0 (0.0%) |
| Transportation | 5 (100.0%) | 0 (0.0%) |
| Material Moving | 14 (100.0%) | 0 (0.0%) |
| Total (Category) | 30 (100.0%) | 0 (0.0%) |
| Total (Overall) | 37 (58.7%) | 26 (41.3%) |
Employment Industries by Sex in Rosalia
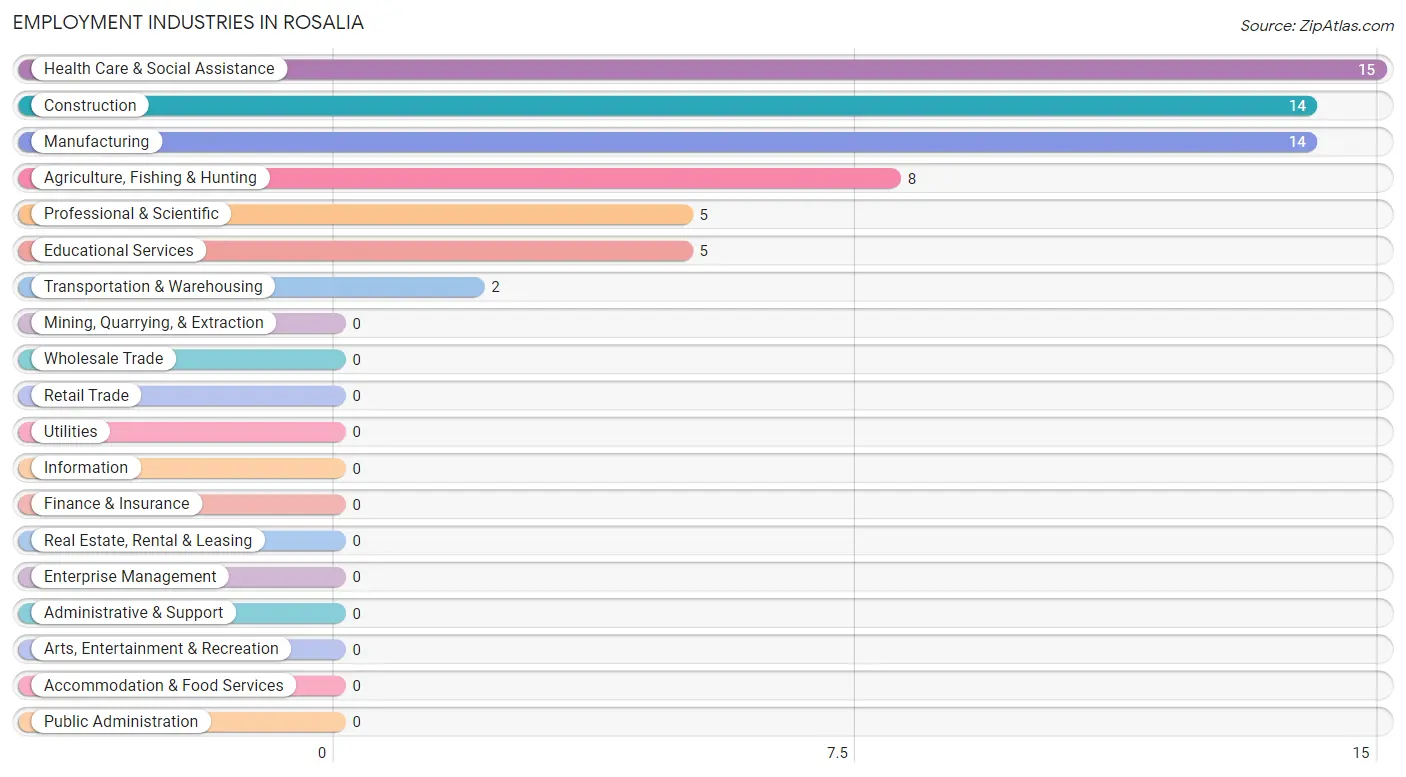
Employment Industries in Rosalia
The major employment industries in Rosalia include Health Care & Social Assistance (15 | 23.8%), Construction (14 | 22.2%), Manufacturing (14 | 22.2%), Agriculture, Fishing & Hunting (8 | 12.7%), and Professional & Scientific (5 | 7.9%).
Employment Industries by Sex in Rosalia
The Rosalia industries that see more men than women are Agriculture, Fishing & Hunting (100.0%), Construction (100.0%), and Transportation & Warehousing (100.0%), whereas the industries that tend to have a higher number of women are Educational Services (100.0%), Health Care & Social Assistance (100.0%), and Professional & Scientific (60.0%).
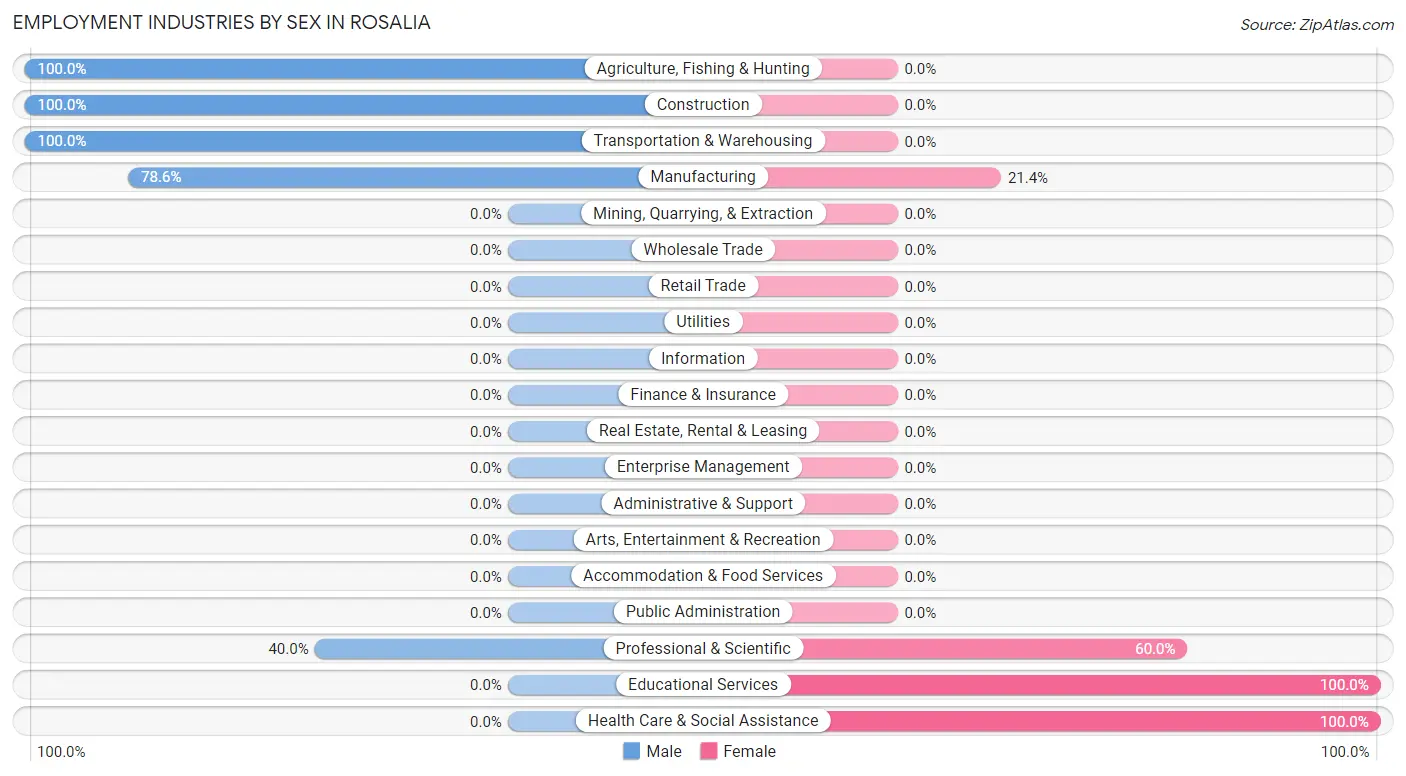
| Industry | Male | Female |
| Agriculture, Fishing & Hunting | 8 (100.0%) | 0 (0.0%) |
| Mining, Quarrying, & Extraction | 0 (0.0%) | 0 (0.0%) |
| Construction | 14 (100.0%) | 0 (0.0%) |
| Manufacturing | 11 (78.6%) | 3 (21.4%) |
| Wholesale Trade | 0 (0.0%) | 0 (0.0%) |
| Retail Trade | 0 (0.0%) | 0 (0.0%) |
| Transportation & Warehousing | 2 (100.0%) | 0 (0.0%) |
| Utilities | 0 (0.0%) | 0 (0.0%) |
| Information | 0 (0.0%) | 0 (0.0%) |
| Finance & Insurance | 0 (0.0%) | 0 (0.0%) |
| Real Estate, Rental & Leasing | 0 (0.0%) | 0 (0.0%) |
| Professional & Scientific | 2 (40.0%) | 3 (60.0%) |
| Enterprise Management | 0 (0.0%) | 0 (0.0%) |
| Administrative & Support | 0 (0.0%) | 0 (0.0%) |
| Educational Services | 0 (0.0%) | 5 (100.0%) |
| Health Care & Social Assistance | 0 (0.0%) | 15 (100.0%) |
| Arts, Entertainment & Recreation | 0 (0.0%) | 0 (0.0%) |
| Accommodation & Food Services | 0 (0.0%) | 0 (0.0%) |
| Public Administration | 0 (0.0%) | 0 (0.0%) |
| Total | 37 (58.7%) | 26 (41.3%) |
Education in Rosalia
School Enrollment in Rosalia
The most common levels of schooling among the 33 students in Rosalia are college / undergraduate (12 | 36.4%), middle school (8 | 24.2%), and elementary school (5 | 15.1%).
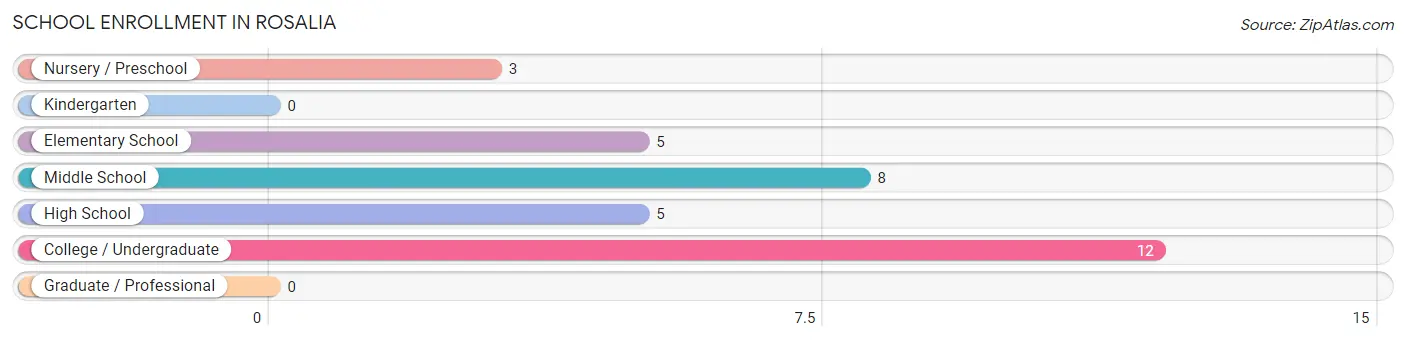
| School Level | # Students | % Students |
| Nursery / Preschool | 3 | 9.1% |
| Kindergarten | 0 | 0.0% |
| Elementary School | 5 | 15.1% |
| Middle School | 8 | 24.2% |
| High School | 5 | 15.1% |
| College / Undergraduate | 12 | 36.4% |
| Graduate / Professional | 0 | 0.0% |
| Total | 33 | 100.0% |
School Enrollment by Age by Funding Source in Rosalia
Out of a total of 33 students who are enrolled in schools in Rosalia, 18 (54.5%) attend a private institution, while the remaining 15 (45.5%) are enrolled in public schools. The age group of 15 to 17 year olds has the highest likelihood of being enrolled in private schools, with 3 (100.0% in the age bracket) enrolled. Conversely, the age group of 3 to 4 year olds has the lowest likelihood of being enrolled in a private school, with 3 (100.0% in the age bracket) attending a public institution.
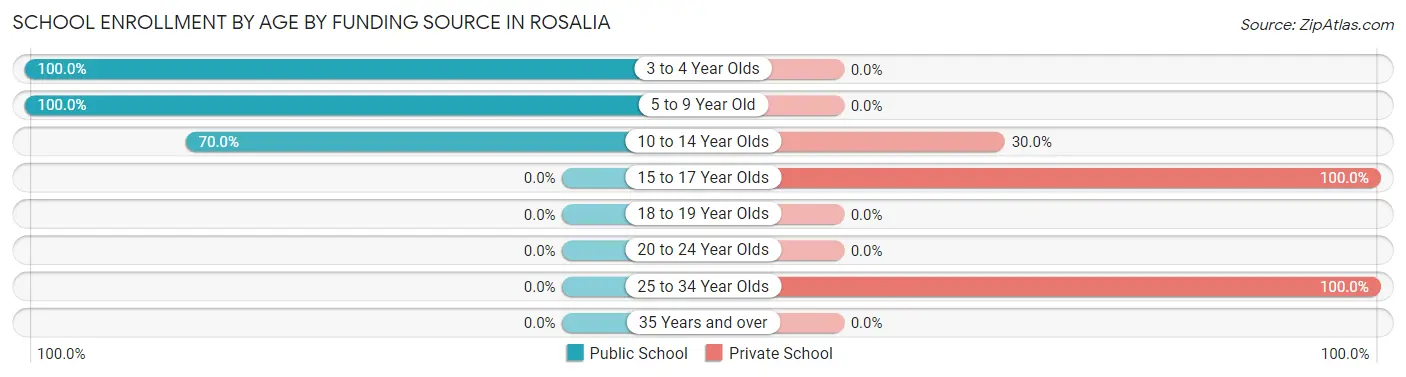
| Age Bracket | Public School | Private School |
| 3 to 4 Year Olds | 3 (100.0%) | 0 (0.0%) |
| 5 to 9 Year Old | 5 (100.0%) | 0 (0.0%) |
| 10 to 14 Year Olds | 7 (70.0%) | 3 (30.0%) |
| 15 to 17 Year Olds | 0 (0.0%) | 3 (100.0%) |
| 18 to 19 Year Olds | 0 (0.0%) | 0 (0.0%) |
| 20 to 24 Year Olds | 0 (0.0%) | 0 (0.0%) |
| 25 to 34 Year Olds | 0 (0.0%) | 12 (100.0%) |
| 35 Years and over | 0 (0.0%) | 0 (0.0%) |
| Total | 15 (45.5%) | 18 (54.5%) |
Educational Attainment by Field of Study in Rosalia
Bio, nature & agricultural (5 | 62.5%), and liberal arts & history (3 | 37.5%) are the most common fields of study among 8 individuals in Rosalia who have obtained a bachelor's degree or higher.
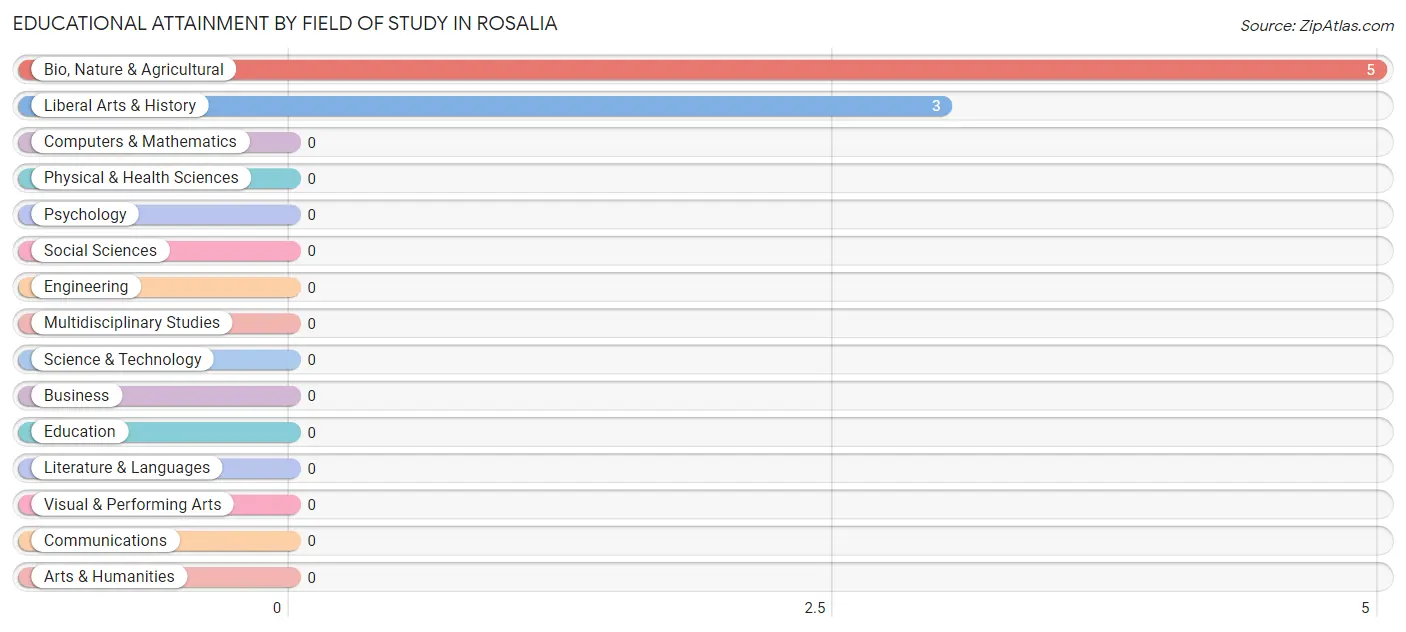
| Field of Study | # Graduates | % Graduates |
| Computers & Mathematics | 0 | 0.0% |
| Bio, Nature & Agricultural | 5 | 62.5% |
| Physical & Health Sciences | 0 | 0.0% |
| Psychology | 0 | 0.0% |
| Social Sciences | 0 | 0.0% |
| Engineering | 0 | 0.0% |
| Multidisciplinary Studies | 0 | 0.0% |
| Science & Technology | 0 | 0.0% |
| Business | 0 | 0.0% |
| Education | 0 | 0.0% |
| Literature & Languages | 0 | 0.0% |
| Liberal Arts & History | 3 | 37.5% |
| Visual & Performing Arts | 0 | 0.0% |
| Communications | 0 | 0.0% |
| Arts & Humanities | 0 | 0.0% |
| Total | 8 | 100.0% |
Transportation & Commute in Rosalia
Vehicle Availability by Sex in Rosalia
The most prevalent vehicle ownership categories in Rosalia are males with 3 vehicles (30, accounting for 81.1%) and females with 3 vehicles (12, making up 115.4%).
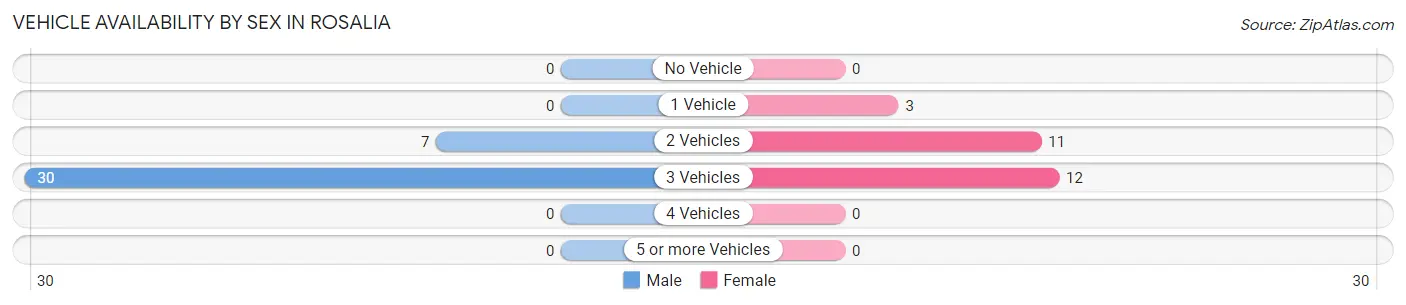
| Vehicles Available | Male | Female |
| No Vehicle | 0 (0.0%) | 0 (0.0%) |
| 1 Vehicle | 0 (0.0%) | 3 (11.5%) |
| 2 Vehicles | 7 (18.9%) | 11 (42.3%) |
| 3 Vehicles | 30 (81.1%) | 12 (46.2%) |
| 4 Vehicles | 0 (0.0%) | 0 (0.0%) |
| 5 or more Vehicles | 0 (0.0%) | 0 (0.0%) |
| Total | 37 (100.0%) | 26 (100.0%) |
Commute Time in Rosalia
The most frequently occuring commute durations in Rosalia are 90 or more minutes (26 commuters, 41.3%), 20 to 24 minutes (19 commuters, 30.2%), and 15 to 19 minutes (10 commuters, 15.9%).
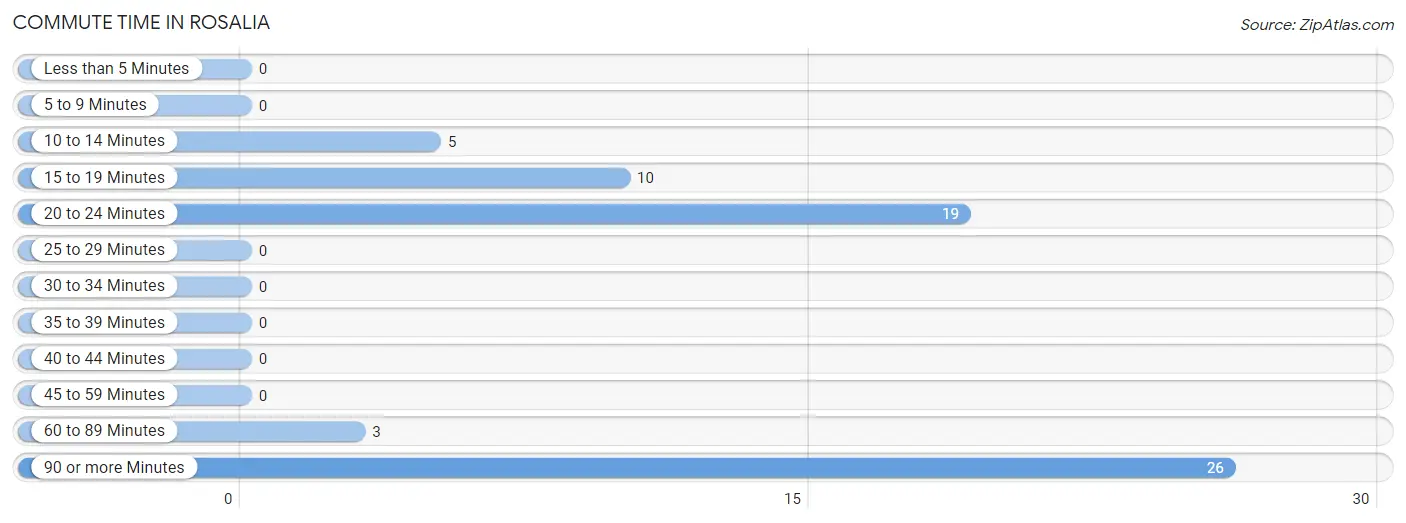
| Commute Time | # Commuters | % Commuters |
| Less than 5 Minutes | 0 | 0.0% |
| 5 to 9 Minutes | 0 | 0.0% |
| 10 to 14 Minutes | 5 | 7.9% |
| 15 to 19 Minutes | 10 | 15.9% |
| 20 to 24 Minutes | 19 | 30.2% |
| 25 to 29 Minutes | 0 | 0.0% |
| 30 to 34 Minutes | 0 | 0.0% |
| 35 to 39 Minutes | 0 | 0.0% |
| 40 to 44 Minutes | 0 | 0.0% |
| 45 to 59 Minutes | 0 | 0.0% |
| 60 to 89 Minutes | 3 | 4.8% |
| 90 or more Minutes | 26 | 41.3% |
Commute Time by Sex in Rosalia
The most common commute times in Rosalia are 20 to 24 minutes (16 commuters, 43.2%) for males and 15 to 19 minutes (10 commuters, 38.5%) for females.
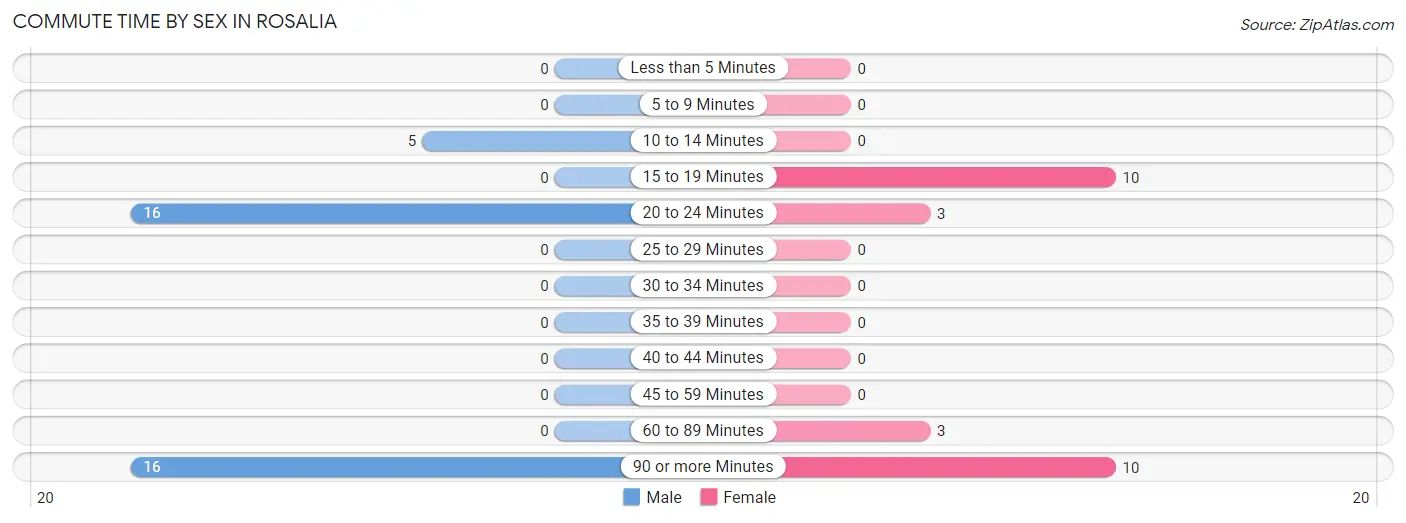
| Commute Time | Male | Female |
| Less than 5 Minutes | 0 (0.0%) | 0 (0.0%) |
| 5 to 9 Minutes | 0 (0.0%) | 0 (0.0%) |
| 10 to 14 Minutes | 5 (13.5%) | 0 (0.0%) |
| 15 to 19 Minutes | 0 (0.0%) | 10 (38.5%) |
| 20 to 24 Minutes | 16 (43.2%) | 3 (11.5%) |
| 25 to 29 Minutes | 0 (0.0%) | 0 (0.0%) |
| 30 to 34 Minutes | 0 (0.0%) | 0 (0.0%) |
| 35 to 39 Minutes | 0 (0.0%) | 0 (0.0%) |
| 40 to 44 Minutes | 0 (0.0%) | 0 (0.0%) |
| 45 to 59 Minutes | 0 (0.0%) | 0 (0.0%) |
| 60 to 89 Minutes | 0 (0.0%) | 3 (11.5%) |
| 90 or more Minutes | 16 (43.2%) | 10 (38.5%) |
Time of Departure to Work by Sex in Rosalia
The most frequent times of departure to work in Rosalia are 4:00 PM to 11:59 PM (16, 43.2%) for males and 7:30 AM to 7:59 AM (10, 38.5%) for females.
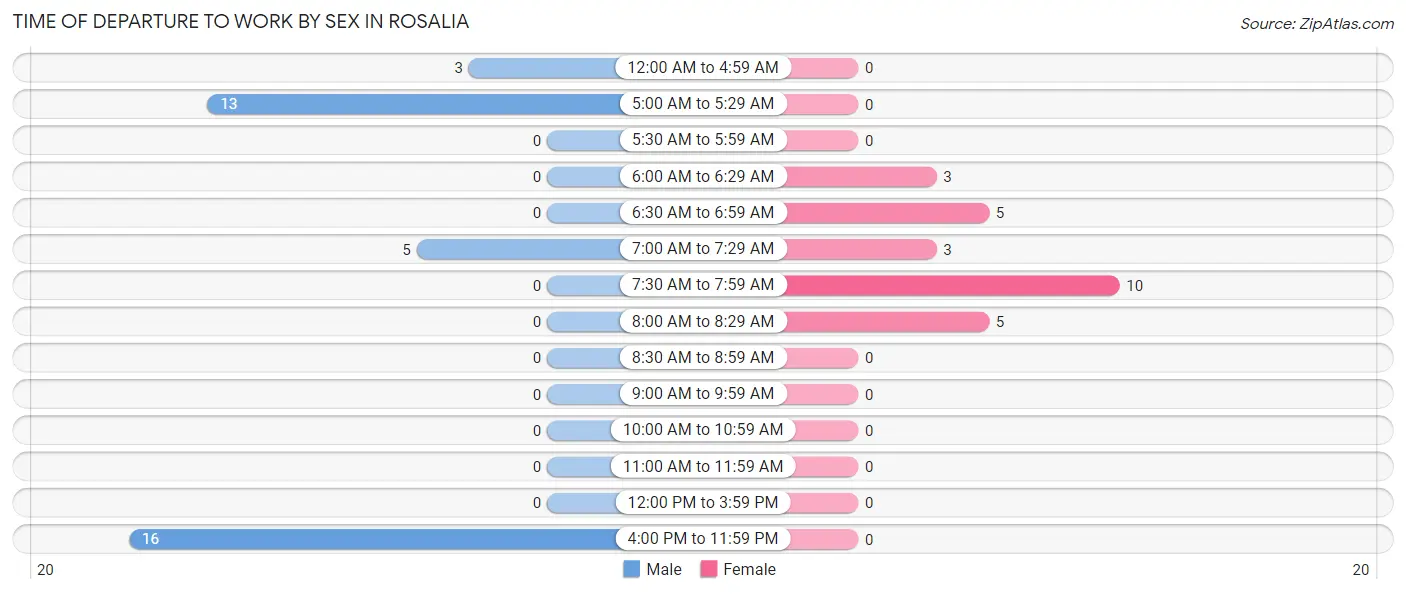
| Time of Departure | Male | Female |
| 12:00 AM to 4:59 AM | 3 (8.1%) | 0 (0.0%) |
| 5:00 AM to 5:29 AM | 13 (35.1%) | 0 (0.0%) |
| 5:30 AM to 5:59 AM | 0 (0.0%) | 0 (0.0%) |
| 6:00 AM to 6:29 AM | 0 (0.0%) | 3 (11.5%) |
| 6:30 AM to 6:59 AM | 0 (0.0%) | 5 (19.2%) |
| 7:00 AM to 7:29 AM | 5 (13.5%) | 3 (11.5%) |
| 7:30 AM to 7:59 AM | 0 (0.0%) | 10 (38.5%) |
| 8:00 AM to 8:29 AM | 0 (0.0%) | 5 (19.2%) |
| 8:30 AM to 8:59 AM | 0 (0.0%) | 0 (0.0%) |
| 9:00 AM to 9:59 AM | 0 (0.0%) | 0 (0.0%) |
| 10:00 AM to 10:59 AM | 0 (0.0%) | 0 (0.0%) |
| 11:00 AM to 11:59 AM | 0 (0.0%) | 0 (0.0%) |
| 12:00 PM to 3:59 PM | 0 (0.0%) | 0 (0.0%) |
| 4:00 PM to 11:59 PM | 16 (43.2%) | 0 (0.0%) |
| Total | 37 (100.0%) | 26 (100.0%) |
Housing Occupancy in Rosalia
Occupancy by Ownership in Rosalia
Of the total 49 dwellings in Rosalia, owner-occupied units account for 31 (63.3%), while renter-occupied units make up 18 (36.7%).
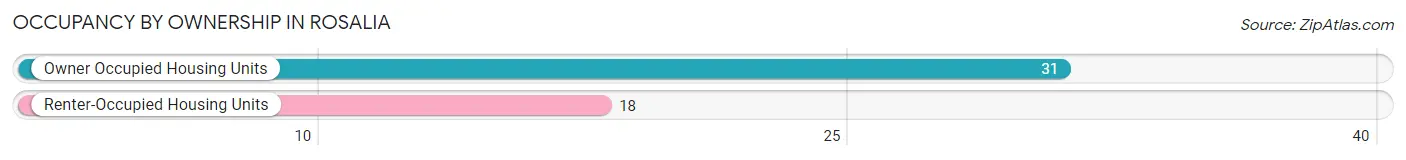
| Occupancy | # Housing Units | % Housing Units |
| Owner Occupied Housing Units | 31 | 63.3% |
| Renter-Occupied Housing Units | 18 | 36.7% |
| Total Occupied Housing Units | 49 | 100.0% |
Occupancy by Household Size in Rosalia
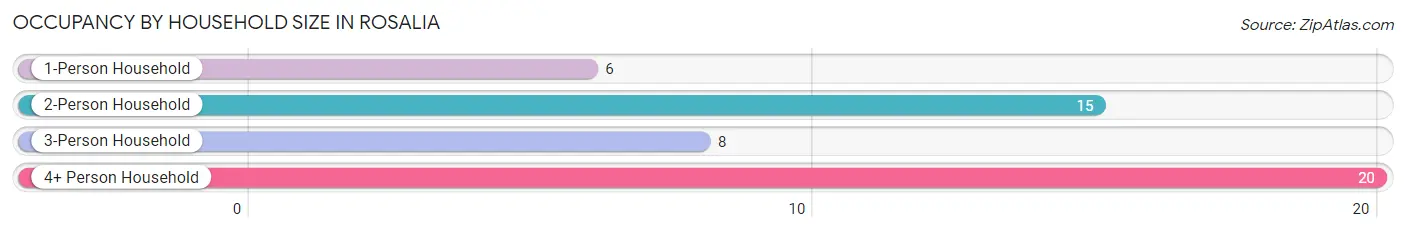
| Household Size | # Housing Units | % Housing Units |
| 1-Person Household | 6 | 12.2% |
| 2-Person Household | 15 | 30.6% |
| 3-Person Household | 8 | 16.3% |
| 4+ Person Household | 20 | 40.8% |
| Total Housing Units | 49 | 100.0% |
Occupancy by Ownership by Household Size in Rosalia
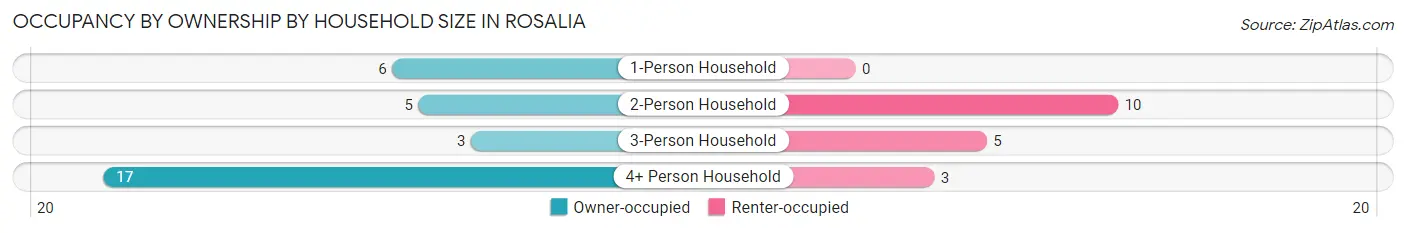
| Household Size | Owner-occupied | Renter-occupied |
| 1-Person Household | 6 (100.0%) | 0 (0.0%) |
| 2-Person Household | 5 (33.3%) | 10 (66.7%) |
| 3-Person Household | 3 (37.5%) | 5 (62.5%) |
| 4+ Person Household | 17 (85.0%) | 3 (15.0%) |
| Total Housing Units | 31 (63.3%) | 18 (36.7%) |
Occupancy by Educational Attainment in Rosalia
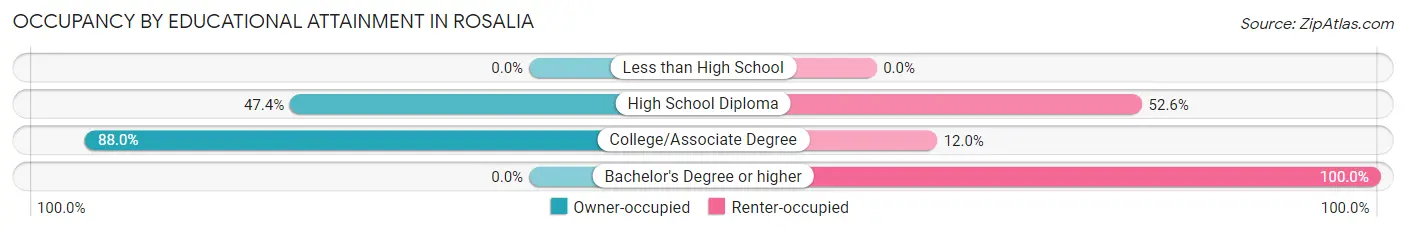
| Household Size | Owner-occupied | Renter-occupied |
| Less than High School | 0 (0.0%) | 0 (0.0%) |
| High School Diploma | 9 (47.4%) | 10 (52.6%) |
| College/Associate Degree | 22 (88.0%) | 3 (12.0%) |
| Bachelor's Degree or higher | 0 (0.0%) | 5 (100.0%) |
Occupancy by Age of Householder in Rosalia
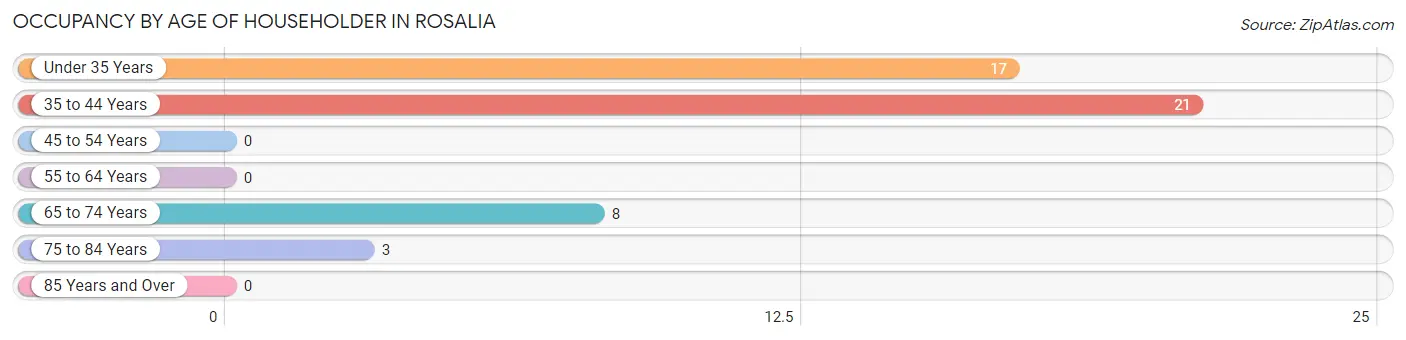
| Age Bracket | # Households | % Households |
| Under 35 Years | 17 | 34.7% |
| 35 to 44 Years | 21 | 42.9% |
| 45 to 54 Years | 0 | 0.0% |
| 55 to 64 Years | 0 | 0.0% |
| 65 to 74 Years | 8 | 16.3% |
| 75 to 84 Years | 3 | 6.1% |
| 85 Years and Over | 0 | 0.0% |
| Total | 49 | 100.0% |
Housing Finances in Rosalia
Median Income by Occupancy in Rosalia
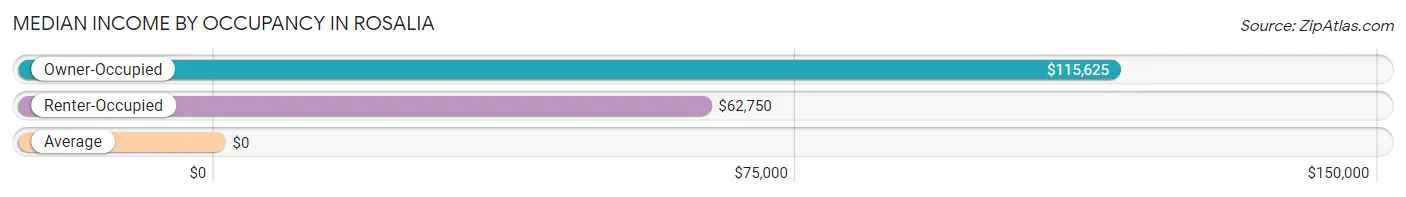
| Occupancy Type | # Households | Median Income |
| Owner-Occupied | 31 (63.3%) | $115,625 |
| Renter-Occupied | 18 (36.7%) | $62,750 |
| Average | 49 (100.0%) | $0 |
Occupancy by Householder Income Bracket in Rosalia
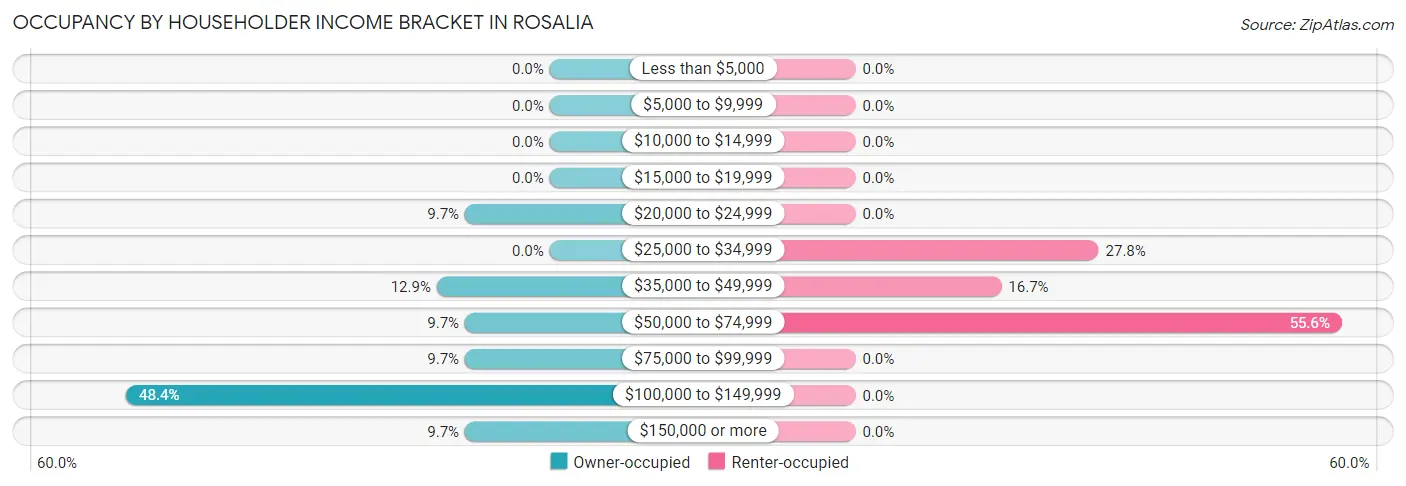
| Income Bracket | Owner-occupied | Renter-occupied |
| Less than $5,000 | 0 (0.0%) | 0 (0.0%) |
| $5,000 to $9,999 | 0 (0.0%) | 0 (0.0%) |
| $10,000 to $14,999 | 0 (0.0%) | 0 (0.0%) |
| $15,000 to $19,999 | 0 (0.0%) | 0 (0.0%) |
| $20,000 to $24,999 | 3 (9.7%) | 0 (0.0%) |
| $25,000 to $34,999 | 0 (0.0%) | 5 (27.8%) |
| $35,000 to $49,999 | 4 (12.9%) | 3 (16.7%) |
| $50,000 to $74,999 | 3 (9.7%) | 10 (55.6%) |
| $75,000 to $99,999 | 3 (9.7%) | 0 (0.0%) |
| $100,000 to $149,999 | 15 (48.4%) | 0 (0.0%) |
| $150,000 or more | 3 (9.7%) | 0 (0.0%) |
| Total | 31 (100.0%) | 18 (100.0%) |
Monthly Housing Cost Tiers in Rosalia
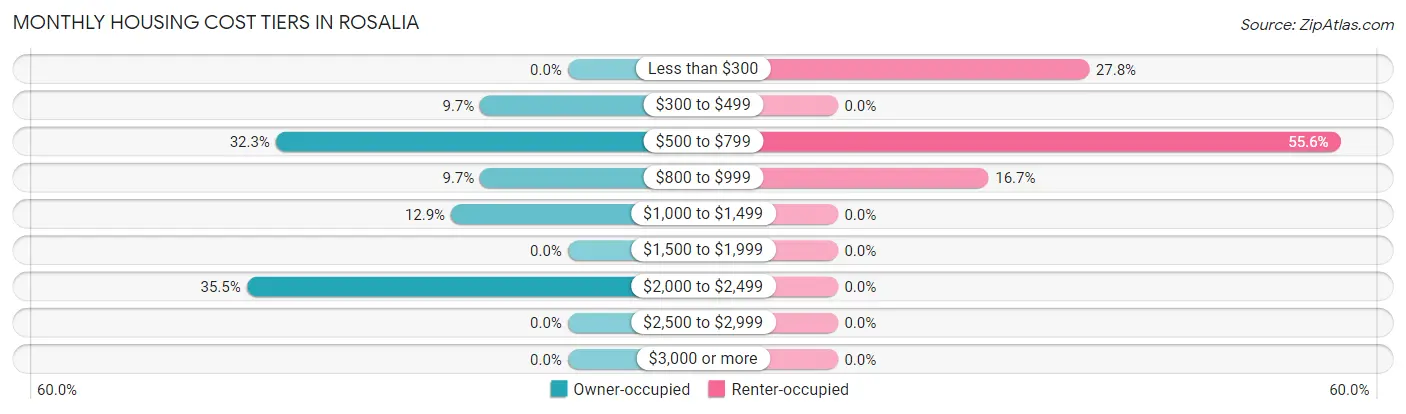
| Monthly Cost | Owner-occupied | Renter-occupied |
| Less than $300 | 0 (0.0%) | 5 (27.8%) |
| $300 to $499 | 3 (9.7%) | 0 (0.0%) |
| $500 to $799 | 10 (32.3%) | 10 (55.6%) |
| $800 to $999 | 3 (9.7%) | 3 (16.7%) |
| $1,000 to $1,499 | 4 (12.9%) | 0 (0.0%) |
| $1,500 to $1,999 | 0 (0.0%) | 0 (0.0%) |
| $2,000 to $2,499 | 11 (35.5%) | 0 (0.0%) |
| $2,500 to $2,999 | 0 (0.0%) | 0 (0.0%) |
| $3,000 or more | 0 (0.0%) | 0 (0.0%) |
| Total | 31 (100.0%) | 18 (100.0%) |
Physical Housing Characteristics in Rosalia
Housing Structures in Rosalia
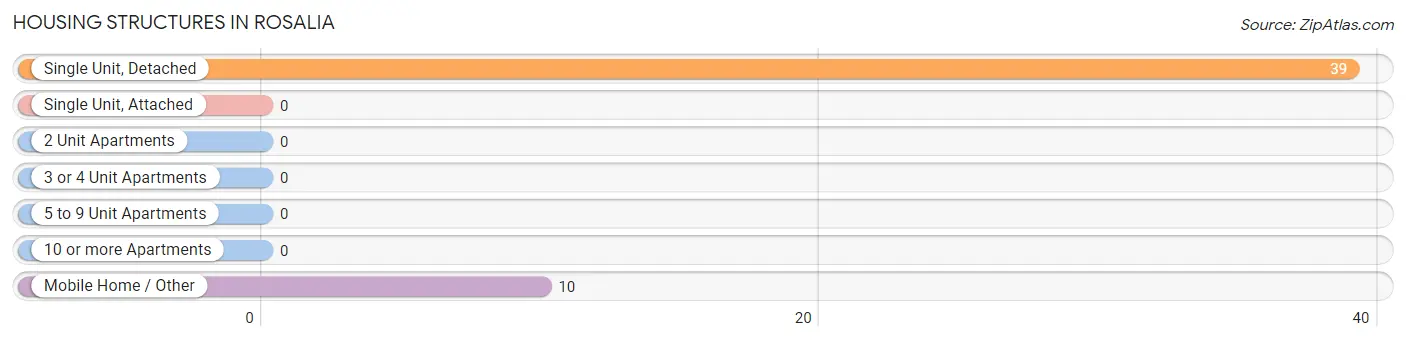
| Structure Type | # Housing Units | % Housing Units |
| Single Unit, Detached | 39 | 79.6% |
| Single Unit, Attached | 0 | 0.0% |
| 2 Unit Apartments | 0 | 0.0% |
| 3 or 4 Unit Apartments | 0 | 0.0% |
| 5 to 9 Unit Apartments | 0 | 0.0% |
| 10 or more Apartments | 0 | 0.0% |
| Mobile Home / Other | 10 | 20.4% |
| Total | 49 | 100.0% |
Housing Structures by Occupancy in Rosalia
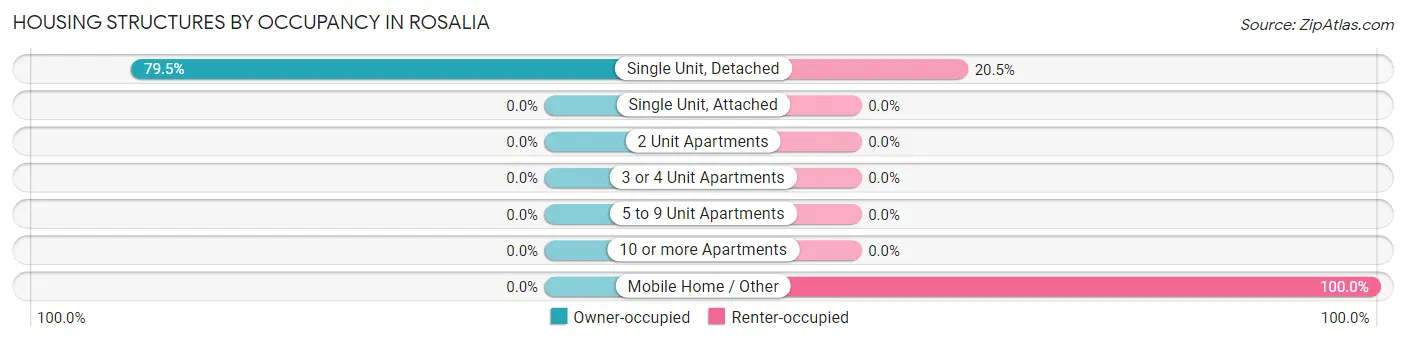
| Structure Type | Owner-occupied | Renter-occupied |
| Single Unit, Detached | 31 (79.5%) | 8 (20.5%) |
| Single Unit, Attached | 0 (0.0%) | 0 (0.0%) |
| 2 Unit Apartments | 0 (0.0%) | 0 (0.0%) |
| 3 or 4 Unit Apartments | 0 (0.0%) | 0 (0.0%) |
| 5 to 9 Unit Apartments | 0 (0.0%) | 0 (0.0%) |
| 10 or more Apartments | 0 (0.0%) | 0 (0.0%) |
| Mobile Home / Other | 0 (0.0%) | 10 (100.0%) |
| Total | 31 (63.3%) | 18 (36.7%) |
Housing Structures by Number of Rooms in Rosalia
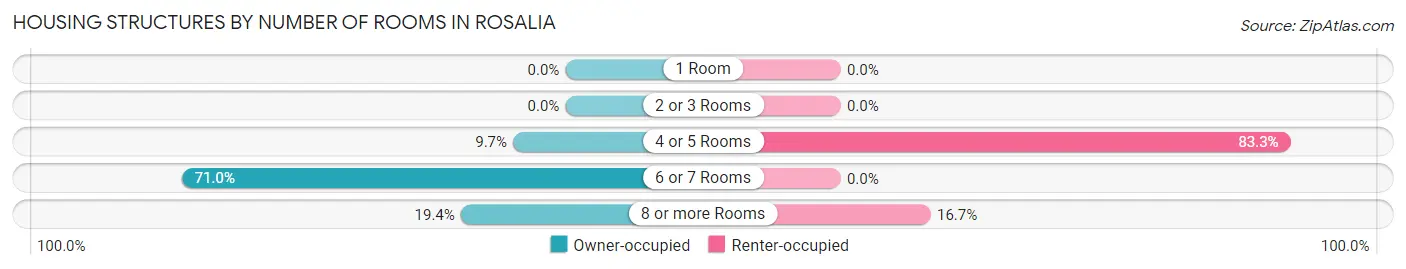
| Number of Rooms | Owner-occupied | Renter-occupied |
| 1 Room | 0 (0.0%) | 0 (0.0%) |
| 2 or 3 Rooms | 0 (0.0%) | 0 (0.0%) |
| 4 or 5 Rooms | 3 (9.7%) | 15 (83.3%) |
| 6 or 7 Rooms | 22 (71.0%) | 0 (0.0%) |
| 8 or more Rooms | 6 (19.4%) | 3 (16.7%) |
| Total | 31 (100.0%) | 18 (100.0%) |
Housing Structure by Heating Type in Rosalia
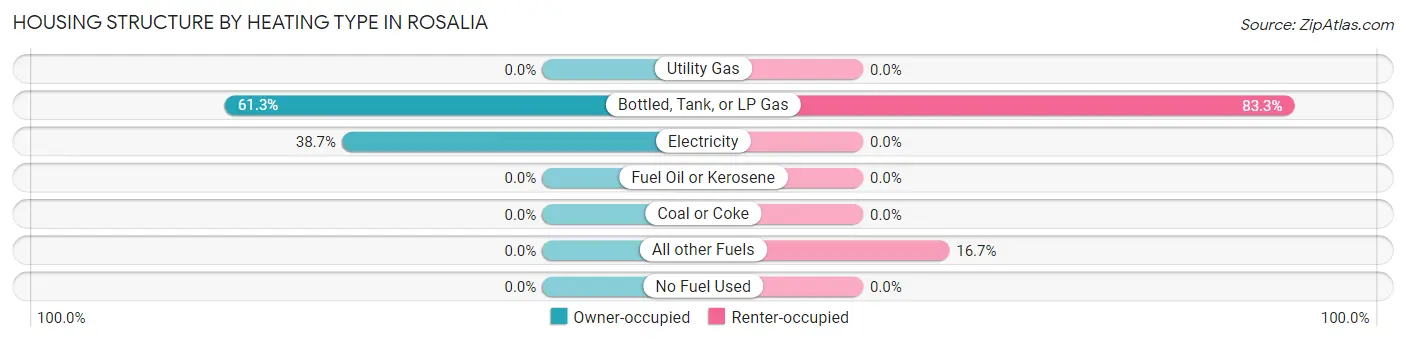
| Heating Type | Owner-occupied | Renter-occupied |
| Utility Gas | 0 (0.0%) | 0 (0.0%) |
| Bottled, Tank, or LP Gas | 19 (61.3%) | 15 (83.3%) |
| Electricity | 12 (38.7%) | 0 (0.0%) |
| Fuel Oil or Kerosene | 0 (0.0%) | 0 (0.0%) |
| Coal or Coke | 0 (0.0%) | 0 (0.0%) |
| All other Fuels | 0 (0.0%) | 3 (16.7%) |
| No Fuel Used | 0 (0.0%) | 0 (0.0%) |
| Total | 31 (100.0%) | 18 (100.0%) |
Household Vehicle Usage in Rosalia
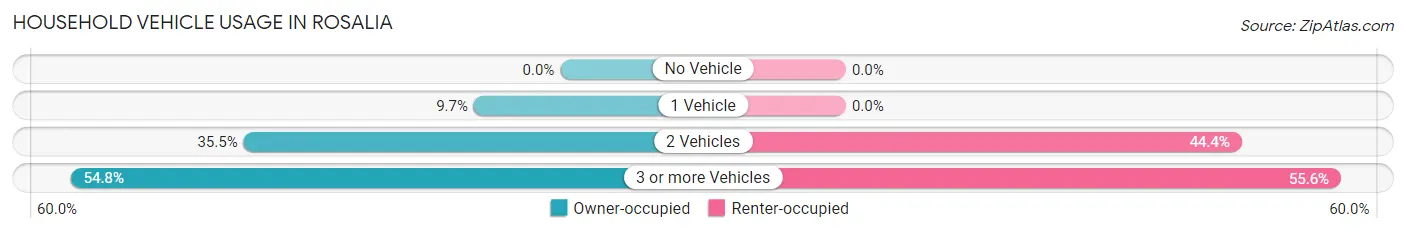
| Vehicles per Household | Owner-occupied | Renter-occupied |
| No Vehicle | 0 (0.0%) | 0 (0.0%) |
| 1 Vehicle | 3 (9.7%) | 0 (0.0%) |
| 2 Vehicles | 11 (35.5%) | 8 (44.4%) |
| 3 or more Vehicles | 17 (54.8%) | 10 (55.6%) |
| Total | 31 (100.0%) | 18 (100.0%) |
Real Estate & Mortgages in Rosalia
Real Estate and Mortgage Overview in Rosalia
| Characteristic | Without Mortgage | With Mortgage |
| Housing Units | 15 | 16 |
| Median Property Value | $225,000 | $213,600 |
| Median Household Income | - | - |
| Monthly Housing Costs | $608 | $0 |
| Real Estate Taxes | $2,643 | $0 |
Property Value by Mortgage Status in Rosalia
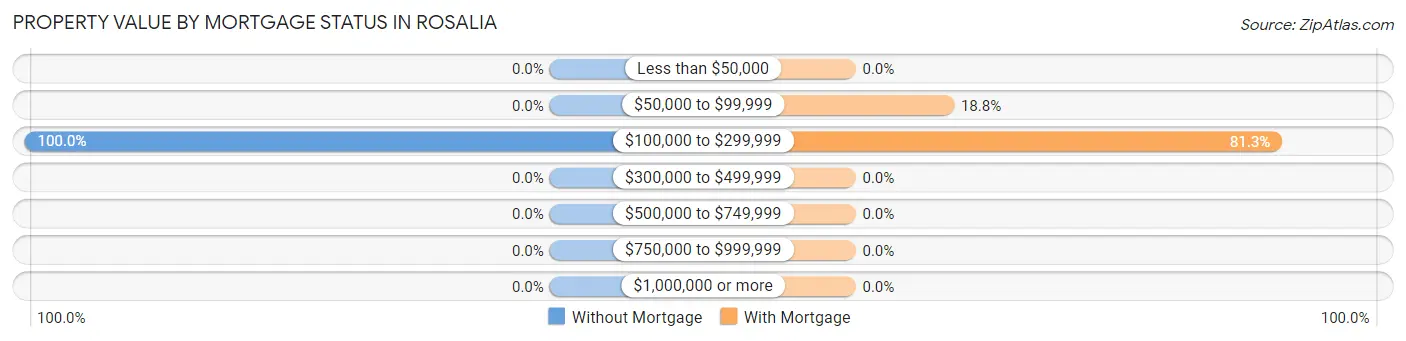
| Property Value | Without Mortgage | With Mortgage |
| Less than $50,000 | 0 (0.0%) | 0 (0.0%) |
| $50,000 to $99,999 | 0 (0.0%) | 3 (18.8%) |
| $100,000 to $299,999 | 15 (100.0%) | 13 (81.2%) |
| $300,000 to $499,999 | 0 (0.0%) | 0 (0.0%) |
| $500,000 to $749,999 | 0 (0.0%) | 0 (0.0%) |
| $750,000 to $999,999 | 0 (0.0%) | 0 (0.0%) |
| $1,000,000 or more | 0 (0.0%) | 0 (0.0%) |
| Total | 15 (100.0%) | 16 (100.0%) |
Household Income by Mortgage Status in Rosalia
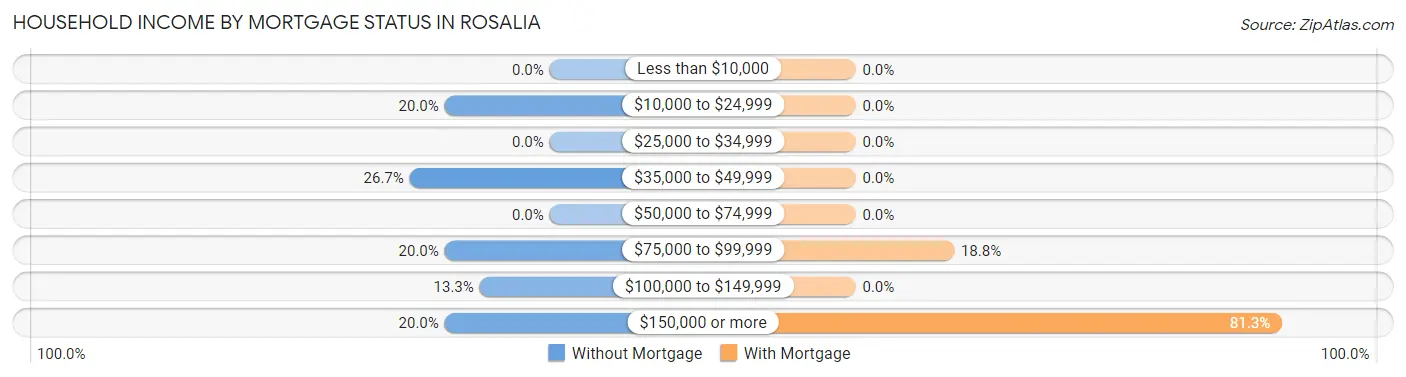
| Household Income | Without Mortgage | With Mortgage |
| Less than $10,000 | 0 (0.0%) | 0 (0.0%) |
| $10,000 to $24,999 | 3 (20.0%) | 0 (0.0%) |
| $25,000 to $34,999 | 0 (0.0%) | 0 (0.0%) |
| $35,000 to $49,999 | 4 (26.7%) | 0 (0.0%) |
| $50,000 to $74,999 | 0 (0.0%) | 0 (0.0%) |
| $75,000 to $99,999 | 3 (20.0%) | 3 (18.8%) |
| $100,000 to $149,999 | 2 (13.3%) | 0 (0.0%) |
| $150,000 or more | 3 (20.0%) | 13 (81.2%) |
| Total | 15 (100.0%) | 16 (100.0%) |
Property Value to Household Income Ratio in Rosalia
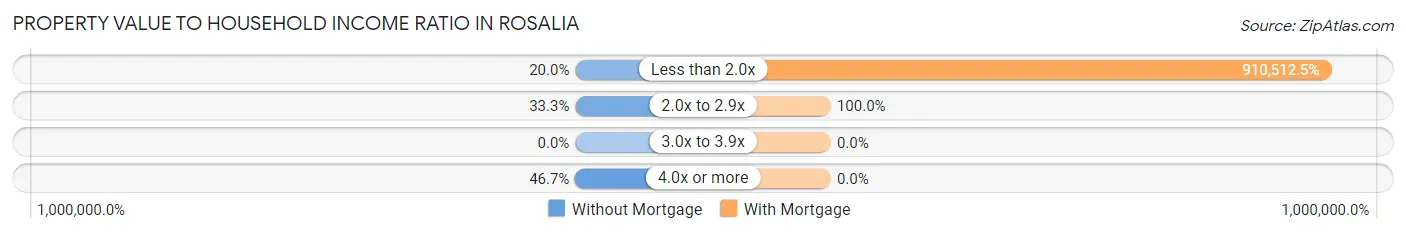
| Value-to-Income Ratio | Without Mortgage | With Mortgage |
| Less than 2.0x | 3 (20.0%) | 145,682 (910,512.5%) |
| 2.0x to 2.9x | 5 (33.3%) | 16 (100.0%) |
| 3.0x to 3.9x | 0 (0.0%) | 0 (0.0%) |
| 4.0x or more | 7 (46.7%) | 0 (0.0%) |
| Total | 15 (100.0%) | 16 (100.0%) |
Real Estate Taxes by Mortgage Status in Rosalia
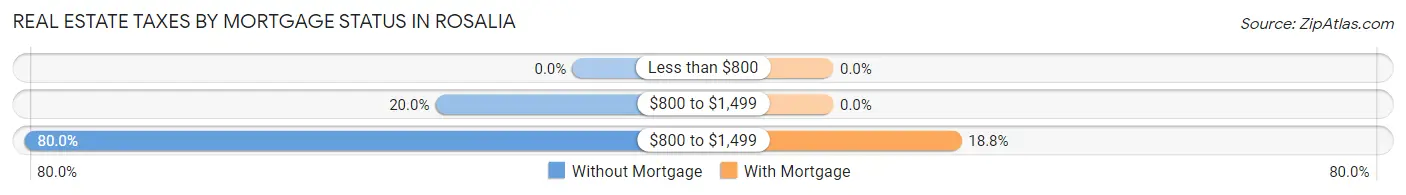
| Property Taxes | Without Mortgage | With Mortgage |
| Less than $800 | 0 (0.0%) | 0 (0.0%) |
| $800 to $1,499 | 3 (20.0%) | 0 (0.0%) |
| $800 to $1,499 | 12 (80.0%) | 3 (18.8%) |
| Total | 15 (100.0%) | 16 (100.0%) |
Health & Disability in Rosalia
Health Insurance Coverage by Age in Rosalia

| Age Bracket | With Coverage | Without Coverage |
| Under 6 Years | 40 (100.0%) | 0 (0.0%) |
| 6 to 18 Years | 18 (100.0%) | 0 (0.0%) |
| 19 to 25 Years | 0 (0.0%) | 0 (0.0%) |
| 26 to 34 Years | 43 (89.6%) | 5 (10.4%) |
| 35 to 44 Years | 18 (78.3%) | 5 (21.7%) |
| 45 to 54 Years | 0 (0.0%) | 0 (0.0%) |
| 55 to 64 Years | 3 (50.0%) | 3 (50.0%) |
| 65 to 74 Years | 8 (100.0%) | 0 (0.0%) |
| 75 Years and older | 9 (100.0%) | 0 (0.0%) |
| Total | 139 (91.4%) | 13 (8.6%) |
Health Insurance Coverage by Citizenship Status in Rosalia
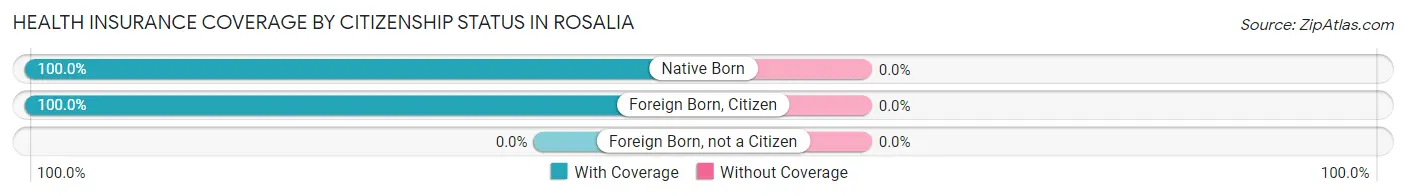
| Citizenship Status | With Coverage | Without Coverage |
| Native Born | 40 (100.0%) | 0 (0.0%) |
| Foreign Born, Citizen | 18 (100.0%) | 0 (0.0%) |
| Foreign Born, not a Citizen | 0 (0.0%) | 0 (0.0%) |
Health Insurance Coverage by Household Income in Rosalia
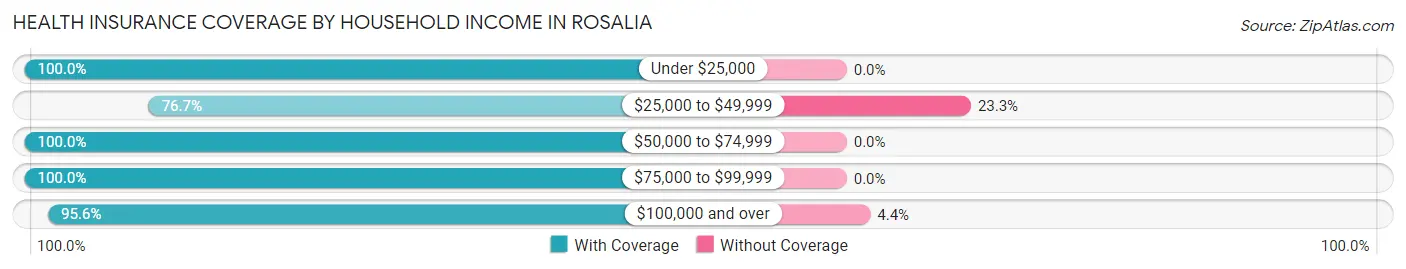
| Household Income | With Coverage | Without Coverage |
| Under $25,000 | 3 (100.0%) | 0 (0.0%) |
| $25,000 to $49,999 | 33 (76.7%) | 10 (23.3%) |
| $50,000 to $74,999 | 32 (100.0%) | 0 (0.0%) |
| $75,000 to $99,999 | 6 (100.0%) | 0 (0.0%) |
| $100,000 and over | 65 (95.6%) | 3 (4.4%) |
Public vs Private Health Insurance Coverage by Age in Rosalia
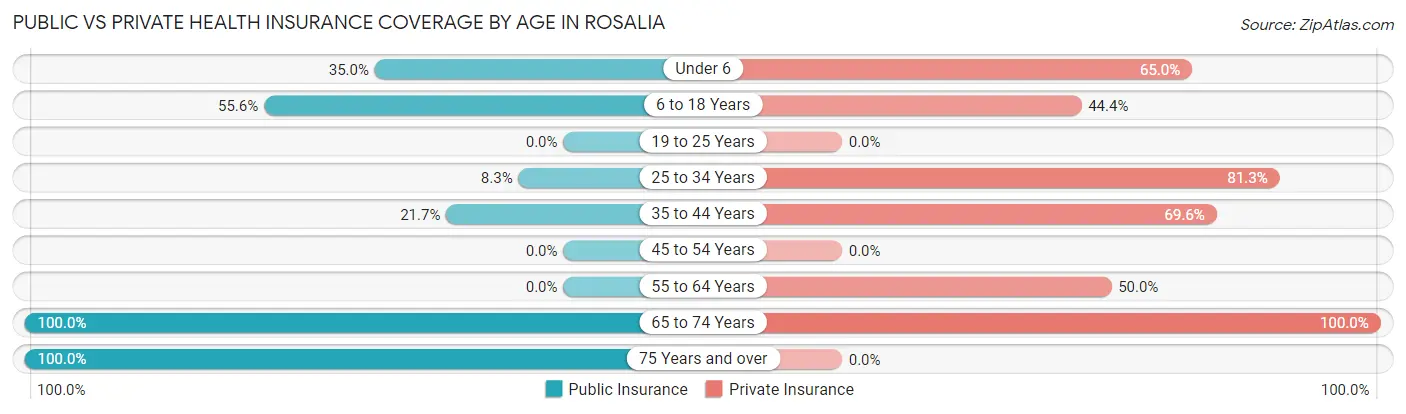
| Age Bracket | Public Insurance | Private Insurance |
| Under 6 | 14 (35.0%) | 26 (65.0%) |
| 6 to 18 Years | 10 (55.6%) | 8 (44.4%) |
| 19 to 25 Years | 0 (0.0%) | 0 (0.0%) |
| 25 to 34 Years | 4 (8.3%) | 39 (81.2%) |
| 35 to 44 Years | 5 (21.7%) | 16 (69.6%) |
| 45 to 54 Years | 0 (0.0%) | 0 (0.0%) |
| 55 to 64 Years | 0 (0.0%) | 3 (50.0%) |
| 65 to 74 Years | 8 (100.0%) | 8 (100.0%) |
| 75 Years and over | 9 (100.0%) | 0 (0.0%) |
| Total | 50 (32.9%) | 100 (65.8%) |
Disability Status by Sex by Age in Rosalia
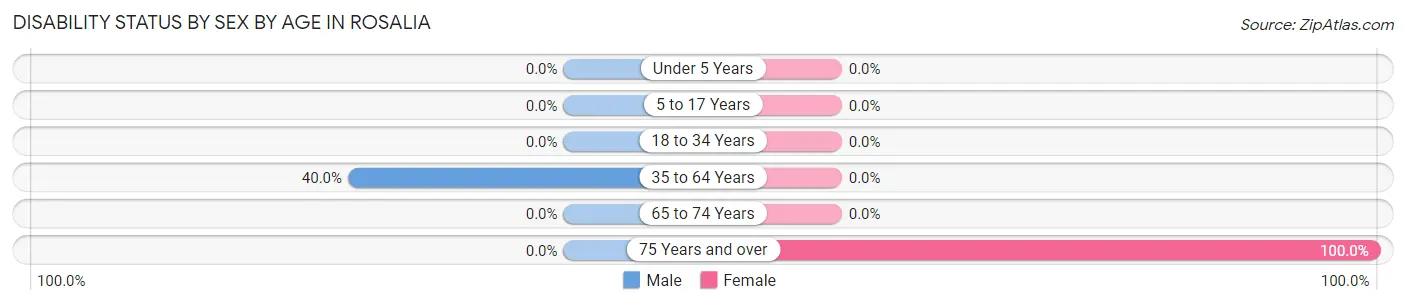
| Age Bracket | Male | Female |
| Under 5 Years | 0 (0.0%) | 0 (0.0%) |
| 5 to 17 Years | 0 (0.0%) | 0 (0.0%) |
| 18 to 34 Years | 0 (0.0%) | 0 (0.0%) |
| 35 to 64 Years | 2 (40.0%) | 0 (0.0%) |
| 65 to 74 Years | 0 (0.0%) | 0 (0.0%) |
| 75 Years and over | 0 (0.0%) | 3 (100.0%) |
Disability Class by Sex by Age in Rosalia
Disability Class: Hearing Difficulty
| Age Bracket | Male | Female |
| Under 5 Years | 0 (0.0%) | 0 (0.0%) |
| 5 to 17 Years | 0 (0.0%) | 0 (0.0%) |
| 18 to 34 Years | 0 (0.0%) | 0 (0.0%) |
| 35 to 64 Years | 0 (0.0%) | 0 (0.0%) |
| 65 to 74 Years | 0 (0.0%) | 0 (0.0%) |
| 75 Years and over | 0 (0.0%) | 0 (0.0%) |
Disability Class: Vision Difficulty
| Age Bracket | Male | Female |
| Under 5 Years | 0 (0.0%) | 0 (0.0%) |
| 5 to 17 Years | 0 (0.0%) | 0 (0.0%) |
| 18 to 34 Years | 0 (0.0%) | 0 (0.0%) |
| 35 to 64 Years | 0 (0.0%) | 0 (0.0%) |
| 65 to 74 Years | 0 (0.0%) | 0 (0.0%) |
| 75 Years and over | 0 (0.0%) | 0 (0.0%) |
Disability Class: Cognitive Difficulty
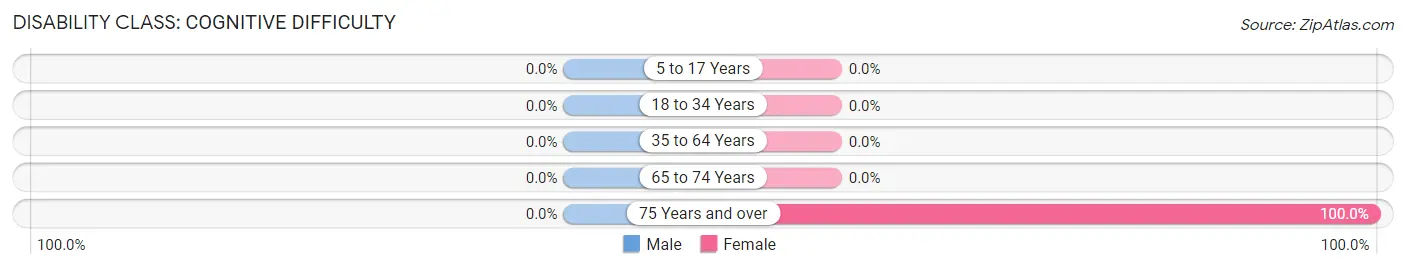
| Age Bracket | Male | Female |
| 5 to 17 Years | 0 (0.0%) | 0 (0.0%) |
| 18 to 34 Years | 0 (0.0%) | 0 (0.0%) |
| 35 to 64 Years | 0 (0.0%) | 0 (0.0%) |
| 65 to 74 Years | 0 (0.0%) | 0 (0.0%) |
| 75 Years and over | 0 (0.0%) | 3 (100.0%) |
Disability Class: Ambulatory Difficulty
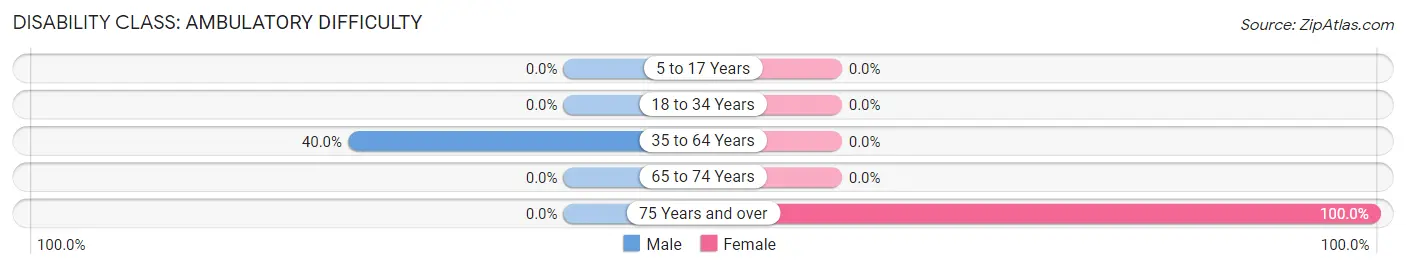
| Age Bracket | Male | Female |
| 5 to 17 Years | 0 (0.0%) | 0 (0.0%) |
| 18 to 34 Years | 0 (0.0%) | 0 (0.0%) |
| 35 to 64 Years | 2 (40.0%) | 0 (0.0%) |
| 65 to 74 Years | 0 (0.0%) | 0 (0.0%) |
| 75 Years and over | 0 (0.0%) | 3 (100.0%) |
Disability Class: Self-Care Difficulty
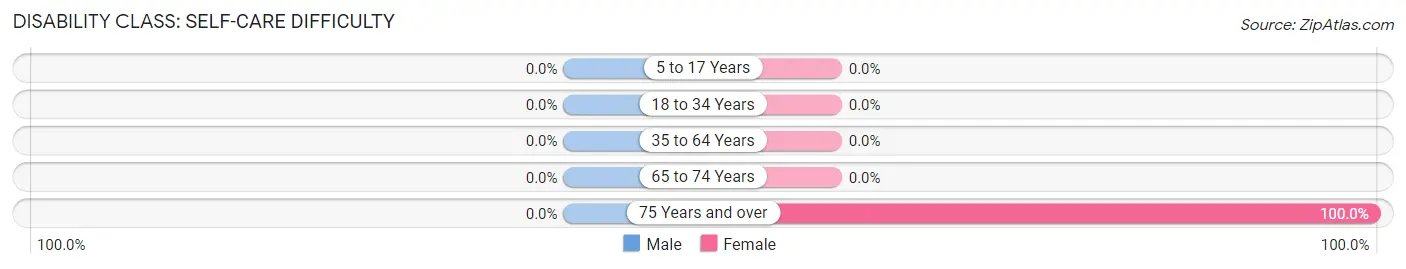
| Age Bracket | Male | Female |
| 5 to 17 Years | 0 (0.0%) | 0 (0.0%) |
| 18 to 34 Years | 0 (0.0%) | 0 (0.0%) |
| 35 to 64 Years | 0 (0.0%) | 0 (0.0%) |
| 65 to 74 Years | 0 (0.0%) | 0 (0.0%) |
| 75 Years and over | 0 (0.0%) | 3 (100.0%) |
Technology Access in Rosalia
Computing Device Access in Rosalia
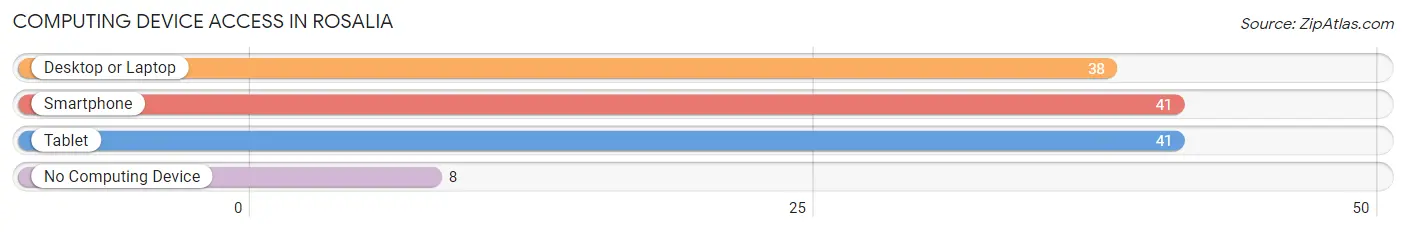
| Device Type | # Households | % Households |
| Desktop or Laptop | 38 | 77.5% |
| Smartphone | 41 | 83.7% |
| Tablet | 41 | 83.7% |
| No Computing Device | 8 | 16.3% |
| Total | 49 | 100.0% |
Internet Access in Rosalia
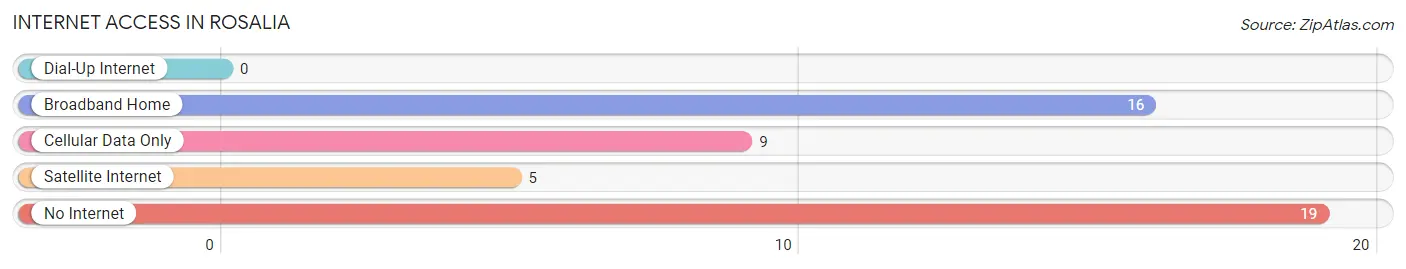
| Internet Type | # Households | % Households |
| Dial-Up Internet | 0 | 0.0% |
| Broadband Home | 16 | 32.7% |
| Cellular Data Only | 9 | 18.4% |
| Satellite Internet | 5 | 10.2% |
| No Internet | 19 | 38.8% |
| Total | 49 | 100.0% |
Rosalia Summary
Rosalia, Kansas is a small town located in Butler County, Kansas. It is situated in the Flint Hills region of the state, and is home to a population of just over 500 people. The town was founded in 1887 and has a rich history of farming and ranching.
Geography
Rosalia is located in the Flint Hills region of Kansas, which is characterized by rolling hills and grasslands. The town is situated in the northern part of Butler County, and is bordered by the towns of El Dorado, Augusta, and Douglass. The town is located at an elevation of 1,068 feet above sea level. The climate in Rosalia is characterized by hot summers and cold winters. The average annual temperature is around 54 degrees Fahrenheit, and the average annual precipitation is around 33 inches.
Economy
The economy of Rosalia is largely based on agriculture. The town is home to several farms and ranches, which produce a variety of crops and livestock. The town is also home to several small businesses, including a grocery store, a hardware store, and a few restaurants. The town is also home to a few manufacturing companies, which produce a variety of products, including furniture and clothing.
Demographics
As of the 2010 census, the population of Rosalia was 514 people. The racial makeup of the town was 97.3% White, 0.6% African American, 0.2% Native American, 0.2% Asian, 0.2% from other races, and 1.5% from two or more races. The median household income in Rosalia was $41,250, and the median family income was $50,000. The per capita income in Rosalia was $19,845.
History
Rosalia was founded in 1887 by a group of settlers from the nearby town of El Dorado. The town was named after Rosalia, the patron saint of El Dorado. The town quickly grew, and by the early 1900s, it had become a thriving agricultural community. The town was home to several farms and ranches, which produced a variety of crops and livestock. The town also had several small businesses, including a grocery store, a hardware store, and a few restaurants.
In the early 1900s, the town was also home to a few manufacturing companies, which produced a variety of products, including furniture and clothing. The town also had a few churches, a school, and a post office. The town continued to grow and prosper until the Great Depression, when many of the businesses and farms in the area closed.
In the 1950s, the town began to experience a resurgence, as new businesses and industries moved into the area. The town also experienced a population boom, as many people moved to the area to take advantage of the new opportunities. Today, Rosalia is a small but thriving community, with a population of just over 500 people. The town is still home to several farms and ranches, as well as a few small businesses. The town is also home to a few churches, a school, and a post office.
Common Questions
What is Per Capita Income in Rosalia?
Per Capita income in Rosalia is $50,205.
What is Inequality or Gini Index in Rosalia?
Inequality or Gini Index in Rosalia is 0.59.
What is the Total Population of Rosalia?
Total Population of Rosalia is 152.
What is the Total Male Population of Rosalia?
Total Male Population of Rosalia is 71.
What is the Total Female Population of Rosalia?
Total Female Population of Rosalia is 81.
What is the Ratio of Males per 100 Females in Rosalia?
There are 87.65 Males per 100 Females in Rosalia.
What is the Ratio of Females per 100 Males in Rosalia?
There are 114.08 Females per 100 Males in Rosalia.
What is the Median Population Age in Rosalia?
Median Population Age in Rosalia is 28.4 Years.
What is the Average Family Size in Rosalia
Average Family Size in Rosalia is 3.4 People.
What is the Average Household Size in Rosalia
Average Household Size in Rosalia is 3.1 People.
How Large is the Labor Force in Rosalia?
There are 63 People in the Labor Forcein in Rosalia.
What is the Percentage of People in the Labor Force in Rosalia?
64.9% of People are in the Labor Force in Rosalia.