Riverton, KS Map & Demographics
Riverton Map
Riverton Overview
$25,669
PER CAPITA INCOME
$85,114
AVG FAMILY INCOME
$66,354
AVG HOUSEHOLD INCOME
0.32
INEQUALITY / GINI INDEX
729
TOTAL POPULATION
335
MALE POPULATION
394
FEMALE POPULATION
85.03
MALES / 100 FEMALES
117.61
FEMALES / 100 MALES
43.3
MEDIAN AGE
3.4
AVG FAMILY SIZE
3.0
AVG HOUSEHOLD SIZE
281
LABOR FORCE [ PEOPLE ]
53.9%
PERCENT IN LABOR FORCE
Riverton Zip Codes
Riverton Area Codes
Income in Riverton
Income Overview in Riverton
Per Capita Income in Riverton is $25,669, while median incomes of families and households are $85,114 and $66,354 respectively.
| Characteristic | Number | Measure |
| Per Capita Income | 729 | $25,669 |
| Median Family Income | 201 | $85,114 |
| Mean Family Income | 201 | $76,478 |
| Median Household Income | 245 | $66,354 |
| Mean Household Income | 245 | $69,936 |
| Income Deficit | 201 | $0 |
| Wage / Income Gap (%) | 729 | 0.00% |
| Wage / Income Gap ($) | 729 | 100.00¢ per $1 |
| Gini / Inequality Index | 729 | 0.32 |
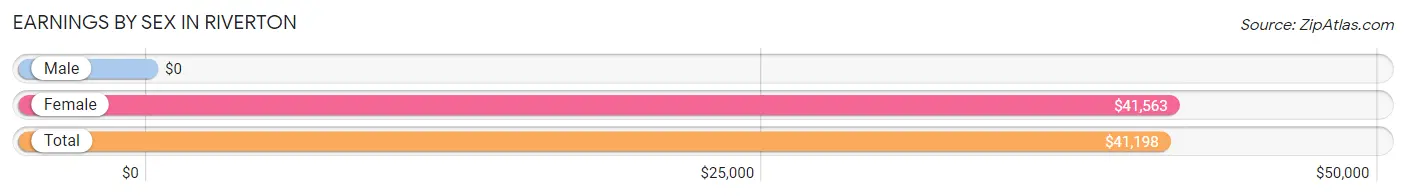
Earnings by Sex in Riverton
| Sex | Number | Average Earnings |
| Male | 181 (61.8%) | $0 |
| Female | 112 (38.2%) | $41,563 |
| Total | 293 (100.0%) | $41,198 |
Earnings by Sex by Income Bracket in Riverton
The most common earnings brackets in Riverton are $12,500 to $14,999 for men (82 | 45.3%) and $45,000 to $49,999 for women (37 | 33.0%).

| Income | Male | Female |
| $2,499 or less | 0 (0.0%) | 0 (0.0%) |
| $2,500 to $4,999 | 0 (0.0%) | 11 (9.8%) |
| $5,000 to $7,499 | 0 (0.0%) | 0 (0.0%) |
| $7,500 to $9,999 | 0 (0.0%) | 0 (0.0%) |
| $10,000 to $12,499 | 0 (0.0%) | 9 (8.0%) |
| $12,500 to $14,999 | 82 (45.3%) | 12 (10.7%) |
| $15,000 to $17,499 | 0 (0.0%) | 0 (0.0%) |
| $17,500 to $19,999 | 0 (0.0%) | 0 (0.0%) |
| $20,000 to $22,499 | 0 (0.0%) | 9 (8.0%) |
| $22,500 to $24,999 | 0 (0.0%) | 0 (0.0%) |
| $25,000 to $29,999 | 0 (0.0%) | 0 (0.0%) |
| $30,000 to $34,999 | 12 (6.6%) | 0 (0.0%) |
| $35,000 to $39,999 | 0 (0.0%) | 0 (0.0%) |
| $40,000 to $44,999 | 0 (0.0%) | 24 (21.4%) |
| $45,000 to $49,999 | 22 (12.1%) | 37 (33.0%) |
| $50,000 to $54,999 | 0 (0.0%) | 0 (0.0%) |
| $55,000 to $64,999 | 17 (9.4%) | 10 (8.9%) |
| $65,000 to $74,999 | 24 (13.3%) | 0 (0.0%) |
| $75,000 to $99,999 | 24 (13.3%) | 0 (0.0%) |
| $100,000+ | 0 (0.0%) | 0 (0.0%) |
| Total | 181 (100.0%) | 112 (100.0%) |
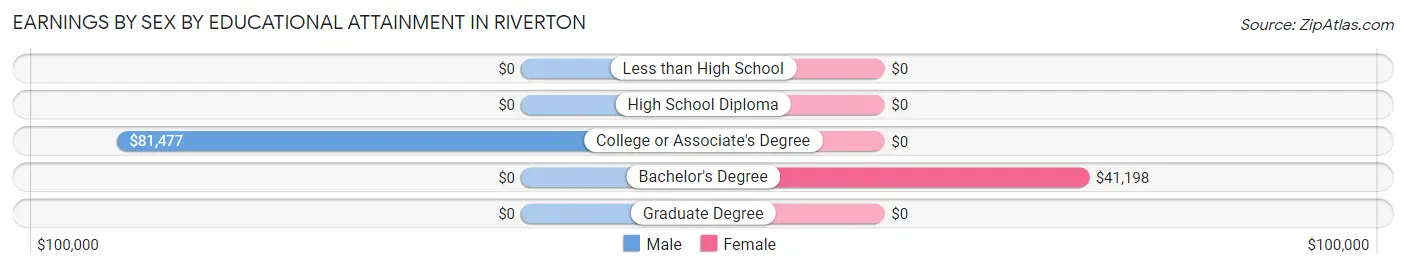
Earnings by Sex by Educational Attainment in Riverton
| Educational Attainment | Male Income | Female Income |
| Less than High School | - | - |
| High School Diploma | - | - |
| College or Associate's Degree | $81,477 | $0 |
| Bachelor's Degree | - | - |
| Graduate Degree | - | - |
| Total | - | - |
Family Income in Riverton
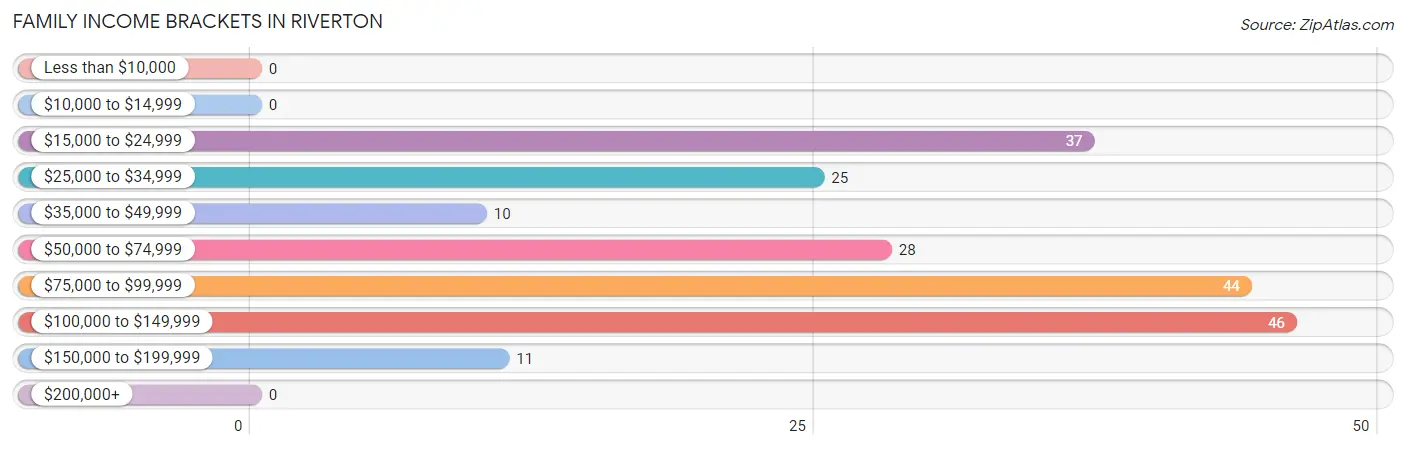
Family Income Brackets in Riverton
According to the Riverton family income data, there are 46 families falling into the $100,000 to $149,999 income range, which is the most common income bracket and makes up 22.9% of all families.
| Income Bracket | # Families | % Families |
| Less than $10,000 | 0 | 0.0% |
| $10,000 to $14,999 | 0 | 0.0% |
| $15,000 to $24,999 | 37 | 18.4% |
| $25,000 to $34,999 | 25 | 12.4% |
| $35,000 to $49,999 | 10 | 5.0% |
| $50,000 to $74,999 | 28 | 13.9% |
| $75,000 to $99,999 | 44 | 21.9% |
| $100,000 to $149,999 | 46 | 22.9% |
| $150,000 to $199,999 | 11 | 5.5% |
| $200,000+ | 0 | 0.0% |
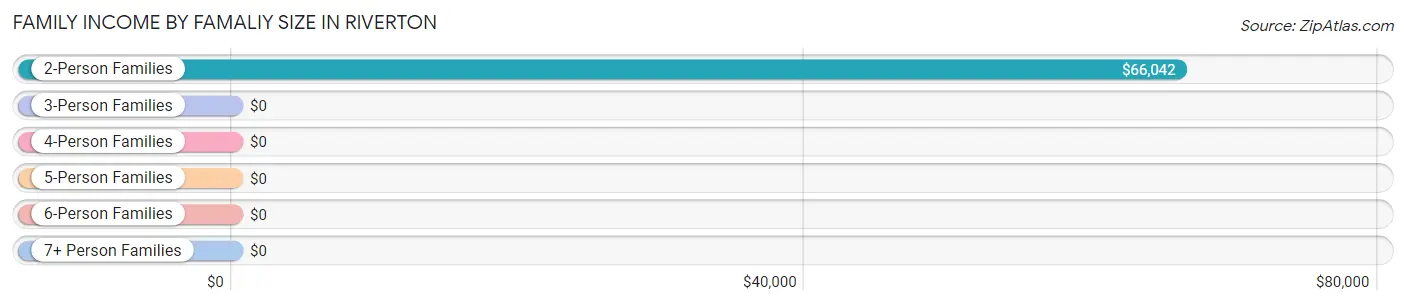
Family Income by Famaliy Size in Riverton
2-person families (136 | 67.7%) account for the highest median family income in Riverton with $66,042 per family, while 2-person families (136 | 67.7%) have the highest median income of $33,021 per family member.
| Income Bracket | # Families | Median Income |
| 2-Person Families | 136 (67.7%) | $66,042 |
| 3-Person Families | 21 (10.4%) | $0 |
| 4-Person Families | 21 (10.4%) | $0 |
| 5-Person Families | 23 (11.4%) | $0 |
| 6-Person Families | 0 (0.0%) | $0 |
| 7+ Person Families | 0 (0.0%) | $0 |
| Total | 201 (100.0%) | $85,114 |
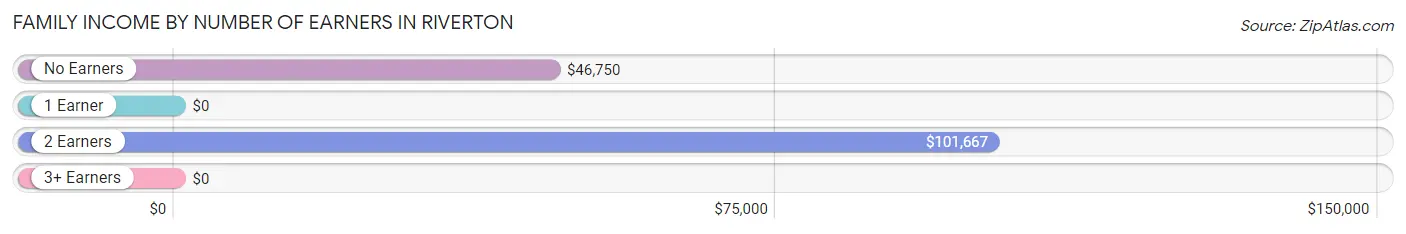
Family Income by Number of Earners in Riverton
| Number of Earners | # Families | Median Income |
| No Earners | 108 (53.7%) | $46,750 |
| 1 Earner | 17 (8.5%) | $0 |
| 2 Earners | 76 (37.8%) | $101,667 |
| 3+ Earners | 0 (0.0%) | $0 |
| Total | 201 (100.0%) | $85,114 |
Household Income in Riverton
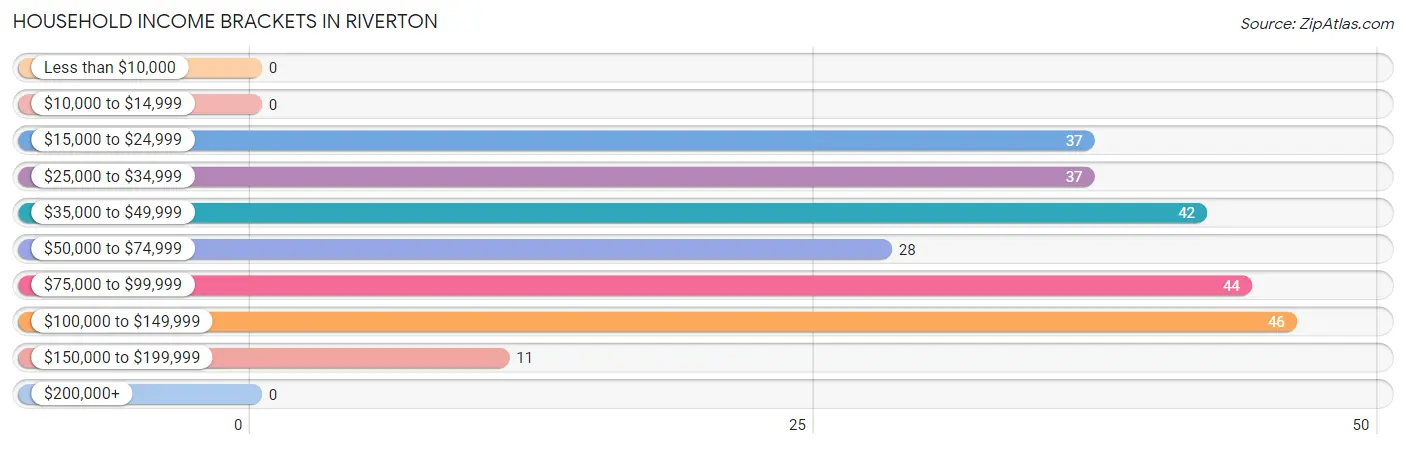
Household Income Brackets in Riverton
With 46 households falling in the category, the $100,000 to $149,999 income range is the most frequent in Riverton, accounting for 18.8% of all households.
| Income Bracket | # Households | % Households |
| Less than $10,000 | 0 | 0.0% |
| $10,000 to $14,999 | 0 | 0.0% |
| $15,000 to $24,999 | 37 | 15.1% |
| $25,000 to $34,999 | 37 | 15.1% |
| $35,000 to $49,999 | 42 | 17.1% |
| $50,000 to $74,999 | 28 | 11.4% |
| $75,000 to $99,999 | 44 | 18.0% |
| $100,000 to $149,999 | 46 | 18.8% |
| $150,000 to $199,999 | 11 | 4.5% |
| $200,000+ | 0 | 0.0% |
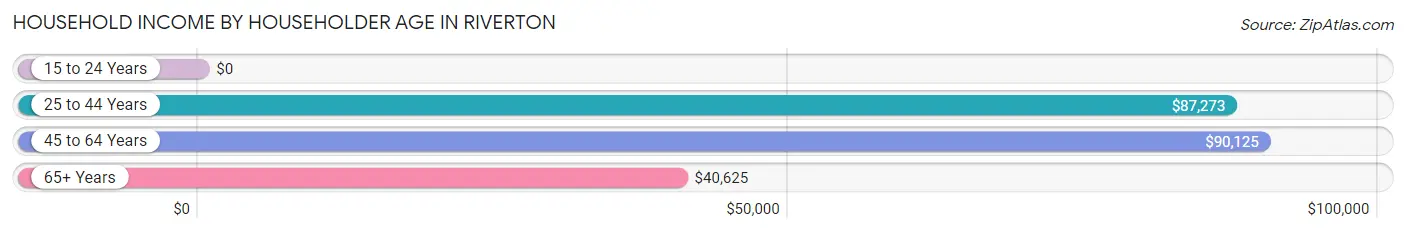
Household Income by Householder Age in Riverton
The median household income in Riverton is $66,354, with the highest median household income of $90,125 found in the 45 to 64 years age bracket for the primary householder. A total of 43 households (17.5%) fall into this category.
| Income Bracket | # Households | Median Income |
| 15 to 24 Years | 0 (0.0%) | $0 |
| 25 to 44 Years | 92 (37.6%) | $87,273 |
| 45 to 64 Years | 43 (17.5%) | $90,125 |
| 65+ Years | 110 (44.9%) | $40,625 |
| Total | 245 (100.0%) | $66,354 |
Poverty in Riverton
Income Below Poverty by Sex and Age in Riverton
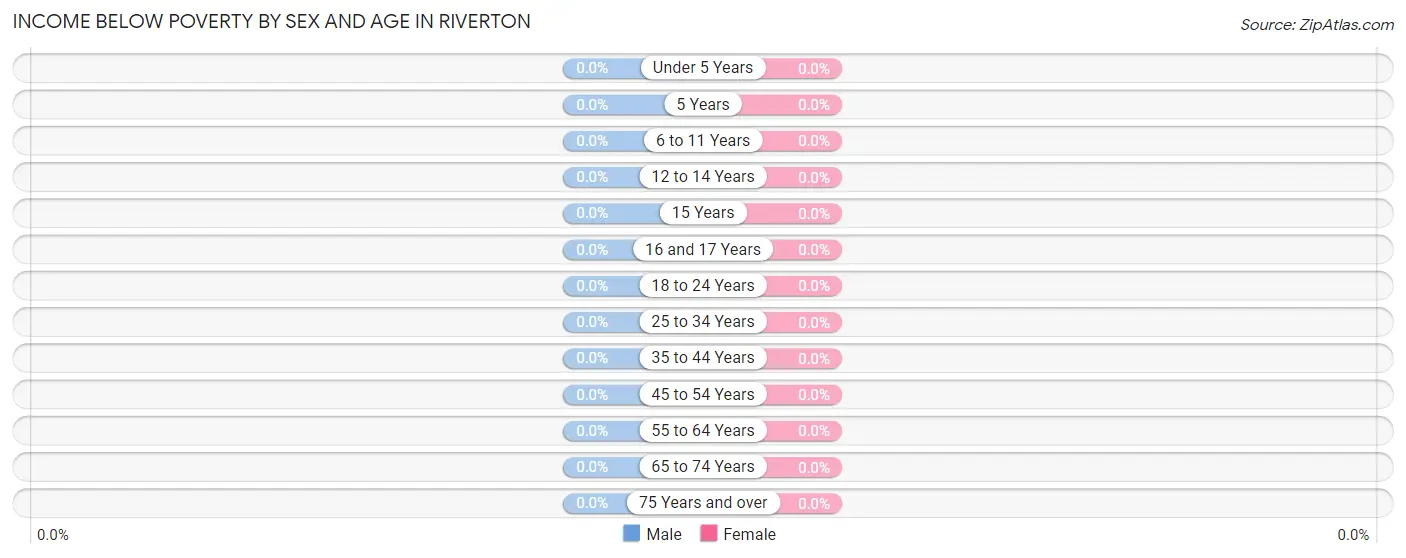
| Age Bracket | Male | Female |
| Under 5 Years | 0 (0.0%) | 0 (0.0%) |
| 5 Years | 0 (0.0%) | 0 (0.0%) |
| 6 to 11 Years | 0 (0.0%) | 0 (0.0%) |
| 12 to 14 Years | 0 (0.0%) | 0 (0.0%) |
| 15 Years | 0 (0.0%) | 0 (0.0%) |
| 16 and 17 Years | 0 (0.0%) | 0 (0.0%) |
| 18 to 24 Years | 0 (0.0%) | 0 (0.0%) |
| 25 to 34 Years | 0 (0.0%) | 0 (0.0%) |
| 35 to 44 Years | 0 (0.0%) | 0 (0.0%) |
| 45 to 54 Years | 0 (0.0%) | 0 (0.0%) |
| 55 to 64 Years | 0 (0.0%) | 0 (0.0%) |
| 65 to 74 Years | 0 (0.0%) | 0 (0.0%) |
| 75 Years and over | 0 (0.0%) | 0 (0.0%) |
| Total | 0 (0.0%) | 0 (0.0%) |
Income Above Poverty by Sex and Age in Riverton
According to the poverty statistics in Riverton, males aged under 5 years and females aged under 5 years are the age groups that are most secure financially, with 100.0% of males and 100.0% of females in these age groups living above the poverty line.
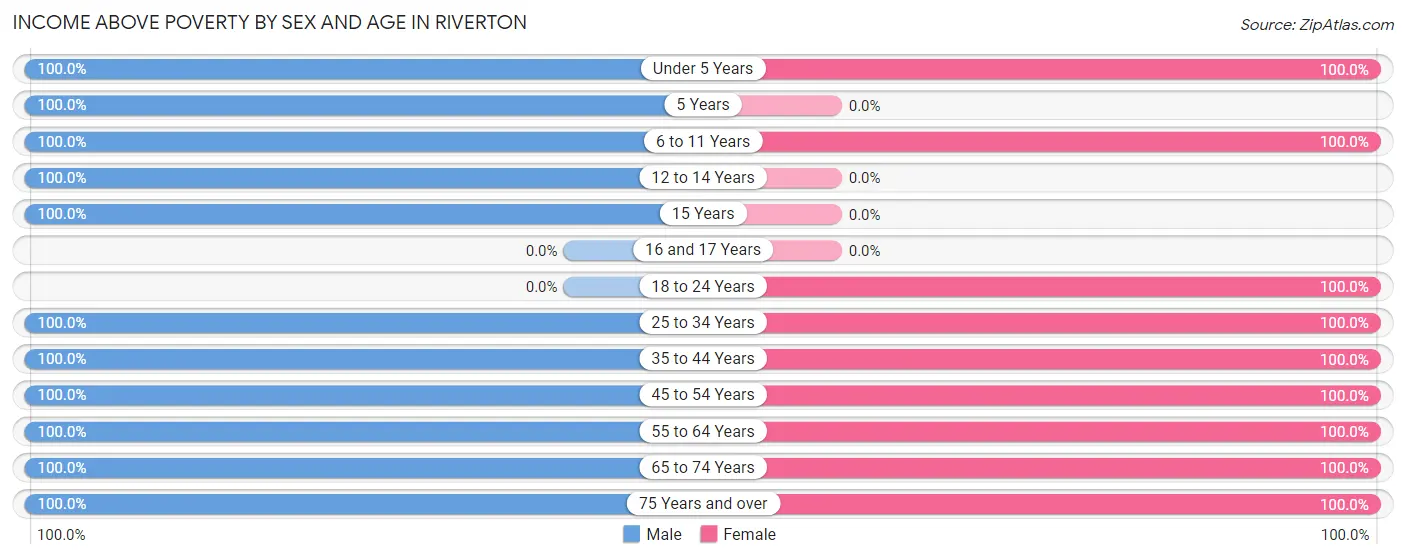
| Age Bracket | Male | Female |
| Under 5 Years | 10 (100.0%) | 94 (100.0%) |
| 5 Years | 8 (100.0%) | 0 (0.0%) |
| 6 to 11 Years | 18 (100.0%) | 68 (100.0%) |
| 12 to 14 Years | 5 (100.0%) | 0 (0.0%) |
| 15 Years | 5 (100.0%) | 0 (0.0%) |
| 16 and 17 Years | 0 (0.0%) | 0 (0.0%) |
| 18 to 24 Years | 0 (0.0%) | 9 (100.0%) |
| 25 to 34 Years | 46 (100.0%) | 47 (100.0%) |
| 35 to 44 Years | 30 (100.0%) | 33 (100.0%) |
| 45 to 54 Years | 82 (100.0%) | 10 (100.0%) |
| 55 to 64 Years | 35 (100.0%) | 24 (100.0%) |
| 65 to 74 Years | 66 (100.0%) | 83 (100.0%) |
| 75 Years and over | 30 (100.0%) | 26 (100.0%) |
| Total | 335 (100.0%) | 394 (100.0%) |
Income Below Poverty Among Married-Couple Families in Riverton
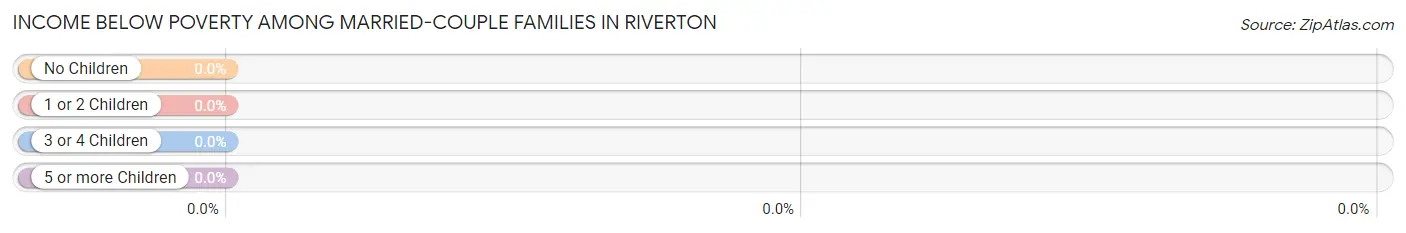
| Children | Above Poverty | Below Poverty |
| No Children | 130 (100.0%) | 0 (0.0%) |
| 1 or 2 Children | 33 (100.0%) | 0 (0.0%) |
| 3 or 4 Children | 23 (100.0%) | 0 (0.0%) |
| 5 or more Children | 0 (0.0%) | 0 (0.0%) |
| Total | 186 (100.0%) | 0 (0.0%) |
Income Below Poverty Among Single-Parent Households in Riverton
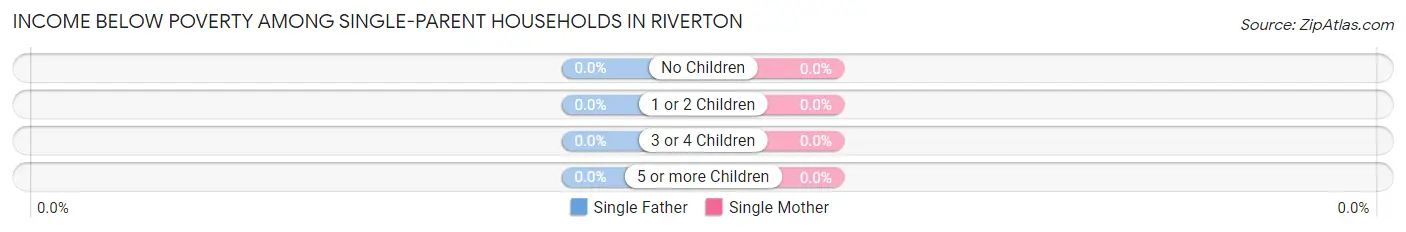
| Children | Single Father | Single Mother |
| No Children | 0 (0.0%) | 0 (0.0%) |
| 1 or 2 Children | 0 (0.0%) | 0 (0.0%) |
| 3 or 4 Children | 0 (0.0%) | 0 (0.0%) |
| 5 or more Children | 0 (0.0%) | 0 (0.0%) |
| Total | 0 (0.0%) | 0 (0.0%) |
Income Below Poverty Among Married-Couple vs Single-Parent Households in Riverton
| Children | Married-Couple Families | Single-Parent Households |
| No Children | 0 (0.0%) | 0 (0.0%) |
| 1 or 2 Children | 0 (0.0%) | 0 (0.0%) |
| 3 or 4 Children | 0 (0.0%) | 0 (0.0%) |
| 5 or more Children | 0 (0.0%) | 0 (0.0%) |
| Total | 0 (0.0%) | 0 (0.0%) |
Race in Riverton
The most populous races in Riverton are White / Caucasian (691 | 94.8%), Two or more Races (20 | 2.7%), and Native / Alaskan (18 | 2.5%).
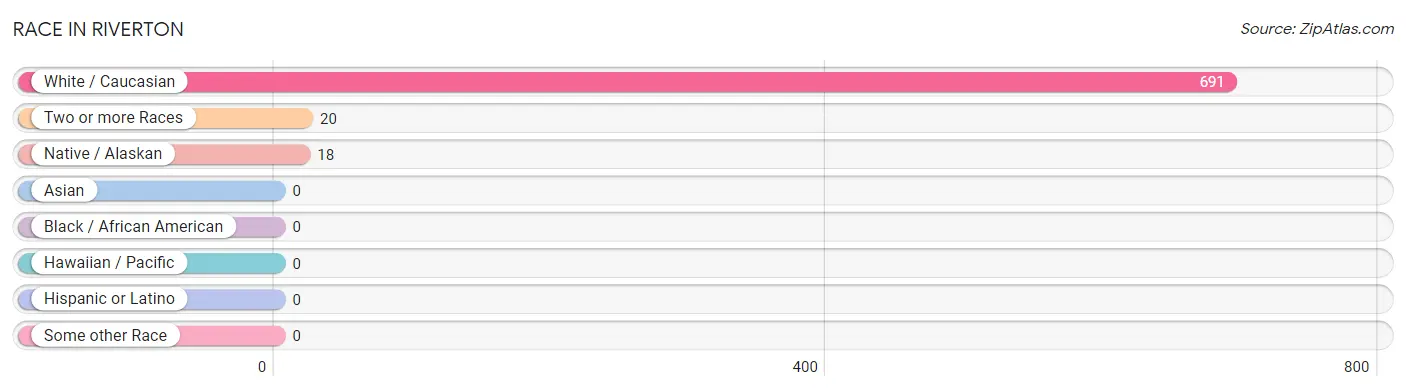
| Race | # Population | % Population |
| Asian | 0 | 0.0% |
| Black / African American | 0 | 0.0% |
| Hawaiian / Pacific | 0 | 0.0% |
| Hispanic or Latino | 0 | 0.0% |
| Native / Alaskan | 18 | 2.5% |
| White / Caucasian | 691 | 94.8% |
| Two or more Races | 20 | 2.7% |
| Some other Race | 0 | 0.0% |
| Total | 729 | 100.0% |
Ancestry in Riverton
The most populous ancestries reported in Riverton are American (171 | 23.5%), German (85 | 11.7%), European (35 | 4.8%), Irish (31 | 4.3%), and English (22 | 3.0%), together accounting for 47.2% of all Riverton residents.
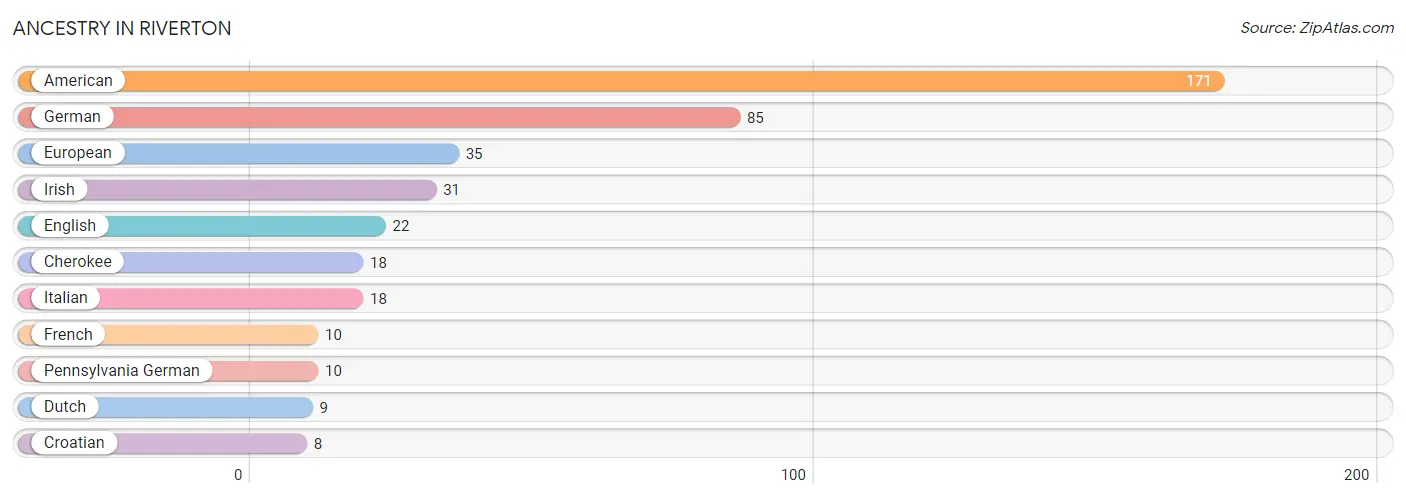
| Ancestry | # Population | % Population |
| American | 171 | 23.5% |
| Cherokee | 18 | 2.5% |
| Croatian | 8 | 1.1% |
| Dutch | 9 | 1.2% |
| English | 22 | 3.0% |
| European | 35 | 4.8% |
| French | 10 | 1.4% |
| German | 85 | 11.7% |
| Irish | 31 | 4.3% |
| Italian | 18 | 2.5% |
| Pennsylvania German | 10 | 1.4% | View All 11 Rows |
Immigrants in Riverton

| Immigration Origin | # Population | % Population | View All 0 Rows |
Sex and Age in Riverton
Sex and Age in Riverton
The most populous age groups in Riverton are 45 to 49 Years (82 | 24.5%) for men and Under 5 Years (94 | 23.9%) for women.
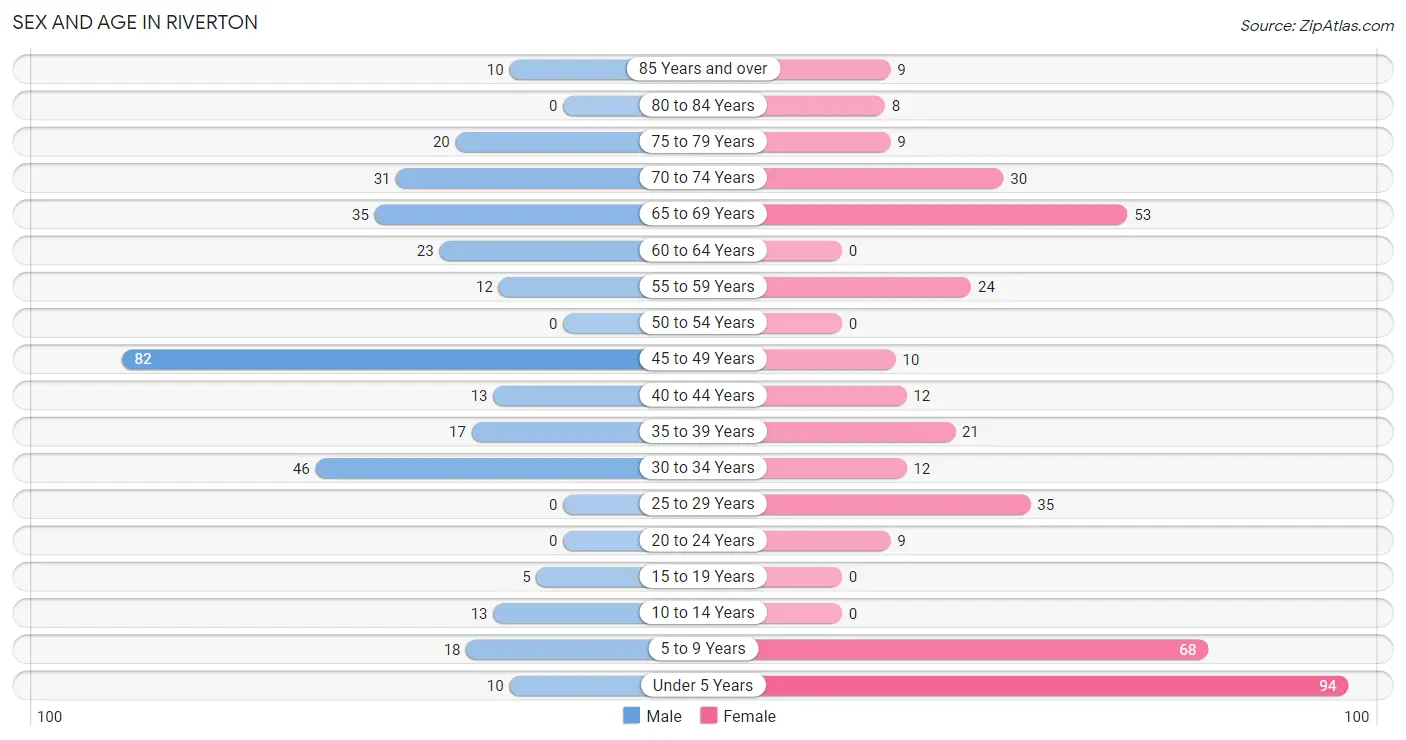
| Age Bracket | Male | Female |
| Under 5 Years | 10 (3.0%) | 94 (23.9%) |
| 5 to 9 Years | 18 (5.4%) | 68 (17.3%) |
| 10 to 14 Years | 13 (3.9%) | 0 (0.0%) |
| 15 to 19 Years | 5 (1.5%) | 0 (0.0%) |
| 20 to 24 Years | 0 (0.0%) | 9 (2.3%) |
| 25 to 29 Years | 0 (0.0%) | 35 (8.9%) |
| 30 to 34 Years | 46 (13.7%) | 12 (3.0%) |
| 35 to 39 Years | 17 (5.1%) | 21 (5.3%) |
| 40 to 44 Years | 13 (3.9%) | 12 (3.0%) |
| 45 to 49 Years | 82 (24.5%) | 10 (2.5%) |
| 50 to 54 Years | 0 (0.0%) | 0 (0.0%) |
| 55 to 59 Years | 12 (3.6%) | 24 (6.1%) |
| 60 to 64 Years | 23 (6.9%) | 0 (0.0%) |
| 65 to 69 Years | 35 (10.4%) | 53 (13.5%) |
| 70 to 74 Years | 31 (9.2%) | 30 (7.6%) |
| 75 to 79 Years | 20 (6.0%) | 9 (2.3%) |
| 80 to 84 Years | 0 (0.0%) | 8 (2.0%) |
| 85 Years and over | 10 (3.0%) | 9 (2.3%) |
| Total | 335 (100.0%) | 394 (100.0%) |
Families and Households in Riverton
Median Family Size in Riverton
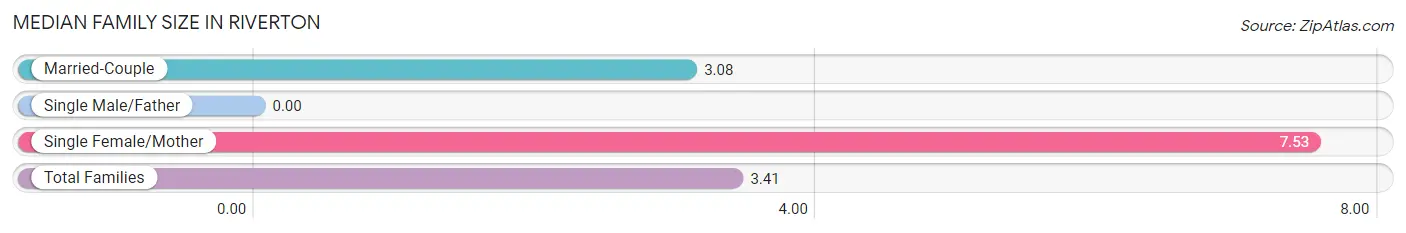
| Family Type | # Families | Family Size |
| Married-Couple | 186 (92.5%) | 3.08 |
| Single Male/Father | 0 (0.0%) | - |
| Single Female/Mother | 15 (7.5%) | 7.53 |
| Total Families | 201 (100.0%) | 3.41 |
Median Household Size in Riverton
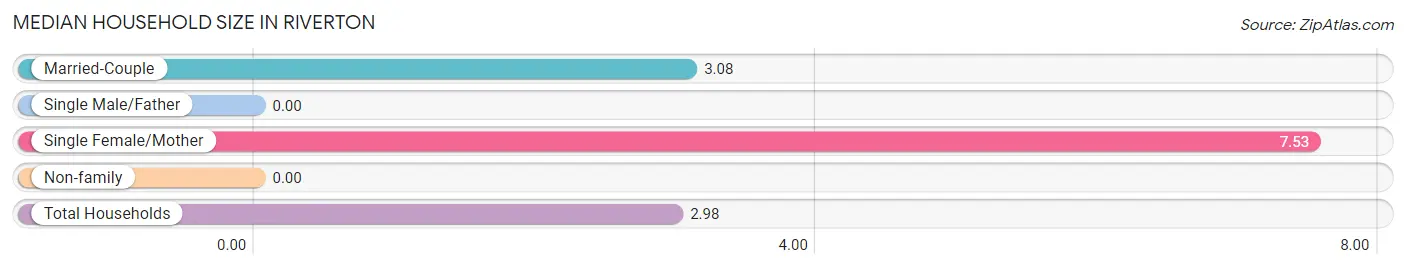
| Household Type | # Households | Household Size |
| Married-Couple | 186 (75.9%) | 3.08 |
| Single Male/Father | 0 (0.0%) | - |
| Single Female/Mother | 15 (6.1%) | 7.53 |
| Non-family | 44 (18.0%) | - |
| Total Households | 245 (100.0%) | 2.98 |
Household Size by Marriage Status in Riverton
Out of a total of 245 households in Riverton, 201 (82.0%) are family households, while 44 (18.0%) are nonfamily households. The most numerous type of family households are 2-person households, comprising 136, and the most common type of nonfamily households are 1-person households, comprising 44.
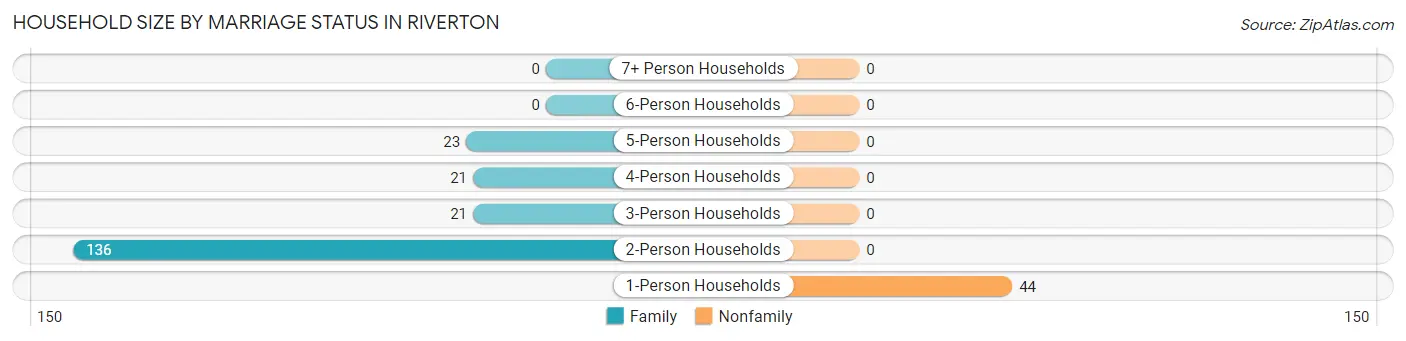
| Household Size | Family Households | Nonfamily Households |
| 1-Person Households | - | 44 (18.0%) |
| 2-Person Households | 136 (55.5%) | 0 (0.0%) |
| 3-Person Households | 21 (8.6%) | 0 (0.0%) |
| 4-Person Households | 21 (8.6%) | 0 (0.0%) |
| 5-Person Households | 23 (9.4%) | 0 (0.0%) |
| 6-Person Households | 0 (0.0%) | 0 (0.0%) |
| 7+ Person Households | 0 (0.0%) | 0 (0.0%) |
| Total | 201 (82.0%) | 44 (18.0%) |
Female Fertility in Riverton
Fertility by Age in Riverton
Average fertility rate in Riverton is 111.0 births per 1,000 women. Women in the age bracket of 20 to 34 years have the highest fertility rate with 196.0 births per 1,000 women. Women in the age bracket of 20 to 34 years acount for 100.0% of all women with births.
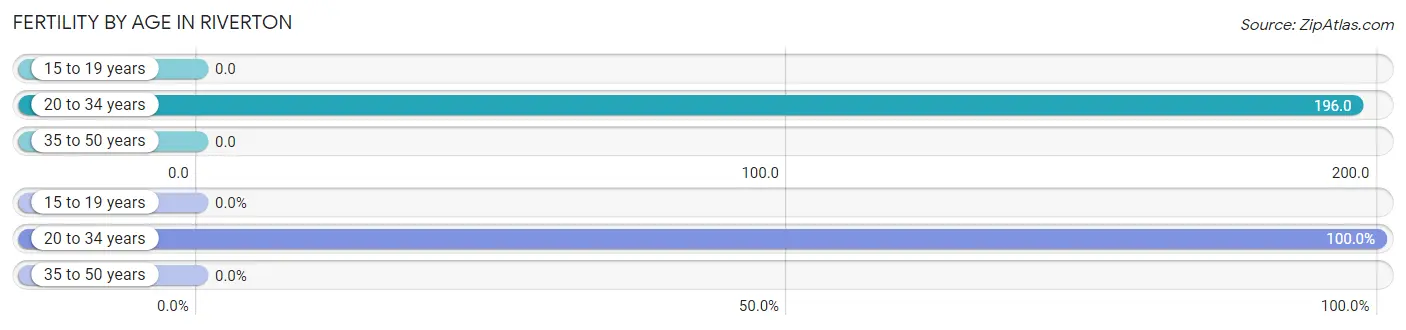
| Age Bracket | Women with Births | Births / 1,000 Women |
| 15 to 19 years | 0 (0.0%) | 0.0 |
| 20 to 34 years | 11 (100.0%) | 196.0 |
| 35 to 50 years | 0 (0.0%) | 0.0 |
| Total | 11 (100.0%) | 111.0 |
Fertility by Age by Marriage Status in Riverton
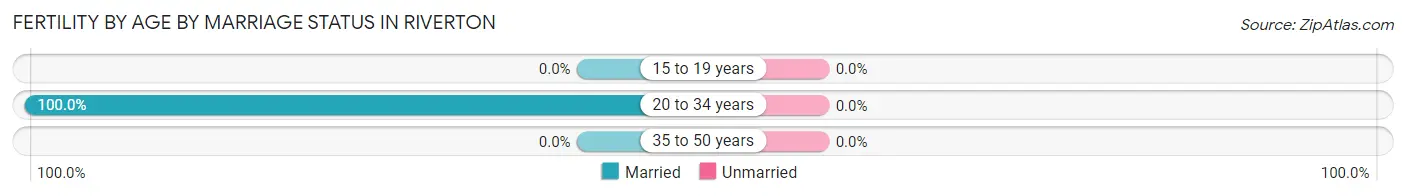
| Age Bracket | Married | Unmarried |
| 15 to 19 years | 0 (0.0%) | 0 (0.0%) |
| 20 to 34 years | 11 (100.0%) | 0 (0.0%) |
| 35 to 50 years | 0 (0.0%) | 0 (0.0%) |
| Total | 11 (100.0%) | 0 (0.0%) |
Fertility by Education in Riverton
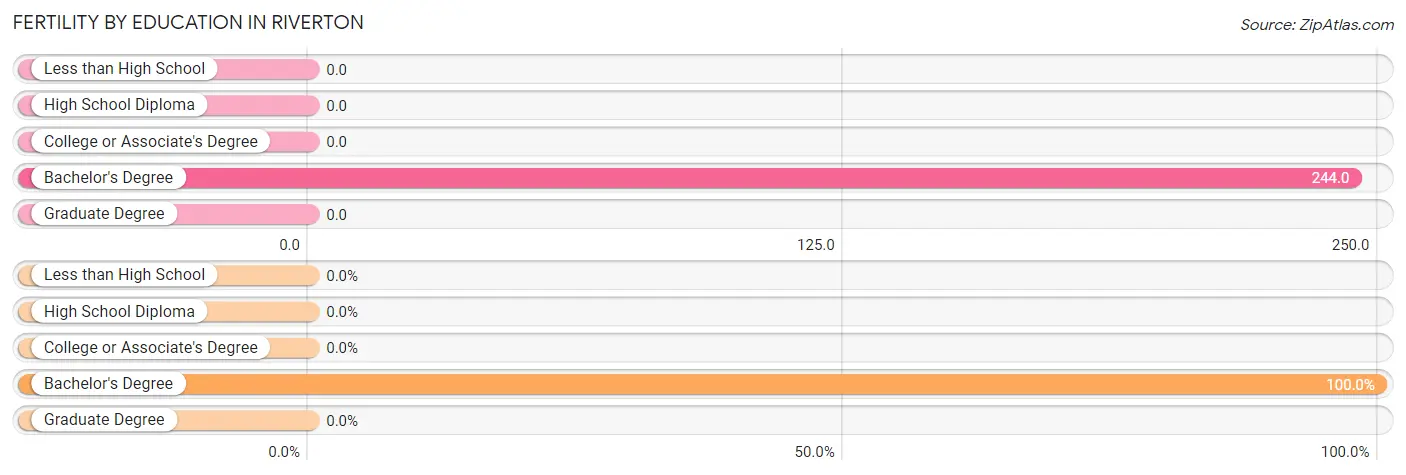
| Educational Attainment | Women with Births | Births / 1,000 Women |
| Less than High School | 0 (0.0%) | 0.0 |
| High School Diploma | 0 (0.0%) | 0.0 |
| College or Associate's Degree | 0 (0.0%) | 0.0 |
| Bachelor's Degree | 11 (100.0%) | 244.0 |
| Graduate Degree | 0 (0.0%) | 0.0 |
| Total | 11 (100.0%) | 111.0 |
Fertility by Education by Marriage Status in Riverton
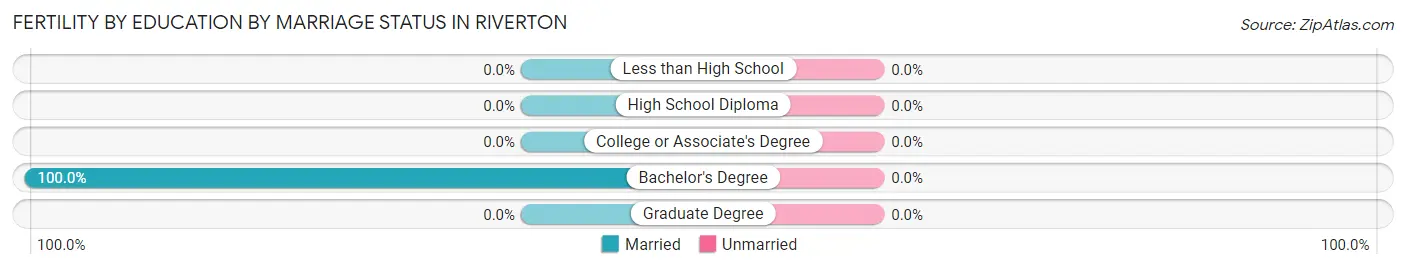
| Educational Attainment | Married | Unmarried |
| Less than High School | 0 (0.0%) | 0 (0.0%) |
| High School Diploma | 0 (0.0%) | 0 (0.0%) |
| College or Associate's Degree | 0 (0.0%) | 0 (0.0%) |
| Bachelor's Degree | 11 (100.0%) | 0 (0.0%) |
| Graduate Degree | 0 (0.0%) | 0 (0.0%) |
| Total | 11 (100.0%) | 0 (0.0%) |
Employment Characteristics in Riverton
Employment by Class of Employer in Riverton
Among the 281 employed individuals in Riverton, private company employees (189 | 67.3%), not-for-profit organizations (47 | 16.7%), and local government employees (24 | 8.5%) make up the most common classes of employment.
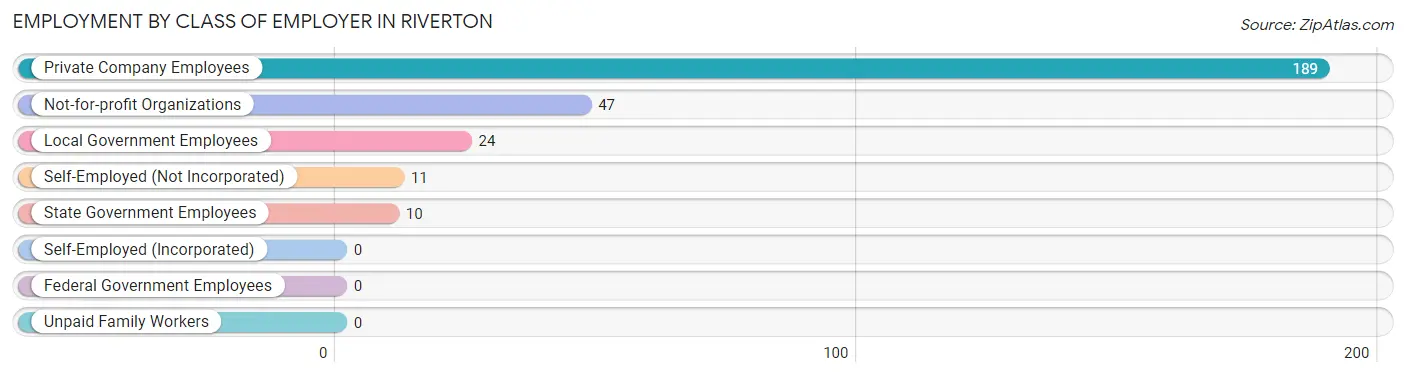
| Employer Class | # Employees | % Employees |
| Private Company Employees | 189 | 67.3% |
| Self-Employed (Incorporated) | 0 | 0.0% |
| Self-Employed (Not Incorporated) | 11 | 3.9% |
| Not-for-profit Organizations | 47 | 16.7% |
| Local Government Employees | 24 | 8.5% |
| State Government Employees | 10 | 3.6% |
| Federal Government Employees | 0 | 0.0% |
| Unpaid Family Workers | 0 | 0.0% |
| Total | 281 | 100.0% |
Employment Status by Age in Riverton
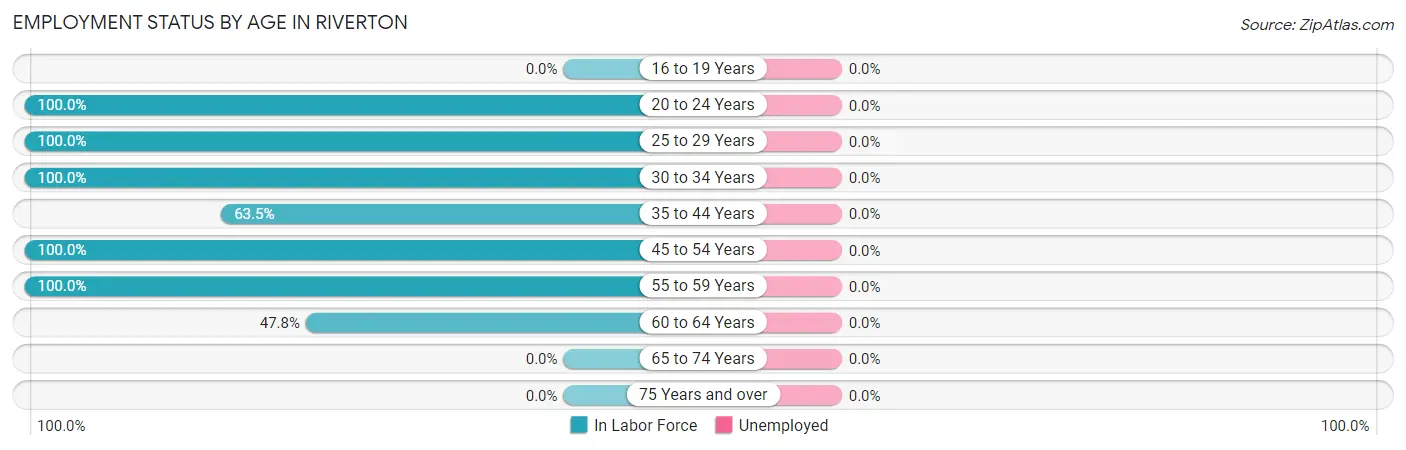
| Age Bracket | In Labor Force | Unemployed |
| 16 to 19 Years | 0 (0.0%) | 0 (0.0%) |
| 20 to 24 Years | 9 (100.0%) | 0 (0.0%) |
| 25 to 29 Years | 35 (100.0%) | 0 (0.0%) |
| 30 to 34 Years | 58 (100.0%) | 0 (0.0%) |
| 35 to 44 Years | 40 (63.5%) | 0 (0.0%) |
| 45 to 54 Years | 92 (100.0%) | 0 (0.0%) |
| 55 to 59 Years | 36 (100.0%) | 0 (0.0%) |
| 60 to 64 Years | 11 (47.8%) | 0 (0.0%) |
| 65 to 74 Years | 0 (0.0%) | 0 (0.0%) |
| 75 Years and over | 0 (0.0%) | 0 (0.0%) |
| Total | 281 (53.9%) | 0 (0.0%) |
Employment Status by Educational Attainment in Riverton
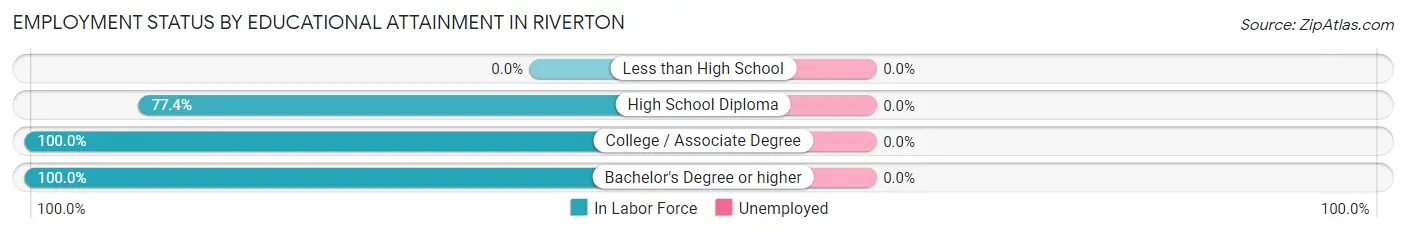
| Educational Attainment | In Labor Force | Unemployed |
| Less than High School | 0 (0.0%) | 0 (0.0%) |
| High School Diploma | 120 (77.4%) | 0 (0.0%) |
| College / Associate Degree | 60 (100.0%) | 0 (0.0%) |
| Bachelor's Degree or higher | 92 (100.0%) | 0 (0.0%) |
| Total | 272 (88.6%) | 0 (0.0%) |
Employment Occupations by Sex in Riverton
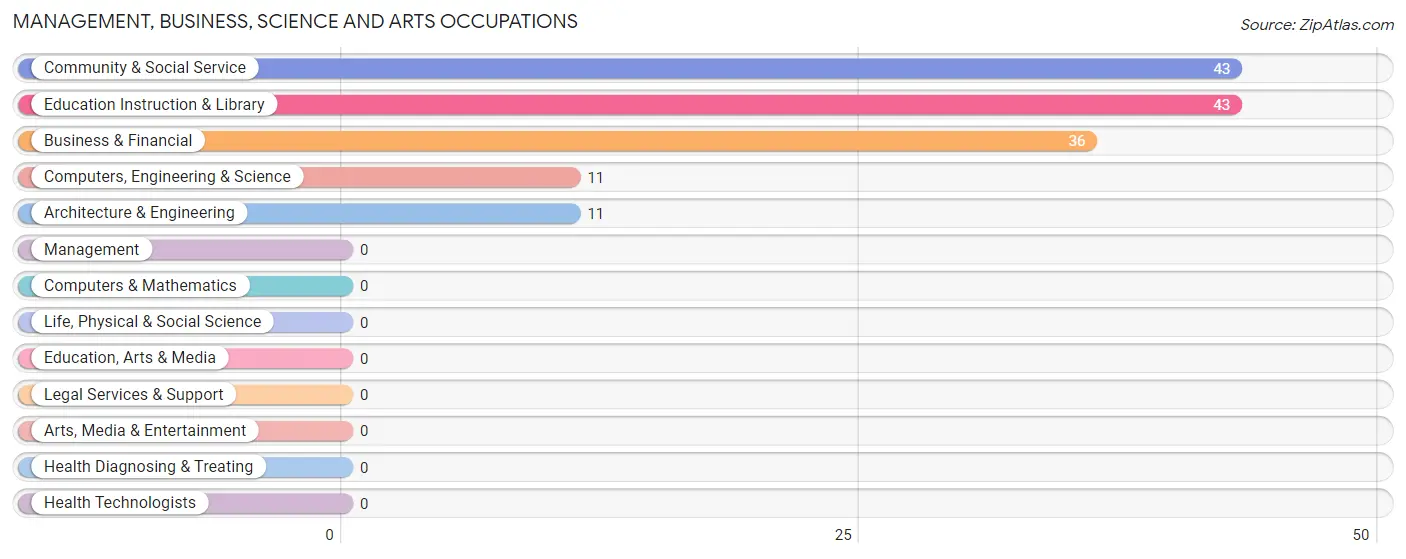
Management, Business, Science and Arts Occupations
The most common Management, Business, Science and Arts occupations in Riverton are Community & Social Service (43 | 15.3%), Education Instruction & Library (43 | 15.3%), Business & Financial (36 | 12.8%), Computers, Engineering & Science (11 | 3.9%), and Architecture & Engineering (11 | 3.9%).
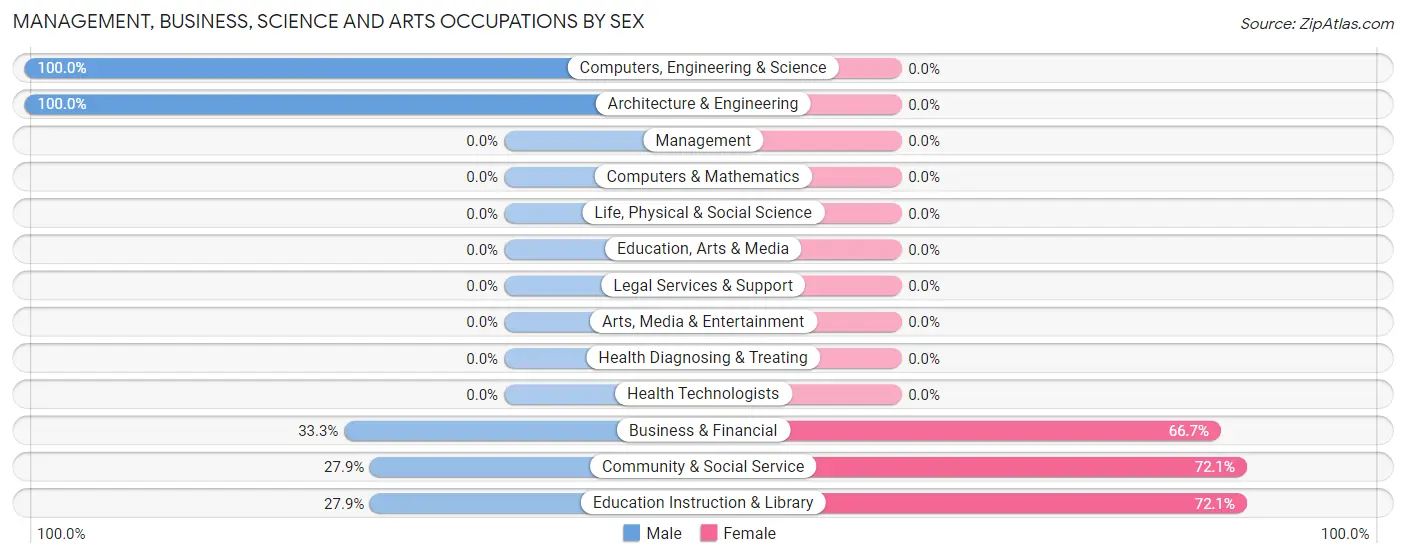
Management, Business, Science and Arts Occupations by Sex
Within the Management, Business, Science and Arts occupations in Riverton, the most male-oriented occupations are Computers, Engineering & Science (100.0%), Architecture & Engineering (100.0%), and Business & Financial (33.3%), while the most female-oriented occupations are Community & Social Service (72.1%), Education Instruction & Library (72.1%), and Business & Financial (66.7%).
| Occupation | Male | Female |
| Management | 0 (0.0%) | 0 (0.0%) |
| Business & Financial | 12 (33.3%) | 24 (66.7%) |
| Computers, Engineering & Science | 11 (100.0%) | 0 (0.0%) |
| Computers & Mathematics | 0 (0.0%) | 0 (0.0%) |
| Architecture & Engineering | 11 (100.0%) | 0 (0.0%) |
| Life, Physical & Social Science | 0 (0.0%) | 0 (0.0%) |
| Community & Social Service | 12 (27.9%) | 31 (72.1%) |
| Education, Arts & Media | 0 (0.0%) | 0 (0.0%) |
| Legal Services & Support | 0 (0.0%) | 0 (0.0%) |
| Education Instruction & Library | 12 (27.9%) | 31 (72.1%) |
| Arts, Media & Entertainment | 0 (0.0%) | 0 (0.0%) |
| Health Diagnosing & Treating | 0 (0.0%) | 0 (0.0%) |
| Health Technologists | 0 (0.0%) | 0 (0.0%) |
| Total (Category) | 35 (38.9%) | 55 (61.1%) |
| Total (Overall) | 181 (64.4%) | 100 (35.6%) |
Services Occupations
The most common Services occupations in Riverton are Personal Care & Service (11 | 3.9%), and Healthcare Support (10 | 3.6%).
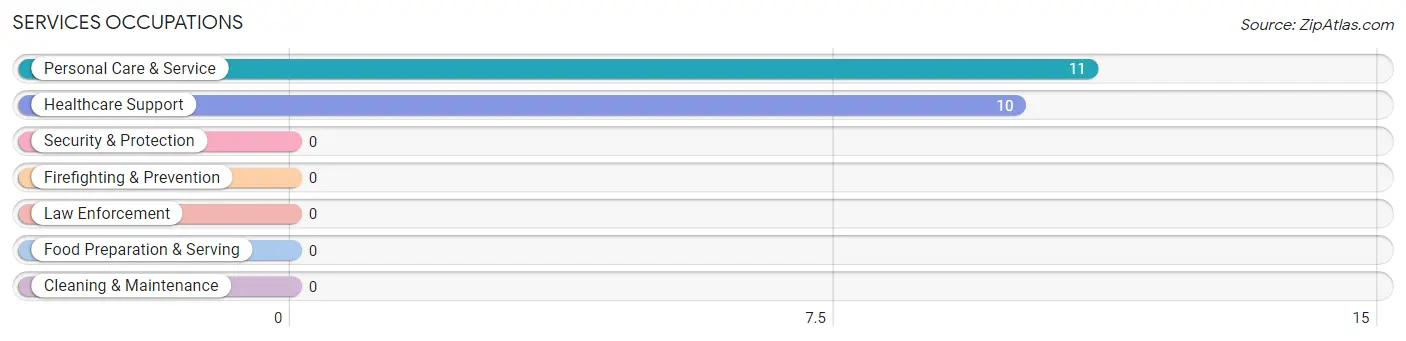
Services Occupations by Sex
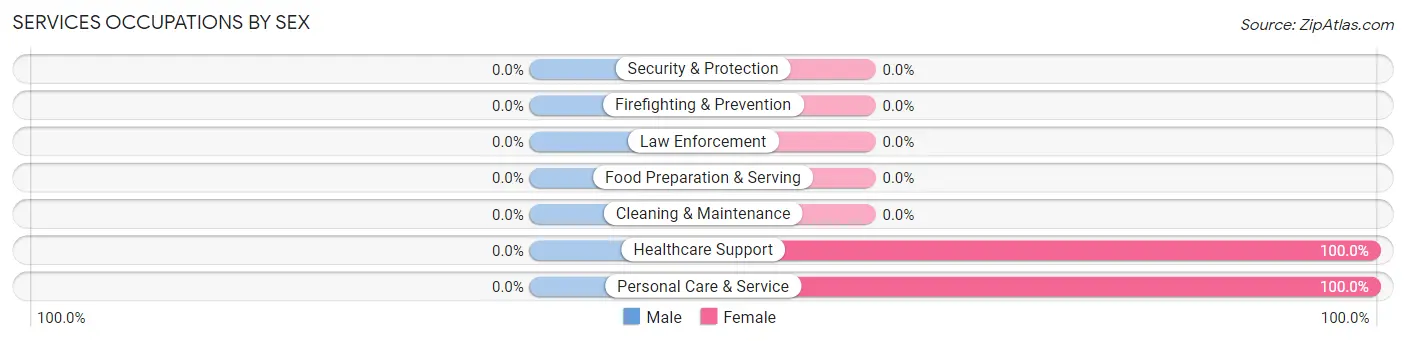
| Occupation | Male | Female |
| Healthcare Support | 0 (0.0%) | 10 (100.0%) |
| Security & Protection | 0 (0.0%) | 0 (0.0%) |
| Firefighting & Prevention | 0 (0.0%) | 0 (0.0%) |
| Law Enforcement | 0 (0.0%) | 0 (0.0%) |
| Food Preparation & Serving | 0 (0.0%) | 0 (0.0%) |
| Cleaning & Maintenance | 0 (0.0%) | 0 (0.0%) |
| Personal Care & Service | 0 (0.0%) | 11 (100.0%) |
| Total (Category) | 0 (0.0%) | 21 (100.0%) |
| Total (Overall) | 181 (64.4%) | 100 (35.6%) |
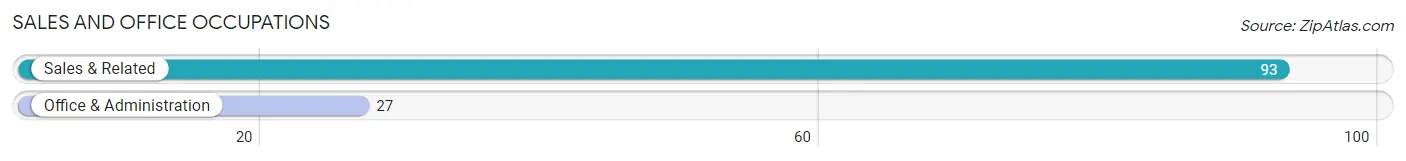
Sales and Office Occupations
The most common Sales and Office occupations in Riverton are Sales & Related (93 | 33.1%), and Office & Administration (27 | 9.6%).
Sales and Office Occupations by Sex
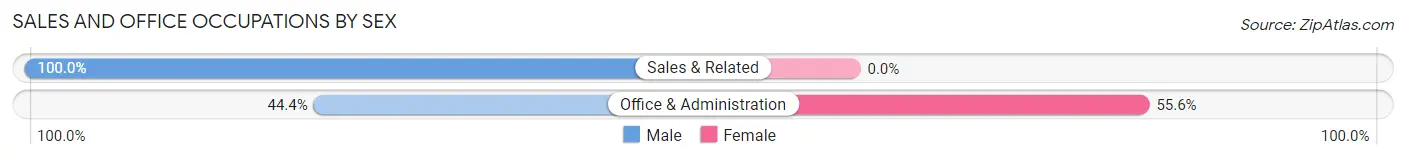
| Occupation | Male | Female |
| Sales & Related | 93 (100.0%) | 0 (0.0%) |
| Office & Administration | 12 (44.4%) | 15 (55.6%) |
| Total (Category) | 105 (87.5%) | 15 (12.5%) |
| Total (Overall) | 181 (64.4%) | 100 (35.6%) |
Natural Resources, Construction and Maintenance Occupations
The most common Natural Resources, Construction and Maintenance occupations in Riverton are Construction & Extraction (17 | 6.0%), and Installation, Maintenance & Repair (13 | 4.6%).
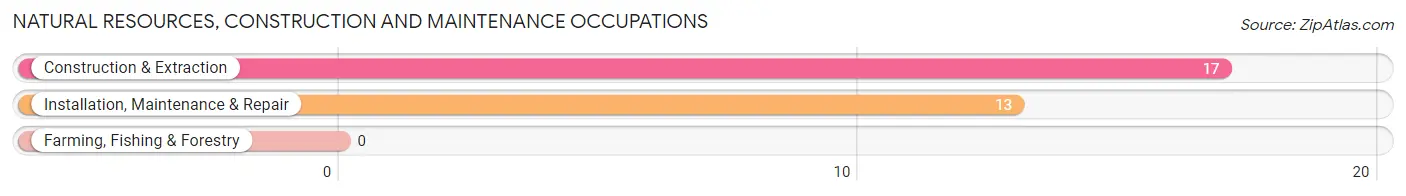
Natural Resources, Construction and Maintenance Occupations by Sex
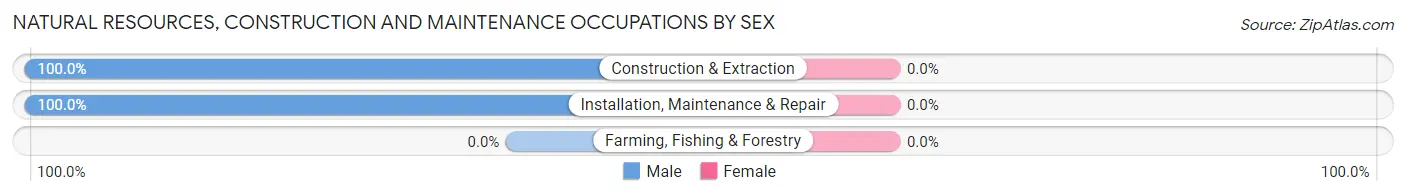
| Occupation | Male | Female |
| Farming, Fishing & Forestry | 0 (0.0%) | 0 (0.0%) |
| Construction & Extraction | 17 (100.0%) | 0 (0.0%) |
| Installation, Maintenance & Repair | 13 (100.0%) | 0 (0.0%) |
| Total (Category) | 30 (100.0%) | 0 (0.0%) |
| Total (Overall) | 181 (64.4%) | 100 (35.6%) |
Production, Transportation and Moving Occupations
The most common Production, Transportation and Moving occupations in Riverton are Production (11 | 3.9%), and Transportation (9 | 3.2%).
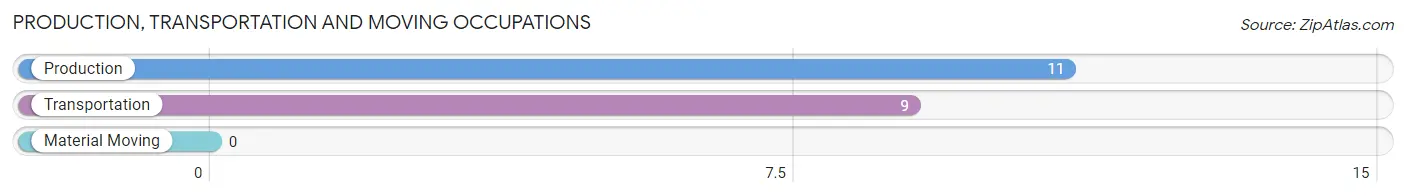
Production, Transportation and Moving Occupations by Sex
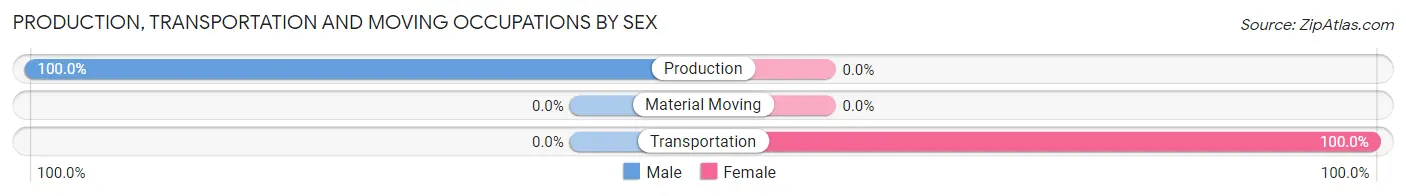
| Occupation | Male | Female |
| Production | 11 (100.0%) | 0 (0.0%) |
| Transportation | 0 (0.0%) | 9 (100.0%) |
| Material Moving | 0 (0.0%) | 0 (0.0%) |
| Total (Category) | 11 (55.0%) | 9 (45.0%) |
| Total (Overall) | 181 (64.4%) | 100 (35.6%) |
Employment Industries by Sex in Riverton
Employment Industries in Riverton
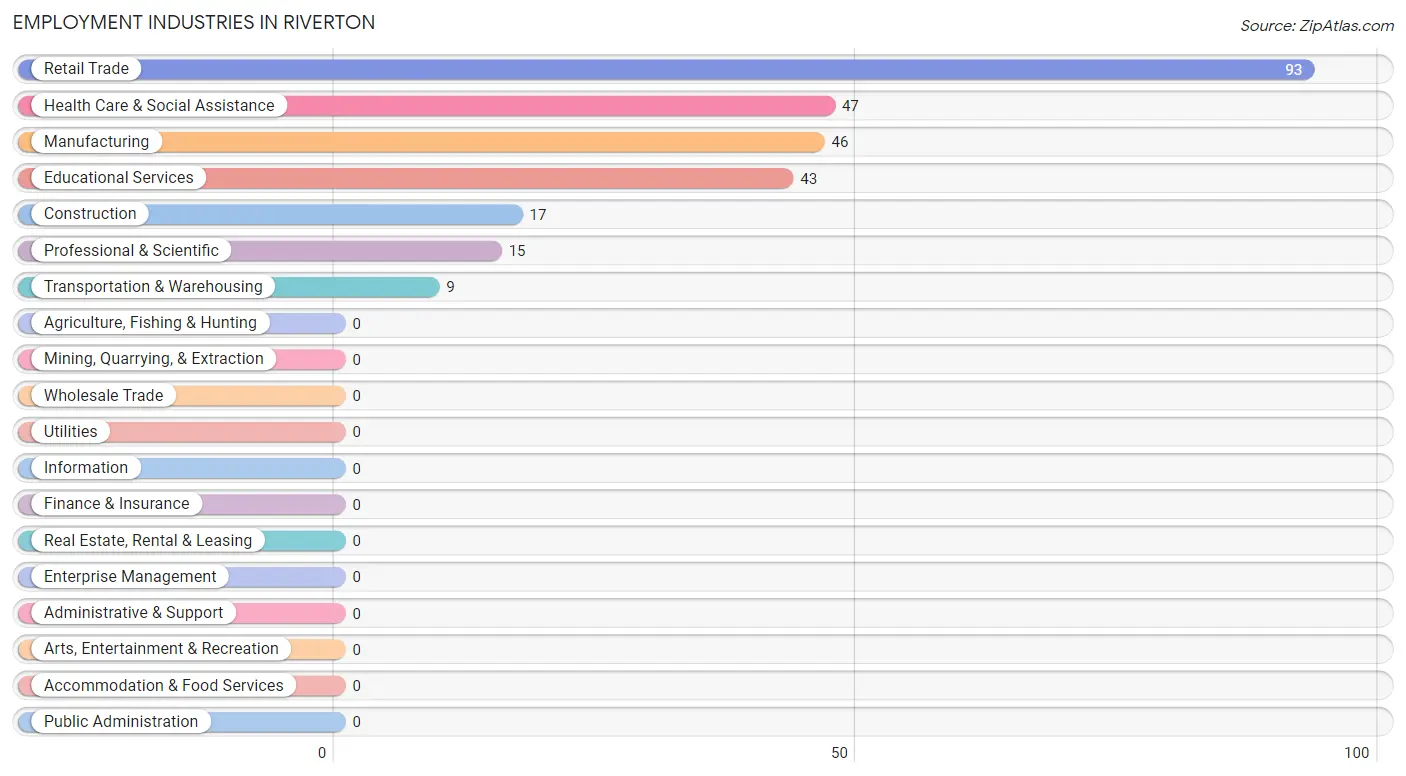
The major employment industries in Riverton include Retail Trade (93 | 33.1%), Health Care & Social Assistance (47 | 16.7%), Manufacturing (46 | 16.4%), Educational Services (43 | 15.3%), and Construction (17 | 6.0%).
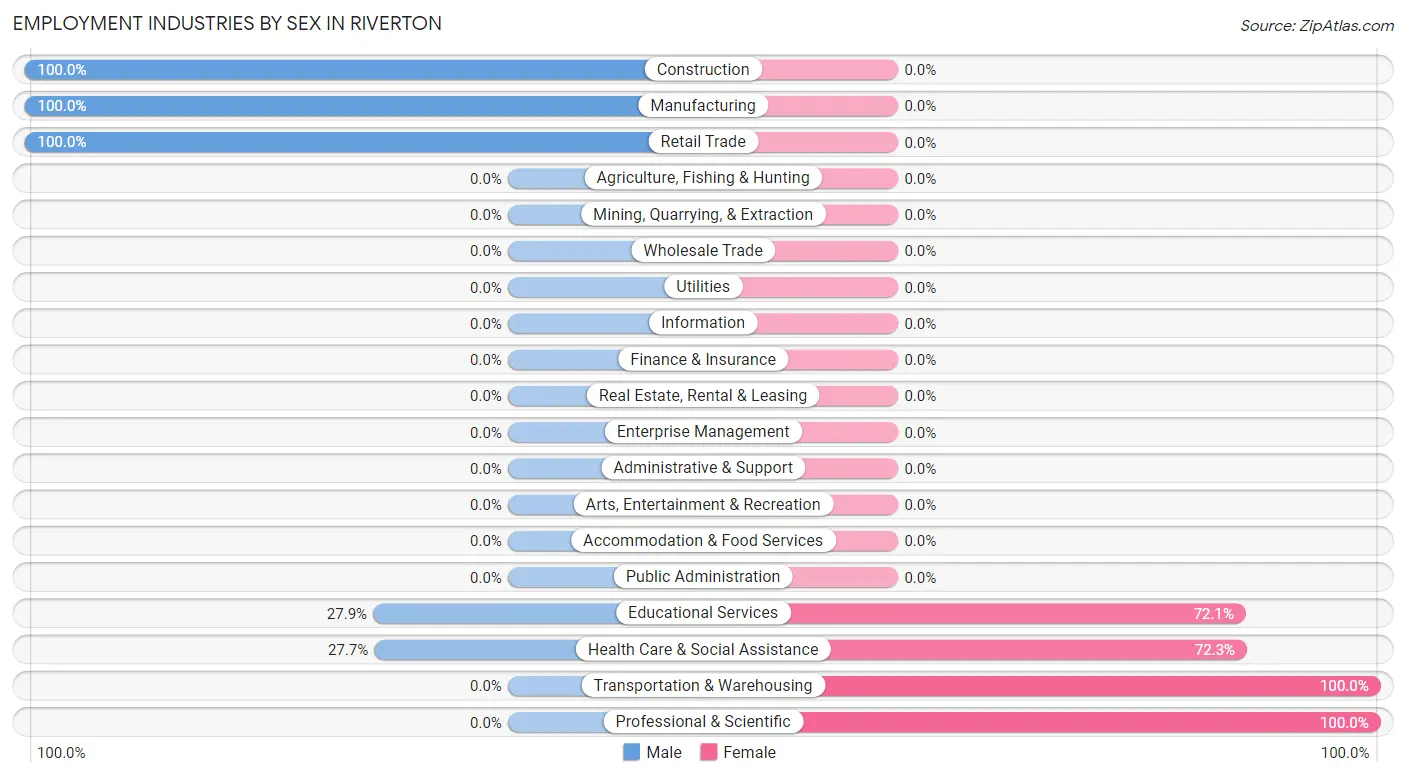
Employment Industries by Sex in Riverton
The Riverton industries that see more men than women are Construction (100.0%), Manufacturing (100.0%), and Retail Trade (100.0%), whereas the industries that tend to have a higher number of women are Transportation & Warehousing (100.0%), Professional & Scientific (100.0%), and Health Care & Social Assistance (72.3%).
| Industry | Male | Female |
| Agriculture, Fishing & Hunting | 0 (0.0%) | 0 (0.0%) |
| Mining, Quarrying, & Extraction | 0 (0.0%) | 0 (0.0%) |
| Construction | 17 (100.0%) | 0 (0.0%) |
| Manufacturing | 46 (100.0%) | 0 (0.0%) |
| Wholesale Trade | 0 (0.0%) | 0 (0.0%) |
| Retail Trade | 93 (100.0%) | 0 (0.0%) |
| Transportation & Warehousing | 0 (0.0%) | 9 (100.0%) |
| Utilities | 0 (0.0%) | 0 (0.0%) |
| Information | 0 (0.0%) | 0 (0.0%) |
| Finance & Insurance | 0 (0.0%) | 0 (0.0%) |
| Real Estate, Rental & Leasing | 0 (0.0%) | 0 (0.0%) |
| Professional & Scientific | 0 (0.0%) | 15 (100.0%) |
| Enterprise Management | 0 (0.0%) | 0 (0.0%) |
| Administrative & Support | 0 (0.0%) | 0 (0.0%) |
| Educational Services | 12 (27.9%) | 31 (72.1%) |
| Health Care & Social Assistance | 13 (27.7%) | 34 (72.3%) |
| Arts, Entertainment & Recreation | 0 (0.0%) | 0 (0.0%) |
| Accommodation & Food Services | 0 (0.0%) | 0 (0.0%) |
| Public Administration | 0 (0.0%) | 0 (0.0%) |
| Total | 181 (64.4%) | 100 (35.6%) |
Education in Riverton
School Enrollment in Riverton
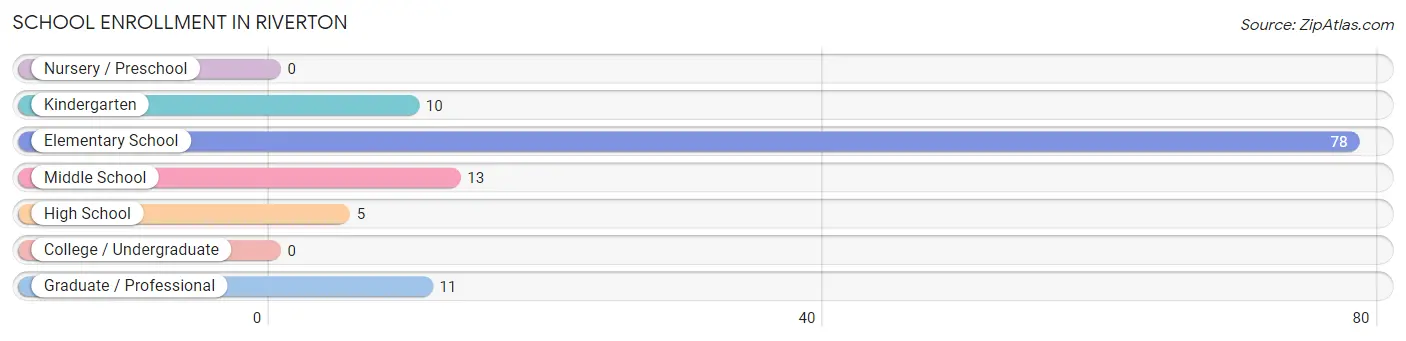
The most common levels of schooling among the 117 students in Riverton are elementary school (78 | 66.7%), middle school (13 | 11.1%), and graduate / professional (11 | 9.4%).
| School Level | # Students | % Students |
| Nursery / Preschool | 0 | 0.0% |
| Kindergarten | 10 | 8.6% |
| Elementary School | 78 | 66.7% |
| Middle School | 13 | 11.1% |
| High School | 5 | 4.3% |
| College / Undergraduate | 0 | 0.0% |
| Graduate / Professional | 11 | 9.4% |
| Total | 117 | 100.0% |
School Enrollment by Age by Funding Source in Riverton
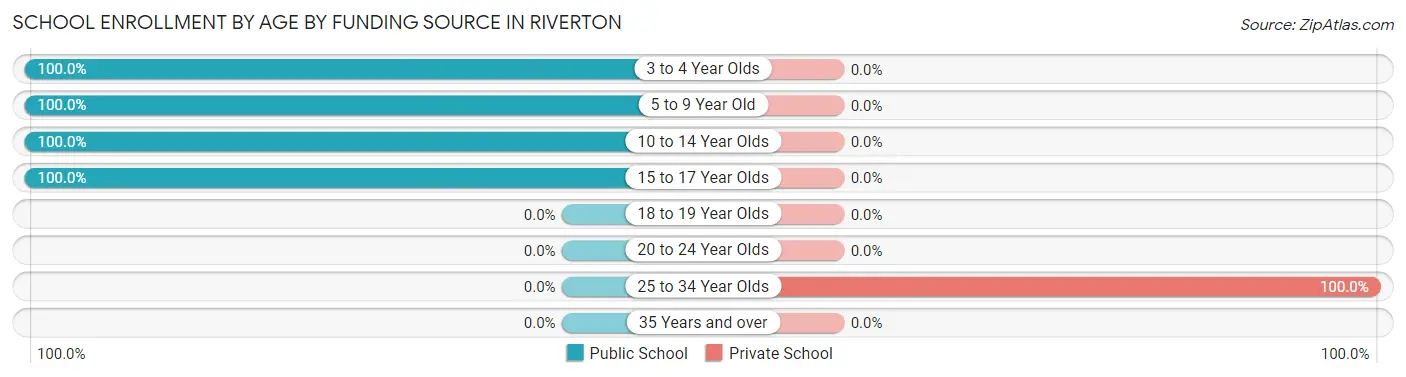
Out of a total of 117 students who are enrolled in schools in Riverton, 11 (9.4%) attend a private institution, while the remaining 106 (90.6%) are enrolled in public schools. The age group of 25 to 34 year olds has the highest likelihood of being enrolled in private schools, with 11 (100.0% in the age bracket) enrolled. Conversely, the age group of 3 to 4 year olds has the lowest likelihood of being enrolled in a private school, with 10 (100.0% in the age bracket) attending a public institution.
| Age Bracket | Public School | Private School |
| 3 to 4 Year Olds | 10 (100.0%) | 0 (0.0%) |
| 5 to 9 Year Old | 78 (100.0%) | 0 (0.0%) |
| 10 to 14 Year Olds | 13 (100.0%) | 0 (0.0%) |
| 15 to 17 Year Olds | 5 (100.0%) | 0 (0.0%) |
| 18 to 19 Year Olds | 0 (0.0%) | 0 (0.0%) |
| 20 to 24 Year Olds | 0 (0.0%) | 0 (0.0%) |
| 25 to 34 Year Olds | 0 (0.0%) | 11 (100.0%) |
| 35 Years and over | 0 (0.0%) | 0 (0.0%) |
| Total | 106 (90.6%) | 11 (9.4%) |
Educational Attainment by Field of Study in Riverton
Education (50 | 46.3%), business (47 | 43.5%), and literature & languages (11 | 10.2%) are the most common fields of study among 108 individuals in Riverton who have obtained a bachelor's degree or higher.
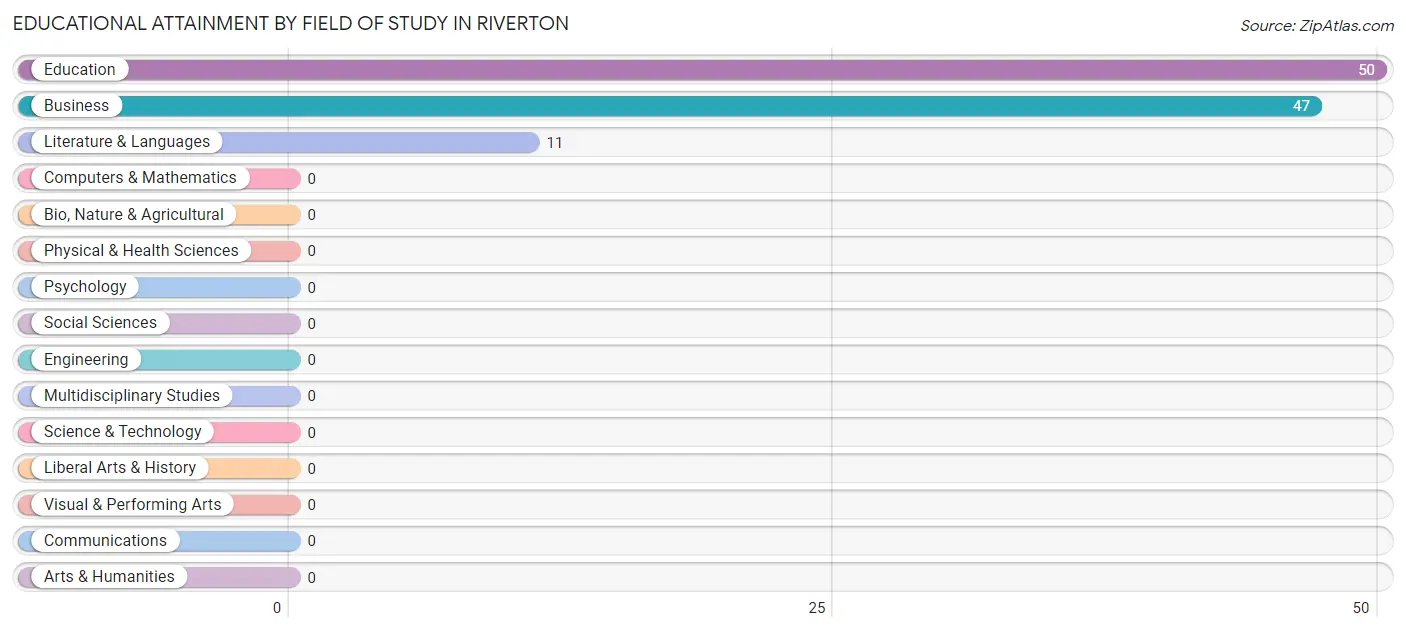
| Field of Study | # Graduates | % Graduates |
| Computers & Mathematics | 0 | 0.0% |
| Bio, Nature & Agricultural | 0 | 0.0% |
| Physical & Health Sciences | 0 | 0.0% |
| Psychology | 0 | 0.0% |
| Social Sciences | 0 | 0.0% |
| Engineering | 0 | 0.0% |
| Multidisciplinary Studies | 0 | 0.0% |
| Science & Technology | 0 | 0.0% |
| Business | 47 | 43.5% |
| Education | 50 | 46.3% |
| Literature & Languages | 11 | 10.2% |
| Liberal Arts & History | 0 | 0.0% |
| Visual & Performing Arts | 0 | 0.0% |
| Communications | 0 | 0.0% |
| Arts & Humanities | 0 | 0.0% |
| Total | 108 | 100.0% |
Transportation & Commute in Riverton
Vehicle Availability by Sex in Riverton
The most prevalent vehicle ownership categories in Riverton are males with 2 vehicles (128, accounting for 70.7%) and females with 2 vehicles (37, making up 128.0%).
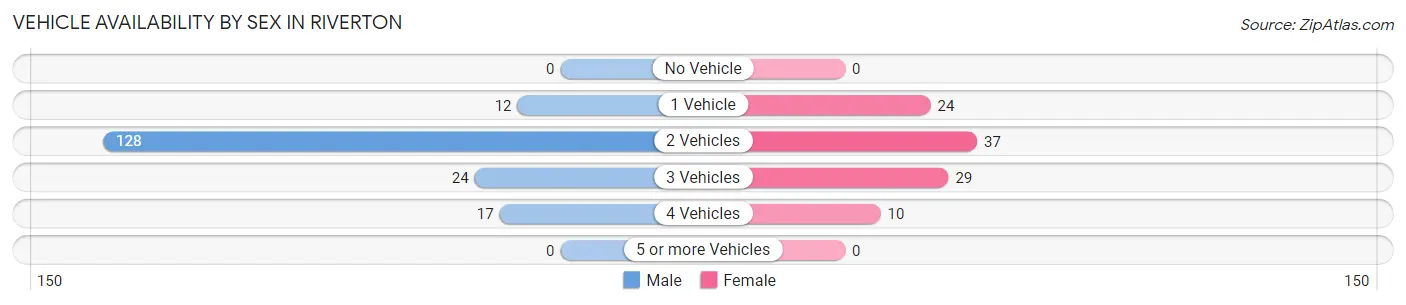
| Vehicles Available | Male | Female |
| No Vehicle | 0 (0.0%) | 0 (0.0%) |
| 1 Vehicle | 12 (6.6%) | 24 (24.0%) |
| 2 Vehicles | 128 (70.7%) | 37 (37.0%) |
| 3 Vehicles | 24 (13.3%) | 29 (29.0%) |
| 4 Vehicles | 17 (9.4%) | 10 (10.0%) |
| 5 or more Vehicles | 0 (0.0%) | 0 (0.0%) |
| Total | 181 (100.0%) | 100 (100.0%) |
Commute Time in Riverton
The most frequently occuring commute durations in Riverton are 20 to 24 minutes (85 commuters, 42.7%), 25 to 29 minutes (50 commuters, 25.1%), and 10 to 14 minutes (18 commuters, 9.0%).
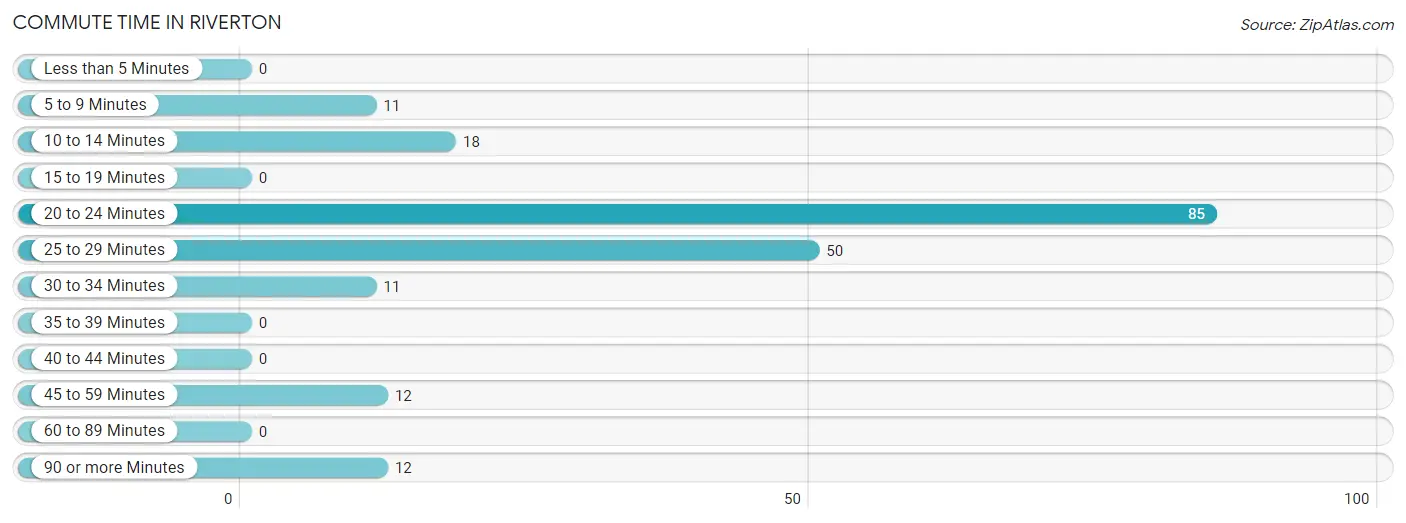
| Commute Time | # Commuters | % Commuters |
| Less than 5 Minutes | 0 | 0.0% |
| 5 to 9 Minutes | 11 | 5.5% |
| 10 to 14 Minutes | 18 | 9.0% |
| 15 to 19 Minutes | 0 | 0.0% |
| 20 to 24 Minutes | 85 | 42.7% |
| 25 to 29 Minutes | 50 | 25.1% |
| 30 to 34 Minutes | 11 | 5.5% |
| 35 to 39 Minutes | 0 | 0.0% |
| 40 to 44 Minutes | 0 | 0.0% |
| 45 to 59 Minutes | 12 | 6.0% |
| 60 to 89 Minutes | 0 | 0.0% |
| 90 or more Minutes | 12 | 6.0% |
Commute Time by Sex in Riverton
The most common commute times in Riverton are 20 to 24 minutes (35 commuters, 35.3%) for males and 20 to 24 minutes (50 commuters, 50.0%) for females.
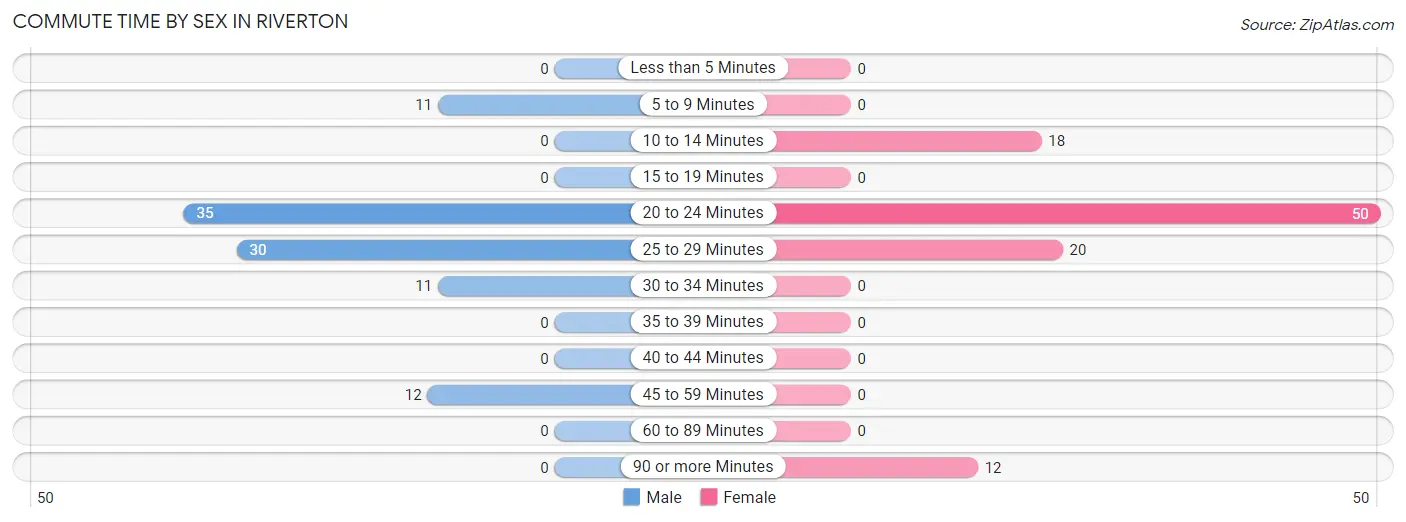
| Commute Time | Male | Female |
| Less than 5 Minutes | 0 (0.0%) | 0 (0.0%) |
| 5 to 9 Minutes | 11 (11.1%) | 0 (0.0%) |
| 10 to 14 Minutes | 0 (0.0%) | 18 (18.0%) |
| 15 to 19 Minutes | 0 (0.0%) | 0 (0.0%) |
| 20 to 24 Minutes | 35 (35.3%) | 50 (50.0%) |
| 25 to 29 Minutes | 30 (30.3%) | 20 (20.0%) |
| 30 to 34 Minutes | 11 (11.1%) | 0 (0.0%) |
| 35 to 39 Minutes | 0 (0.0%) | 0 (0.0%) |
| 40 to 44 Minutes | 0 (0.0%) | 0 (0.0%) |
| 45 to 59 Minutes | 12 (12.1%) | 0 (0.0%) |
| 60 to 89 Minutes | 0 (0.0%) | 0 (0.0%) |
| 90 or more Minutes | 0 (0.0%) | 12 (12.0%) |
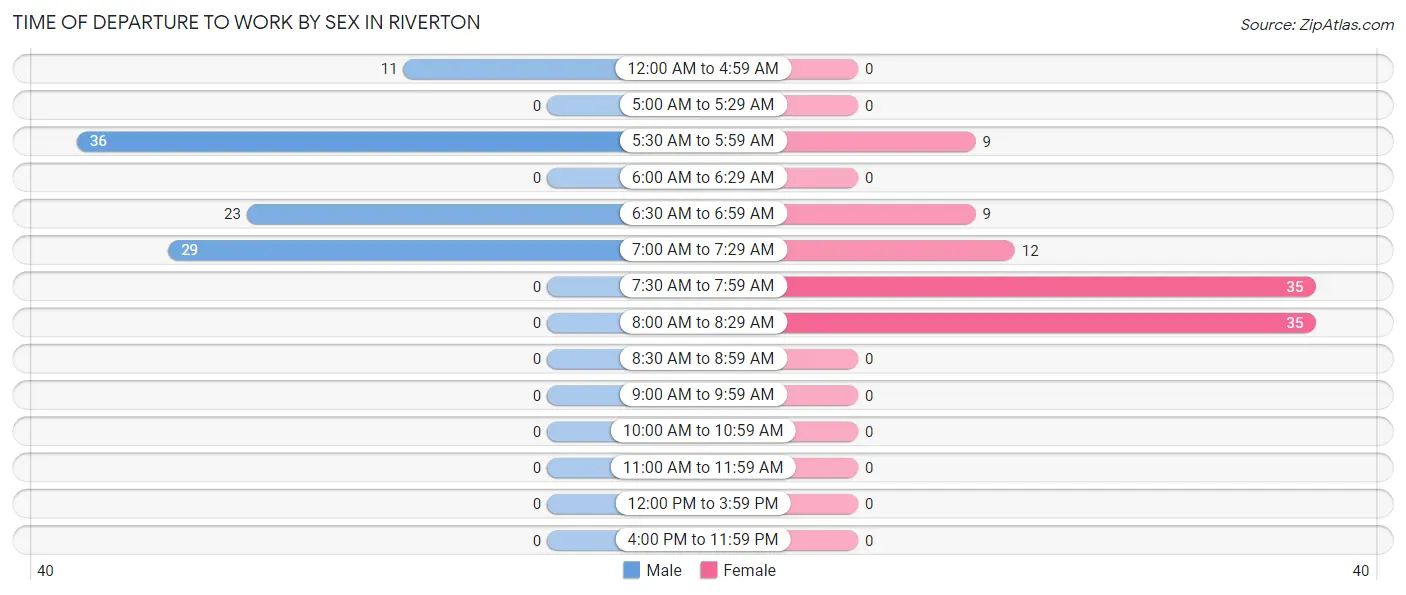
Time of Departure to Work by Sex in Riverton
The most frequent times of departure to work in Riverton are 5:30 AM to 5:59 AM (36, 36.4%) for males and 7:30 AM to 7:59 AM (35, 35.0%) for females.
| Time of Departure | Male | Female |
| 12:00 AM to 4:59 AM | 11 (11.1%) | 0 (0.0%) |
| 5:00 AM to 5:29 AM | 0 (0.0%) | 0 (0.0%) |
| 5:30 AM to 5:59 AM | 36 (36.4%) | 9 (9.0%) |
| 6:00 AM to 6:29 AM | 0 (0.0%) | 0 (0.0%) |
| 6:30 AM to 6:59 AM | 23 (23.2%) | 9 (9.0%) |
| 7:00 AM to 7:29 AM | 29 (29.3%) | 12 (12.0%) |
| 7:30 AM to 7:59 AM | 0 (0.0%) | 35 (35.0%) |
| 8:00 AM to 8:29 AM | 0 (0.0%) | 35 (35.0%) |
| 8:30 AM to 8:59 AM | 0 (0.0%) | 0 (0.0%) |
| 9:00 AM to 9:59 AM | 0 (0.0%) | 0 (0.0%) |
| 10:00 AM to 10:59 AM | 0 (0.0%) | 0 (0.0%) |
| 11:00 AM to 11:59 AM | 0 (0.0%) | 0 (0.0%) |
| 12:00 PM to 3:59 PM | 0 (0.0%) | 0 (0.0%) |
| 4:00 PM to 11:59 PM | 0 (0.0%) | 0 (0.0%) |
| Total | 99 (100.0%) | 100 (100.0%) |
Housing Occupancy in Riverton
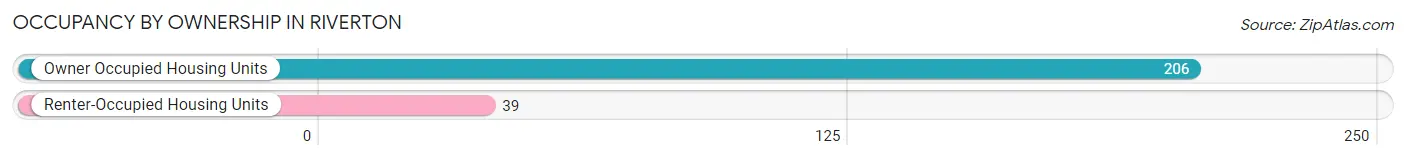
Occupancy by Ownership in Riverton
Of the total 245 dwellings in Riverton, owner-occupied units account for 206 (84.1%), while renter-occupied units make up 39 (15.9%).
| Occupancy | # Housing Units | % Housing Units |
| Owner Occupied Housing Units | 206 | 84.1% |
| Renter-Occupied Housing Units | 39 | 15.9% |
| Total Occupied Housing Units | 245 | 100.0% |
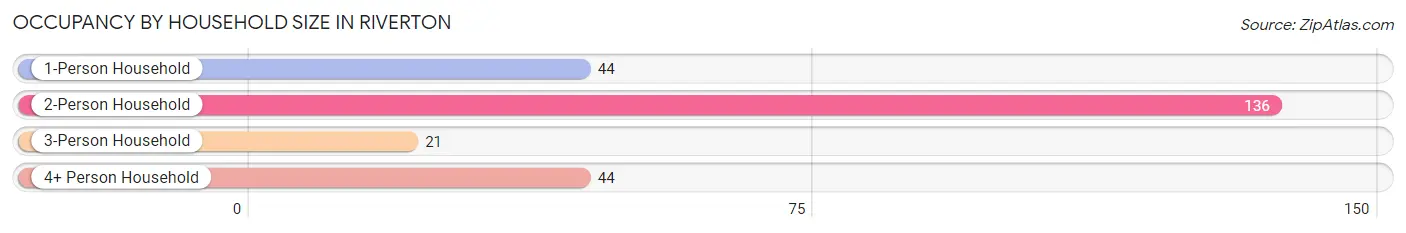
Occupancy by Household Size in Riverton
| Household Size | # Housing Units | % Housing Units |
| 1-Person Household | 44 | 18.0% |
| 2-Person Household | 136 | 55.5% |
| 3-Person Household | 21 | 8.6% |
| 4+ Person Household | 44 | 18.0% |
| Total Housing Units | 245 | 100.0% |
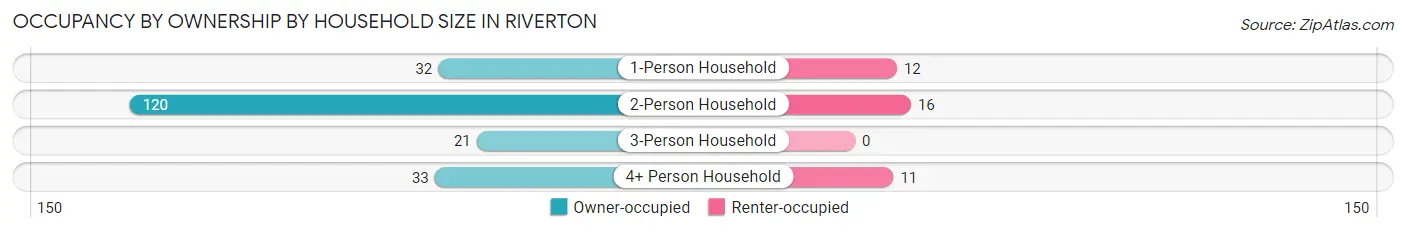
Occupancy by Ownership by Household Size in Riverton
| Household Size | Owner-occupied | Renter-occupied |
| 1-Person Household | 32 (72.7%) | 12 (27.3%) |
| 2-Person Household | 120 (88.2%) | 16 (11.8%) |
| 3-Person Household | 21 (100.0%) | 0 (0.0%) |
| 4+ Person Household | 33 (75.0%) | 11 (25.0%) |
| Total Housing Units | 206 (84.1%) | 39 (15.9%) |
Occupancy by Educational Attainment in Riverton
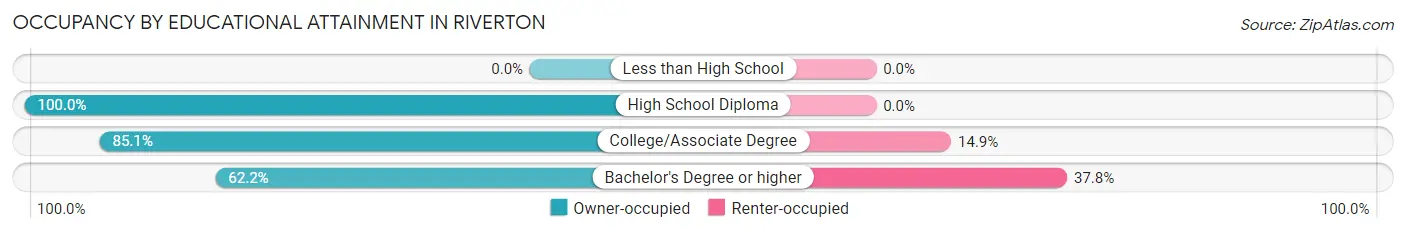
| Household Size | Owner-occupied | Renter-occupied |
| Less than High School | 0 (0.0%) | 0 (0.0%) |
| High School Diploma | 97 (100.0%) | 0 (0.0%) |
| College/Associate Degree | 63 (85.1%) | 11 (14.9%) |
| Bachelor's Degree or higher | 46 (62.2%) | 28 (37.8%) |
Occupancy by Age of Householder in Riverton
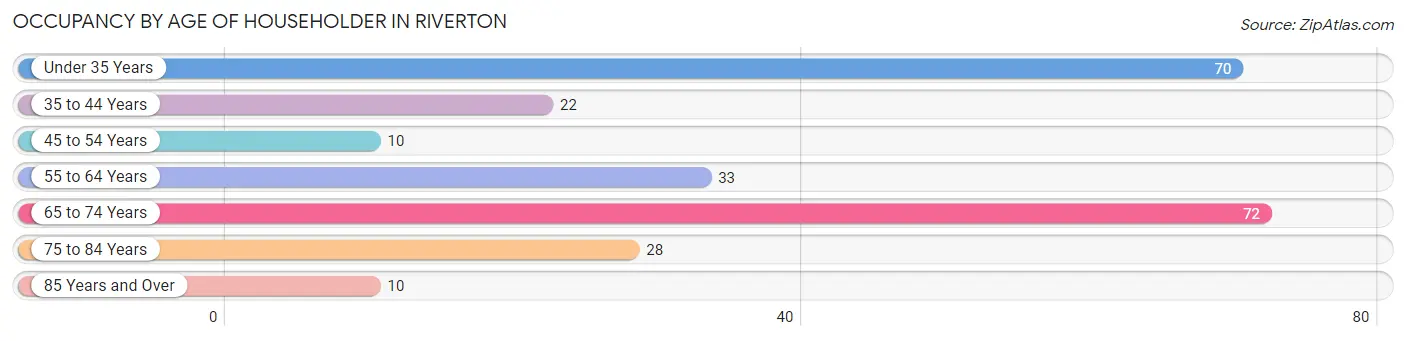
| Age Bracket | # Households | % Households |
| Under 35 Years | 70 | 28.6% |
| 35 to 44 Years | 22 | 9.0% |
| 45 to 54 Years | 10 | 4.1% |
| 55 to 64 Years | 33 | 13.5% |
| 65 to 74 Years | 72 | 29.4% |
| 75 to 84 Years | 28 | 11.4% |
| 85 Years and Over | 10 | 4.1% |
| Total | 245 | 100.0% |
Housing Finances in Riverton
Median Income by Occupancy in Riverton
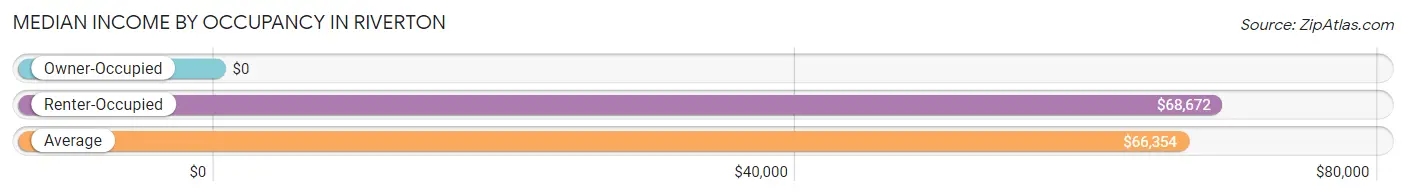
| Occupancy Type | # Households | Median Income |
| Owner-Occupied | 206 (84.1%) | $0 |
| Renter-Occupied | 39 (15.9%) | $68,672 |
| Average | 245 (100.0%) | $66,354 |
Occupancy by Householder Income Bracket in Riverton
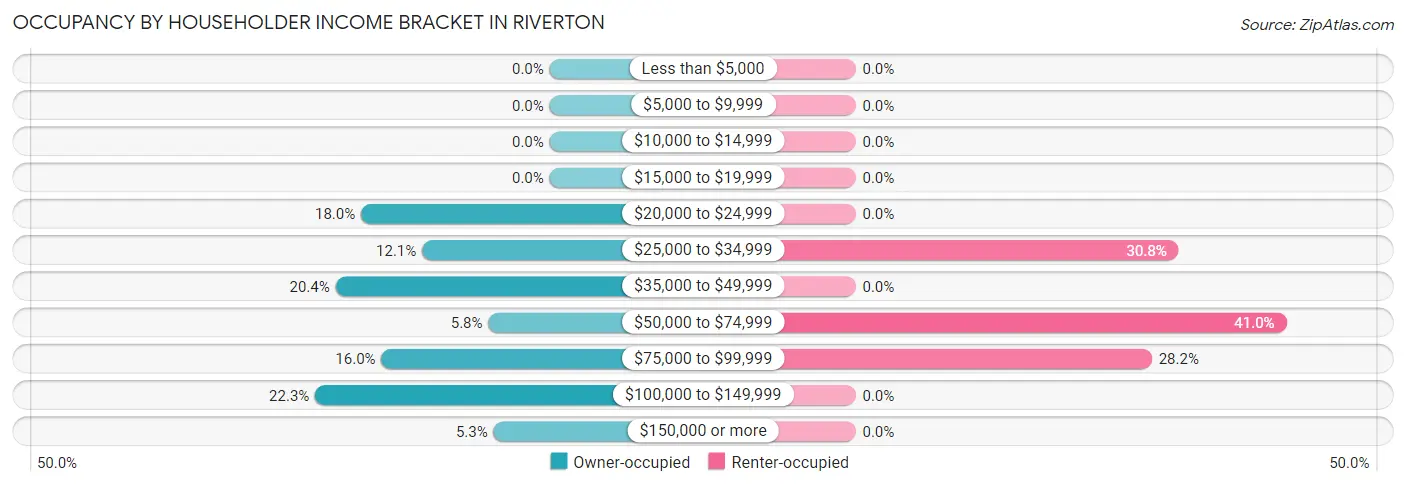
| Income Bracket | Owner-occupied | Renter-occupied |
| Less than $5,000 | 0 (0.0%) | 0 (0.0%) |
| $5,000 to $9,999 | 0 (0.0%) | 0 (0.0%) |
| $10,000 to $14,999 | 0 (0.0%) | 0 (0.0%) |
| $15,000 to $19,999 | 0 (0.0%) | 0 (0.0%) |
| $20,000 to $24,999 | 37 (18.0%) | 0 (0.0%) |
| $25,000 to $34,999 | 25 (12.1%) | 12 (30.8%) |
| $35,000 to $49,999 | 42 (20.4%) | 0 (0.0%) |
| $50,000 to $74,999 | 12 (5.8%) | 16 (41.0%) |
| $75,000 to $99,999 | 33 (16.0%) | 11 (28.2%) |
| $100,000 to $149,999 | 46 (22.3%) | 0 (0.0%) |
| $150,000 or more | 11 (5.3%) | 0 (0.0%) |
| Total | 206 (100.0%) | 39 (100.0%) |
Monthly Housing Cost Tiers in Riverton
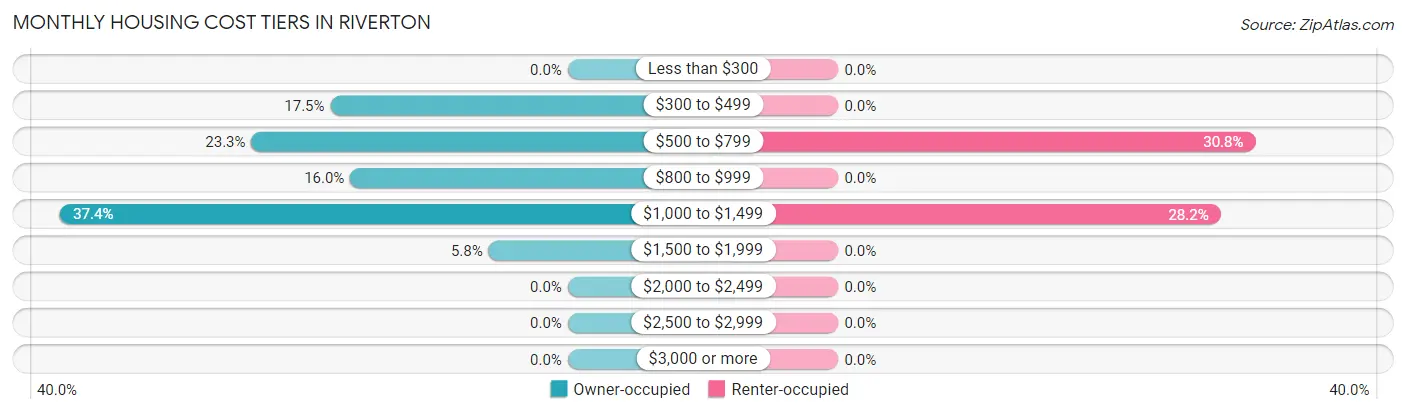
| Monthly Cost | Owner-occupied | Renter-occupied |
| Less than $300 | 0 (0.0%) | 0 (0.0%) |
| $300 to $499 | 36 (17.5%) | 0 (0.0%) |
| $500 to $799 | 48 (23.3%) | 12 (30.8%) |
| $800 to $999 | 33 (16.0%) | 0 (0.0%) |
| $1,000 to $1,499 | 77 (37.4%) | 11 (28.2%) |
| $1,500 to $1,999 | 12 (5.8%) | 0 (0.0%) |
| $2,000 to $2,499 | 0 (0.0%) | 0 (0.0%) |
| $2,500 to $2,999 | 0 (0.0%) | 0 (0.0%) |
| $3,000 or more | 0 (0.0%) | 0 (0.0%) |
| Total | 206 (100.0%) | 39 (100.0%) |
Physical Housing Characteristics in Riverton
Housing Structures in Riverton
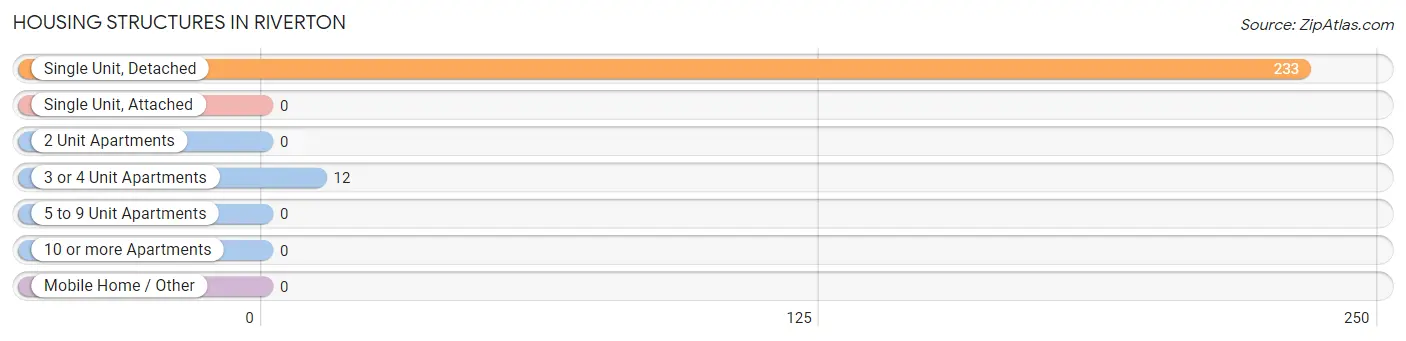
| Structure Type | # Housing Units | % Housing Units |
| Single Unit, Detached | 233 | 95.1% |
| Single Unit, Attached | 0 | 0.0% |
| 2 Unit Apartments | 0 | 0.0% |
| 3 or 4 Unit Apartments | 12 | 4.9% |
| 5 to 9 Unit Apartments | 0 | 0.0% |
| 10 or more Apartments | 0 | 0.0% |
| Mobile Home / Other | 0 | 0.0% |
| Total | 245 | 100.0% |
Housing Structures by Occupancy in Riverton
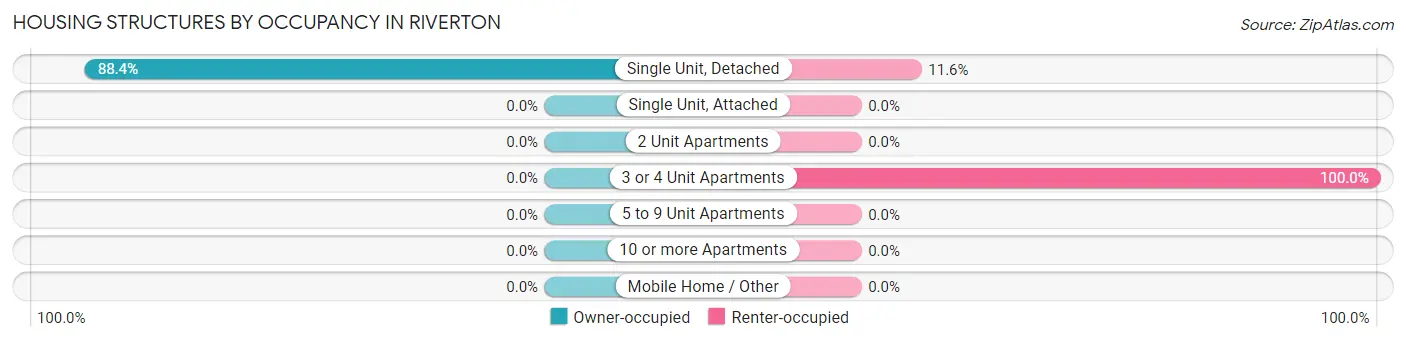
| Structure Type | Owner-occupied | Renter-occupied |
| Single Unit, Detached | 206 (88.4%) | 27 (11.6%) |
| Single Unit, Attached | 0 (0.0%) | 0 (0.0%) |
| 2 Unit Apartments | 0 (0.0%) | 0 (0.0%) |
| 3 or 4 Unit Apartments | 0 (0.0%) | 12 (100.0%) |
| 5 to 9 Unit Apartments | 0 (0.0%) | 0 (0.0%) |
| 10 or more Apartments | 0 (0.0%) | 0 (0.0%) |
| Mobile Home / Other | 0 (0.0%) | 0 (0.0%) |
| Total | 206 (84.1%) | 39 (15.9%) |
Housing Structures by Number of Rooms in Riverton
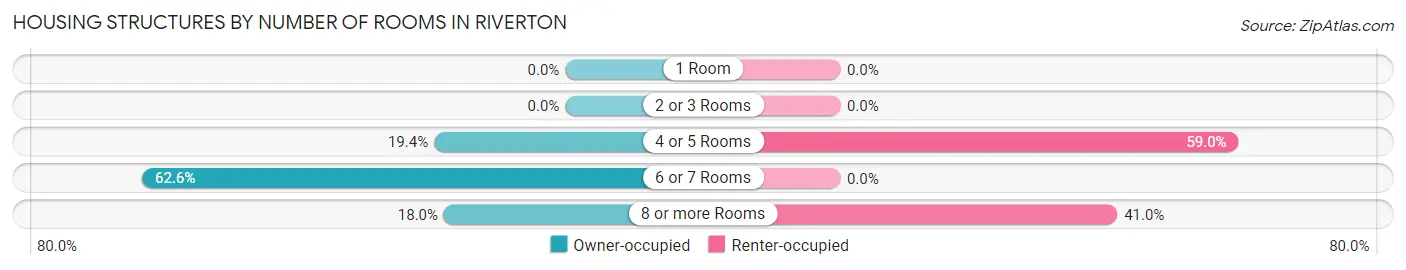
| Number of Rooms | Owner-occupied | Renter-occupied |
| 1 Room | 0 (0.0%) | 0 (0.0%) |
| 2 or 3 Rooms | 0 (0.0%) | 0 (0.0%) |
| 4 or 5 Rooms | 40 (19.4%) | 23 (59.0%) |
| 6 or 7 Rooms | 129 (62.6%) | 0 (0.0%) |
| 8 or more Rooms | 37 (18.0%) | 16 (41.0%) |
| Total | 206 (100.0%) | 39 (100.0%) |
Housing Structure by Heating Type in Riverton
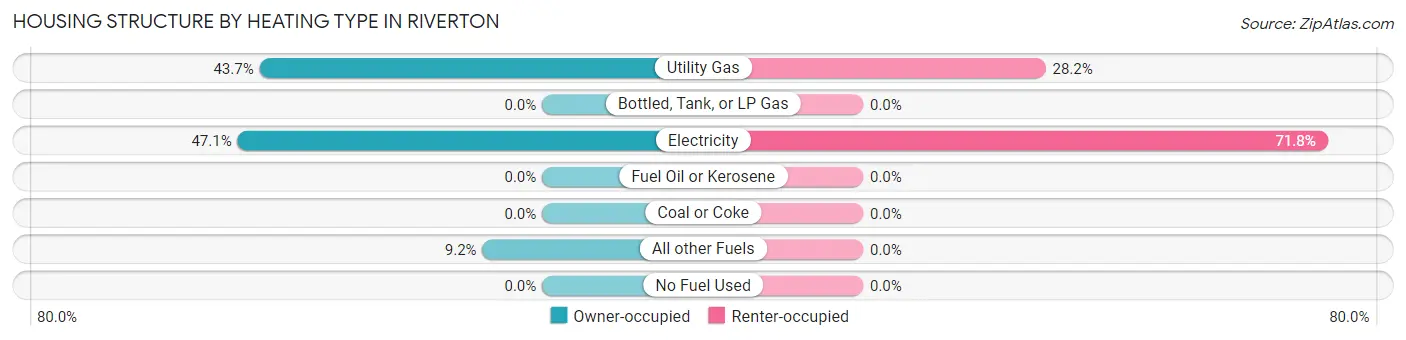
| Heating Type | Owner-occupied | Renter-occupied |
| Utility Gas | 90 (43.7%) | 11 (28.2%) |
| Bottled, Tank, or LP Gas | 0 (0.0%) | 0 (0.0%) |
| Electricity | 97 (47.1%) | 28 (71.8%) |
| Fuel Oil or Kerosene | 0 (0.0%) | 0 (0.0%) |
| Coal or Coke | 0 (0.0%) | 0 (0.0%) |
| All other Fuels | 19 (9.2%) | 0 (0.0%) |
| No Fuel Used | 0 (0.0%) | 0 (0.0%) |
| Total | 206 (100.0%) | 39 (100.0%) |
Household Vehicle Usage in Riverton
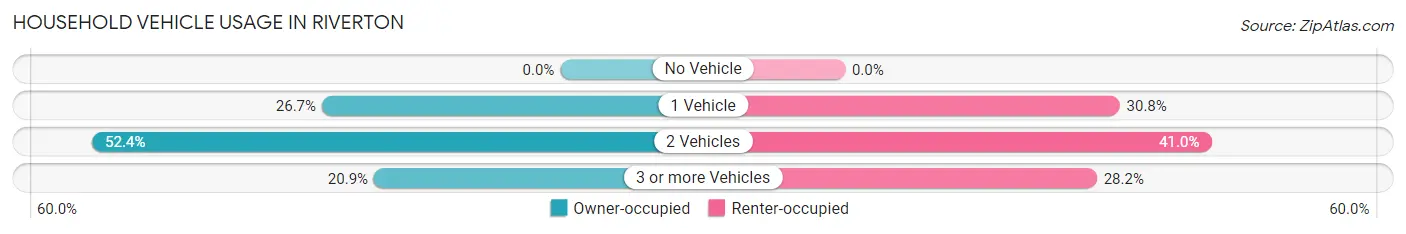
| Vehicles per Household | Owner-occupied | Renter-occupied |
| No Vehicle | 0 (0.0%) | 0 (0.0%) |
| 1 Vehicle | 55 (26.7%) | 12 (30.8%) |
| 2 Vehicles | 108 (52.4%) | 16 (41.0%) |
| 3 or more Vehicles | 43 (20.9%) | 11 (28.2%) |
| Total | 206 (100.0%) | 39 (100.0%) |
Real Estate & Mortgages in Riverton
Real Estate and Mortgage Overview in Riverton
| Characteristic | Without Mortgage | With Mortgage |
| Housing Units | 84 | 122 |
| Median Property Value | $110,700 | $121,400 |
| Median Household Income | $33,158 | $11 |
| Monthly Housing Costs | $516 | $0 |
| Real Estate Taxes | $1,256 | $0 |
Property Value by Mortgage Status in Riverton
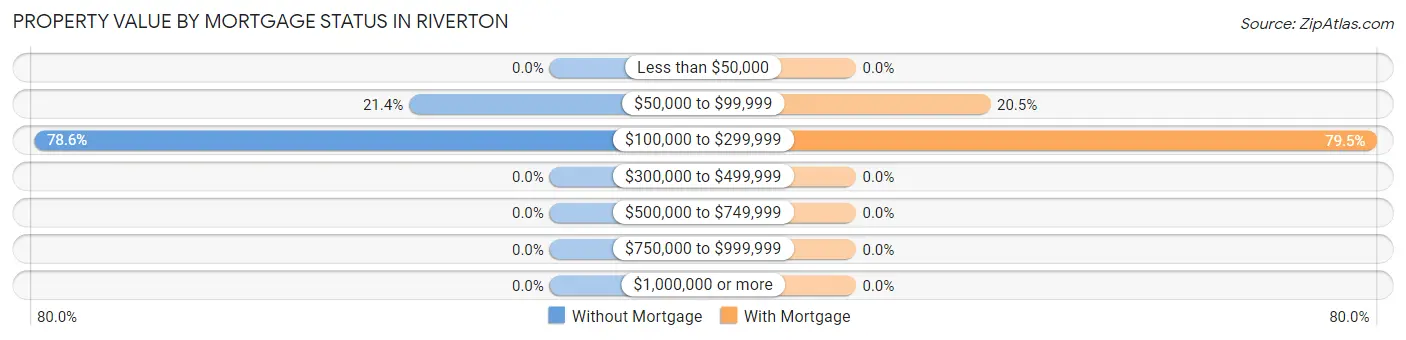
| Property Value | Without Mortgage | With Mortgage |
| Less than $50,000 | 0 (0.0%) | 0 (0.0%) |
| $50,000 to $99,999 | 18 (21.4%) | 25 (20.5%) |
| $100,000 to $299,999 | 66 (78.6%) | 97 (79.5%) |
| $300,000 to $499,999 | 0 (0.0%) | 0 (0.0%) |
| $500,000 to $749,999 | 0 (0.0%) | 0 (0.0%) |
| $750,000 to $999,999 | 0 (0.0%) | 0 (0.0%) |
| $1,000,000 or more | 0 (0.0%) | 0 (0.0%) |
| Total | 84 (100.0%) | 122 (100.0%) |
Household Income by Mortgage Status in Riverton
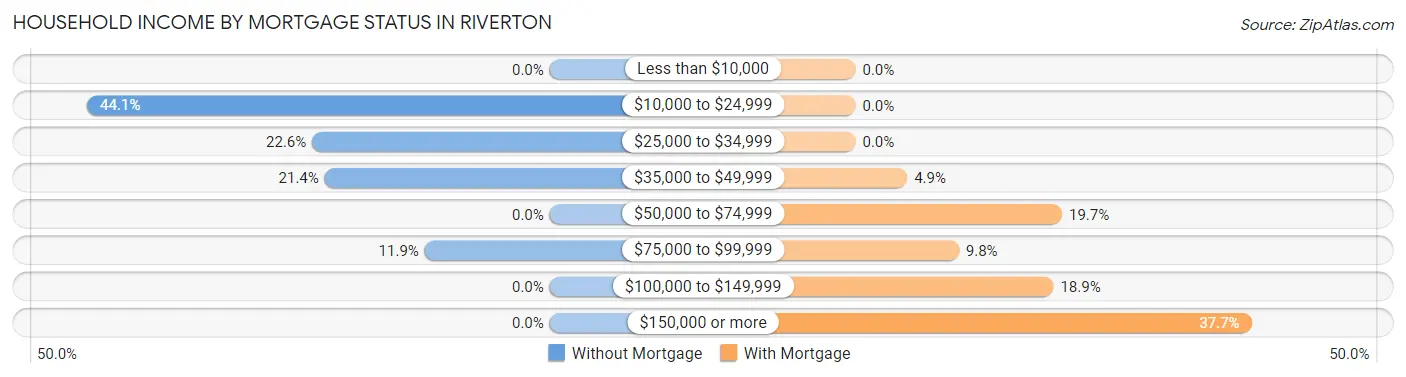
| Household Income | Without Mortgage | With Mortgage |
| Less than $10,000 | 0 (0.0%) | 0 (0.0%) |
| $10,000 to $24,999 | 37 (44.1%) | 0 (0.0%) |
| $25,000 to $34,999 | 19 (22.6%) | 0 (0.0%) |
| $35,000 to $49,999 | 18 (21.4%) | 6 (4.9%) |
| $50,000 to $74,999 | 0 (0.0%) | 24 (19.7%) |
| $75,000 to $99,999 | 10 (11.9%) | 12 (9.8%) |
| $100,000 to $149,999 | 0 (0.0%) | 23 (18.9%) |
| $150,000 or more | 0 (0.0%) | 46 (37.7%) |
| Total | 84 (100.0%) | 122 (100.0%) |
Property Value to Household Income Ratio in Riverton
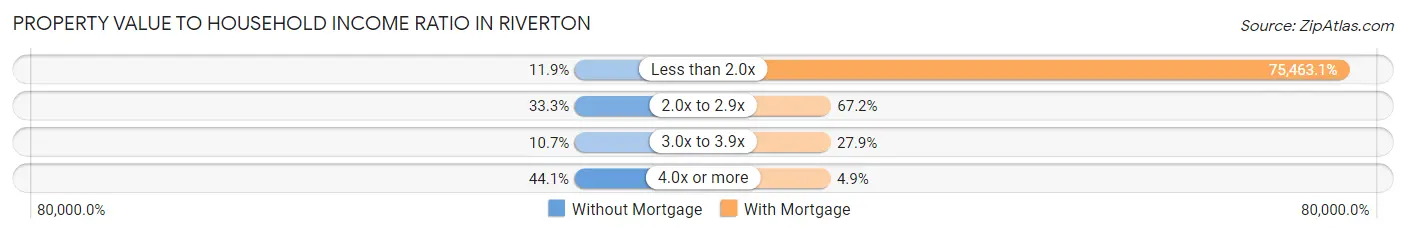
| Value-to-Income Ratio | Without Mortgage | With Mortgage |
| Less than 2.0x | 10 (11.9%) | 92,065 (75,463.1%) |
| 2.0x to 2.9x | 28 (33.3%) | 82 (67.2%) |
| 3.0x to 3.9x | 9 (10.7%) | 34 (27.9%) |
| 4.0x or more | 37 (44.1%) | 6 (4.9%) |
| Total | 84 (100.0%) | 122 (100.0%) |
Real Estate Taxes by Mortgage Status in Riverton
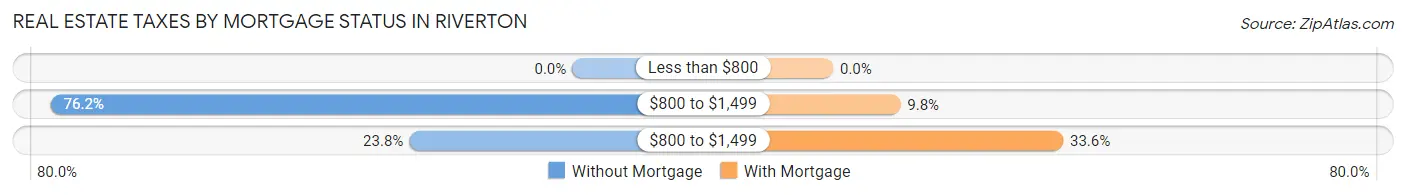
| Property Taxes | Without Mortgage | With Mortgage |
| Less than $800 | 0 (0.0%) | 0 (0.0%) |
| $800 to $1,499 | 64 (76.2%) | 12 (9.8%) |
| $800 to $1,499 | 20 (23.8%) | 41 (33.6%) |
| Total | 84 (100.0%) | 122 (100.0%) |
Health & Disability in Riverton
Health Insurance Coverage by Age in Riverton
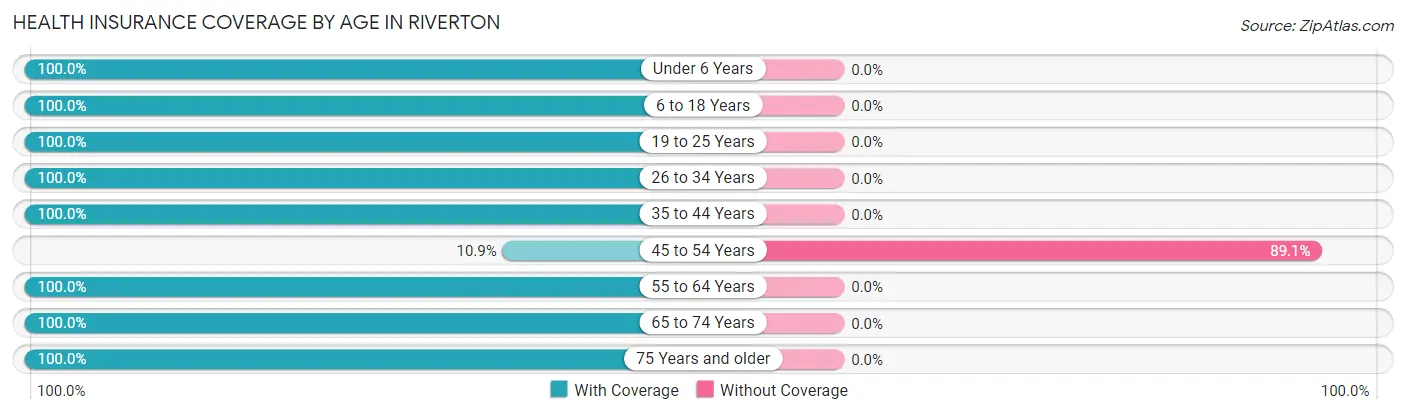
| Age Bracket | With Coverage | Without Coverage |
| Under 6 Years | 112 (100.0%) | 0 (0.0%) |
| 6 to 18 Years | 96 (100.0%) | 0 (0.0%) |
| 19 to 25 Years | 9 (100.0%) | 0 (0.0%) |
| 26 to 34 Years | 93 (100.0%) | 0 (0.0%) |
| 35 to 44 Years | 63 (100.0%) | 0 (0.0%) |
| 45 to 54 Years | 10 (10.9%) | 82 (89.1%) |
| 55 to 64 Years | 59 (100.0%) | 0 (0.0%) |
| 65 to 74 Years | 149 (100.0%) | 0 (0.0%) |
| 75 Years and older | 56 (100.0%) | 0 (0.0%) |
| Total | 647 (88.7%) | 82 (11.3%) |
Health Insurance Coverage by Citizenship Status in Riverton
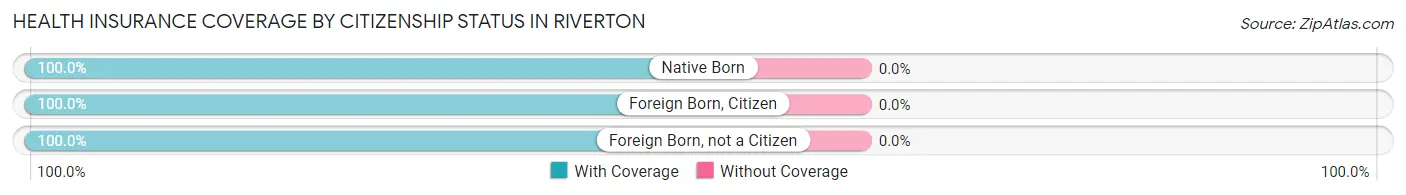
| Citizenship Status | With Coverage | Without Coverage |
| Native Born | 112 (100.0%) | 0 (0.0%) |
| Foreign Born, Citizen | 96 (100.0%) | 0 (0.0%) |
| Foreign Born, not a Citizen | 9 (100.0%) | 0 (0.0%) |
Health Insurance Coverage by Household Income in Riverton
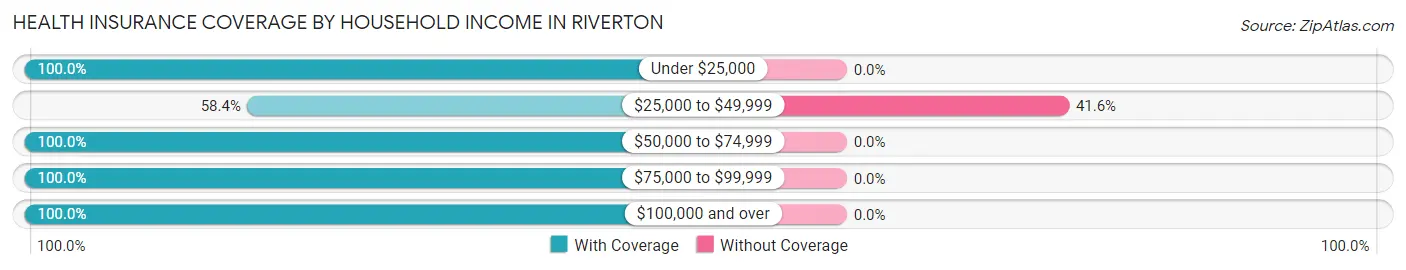
| Household Income | With Coverage | Without Coverage |
| Under $25,000 | 64 (100.0%) | 0 (0.0%) |
| $25,000 to $49,999 | 115 (58.4%) | 82 (41.6%) |
| $50,000 to $74,999 | 57 (100.0%) | 0 (0.0%) |
| $75,000 to $99,999 | 115 (100.0%) | 0 (0.0%) |
| $100,000 and over | 296 (100.0%) | 0 (0.0%) |
Public vs Private Health Insurance Coverage by Age in Riverton
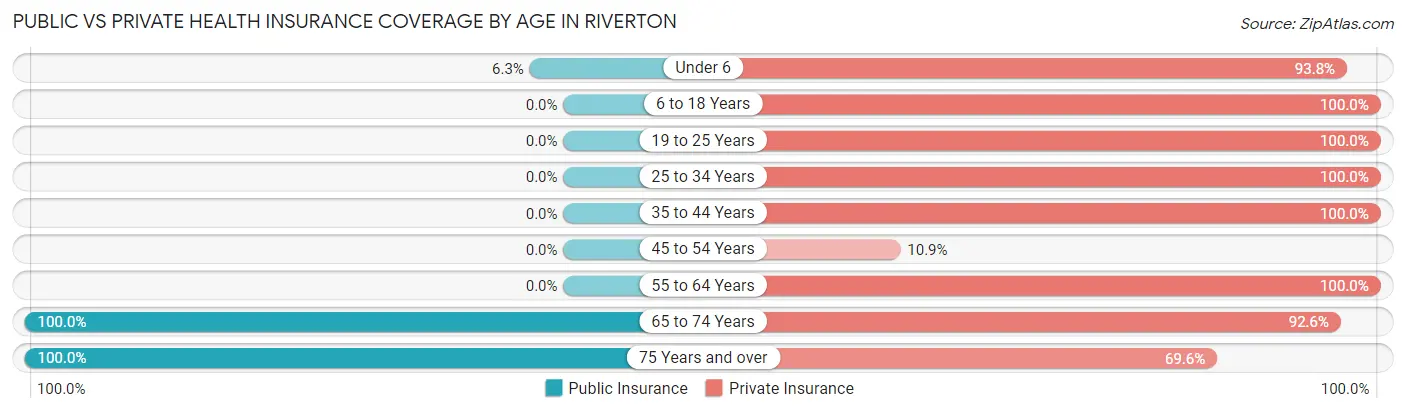
| Age Bracket | Public Insurance | Private Insurance |
| Under 6 | 7 (6.2%) | 105 (93.8%) |
| 6 to 18 Years | 0 (0.0%) | 96 (100.0%) |
| 19 to 25 Years | 0 (0.0%) | 9 (100.0%) |
| 25 to 34 Years | 0 (0.0%) | 93 (100.0%) |
| 35 to 44 Years | 0 (0.0%) | 63 (100.0%) |
| 45 to 54 Years | 0 (0.0%) | 10 (10.9%) |
| 55 to 64 Years | 0 (0.0%) | 59 (100.0%) |
| 65 to 74 Years | 149 (100.0%) | 138 (92.6%) |
| 75 Years and over | 56 (100.0%) | 39 (69.6%) |
| Total | 212 (29.1%) | 612 (84.0%) |
Disability Status by Sex by Age in Riverton
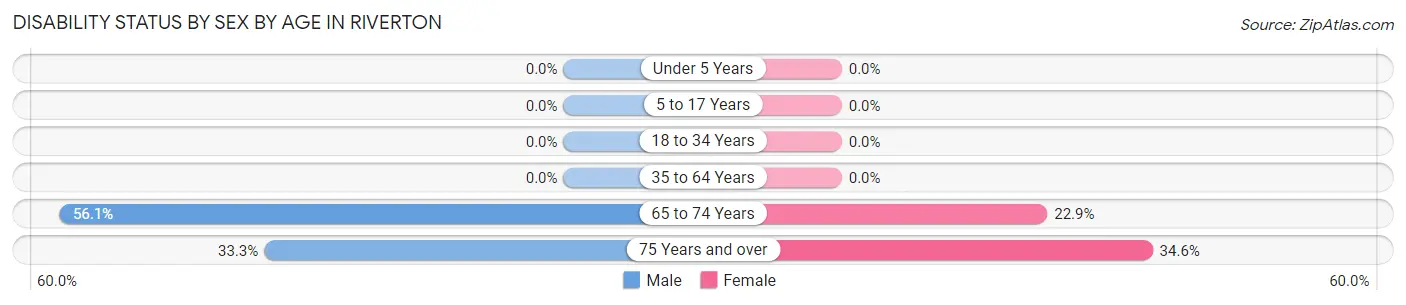
| Age Bracket | Male | Female |
| Under 5 Years | 0 (0.0%) | 0 (0.0%) |
| 5 to 17 Years | 0 (0.0%) | 0 (0.0%) |
| 18 to 34 Years | 0 (0.0%) | 0 (0.0%) |
| 35 to 64 Years | 0 (0.0%) | 0 (0.0%) |
| 65 to 74 Years | 37 (56.1%) | 19 (22.9%) |
| 75 Years and over | 10 (33.3%) | 9 (34.6%) |
Disability Class by Sex by Age in Riverton
Disability Class: Hearing Difficulty
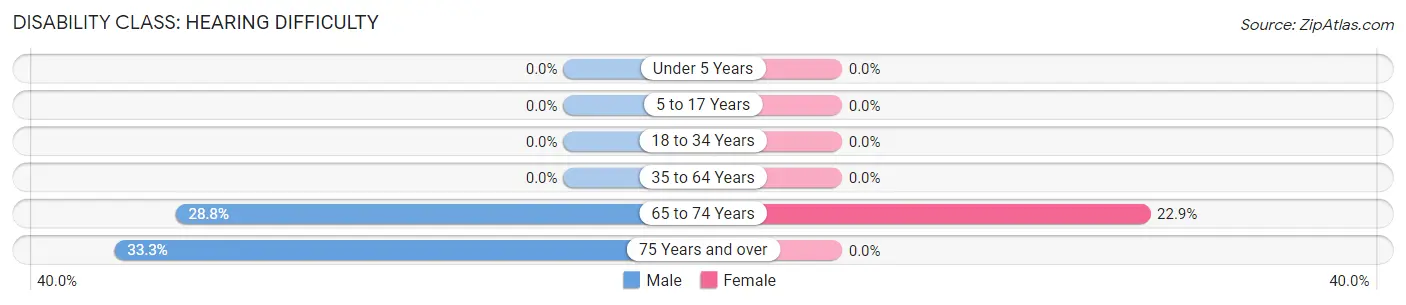
| Age Bracket | Male | Female |
| Under 5 Years | 0 (0.0%) | 0 (0.0%) |
| 5 to 17 Years | 0 (0.0%) | 0 (0.0%) |
| 18 to 34 Years | 0 (0.0%) | 0 (0.0%) |
| 35 to 64 Years | 0 (0.0%) | 0 (0.0%) |
| 65 to 74 Years | 19 (28.8%) | 19 (22.9%) |
| 75 Years and over | 10 (33.3%) | 0 (0.0%) |
Disability Class: Vision Difficulty
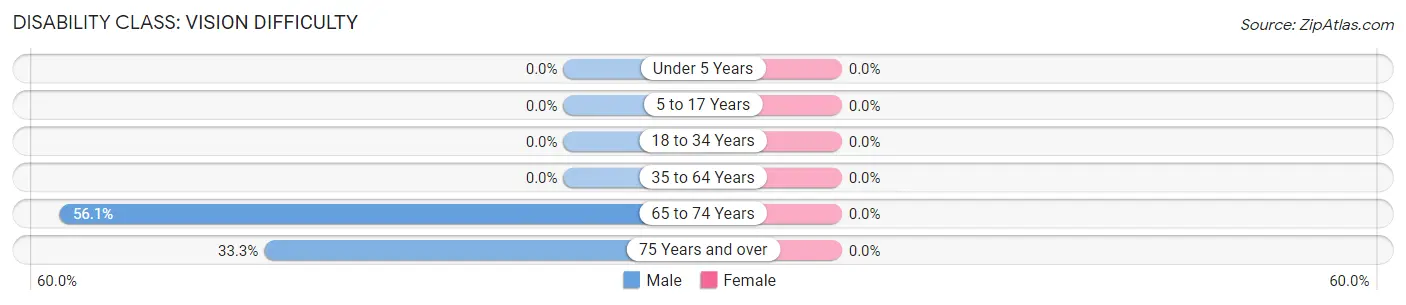
| Age Bracket | Male | Female |
| Under 5 Years | 0 (0.0%) | 0 (0.0%) |
| 5 to 17 Years | 0 (0.0%) | 0 (0.0%) |
| 18 to 34 Years | 0 (0.0%) | 0 (0.0%) |
| 35 to 64 Years | 0 (0.0%) | 0 (0.0%) |
| 65 to 74 Years | 37 (56.1%) | 0 (0.0%) |
| 75 Years and over | 10 (33.3%) | 0 (0.0%) |
Disability Class: Cognitive Difficulty
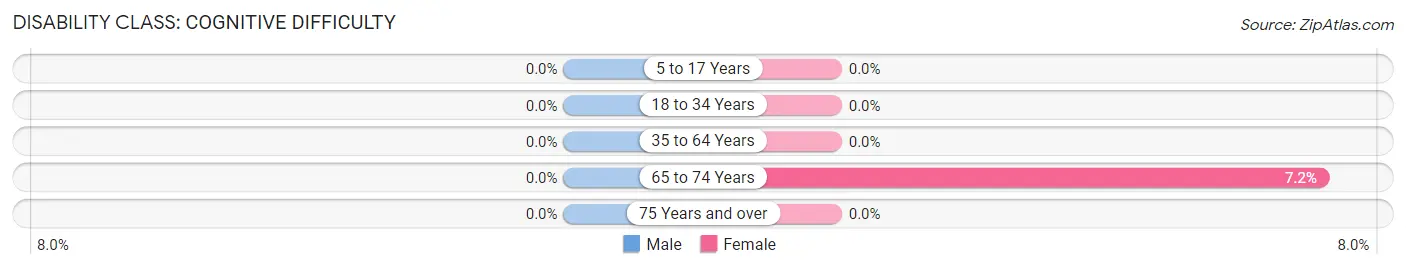
| Age Bracket | Male | Female |
| 5 to 17 Years | 0 (0.0%) | 0 (0.0%) |
| 18 to 34 Years | 0 (0.0%) | 0 (0.0%) |
| 35 to 64 Years | 0 (0.0%) | 0 (0.0%) |
| 65 to 74 Years | 0 (0.0%) | 6 (7.2%) |
| 75 Years and over | 0 (0.0%) | 0 (0.0%) |
Disability Class: Ambulatory Difficulty
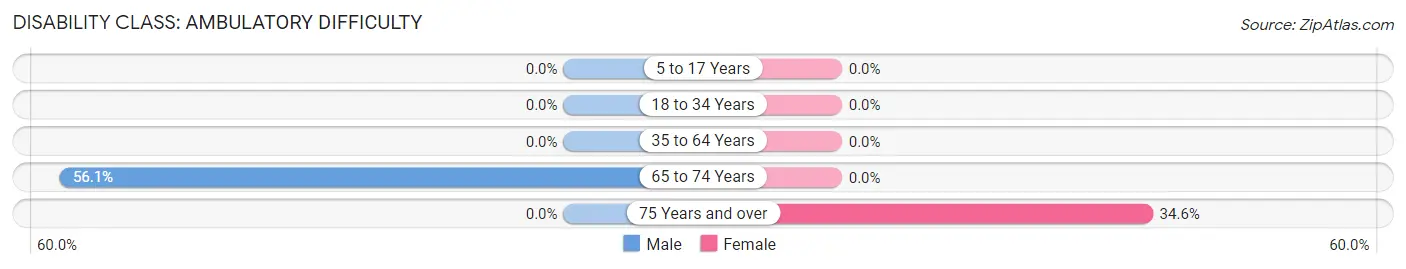
| Age Bracket | Male | Female |
| 5 to 17 Years | 0 (0.0%) | 0 (0.0%) |
| 18 to 34 Years | 0 (0.0%) | 0 (0.0%) |
| 35 to 64 Years | 0 (0.0%) | 0 (0.0%) |
| 65 to 74 Years | 37 (56.1%) | 0 (0.0%) |
| 75 Years and over | 0 (0.0%) | 9 (34.6%) |
Disability Class: Self-Care Difficulty
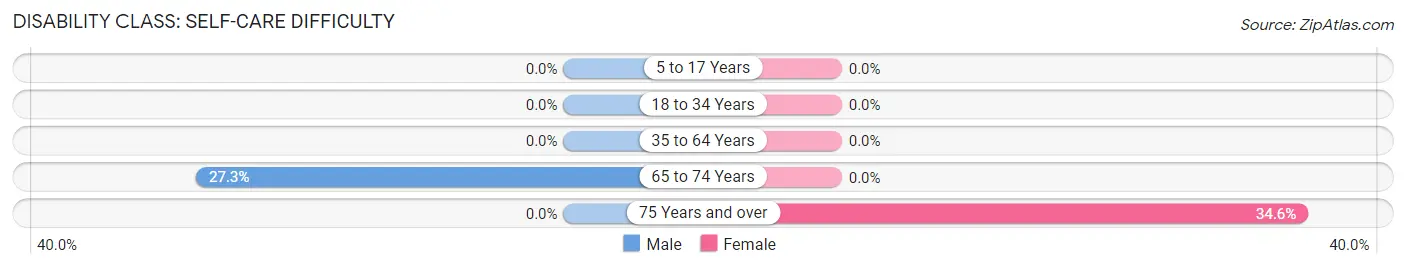
| Age Bracket | Male | Female |
| 5 to 17 Years | 0 (0.0%) | 0 (0.0%) |
| 18 to 34 Years | 0 (0.0%) | 0 (0.0%) |
| 35 to 64 Years | 0 (0.0%) | 0 (0.0%) |
| 65 to 74 Years | 18 (27.3%) | 0 (0.0%) |
| 75 Years and over | 0 (0.0%) | 9 (34.6%) |
Technology Access in Riverton
Computing Device Access in Riverton
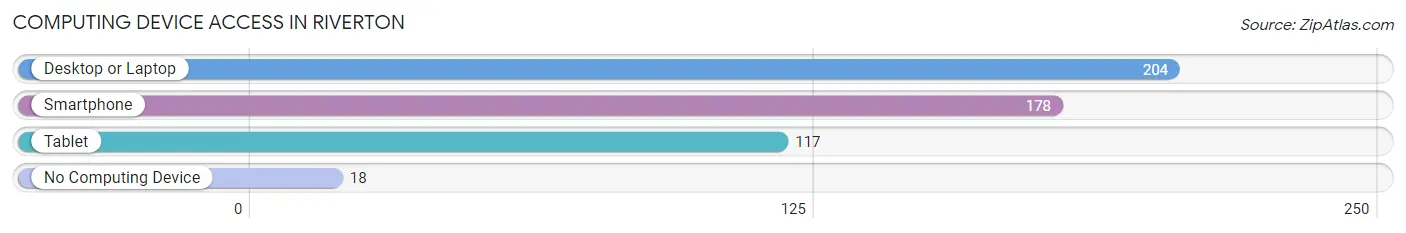
| Device Type | # Households | % Households |
| Desktop or Laptop | 204 | 83.3% |
| Smartphone | 178 | 72.7% |
| Tablet | 117 | 47.8% |
| No Computing Device | 18 | 7.3% |
| Total | 245 | 100.0% |
Internet Access in Riverton
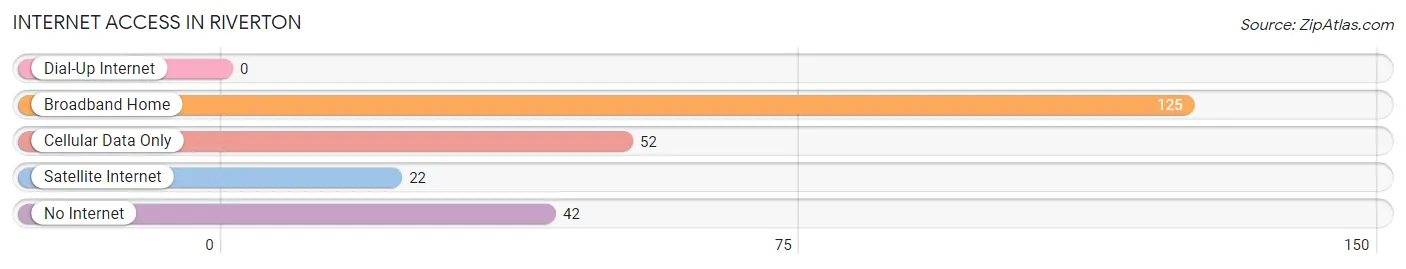
| Internet Type | # Households | % Households |
| Dial-Up Internet | 0 | 0.0% |
| Broadband Home | 125 | 51.0% |
| Cellular Data Only | 52 | 21.2% |
| Satellite Internet | 22 | 9.0% |
| No Internet | 42 | 17.1% |
| Total | 245 | 100.0% |
Riverton Summary
Riverton, Kansas is a small town located in the southeastern corner of the state, in Cherokee County. It is situated on the banks of the Spring River, and is surrounded by rolling hills and farmland. The town was founded in 1871, and has a population of approximately 1,000 people.
Geography
Riverton is located in the southeastern corner of Kansas, in Cherokee County. It is situated on the banks of the Spring River, and is surrounded by rolling hills and farmland. The town is located at an elevation of 890 feet above sea level. The climate is characterized by hot, humid summers and cold, dry winters. The average annual temperature is around 54 degrees Fahrenheit.
The town is located near the intersection of US Highway 400 and US Highway 166. It is approximately 30 miles from the nearest major city, Joplin, Missouri.
Economy
The economy of Riverton is largely based on agriculture. The town is home to several farms, which produce a variety of crops, including corn, soybeans, wheat, and hay. The town also has a few small businesses, including a grocery store, a hardware store, and a few restaurants.
Demographics
As of the 2010 census, the population of Riverton was 1,000 people. The racial makeup of the town was 97.2% White, 0.7% African American, 0.3% Native American, 0.2% Asian, 0.1% Pacific Islander, and 1.5% from other races. The median household income was $37,500, and the median family income was $45,000.
The town is served by the Riverton Unified School District, which includes an elementary school, a middle school, and a high school. The town also has a public library, a post office, and a few churches.
History
Riverton was founded in 1871 by a group of settlers from Missouri. The town was originally called “Spring River”, but the name was changed to Riverton in 1873. The town was incorporated in 1876, and the first post office was established in 1877.
In the late 19th century, Riverton was a thriving agricultural community. The town was home to several grain elevators, a flour mill, and a creamery. The town also had a few stores, a hotel, and a blacksmith shop.
In the early 20th century, the town began to decline. The Great Depression hit the town hard, and many of the businesses closed. The town’s population decreased, and the economy stagnated.
In the late 20th century, the town began to experience a resurgence. The economy began to improve, and the population began to grow. The town is now home to several small businesses, and the population is slowly increasing.
Riverton is a small town with a rich history and a bright future. The town is home to a diverse population, and the economy is slowly improving. The town is a great place to live, work, and raise a family.
Common Questions
What is Per Capita Income in Riverton?
Per Capita income in Riverton is $25,669.
What is the Median Family Income in Riverton?
Median Family Income in Riverton is $85,114.
What is the Median Household income in Riverton?
Median Household Income in Riverton is $66,354.
What is Inequality or Gini Index in Riverton?
Inequality or Gini Index in Riverton is 0.32.
What is the Total Population of Riverton?
Total Population of Riverton is 729.
What is the Total Male Population of Riverton?
Total Male Population of Riverton is 335.
What is the Total Female Population of Riverton?
Total Female Population of Riverton is 394.
What is the Ratio of Males per 100 Females in Riverton?
There are 85.03 Males per 100 Females in Riverton.
What is the Ratio of Females per 100 Males in Riverton?
There are 117.61 Females per 100 Males in Riverton.
What is the Median Population Age in Riverton?
Median Population Age in Riverton is 43.3 Years.
What is the Average Family Size in Riverton
Average Family Size in Riverton is 3.4 People.
What is the Average Household Size in Riverton
Average Household Size in Riverton is 3.0 People.
How Large is the Labor Force in Riverton?
There are 281 People in the Labor Forcein in Riverton.
What is the Percentage of People in the Labor Force in Riverton?
53.9% of People are in the Labor Force in Riverton.