Protection, KS Map & Demographics
Protection Map
Protection Overview
$31,569
PER CAPITA INCOME
$86,250
AVG FAMILY INCOME
$60,833
AVG HOUSEHOLD INCOME
56.0%
WAGE / INCOME GAP [ % ]
44.0¢/ $1
WAGE / INCOME GAP [ $ ]
0.40
INEQUALITY / GINI INDEX
529
TOTAL POPULATION
279
MALE POPULATION
250
FEMALE POPULATION
111.60
MALES / 100 FEMALES
89.61
FEMALES / 100 MALES
45.1
MEDIAN AGE
2.8
AVG FAMILY SIZE
2.1
AVG HOUSEHOLD SIZE
288
LABOR FORCE [ PEOPLE ]
64.7%
PERCENT IN LABOR FORCE
0.7%
UNEMPLOYMENT RATE
Protection Zip Codes
Protection Area Codes
Income in Protection
Income Overview in Protection
Per Capita Income in Protection is $31,569, while median incomes of families and households are $86,250 and $60,833 respectively.
| Characteristic | Number | Measure |
| Per Capita Income | 529 | $31,569 |
| Median Family Income | 134 | $86,250 |
| Mean Family Income | 134 | $96,814 |
| Median Household Income | 234 | $60,833 |
| Mean Household Income | 234 | $70,652 |
| Income Deficit | 134 | $0 |
| Wage / Income Gap (%) | 529 | 56.02% |
| Wage / Income Gap ($) | 529 | 43.98¢ per $1 |
| Gini / Inequality Index | 529 | 0.40 |
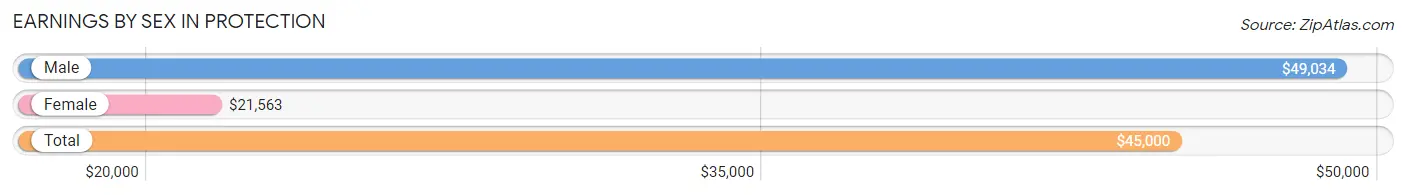
Earnings by Sex in Protection
Average Earnings in Protection are $45,000, $49,034 for men and $21,563 for women, a difference of 56.0%.
| Sex | Number | Average Earnings |
| Male | 167 (53.5%) | $49,034 |
| Female | 145 (46.5%) | $21,563 |
| Total | 312 (100.0%) | $45,000 |
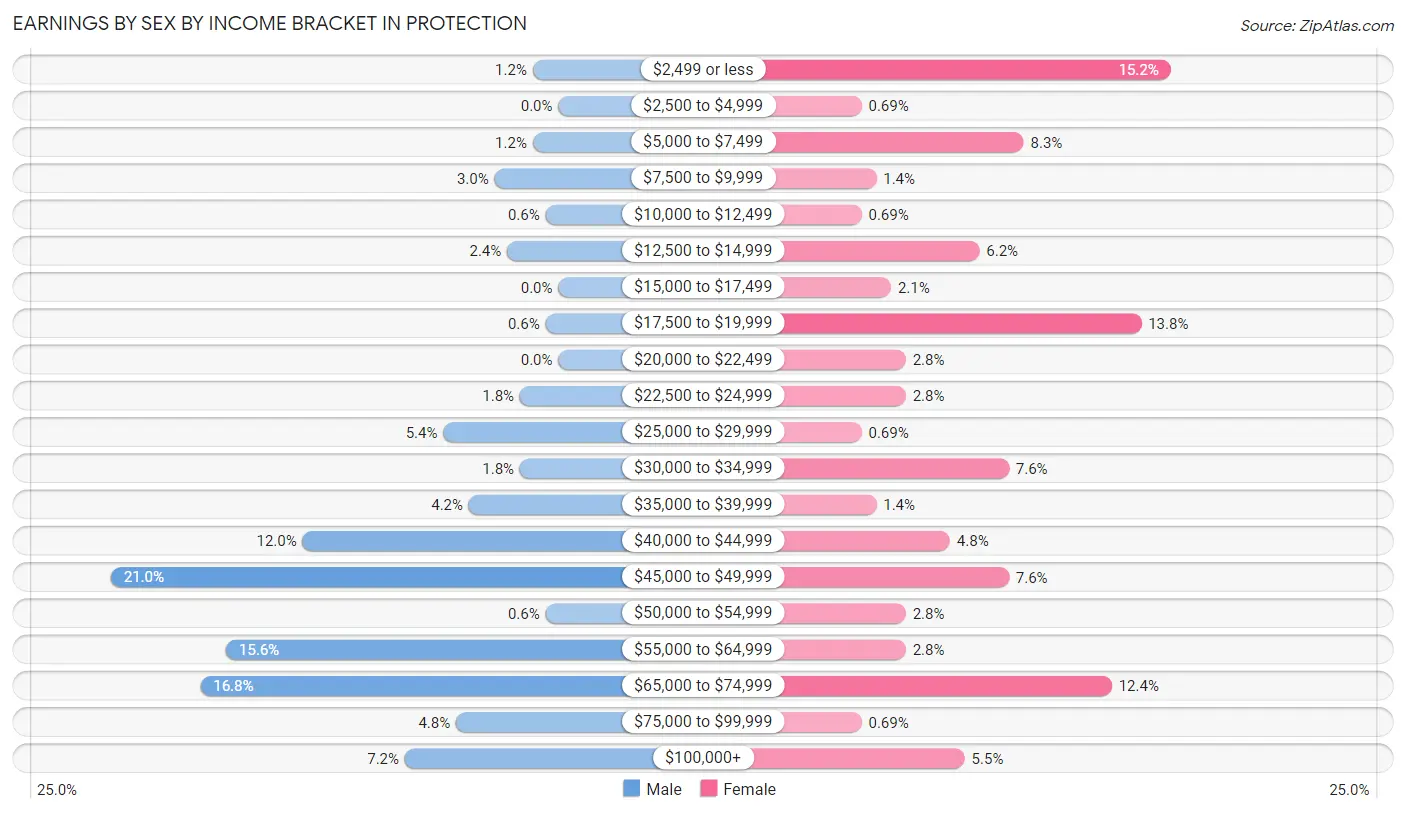
Earnings by Sex by Income Bracket in Protection
The most common earnings brackets in Protection are $45,000 to $49,999 for men (35 | 21.0%) and $2,499 or less for women (22 | 15.2%).
| Income | Male | Female |
| $2,499 or less | 2 (1.2%) | 22 (15.2%) |
| $2,500 to $4,999 | 0 (0.0%) | 1 (0.7%) |
| $5,000 to $7,499 | 2 (1.2%) | 12 (8.3%) |
| $7,500 to $9,999 | 5 (3.0%) | 2 (1.4%) |
| $10,000 to $12,499 | 1 (0.6%) | 1 (0.7%) |
| $12,500 to $14,999 | 4 (2.4%) | 9 (6.2%) |
| $15,000 to $17,499 | 0 (0.0%) | 3 (2.1%) |
| $17,500 to $19,999 | 1 (0.6%) | 20 (13.8%) |
| $20,000 to $22,499 | 0 (0.0%) | 4 (2.8%) |
| $22,500 to $24,999 | 3 (1.8%) | 4 (2.8%) |
| $25,000 to $29,999 | 9 (5.4%) | 1 (0.7%) |
| $30,000 to $34,999 | 3 (1.8%) | 11 (7.6%) |
| $35,000 to $39,999 | 7 (4.2%) | 2 (1.4%) |
| $40,000 to $44,999 | 20 (12.0%) | 7 (4.8%) |
| $45,000 to $49,999 | 35 (21.0%) | 11 (7.6%) |
| $50,000 to $54,999 | 1 (0.6%) | 4 (2.8%) |
| $55,000 to $64,999 | 26 (15.6%) | 4 (2.8%) |
| $65,000 to $74,999 | 28 (16.8%) | 18 (12.4%) |
| $75,000 to $99,999 | 8 (4.8%) | 1 (0.7%) |
| $100,000+ | 12 (7.2%) | 8 (5.5%) |
| Total | 167 (100.0%) | 145 (100.0%) |
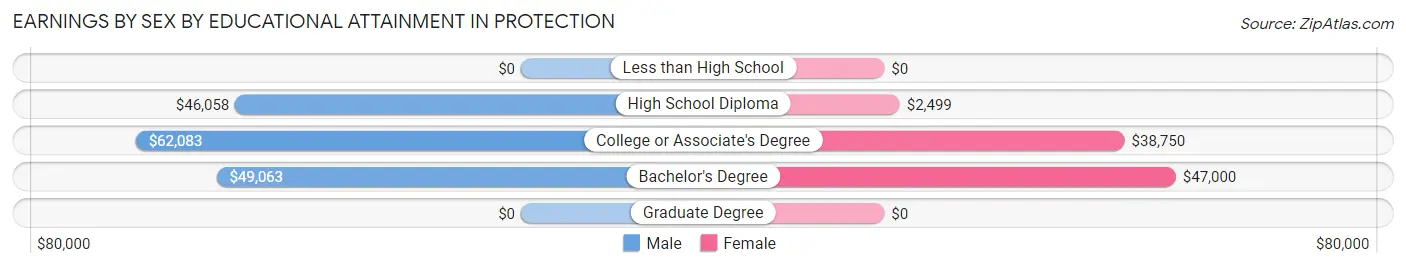
Earnings by Sex by Educational Attainment in Protection
Average earnings in Protection are $49,602 for men and $34,886 for women, a difference of 29.7%. Men with an educational attainment of college or associate's degree enjoy the highest average annual earnings of $62,083, while those with high school diploma education earn the least with $46,058. Women with an educational attainment of bachelor's degree earn the most with the average annual earnings of $47,000, while those with high school diploma education have the smallest earnings of $2,499.
| Educational Attainment | Male Income | Female Income |
| Less than High School | - | - |
| High School Diploma | $46,058 | $2,499 |
| College or Associate's Degree | $62,083 | $38,750 |
| Bachelor's Degree | $49,063 | $47,000 |
| Graduate Degree | - | - |
| Total | $49,602 | $34,886 |
Family Income in Protection
Family Income Brackets in Protection
According to the Protection family income data, there are 37 families falling into the $75,000 to $99,999 income range, which is the most common income bracket and makes up 27.6% of all families.
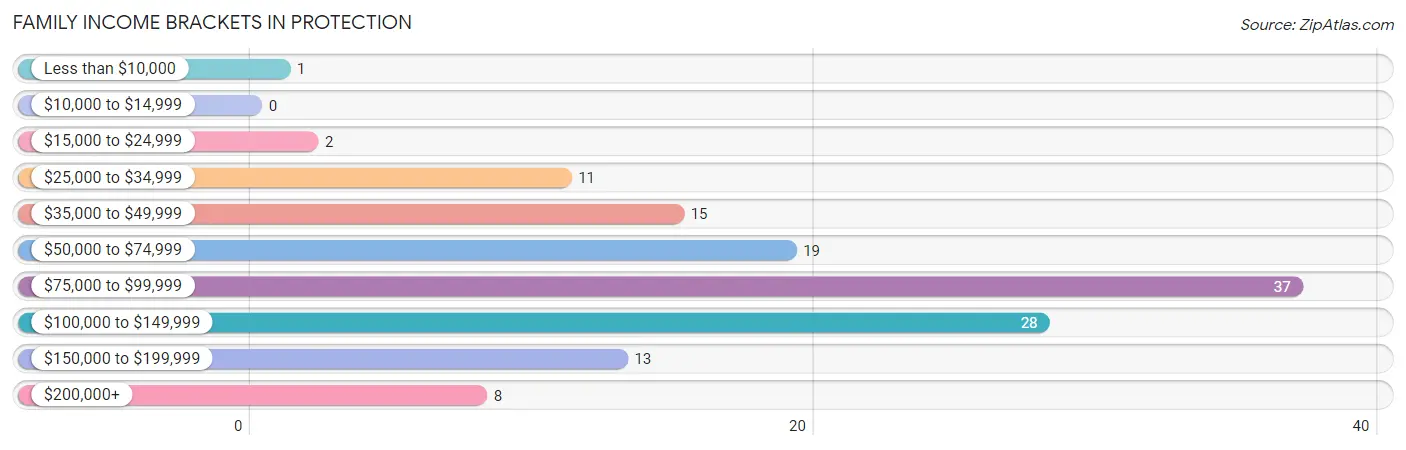
| Income Bracket | # Families | % Families |
| Less than $10,000 | 1 | 0.7% |
| $10,000 to $14,999 | 0 | 0.0% |
| $15,000 to $24,999 | 2 | 1.5% |
| $25,000 to $34,999 | 11 | 8.2% |
| $35,000 to $49,999 | 15 | 11.2% |
| $50,000 to $74,999 | 19 | 14.2% |
| $75,000 to $99,999 | 37 | 27.6% |
| $100,000 to $149,999 | 28 | 20.9% |
| $150,000 to $199,999 | 13 | 9.7% |
| $200,000+ | 8 | 6.0% |
Family Income by Famaliy Size in Protection
4-person families (22 | 16.4%) account for the highest median family income in Protection with $150,208 per family, while 2-person families (79 | 59.0%) have the highest median income of $38,125 per family member.
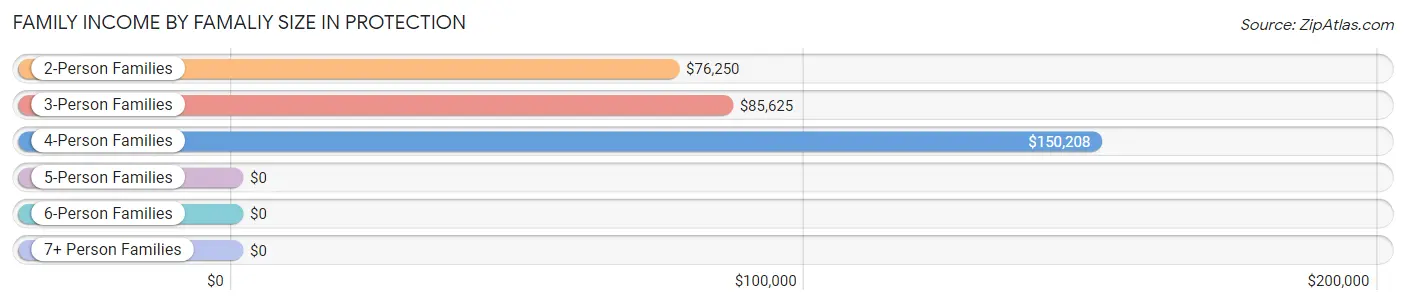
| Income Bracket | # Families | Median Income |
| 2-Person Families | 79 (59.0%) | $76,250 |
| 3-Person Families | 15 (11.2%) | $85,625 |
| 4-Person Families | 22 (16.4%) | $150,208 |
| 5-Person Families | 18 (13.4%) | $0 |
| 6-Person Families | 0 (0.0%) | $0 |
| 7+ Person Families | 0 (0.0%) | $0 |
| Total | 134 (100.0%) | $86,250 |
Family Income by Number of Earners in Protection
The median family income in Protection is $86,250, with families comprising 3+ earners (24) having the highest median family income of $140,000, while families with no earners (11) have the lowest median family income of $28,750, accounting for 17.9% and 8.2% of families, respectively.
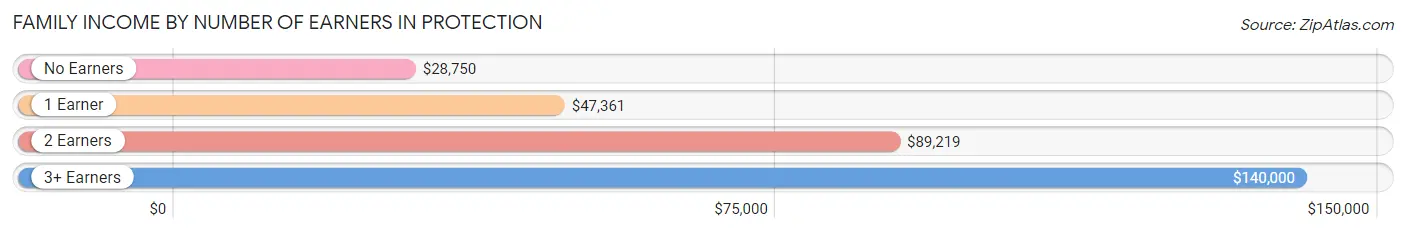
| Number of Earners | # Families | Median Income |
| No Earners | 11 (8.2%) | $28,750 |
| 1 Earner | 33 (24.6%) | $47,361 |
| 2 Earners | 66 (49.2%) | $89,219 |
| 3+ Earners | 24 (17.9%) | $140,000 |
| Total | 134 (100.0%) | $86,250 |
Household Income in Protection
Household Income Brackets in Protection
With 46 households falling in the category, the $35,000 to $49,999 income range is the most frequent in Protection, accounting for 19.7% of all households. In contrast, only 8 households (3.4%) fall into the $200,000+ income bracket, making it the least populous group.
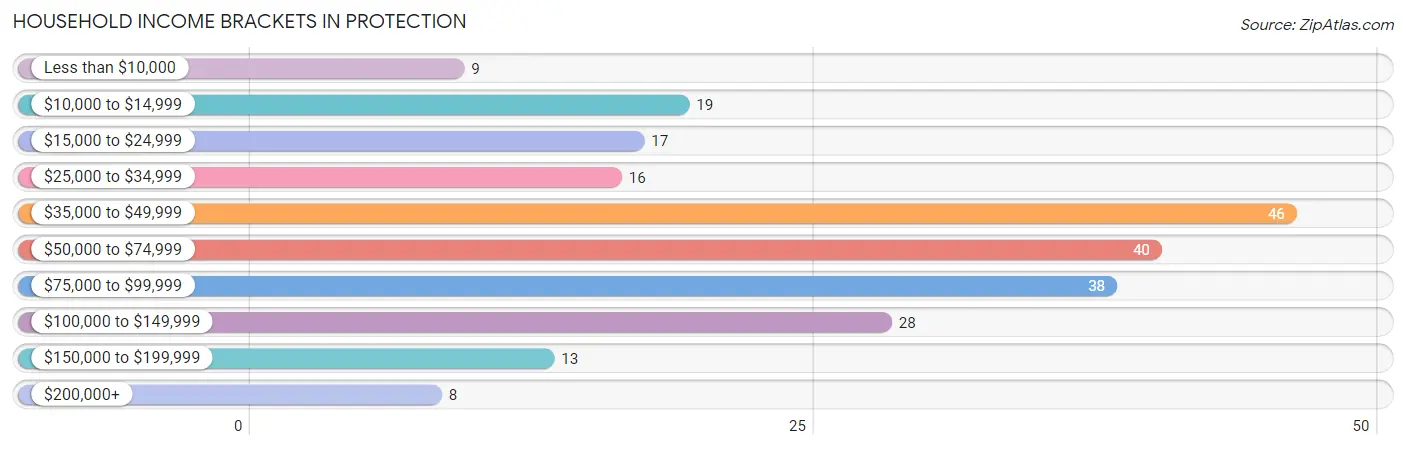
| Income Bracket | # Households | % Households |
| Less than $10,000 | 9 | 3.8% |
| $10,000 to $14,999 | 19 | 8.1% |
| $15,000 to $24,999 | 17 | 7.3% |
| $25,000 to $34,999 | 16 | 6.8% |
| $35,000 to $49,999 | 46 | 19.7% |
| $50,000 to $74,999 | 40 | 17.1% |
| $75,000 to $99,999 | 38 | 16.2% |
| $100,000 to $149,999 | 28 | 12.0% |
| $150,000 to $199,999 | 13 | 5.6% |
| $200,000+ | 8 | 3.4% |
Household Income by Householder Age in Protection
The median household income in Protection is $60,833, with the highest median household income of $75,625 found in the 25 to 44 years age bracket for the primary householder. A total of 79 households (33.8%) fall into this category. Meanwhile, the 15 to 24 years age bracket for the primary householder has the lowest median household income of $0, with 6 households (2.6%) in this group.
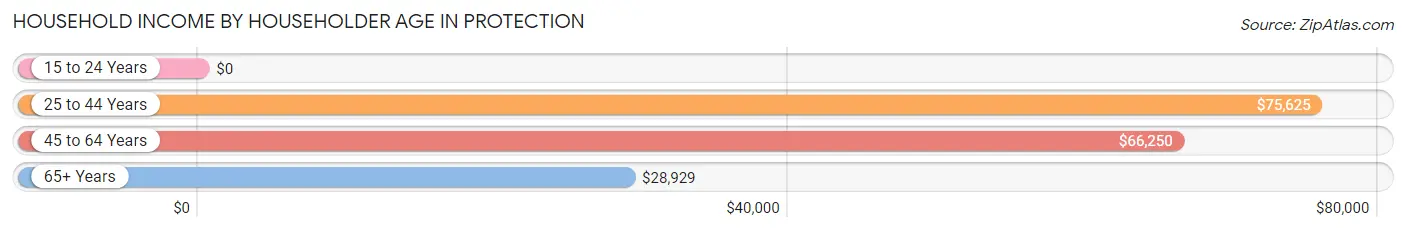
| Income Bracket | # Households | Median Income |
| 15 to 24 Years | 6 (2.6%) | $0 |
| 25 to 44 Years | 79 (33.8%) | $75,625 |
| 45 to 64 Years | 79 (33.8%) | $66,250 |
| 65+ Years | 70 (29.9%) | $28,929 |
| Total | 234 (100.0%) | $60,833 |
Poverty in Protection
Income Below Poverty by Sex and Age in Protection
With 6.2% poverty level for males and 9.2% for females among the residents of Protection, 6 to 11 year old males and 15 year old females are the most vulnerable to poverty, with 2 males (66.7%) and 4 females (44.4%) in their respective age groups living below the poverty level.
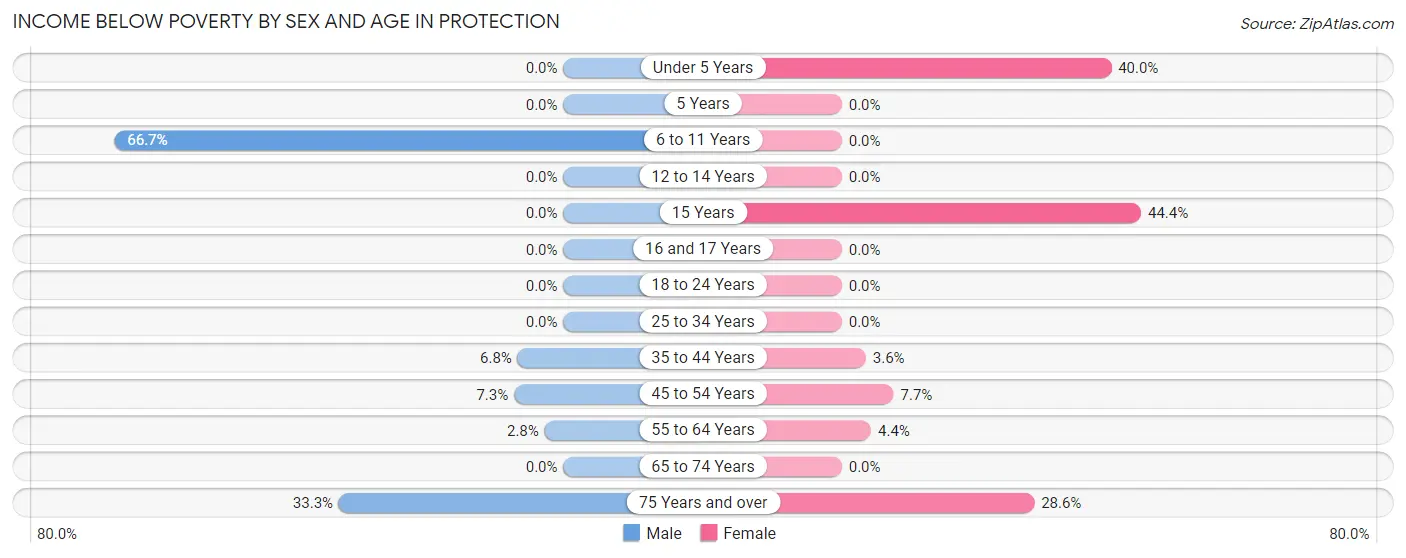
| Age Bracket | Male | Female |
| Under 5 Years | 0 (0.0%) | 2 (40.0%) |
| 5 Years | 0 (0.0%) | 0 (0.0%) |
| 6 to 11 Years | 2 (66.7%) | 0 (0.0%) |
| 12 to 14 Years | 0 (0.0%) | 0 (0.0%) |
| 15 Years | 0 (0.0%) | 4 (44.4%) |
| 16 and 17 Years | 0 (0.0%) | 0 (0.0%) |
| 18 to 24 Years | 0 (0.0%) | 0 (0.0%) |
| 25 to 34 Years | 0 (0.0%) | 0 (0.0%) |
| 35 to 44 Years | 4 (6.8%) | 2 (3.6%) |
| 45 to 54 Years | 3 (7.3%) | 2 (7.7%) |
| 55 to 64 Years | 1 (2.8%) | 1 (4.3%) |
| 65 to 74 Years | 0 (0.0%) | 0 (0.0%) |
| 75 Years and over | 6 (33.3%) | 10 (28.6%) |
| Total | 16 (6.2%) | 21 (9.2%) |
Income Above Poverty by Sex and Age in Protection
According to the poverty statistics in Protection, males aged under 5 years and females aged 6 to 11 years are the age groups that are most secure financially, with 100.0% of males and 100.0% of females in these age groups living above the poverty line.
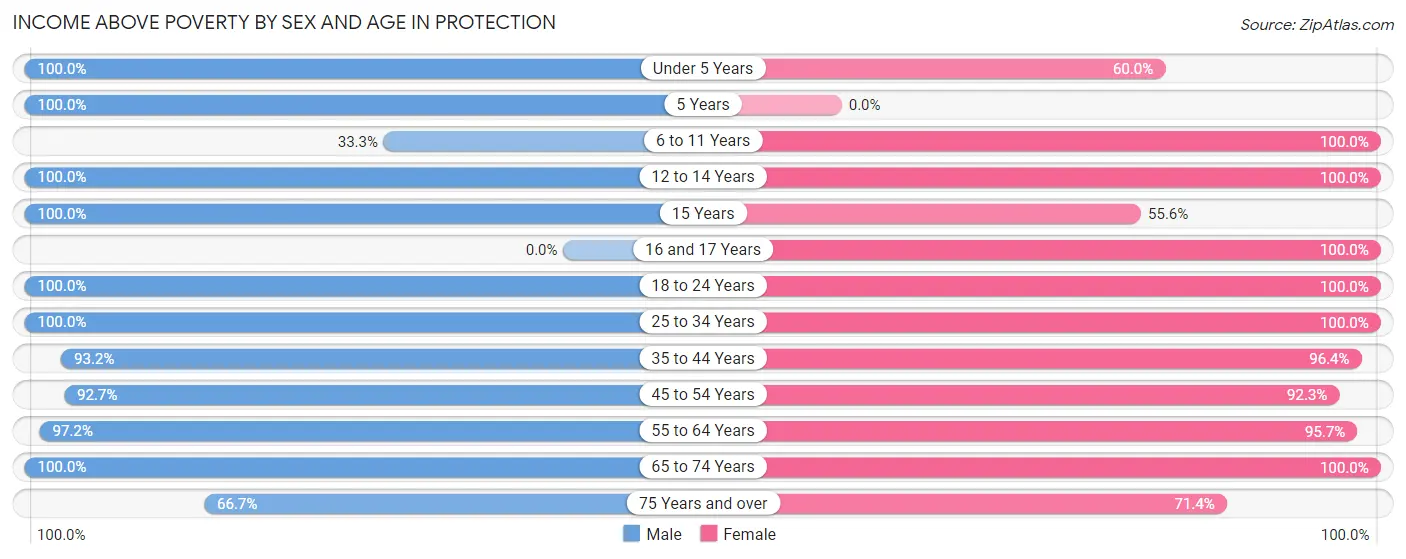
| Age Bracket | Male | Female |
| Under 5 Years | 22 (100.0%) | 3 (60.0%) |
| 5 Years | 3 (100.0%) | 0 (0.0%) |
| 6 to 11 Years | 1 (33.3%) | 13 (100.0%) |
| 12 to 14 Years | 21 (100.0%) | 7 (100.0%) |
| 15 Years | 1 (100.0%) | 5 (55.6%) |
| 16 and 17 Years | 0 (0.0%) | 10 (100.0%) |
| 18 to 24 Years | 13 (100.0%) | 24 (100.0%) |
| 25 to 34 Years | 10 (100.0%) | 7 (100.0%) |
| 35 to 44 Years | 55 (93.2%) | 54 (96.4%) |
| 45 to 54 Years | 38 (92.7%) | 24 (92.3%) |
| 55 to 64 Years | 35 (97.2%) | 22 (95.7%) |
| 65 to 74 Years | 30 (100.0%) | 13 (100.0%) |
| 75 Years and over | 12 (66.7%) | 25 (71.4%) |
| Total | 241 (93.8%) | 207 (90.8%) |
Income Below Poverty Among Married-Couple Families in Protection
The poverty statistics for married-couple families in Protection show that 0.9% or 1 of the total 113 families live below the poverty line. Families with no children have the highest poverty rate of 1.4%, comprising of 1 families. On the other hand, families with 1 or 2 children have the lowest poverty rate of 0.0%, which includes 0 families.
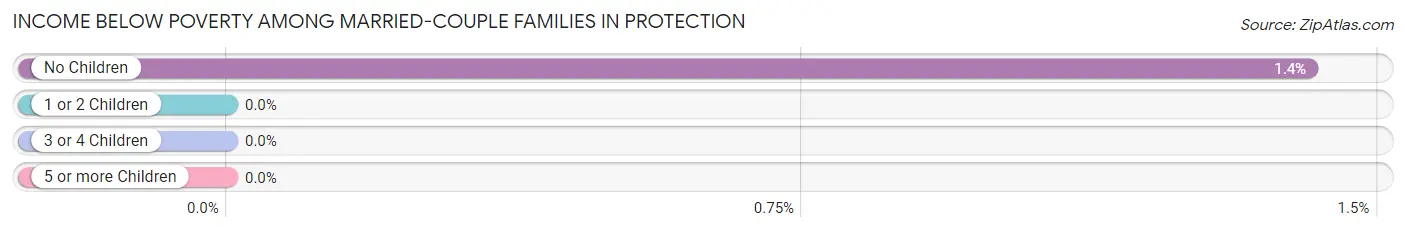
| Children | Above Poverty | Below Poverty |
| No Children | 70 (98.6%) | 1 (1.4%) |
| 1 or 2 Children | 24 (100.0%) | 0 (0.0%) |
| 3 or 4 Children | 18 (100.0%) | 0 (0.0%) |
| 5 or more Children | 0 (0.0%) | 0 (0.0%) |
| Total | 112 (99.1%) | 1 (0.9%) |
Income Below Poverty Among Single-Parent Households in Protection
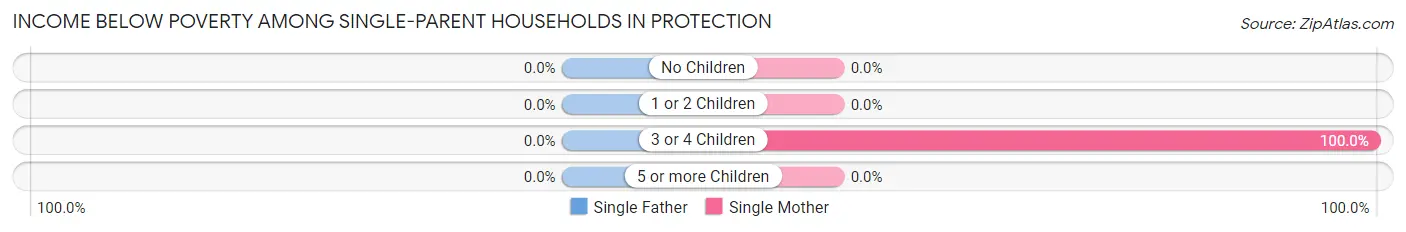
| Children | Single Father | Single Mother |
| No Children | 0 (0.0%) | 0 (0.0%) |
| 1 or 2 Children | 0 (0.0%) | 0 (0.0%) |
| 3 or 4 Children | 0 (0.0%) | 2 (100.0%) |
| 5 or more Children | 0 (0.0%) | 0 (0.0%) |
| Total | 0 (0.0%) | 2 (11.1%) |
Income Below Poverty Among Married-Couple vs Single-Parent Households in Protection
The poverty data for Protection shows that 1 of the married-couple family households (0.9%) and 2 of the single-parent households (9.5%) are living below the poverty level. Within the married-couple family households, those with no children have the highest poverty rate, with 1 households (1.4%) falling below the poverty line. Among the single-parent households, those with 3 or 4 children have the highest poverty rate, with 2 household (100.0%) living below poverty.
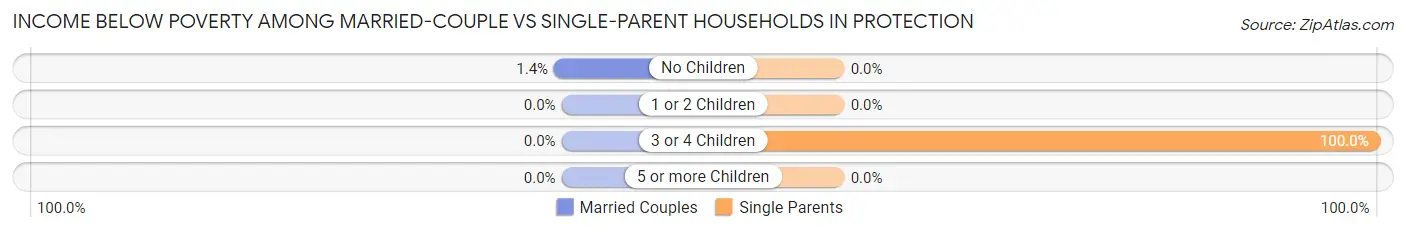
| Children | Married-Couple Families | Single-Parent Households |
| No Children | 1 (1.4%) | 0 (0.0%) |
| 1 or 2 Children | 0 (0.0%) | 0 (0.0%) |
| 3 or 4 Children | 0 (0.0%) | 2 (100.0%) |
| 5 or more Children | 0 (0.0%) | 0 (0.0%) |
| Total | 1 (0.9%) | 2 (9.5%) |
Race in Protection
The most populous races in Protection are White / Caucasian (519 | 98.1%), Hispanic or Latino (27 | 5.1%), and Some other Race (7 | 1.3%).
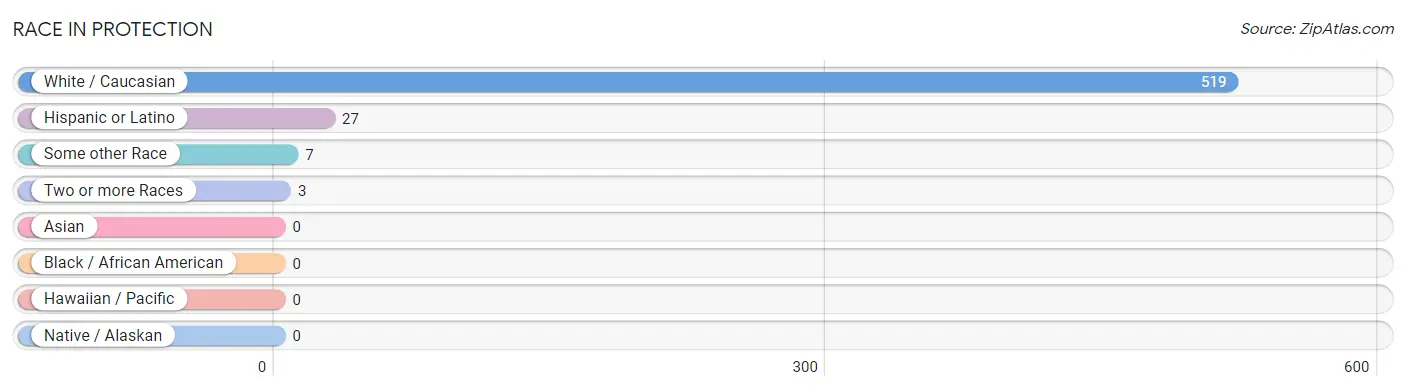
| Race | # Population | % Population |
| Asian | 0 | 0.0% |
| Black / African American | 0 | 0.0% |
| Hawaiian / Pacific | 0 | 0.0% |
| Hispanic or Latino | 27 | 5.1% |
| Native / Alaskan | 0 | 0.0% |
| White / Caucasian | 519 | 98.1% |
| Two or more Races | 3 | 0.6% |
| Some other Race | 7 | 1.3% |
| Total | 529 | 100.0% |
Ancestry in Protection
The most populous ancestries reported in Protection are German (95 | 18.0%), English (50 | 9.5%), Irish (46 | 8.7%), American (36 | 6.8%), and Mexican (25 | 4.7%), together accounting for 47.6% of all Protection residents.
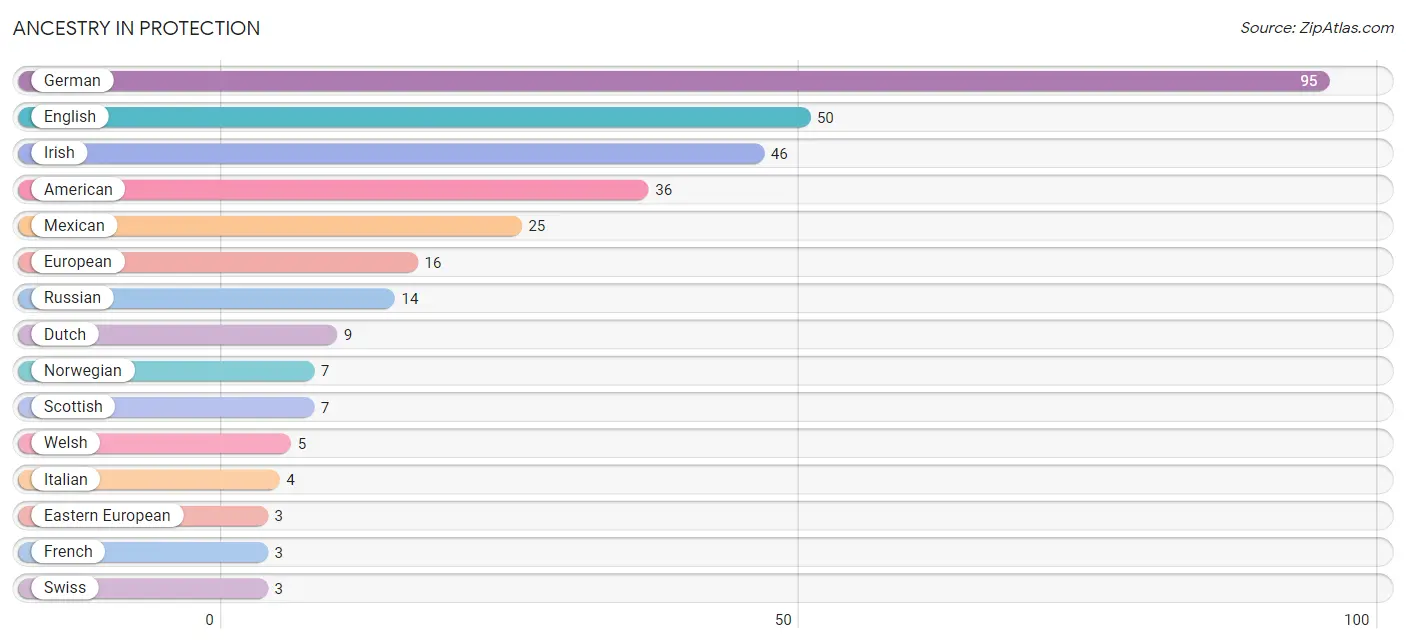
| Ancestry | # Population | % Population |
| American | 36 | 6.8% |
| Czechoslovakian | 1 | 0.2% |
| Danish | 1 | 0.2% |
| Dutch | 9 | 1.7% |
| Eastern European | 3 | 0.6% |
| English | 50 | 9.5% |
| European | 16 | 3.0% |
| French | 3 | 0.6% |
| German | 95 | 18.0% |
| Irish | 46 | 8.7% |
| Italian | 4 | 0.8% |
| Mexican | 25 | 4.7% |
| Norwegian | 7 | 1.3% |
| Russian | 14 | 2.6% |
| Scottish | 7 | 1.3% |
| Swiss | 3 | 0.6% |
| Welsh | 5 | 0.9% | View All 17 Rows |
Immigrants in Protection
The most numerous immigrant groups reported in Protection came from Central America (14 | 2.6%), Latin America (14 | 2.6%), and Mexico (14 | 2.6%), together accounting for 8.0% of all Protection residents.
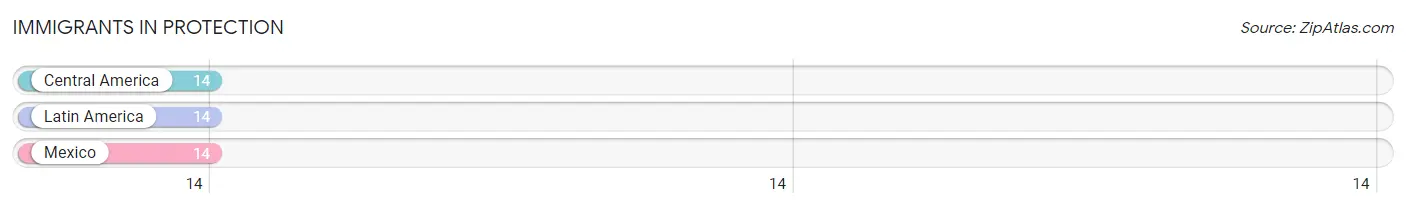
| Immigration Origin | # Population | % Population |
| Central America | 14 | 2.6% |
| Latin America | 14 | 2.6% |
| Mexico | 14 | 2.6% | View All 3 Rows |
Sex and Age in Protection
Sex and Age in Protection
The most populous age groups in Protection are 35 to 39 Years (38 | 13.6%) for men and 15 to 19 Years (41 | 16.4%) for women.
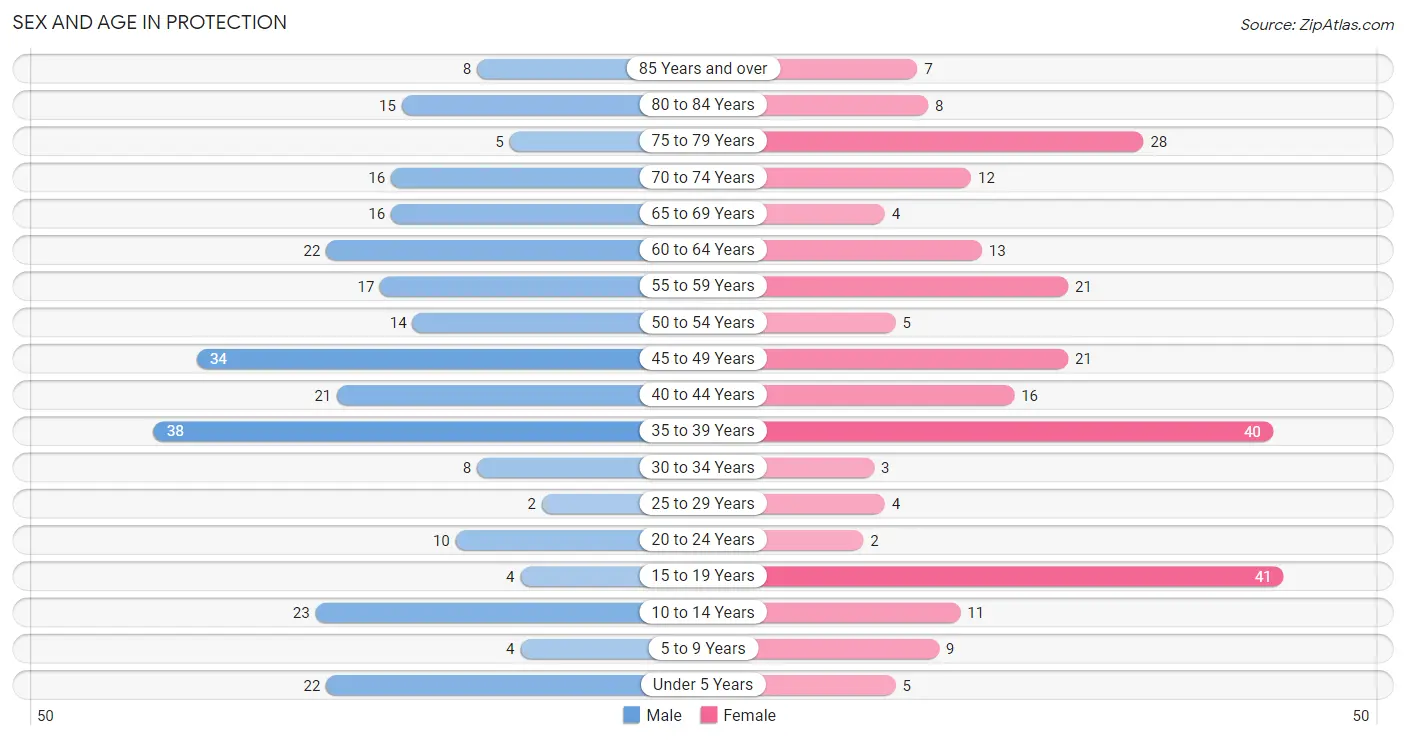
| Age Bracket | Male | Female |
| Under 5 Years | 22 (7.9%) | 5 (2.0%) |
| 5 to 9 Years | 4 (1.4%) | 9 (3.6%) |
| 10 to 14 Years | 23 (8.2%) | 11 (4.4%) |
| 15 to 19 Years | 4 (1.4%) | 41 (16.4%) |
| 20 to 24 Years | 10 (3.6%) | 2 (0.8%) |
| 25 to 29 Years | 2 (0.7%) | 4 (1.6%) |
| 30 to 34 Years | 8 (2.9%) | 3 (1.2%) |
| 35 to 39 Years | 38 (13.6%) | 40 (16.0%) |
| 40 to 44 Years | 21 (7.5%) | 16 (6.4%) |
| 45 to 49 Years | 34 (12.2%) | 21 (8.4%) |
| 50 to 54 Years | 14 (5.0%) | 5 (2.0%) |
| 55 to 59 Years | 17 (6.1%) | 21 (8.4%) |
| 60 to 64 Years | 22 (7.9%) | 13 (5.2%) |
| 65 to 69 Years | 16 (5.7%) | 4 (1.6%) |
| 70 to 74 Years | 16 (5.7%) | 12 (4.8%) |
| 75 to 79 Years | 5 (1.8%) | 28 (11.2%) |
| 80 to 84 Years | 15 (5.4%) | 8 (3.2%) |
| 85 Years and over | 8 (2.9%) | 7 (2.8%) |
| Total | 279 (100.0%) | 250 (100.0%) |
Families and Households in Protection
Median Family Size in Protection
The median family size in Protection is 2.84 persons per family, with single female/mother families (18 | 13.4%) accounting for the largest median family size of 3.06 persons per family. On the other hand, single male/father families (3 | 2.2%) represent the smallest median family size with 2.67 persons per family.
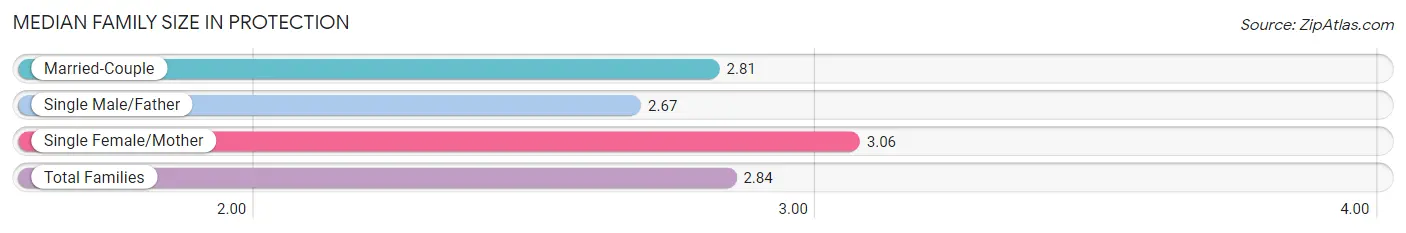
| Family Type | # Families | Family Size |
| Married-Couple | 113 (84.3%) | 2.81 |
| Single Male/Father | 3 (2.2%) | 2.67 |
| Single Female/Mother | 18 (13.4%) | 3.06 |
| Total Families | 134 (100.0%) | 2.84 |
Median Household Size in Protection
The median household size in Protection is 2.07 persons per household, with single female/mother households (18 | 7.7%) accounting for the largest median household size of 3.06 persons per household. non-family households (100 | 42.7%) represent the smallest median household size with 1.04 persons per household.
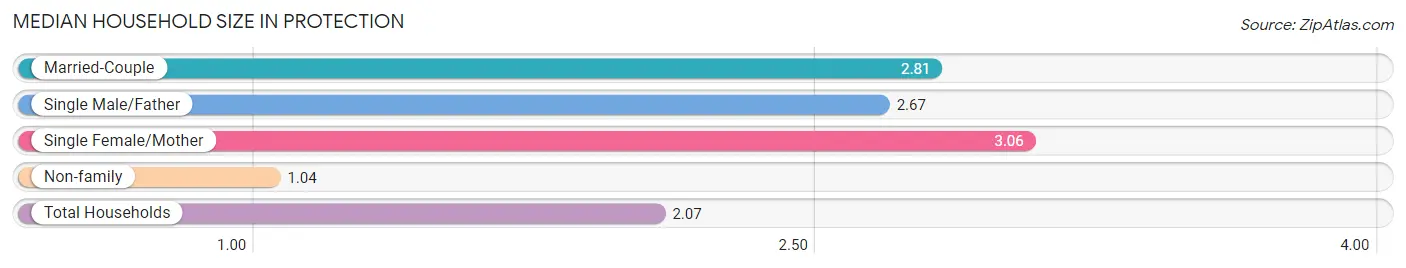
| Household Type | # Households | Household Size |
| Married-Couple | 113 (48.3%) | 2.81 |
| Single Male/Father | 3 (1.3%) | 2.67 |
| Single Female/Mother | 18 (7.7%) | 3.06 |
| Non-family | 100 (42.7%) | 1.04 |
| Total Households | 234 (100.0%) | 2.07 |
Household Size by Marriage Status in Protection
Out of a total of 234 households in Protection, 134 (57.3%) are family households, while 100 (42.7%) are nonfamily households. The most numerous type of family households are 2-person households, comprising 79, and the most common type of nonfamily households are 1-person households, comprising 97.
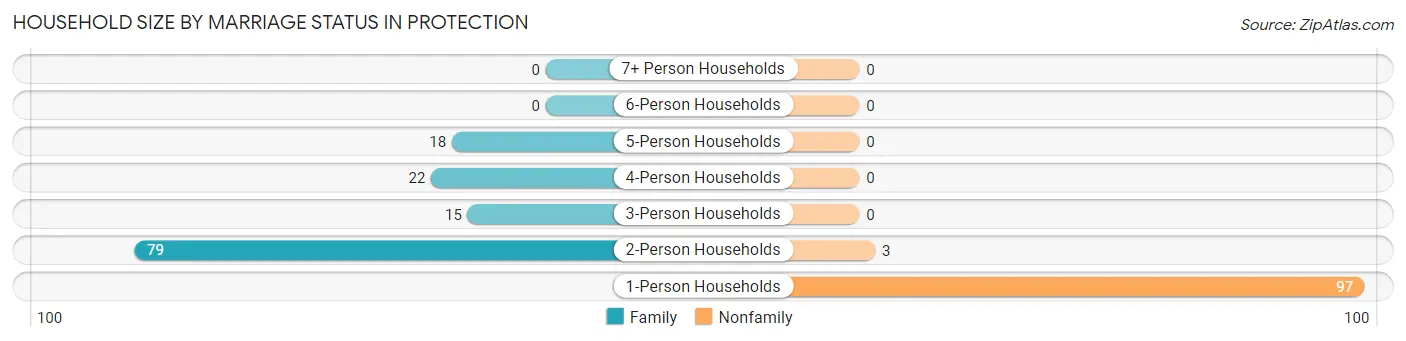
| Household Size | Family Households | Nonfamily Households |
| 1-Person Households | - | 97 (41.4%) |
| 2-Person Households | 79 (33.8%) | 3 (1.3%) |
| 3-Person Households | 15 (6.4%) | 0 (0.0%) |
| 4-Person Households | 22 (9.4%) | 0 (0.0%) |
| 5-Person Households | 18 (7.7%) | 0 (0.0%) |
| 6-Person Households | 0 (0.0%) | 0 (0.0%) |
| 7+ Person Households | 0 (0.0%) | 0 (0.0%) |
| Total | 134 (57.3%) | 100 (42.7%) |
Female Fertility in Protection
Fertility by Age in Protection
Average fertility rate in Protection is 16.0 births per 1,000 women. Women in the age bracket of 20 to 34 years have the highest fertility rate with 222.0 births per 1,000 women. Women in the age bracket of 20 to 34 years acount for 100.0% of all women with births.
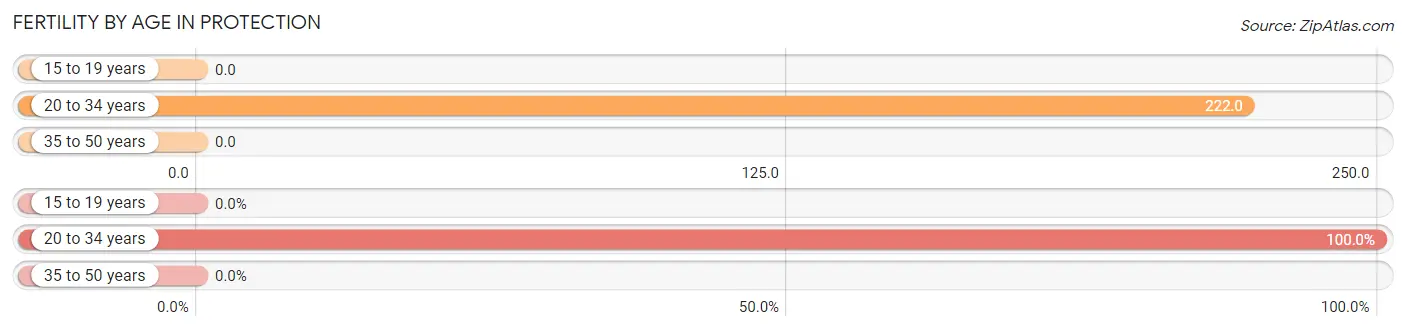
| Age Bracket | Women with Births | Births / 1,000 Women |
| 15 to 19 years | 0 (0.0%) | 0.0 |
| 20 to 34 years | 2 (100.0%) | 222.0 |
| 35 to 50 years | 0 (0.0%) | 0.0 |
| Total | 2 (100.0%) | 16.0 |
Fertility by Age by Marriage Status in Protection
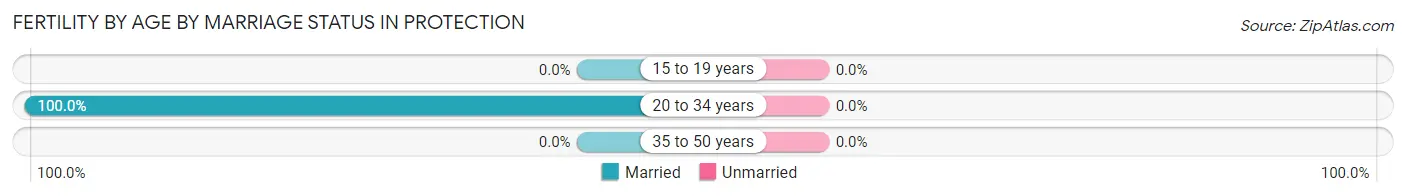
| Age Bracket | Married | Unmarried |
| 15 to 19 years | 0 (0.0%) | 0 (0.0%) |
| 20 to 34 years | 2 (100.0%) | 0 (0.0%) |
| 35 to 50 years | 0 (0.0%) | 0 (0.0%) |
| Total | 2 (100.0%) | 0 (0.0%) |
Fertility by Education in Protection
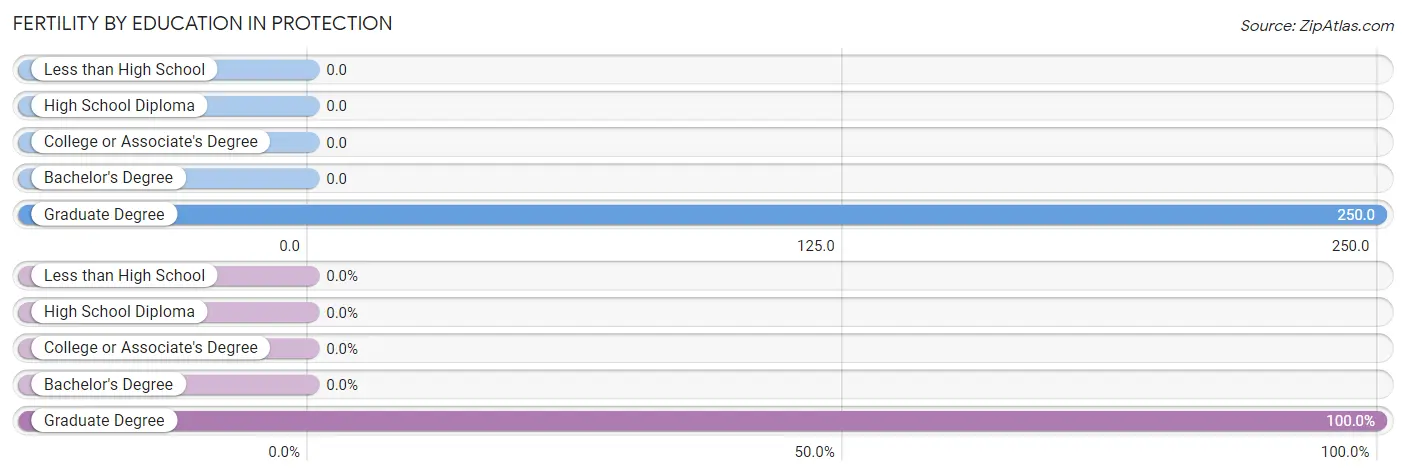
| Educational Attainment | Women with Births | Births / 1,000 Women |
| Less than High School | 0 (0.0%) | 0.0 |
| High School Diploma | 0 (0.0%) | 0.0 |
| College or Associate's Degree | 0 (0.0%) | 0.0 |
| Bachelor's Degree | 0 (0.0%) | 0.0 |
| Graduate Degree | 2 (100.0%) | 250.0 |
| Total | 2 (100.0%) | 16.0 |
Fertility by Education by Marriage Status in Protection
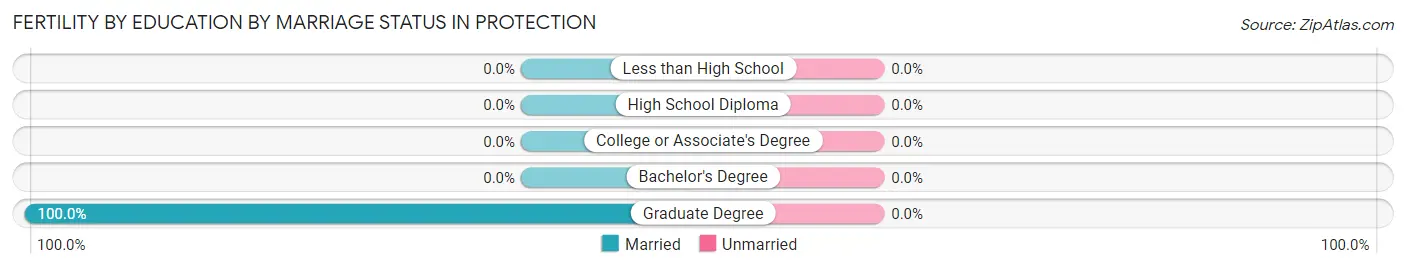
| Educational Attainment | Married | Unmarried |
| Less than High School | 0 (0.0%) | 0 (0.0%) |
| High School Diploma | 0 (0.0%) | 0 (0.0%) |
| College or Associate's Degree | 0 (0.0%) | 0 (0.0%) |
| Bachelor's Degree | 0 (0.0%) | 0 (0.0%) |
| Graduate Degree | 2 (100.0%) | 0 (0.0%) |
| Total | 2 (100.0%) | 0 (0.0%) |
Employment Characteristics in Protection
Employment by Class of Employer in Protection
Among the 266 employed individuals in Protection, private company employees (156 | 58.7%), local government employees (41 | 15.4%), and self-employed (not incorporated) (23 | 8.6%) make up the most common classes of employment.
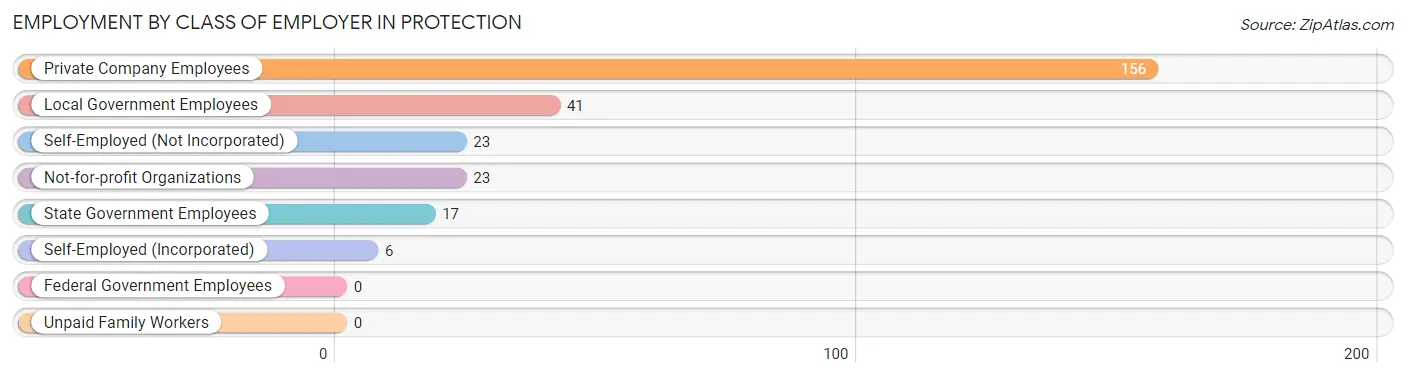
| Employer Class | # Employees | % Employees |
| Private Company Employees | 156 | 58.7% |
| Self-Employed (Incorporated) | 6 | 2.3% |
| Self-Employed (Not Incorporated) | 23 | 8.6% |
| Not-for-profit Organizations | 23 | 8.6% |
| Local Government Employees | 41 | 15.4% |
| State Government Employees | 17 | 6.4% |
| Federal Government Employees | 0 | 0.0% |
| Unpaid Family Workers | 0 | 0.0% |
| Total | 266 | 100.0% |
Employment Status by Age in Protection
According to the labor force statistics for Protection, out of the total population over 16 years of age (445), 64.7% or 288 individuals are in the labor force, with 0.7% or 2 of them unemployed. The age group with the highest labor force participation rate is 30 to 34 years, with 100.0% or 11 individuals in the labor force. Within the labor force, the 25 to 29 years age range has the highest percentage of unemployed individuals, with 50.0% or 2 of them being unemployed.
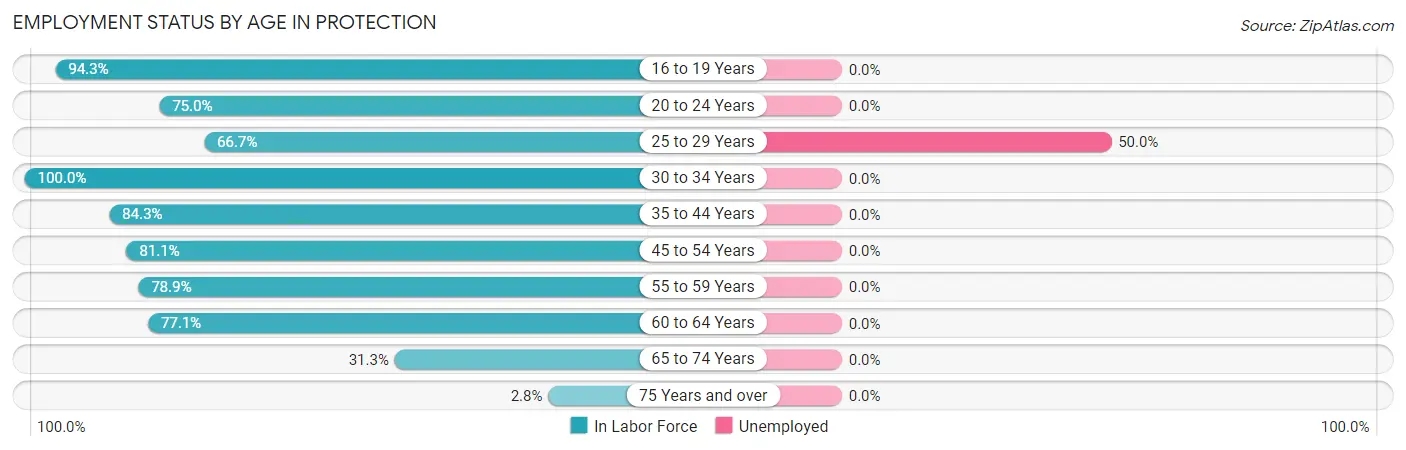
| Age Bracket | In Labor Force | Unemployed |
| 16 to 19 Years | 33 (94.3%) | 0 (0.0%) |
| 20 to 24 Years | 9 (75.0%) | 0 (0.0%) |
| 25 to 29 Years | 4 (66.7%) | 2 (50.0%) |
| 30 to 34 Years | 11 (100.0%) | 0 (0.0%) |
| 35 to 44 Years | 97 (84.3%) | 0 (0.0%) |
| 45 to 54 Years | 60 (81.1%) | 0 (0.0%) |
| 55 to 59 Years | 30 (78.9%) | 0 (0.0%) |
| 60 to 64 Years | 27 (77.1%) | 0 (0.0%) |
| 65 to 74 Years | 15 (31.3%) | 0 (0.0%) |
| 75 Years and over | 2 (2.8%) | 0 (0.0%) |
| Total | 288 (64.7%) | 2 (0.7%) |
Employment Status by Educational Attainment in Protection
According to labor force statistics for Protection, 82.1% of individuals (229) out of the total population between 25 and 64 years of age (279) are in the labor force, with 0.9% or 2 of them being unemployed. The group with the highest labor force participation rate are those with the educational attainment of bachelor's degree or higher, with 93.5% or 72 individuals in the labor force. Within the labor force, individuals with college / associate degree education have the highest percentage of unemployment, with 1.9% or 2 of them being unemployed.
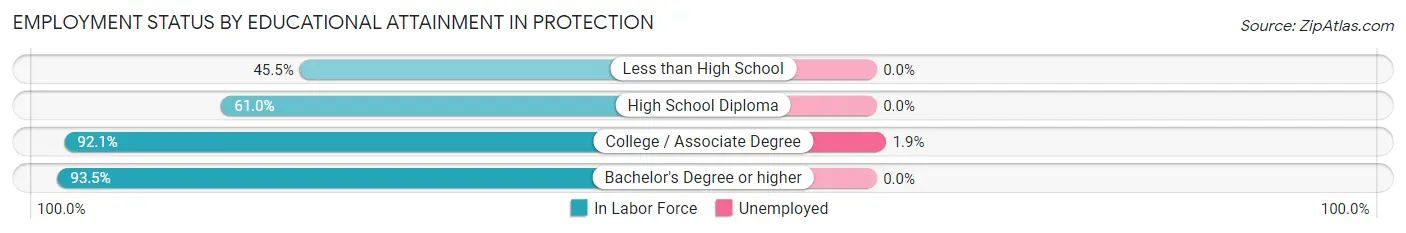
| Educational Attainment | In Labor Force | Unemployed |
| Less than High School | 5 (45.5%) | 0 (0.0%) |
| High School Diploma | 47 (61.0%) | 0 (0.0%) |
| College / Associate Degree | 105 (92.1%) | 2 (1.9%) |
| Bachelor's Degree or higher | 72 (93.5%) | 0 (0.0%) |
| Total | 229 (82.1%) | 3 (0.9%) |
Employment Occupations by Sex in Protection
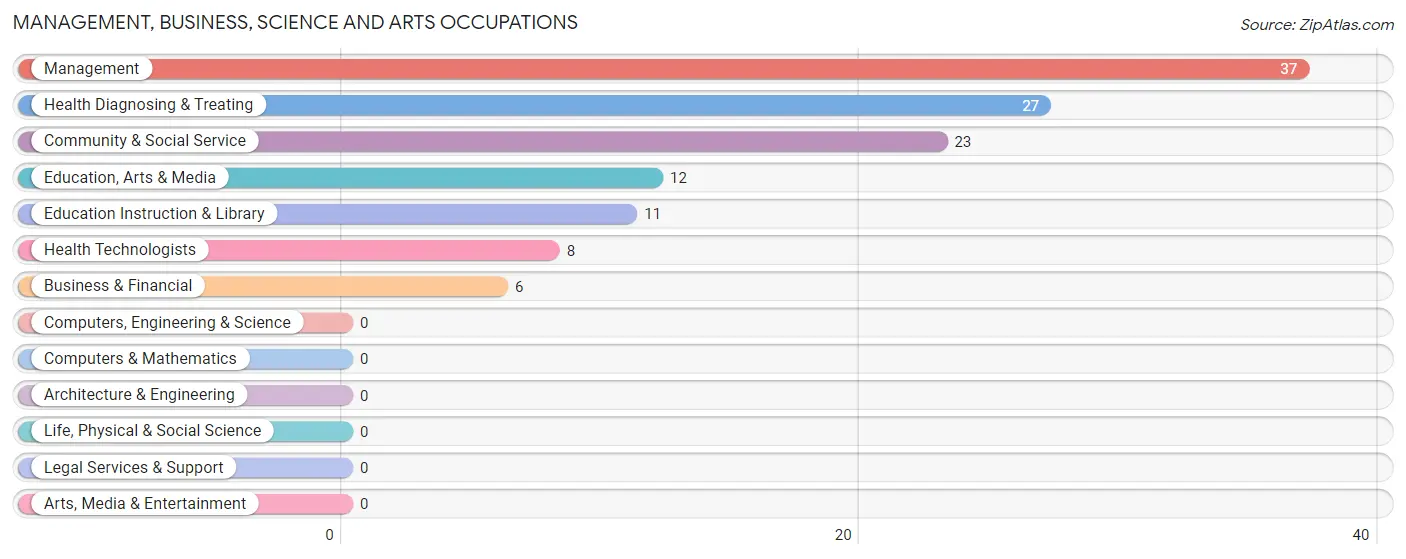
Management, Business, Science and Arts Occupations
The most common Management, Business, Science and Arts occupations in Protection are Management (37 | 12.9%), Health Diagnosing & Treating (27 | 9.4%), Community & Social Service (23 | 8.0%), Education, Arts & Media (12 | 4.2%), and Education Instruction & Library (11 | 3.8%).
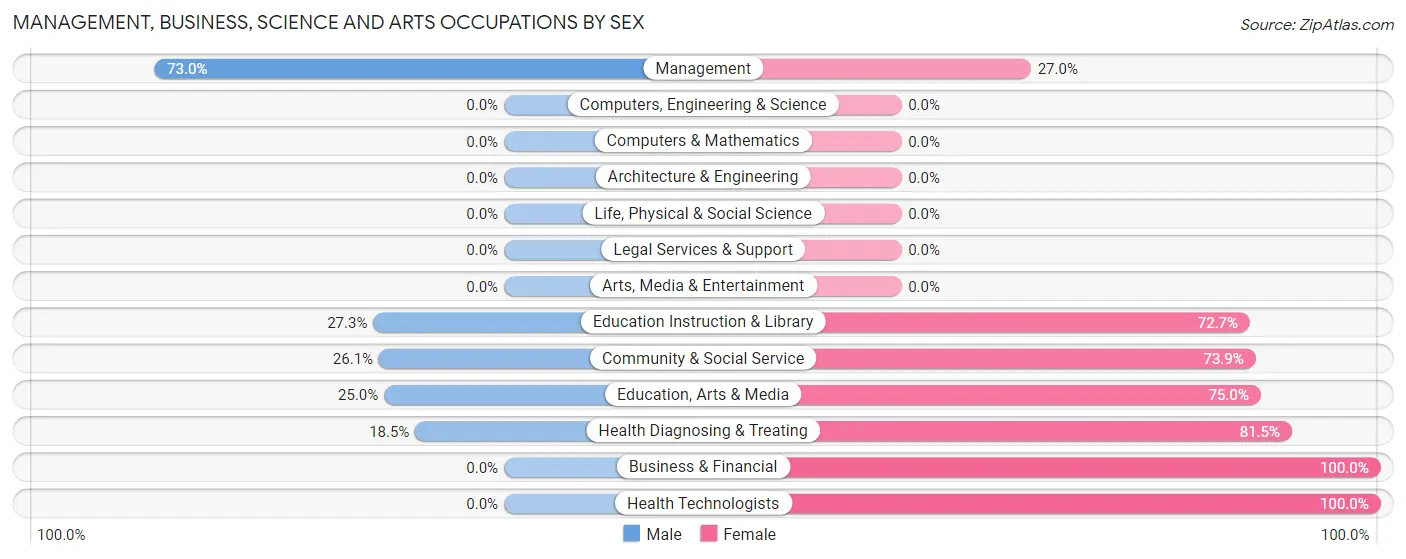
Management, Business, Science and Arts Occupations by Sex
Within the Management, Business, Science and Arts occupations in Protection, the most male-oriented occupations are Management (73.0%), Education Instruction & Library (27.3%), and Community & Social Service (26.1%), while the most female-oriented occupations are Business & Financial (100.0%), Health Technologists (100.0%), and Health Diagnosing & Treating (81.5%).
| Occupation | Male | Female |
| Management | 27 (73.0%) | 10 (27.0%) |
| Business & Financial | 0 (0.0%) | 6 (100.0%) |
| Computers, Engineering & Science | 0 (0.0%) | 0 (0.0%) |
| Computers & Mathematics | 0 (0.0%) | 0 (0.0%) |
| Architecture & Engineering | 0 (0.0%) | 0 (0.0%) |
| Life, Physical & Social Science | 0 (0.0%) | 0 (0.0%) |
| Community & Social Service | 6 (26.1%) | 17 (73.9%) |
| Education, Arts & Media | 3 (25.0%) | 9 (75.0%) |
| Legal Services & Support | 0 (0.0%) | 0 (0.0%) |
| Education Instruction & Library | 3 (27.3%) | 8 (72.7%) |
| Arts, Media & Entertainment | 0 (0.0%) | 0 (0.0%) |
| Health Diagnosing & Treating | 5 (18.5%) | 22 (81.5%) |
| Health Technologists | 0 (0.0%) | 8 (100.0%) |
| Total (Category) | 38 (40.9%) | 55 (59.1%) |
| Total (Overall) | 163 (57.0%) | 123 (43.0%) |
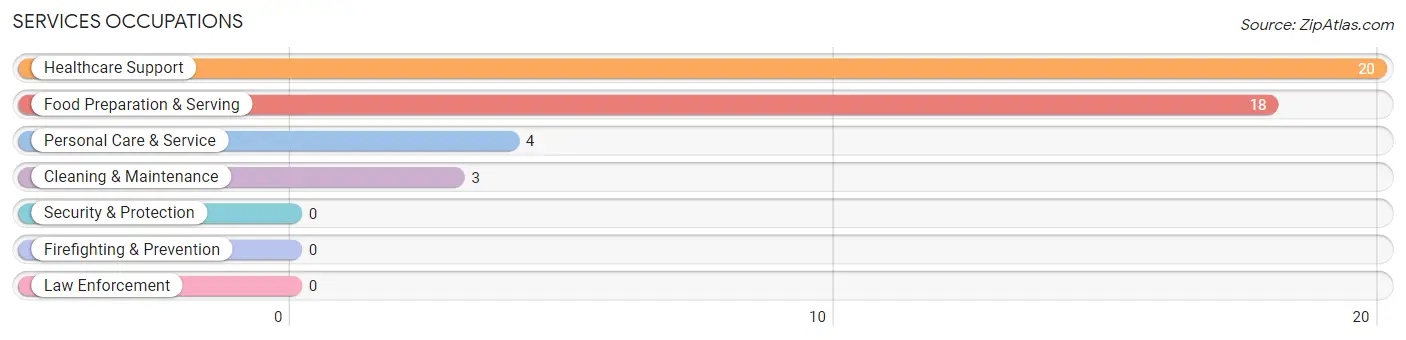
Services Occupations
The most common Services occupations in Protection are Healthcare Support (20 | 7.0%), Food Preparation & Serving (18 | 6.3%), Personal Care & Service (4 | 1.4%), and Cleaning & Maintenance (3 | 1.1%).
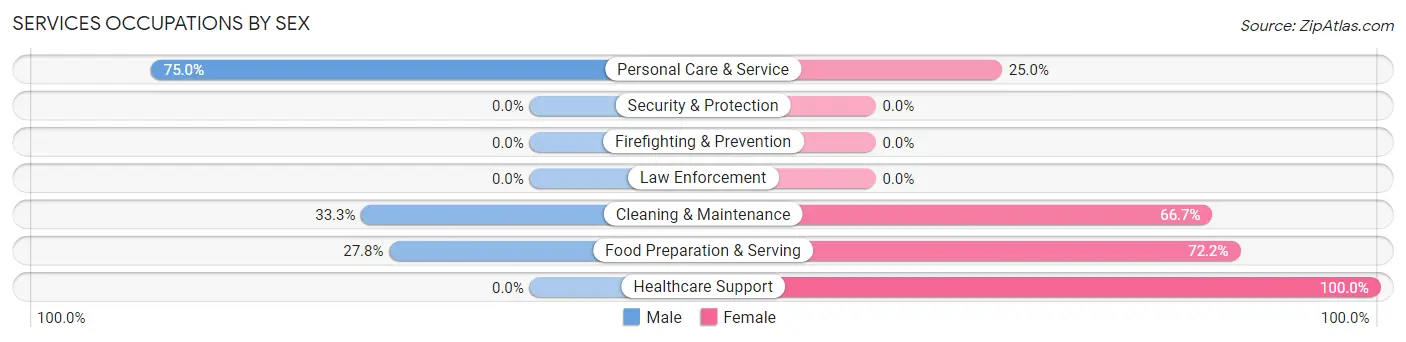
Services Occupations by Sex
Within the Services occupations in Protection, the most male-oriented occupations are Personal Care & Service (75.0%), Cleaning & Maintenance (33.3%), and Food Preparation & Serving (27.8%), while the most female-oriented occupations are Healthcare Support (100.0%), Food Preparation & Serving (72.2%), and Cleaning & Maintenance (66.7%).
| Occupation | Male | Female |
| Healthcare Support | 0 (0.0%) | 20 (100.0%) |
| Security & Protection | 0 (0.0%) | 0 (0.0%) |
| Firefighting & Prevention | 0 (0.0%) | 0 (0.0%) |
| Law Enforcement | 0 (0.0%) | 0 (0.0%) |
| Food Preparation & Serving | 5 (27.8%) | 13 (72.2%) |
| Cleaning & Maintenance | 1 (33.3%) | 2 (66.7%) |
| Personal Care & Service | 3 (75.0%) | 1 (25.0%) |
| Total (Category) | 9 (20.0%) | 36 (80.0%) |
| Total (Overall) | 163 (57.0%) | 123 (43.0%) |
Sales and Office Occupations
The most common Sales and Office occupations in Protection are Office & Administration (46 | 16.1%), and Sales & Related (13 | 4.5%).
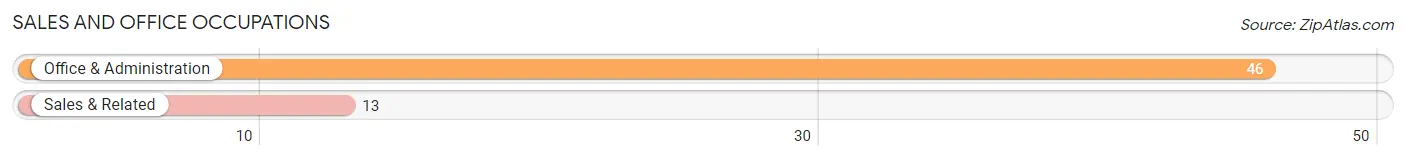
Sales and Office Occupations by Sex
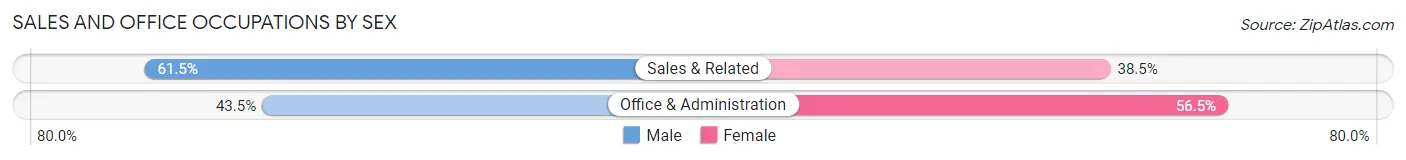
| Occupation | Male | Female |
| Sales & Related | 8 (61.5%) | 5 (38.5%) |
| Office & Administration | 20 (43.5%) | 26 (56.5%) |
| Total (Category) | 28 (47.5%) | 31 (52.5%) |
| Total (Overall) | 163 (57.0%) | 123 (43.0%) |
Natural Resources, Construction and Maintenance Occupations
The most common Natural Resources, Construction and Maintenance occupations in Protection are Installation, Maintenance & Repair (30 | 10.5%), Construction & Extraction (21 | 7.3%), and Farming, Fishing & Forestry (5 | 1.8%).
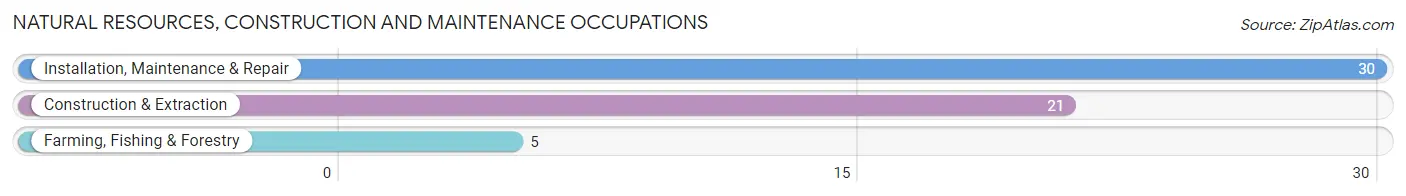
Natural Resources, Construction and Maintenance Occupations by Sex
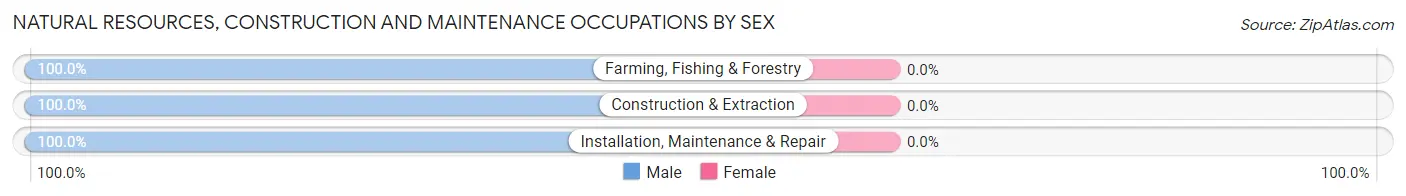
| Occupation | Male | Female |
| Farming, Fishing & Forestry | 5 (100.0%) | 0 (0.0%) |
| Construction & Extraction | 21 (100.0%) | 0 (0.0%) |
| Installation, Maintenance & Repair | 30 (100.0%) | 0 (0.0%) |
| Total (Category) | 56 (100.0%) | 0 (0.0%) |
| Total (Overall) | 163 (57.0%) | 123 (43.0%) |
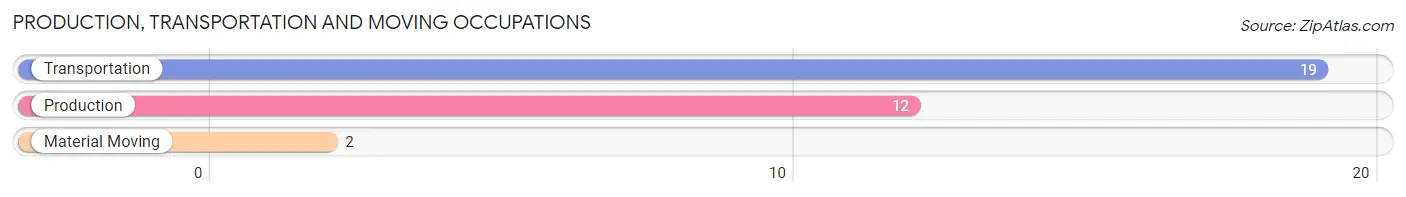
Production, Transportation and Moving Occupations
The most common Production, Transportation and Moving occupations in Protection are Transportation (19 | 6.6%), Production (12 | 4.2%), and Material Moving (2 | 0.7%).
Production, Transportation and Moving Occupations by Sex
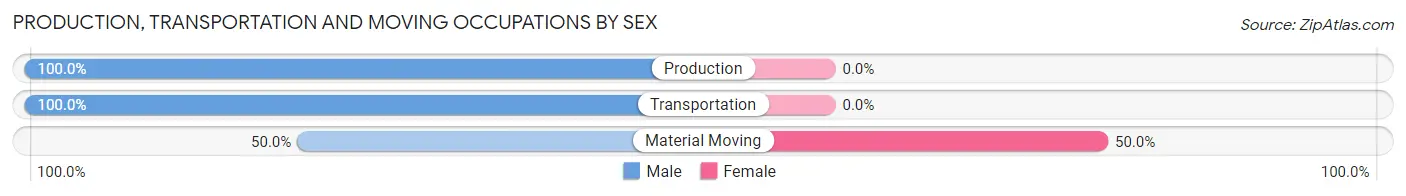
| Occupation | Male | Female |
| Production | 12 (100.0%) | 0 (0.0%) |
| Transportation | 19 (100.0%) | 0 (0.0%) |
| Material Moving | 1 (50.0%) | 1 (50.0%) |
| Total (Category) | 32 (97.0%) | 1 (3.0%) |
| Total (Overall) | 163 (57.0%) | 123 (43.0%) |
Employment Industries by Sex in Protection
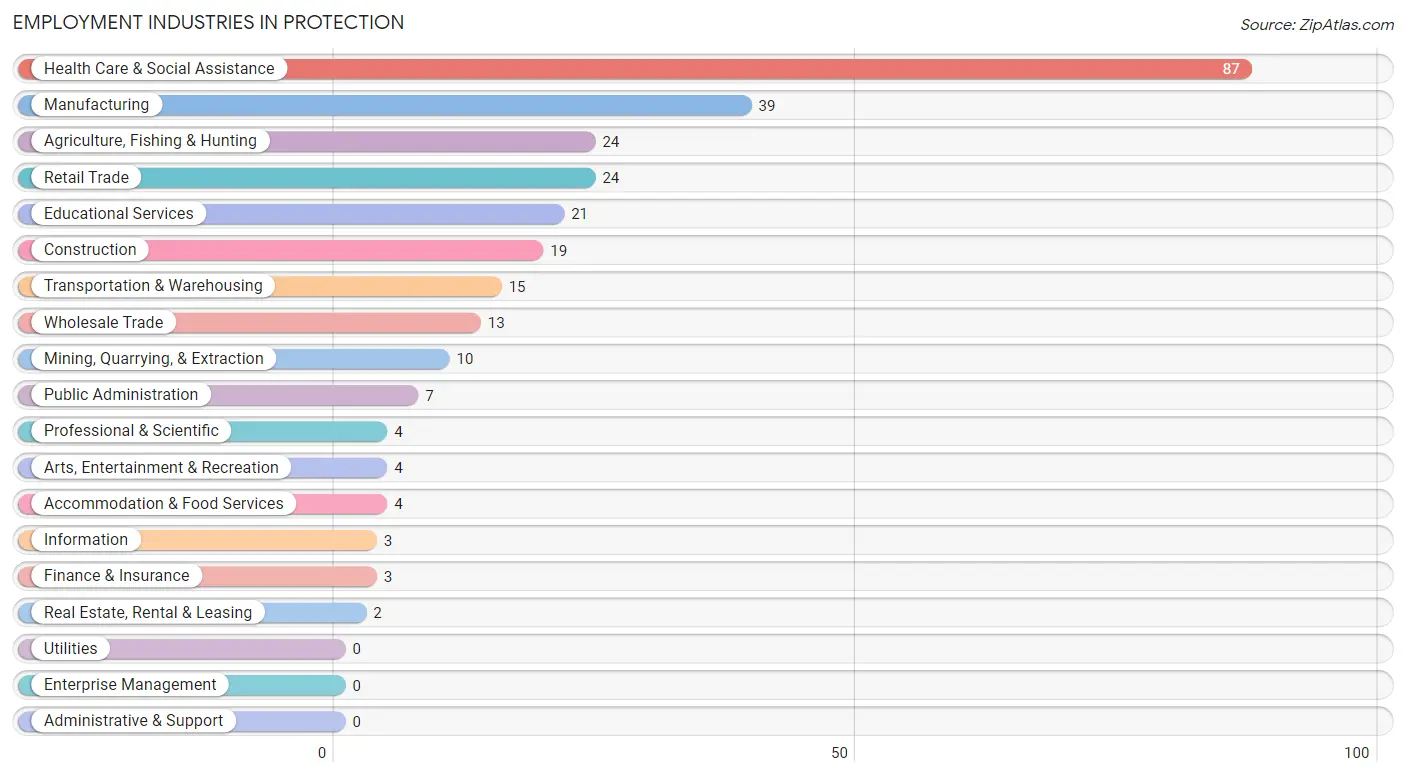
Employment Industries in Protection
The major employment industries in Protection include Health Care & Social Assistance (87 | 30.4%), Manufacturing (39 | 13.6%), Agriculture, Fishing & Hunting (24 | 8.4%), Retail Trade (24 | 8.4%), and Educational Services (21 | 7.3%).
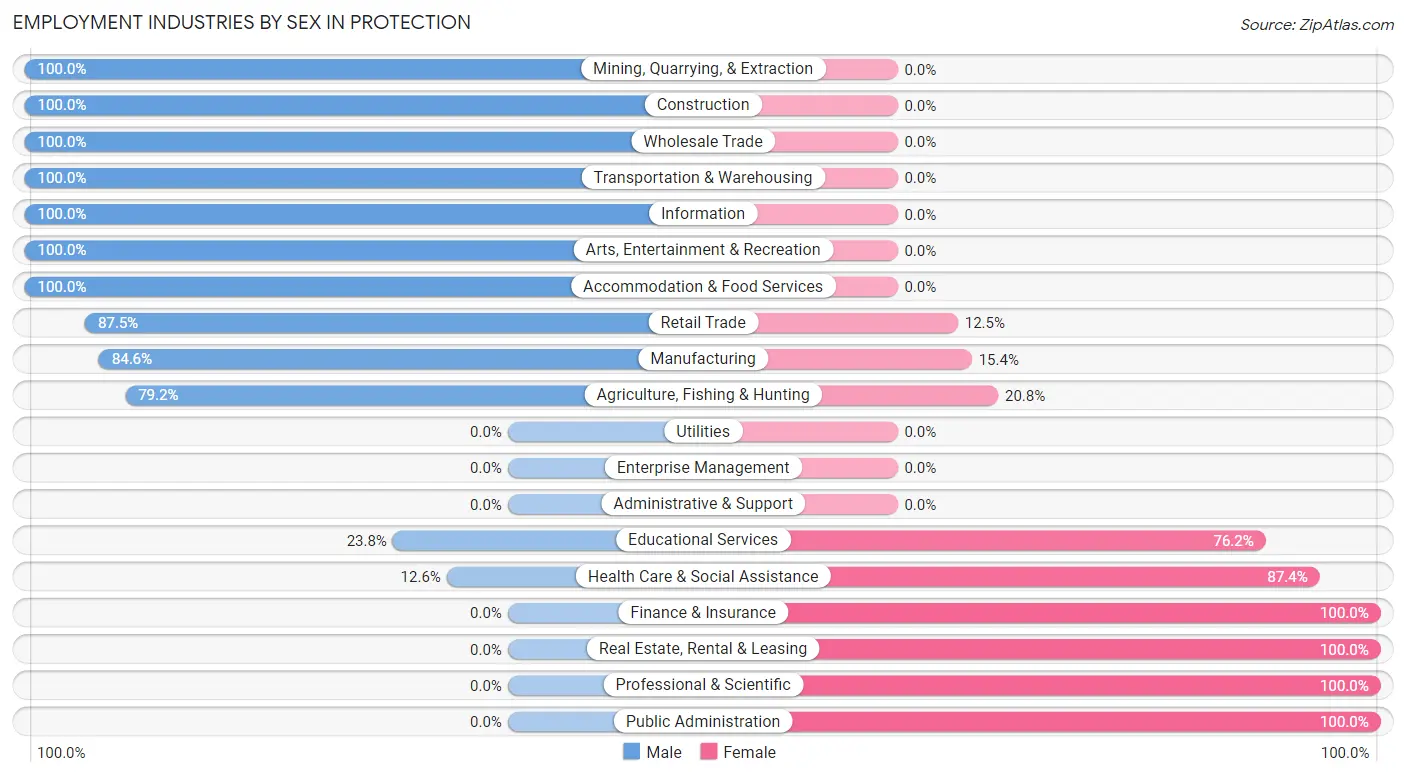
Employment Industries by Sex in Protection
The Protection industries that see more men than women are Mining, Quarrying, & Extraction (100.0%), Construction (100.0%), and Wholesale Trade (100.0%), whereas the industries that tend to have a higher number of women are Finance & Insurance (100.0%), Real Estate, Rental & Leasing (100.0%), and Professional & Scientific (100.0%).
| Industry | Male | Female |
| Agriculture, Fishing & Hunting | 19 (79.2%) | 5 (20.8%) |
| Mining, Quarrying, & Extraction | 10 (100.0%) | 0 (0.0%) |
| Construction | 19 (100.0%) | 0 (0.0%) |
| Manufacturing | 33 (84.6%) | 6 (15.4%) |
| Wholesale Trade | 13 (100.0%) | 0 (0.0%) |
| Retail Trade | 21 (87.5%) | 3 (12.5%) |
| Transportation & Warehousing | 15 (100.0%) | 0 (0.0%) |
| Utilities | 0 (0.0%) | 0 (0.0%) |
| Information | 3 (100.0%) | 0 (0.0%) |
| Finance & Insurance | 0 (0.0%) | 3 (100.0%) |
| Real Estate, Rental & Leasing | 0 (0.0%) | 2 (100.0%) |
| Professional & Scientific | 0 (0.0%) | 4 (100.0%) |
| Enterprise Management | 0 (0.0%) | 0 (0.0%) |
| Administrative & Support | 0 (0.0%) | 0 (0.0%) |
| Educational Services | 5 (23.8%) | 16 (76.2%) |
| Health Care & Social Assistance | 11 (12.6%) | 76 (87.4%) |
| Arts, Entertainment & Recreation | 4 (100.0%) | 0 (0.0%) |
| Accommodation & Food Services | 4 (100.0%) | 0 (0.0%) |
| Public Administration | 0 (0.0%) | 7 (100.0%) |
| Total | 163 (57.0%) | 123 (43.0%) |
Education in Protection
School Enrollment in Protection
The most common levels of schooling among the 75 students in Protection are high school (30 | 40.0%), middle school (17 | 22.7%), and graduate / professional (9 | 12.0%).
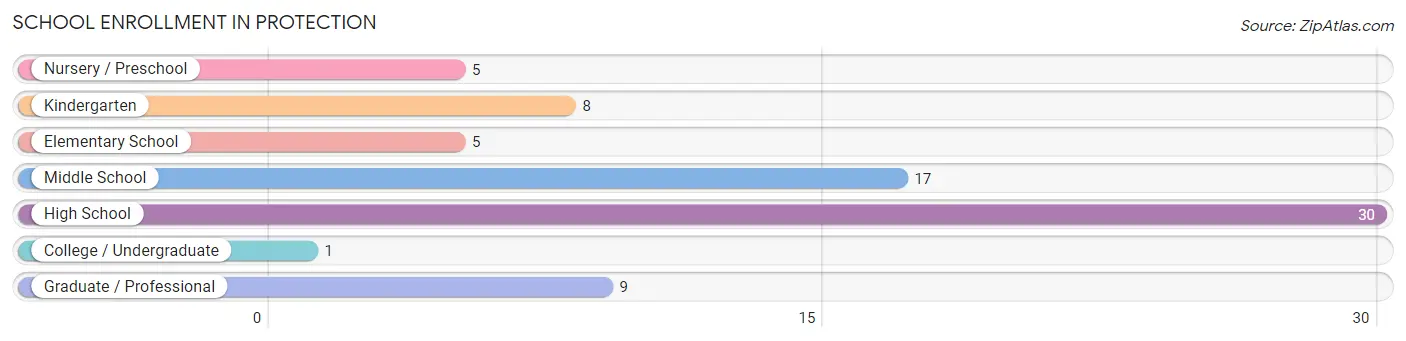
| School Level | # Students | % Students |
| Nursery / Preschool | 5 | 6.7% |
| Kindergarten | 8 | 10.7% |
| Elementary School | 5 | 6.7% |
| Middle School | 17 | 22.7% |
| High School | 30 | 40.0% |
| College / Undergraduate | 1 | 1.3% |
| Graduate / Professional | 9 | 12.0% |
| Total | 75 | 100.0% |
School Enrollment by Age by Funding Source in Protection
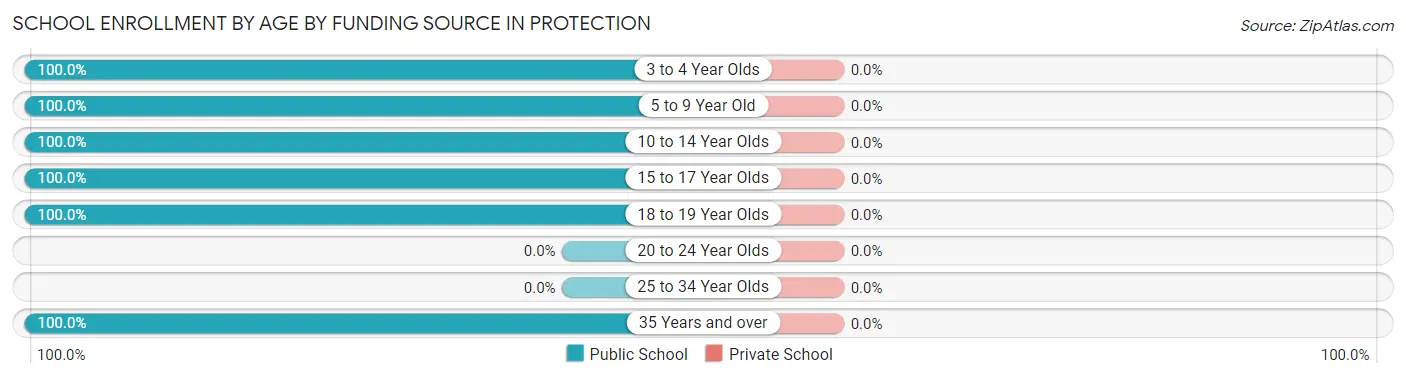
| Age Bracket | Public School | Private School |
| 3 to 4 Year Olds | 5 (100.0%) | 0 (0.0%) |
| 5 to 9 Year Old | 13 (100.0%) | 0 (0.0%) |
| 10 to 14 Year Olds | 20 (100.0%) | 0 (0.0%) |
| 15 to 17 Year Olds | 20 (100.0%) | 0 (0.0%) |
| 18 to 19 Year Olds | 5 (100.0%) | 0 (0.0%) |
| 20 to 24 Year Olds | 0 (0.0%) | 0 (0.0%) |
| 25 to 34 Year Olds | 0 (0.0%) | 0 (0.0%) |
| 35 Years and over | 12 (100.0%) | 0 (0.0%) |
| Total | 75 (100.0%) | 0 (0.0%) |
Educational Attainment by Field of Study in Protection
Business (21 | 19.8%), education (20 | 18.9%), communications (20 | 18.9%), science & technology (12 | 11.3%), and bio, nature & agricultural (10 | 9.4%) are the most common fields of study among 106 individuals in Protection who have obtained a bachelor's degree or higher.
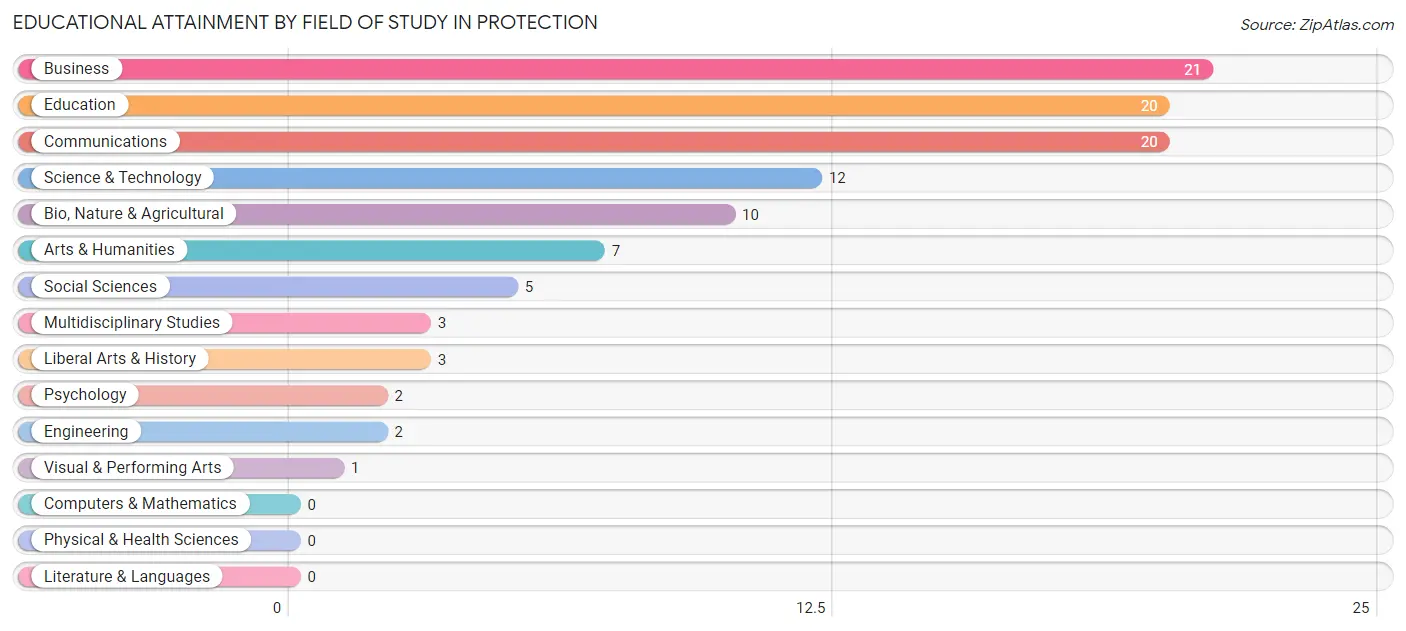
| Field of Study | # Graduates | % Graduates |
| Computers & Mathematics | 0 | 0.0% |
| Bio, Nature & Agricultural | 10 | 9.4% |
| Physical & Health Sciences | 0 | 0.0% |
| Psychology | 2 | 1.9% |
| Social Sciences | 5 | 4.7% |
| Engineering | 2 | 1.9% |
| Multidisciplinary Studies | 3 | 2.8% |
| Science & Technology | 12 | 11.3% |
| Business | 21 | 19.8% |
| Education | 20 | 18.9% |
| Literature & Languages | 0 | 0.0% |
| Liberal Arts & History | 3 | 2.8% |
| Visual & Performing Arts | 1 | 0.9% |
| Communications | 20 | 18.9% |
| Arts & Humanities | 7 | 6.6% |
| Total | 106 | 100.0% |
Transportation & Commute in Protection
Vehicle Availability by Sex in Protection
The most prevalent vehicle ownership categories in Protection are males with 2 vehicles (105, accounting for 64.4%) and females with 2 vehicles (52, making up 101.9%).
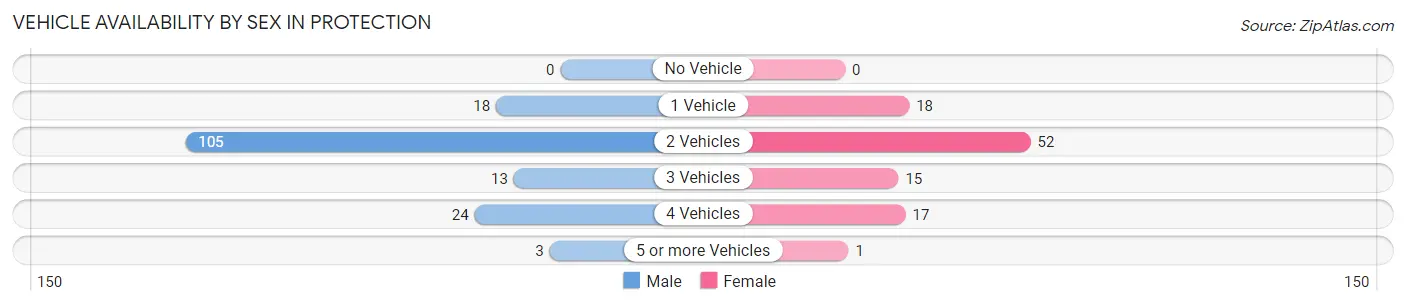
| Vehicles Available | Male | Female |
| No Vehicle | 0 (0.0%) | 0 (0.0%) |
| 1 Vehicle | 18 (11.0%) | 18 (17.5%) |
| 2 Vehicles | 105 (64.4%) | 52 (50.5%) |
| 3 Vehicles | 13 (8.0%) | 15 (14.6%) |
| 4 Vehicles | 24 (14.7%) | 17 (16.5%) |
| 5 or more Vehicles | 3 (1.8%) | 1 (1.0%) |
| Total | 163 (100.0%) | 103 (100.0%) |
Commute Time in Protection
The most frequently occuring commute durations in Protection are less than 5 minutes (53 commuters, 21.4%), 20 to 24 minutes (45 commuters, 18.1%), and 5 to 9 minutes (43 commuters, 17.3%).
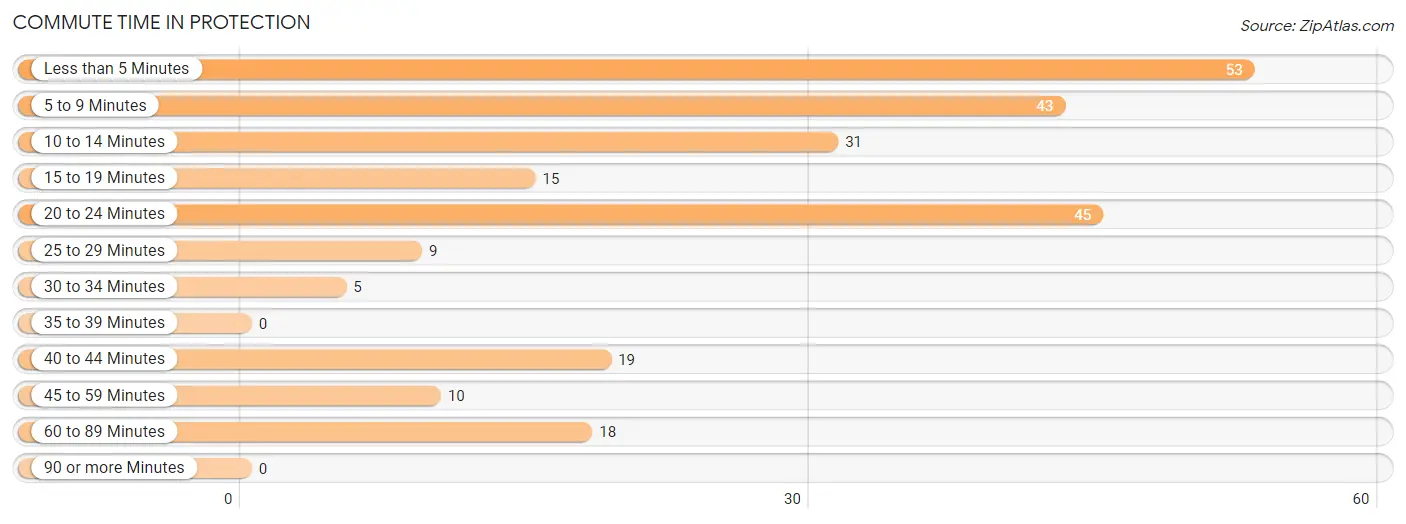
| Commute Time | # Commuters | % Commuters |
| Less than 5 Minutes | 53 | 21.4% |
| 5 to 9 Minutes | 43 | 17.3% |
| 10 to 14 Minutes | 31 | 12.5% |
| 15 to 19 Minutes | 15 | 6.0% |
| 20 to 24 Minutes | 45 | 18.1% |
| 25 to 29 Minutes | 9 | 3.6% |
| 30 to 34 Minutes | 5 | 2.0% |
| 35 to 39 Minutes | 0 | 0.0% |
| 40 to 44 Minutes | 19 | 7.7% |
| 45 to 59 Minutes | 10 | 4.0% |
| 60 to 89 Minutes | 18 | 7.3% |
| 90 or more Minutes | 0 | 0.0% |
Commute Time by Sex in Protection
The most common commute times in Protection are 5 to 9 minutes (29 commuters, 19.2%) for males and less than 5 minutes (30 commuters, 30.9%) for females.
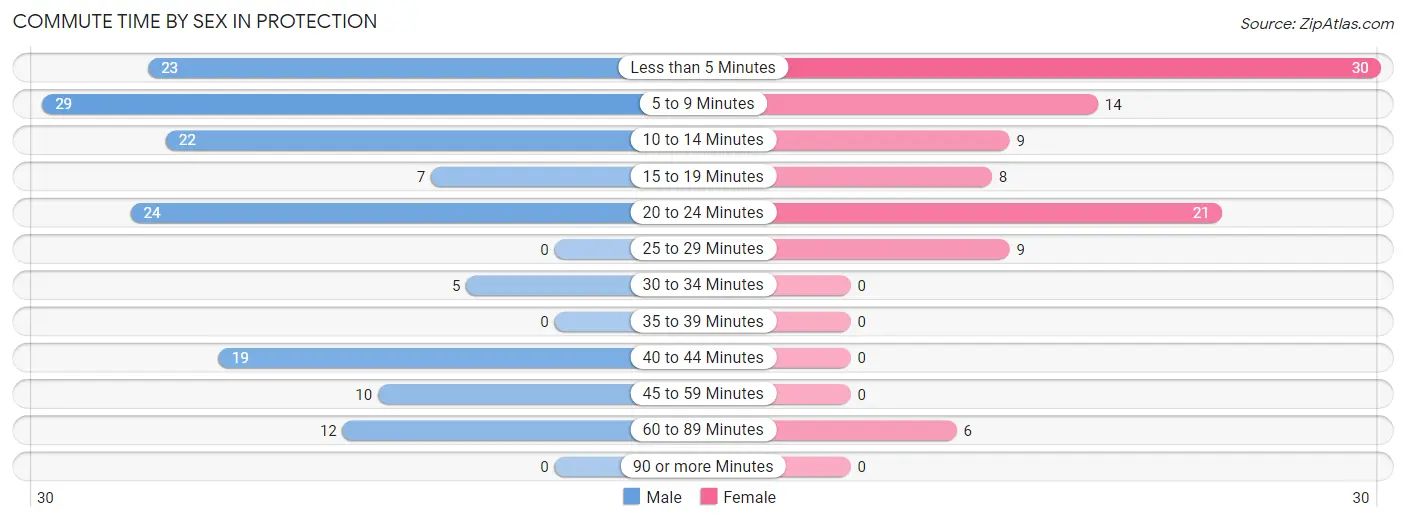
| Commute Time | Male | Female |
| Less than 5 Minutes | 23 (15.2%) | 30 (30.9%) |
| 5 to 9 Minutes | 29 (19.2%) | 14 (14.4%) |
| 10 to 14 Minutes | 22 (14.6%) | 9 (9.3%) |
| 15 to 19 Minutes | 7 (4.6%) | 8 (8.3%) |
| 20 to 24 Minutes | 24 (15.9%) | 21 (21.6%) |
| 25 to 29 Minutes | 0 (0.0%) | 9 (9.3%) |
| 30 to 34 Minutes | 5 (3.3%) | 0 (0.0%) |
| 35 to 39 Minutes | 0 (0.0%) | 0 (0.0%) |
| 40 to 44 Minutes | 19 (12.6%) | 0 (0.0%) |
| 45 to 59 Minutes | 10 (6.6%) | 0 (0.0%) |
| 60 to 89 Minutes | 12 (8.0%) | 6 (6.2%) |
| 90 or more Minutes | 0 (0.0%) | 0 (0.0%) |
Time of Departure to Work by Sex in Protection
The most frequent times of departure to work in Protection are 7:00 AM to 7:29 AM (40, 26.5%) for males and 4:00 PM to 11:59 PM (20, 20.6%) for females.
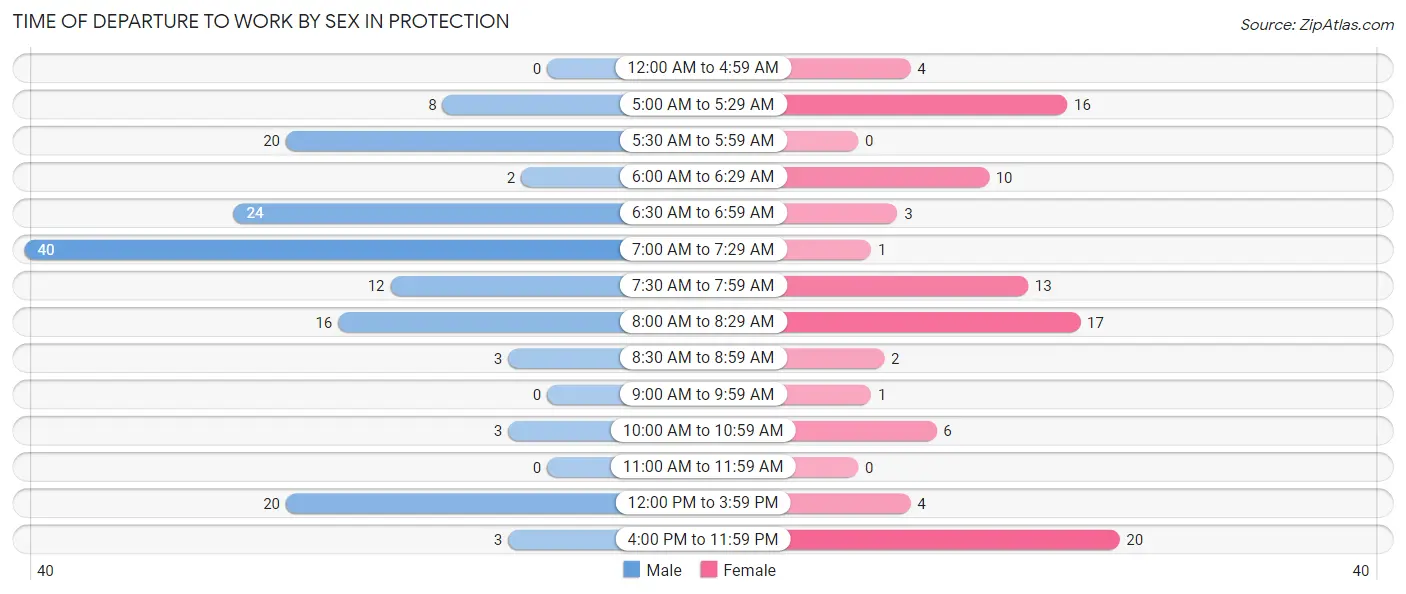
| Time of Departure | Male | Female |
| 12:00 AM to 4:59 AM | 0 (0.0%) | 4 (4.1%) |
| 5:00 AM to 5:29 AM | 8 (5.3%) | 16 (16.5%) |
| 5:30 AM to 5:59 AM | 20 (13.3%) | 0 (0.0%) |
| 6:00 AM to 6:29 AM | 2 (1.3%) | 10 (10.3%) |
| 6:30 AM to 6:59 AM | 24 (15.9%) | 3 (3.1%) |
| 7:00 AM to 7:29 AM | 40 (26.5%) | 1 (1.0%) |
| 7:30 AM to 7:59 AM | 12 (8.0%) | 13 (13.4%) |
| 8:00 AM to 8:29 AM | 16 (10.6%) | 17 (17.5%) |
| 8:30 AM to 8:59 AM | 3 (2.0%) | 2 (2.1%) |
| 9:00 AM to 9:59 AM | 0 (0.0%) | 1 (1.0%) |
| 10:00 AM to 10:59 AM | 3 (2.0%) | 6 (6.2%) |
| 11:00 AM to 11:59 AM | 0 (0.0%) | 0 (0.0%) |
| 12:00 PM to 3:59 PM | 20 (13.3%) | 4 (4.1%) |
| 4:00 PM to 11:59 PM | 3 (2.0%) | 20 (20.6%) |
| Total | 151 (100.0%) | 97 (100.0%) |
Housing Occupancy in Protection
Occupancy by Ownership in Protection
Of the total 234 dwellings in Protection, owner-occupied units account for 189 (80.8%), while renter-occupied units make up 45 (19.2%).
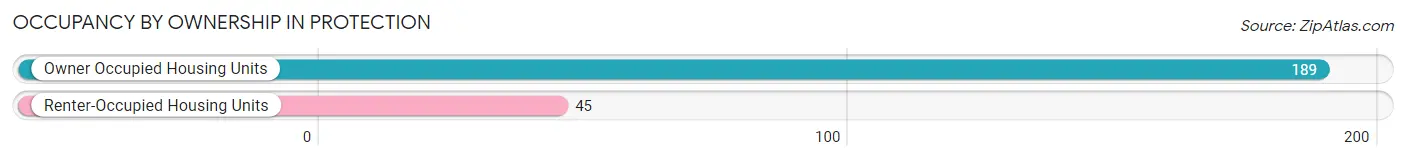
| Occupancy | # Housing Units | % Housing Units |
| Owner Occupied Housing Units | 189 | 80.8% |
| Renter-Occupied Housing Units | 45 | 19.2% |
| Total Occupied Housing Units | 234 | 100.0% |
Occupancy by Household Size in Protection
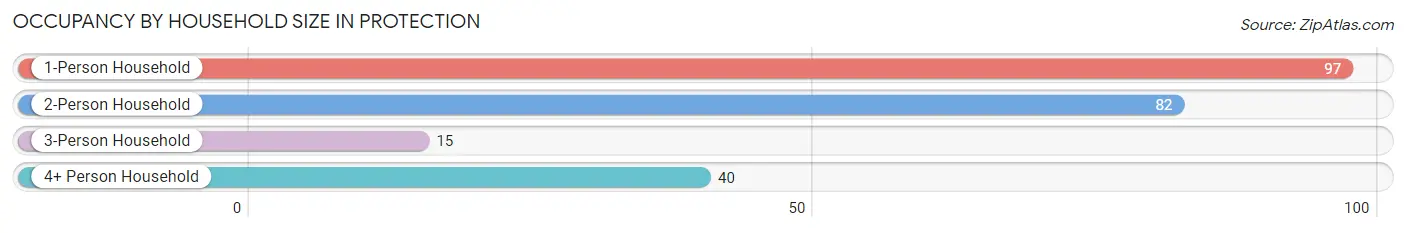
| Household Size | # Housing Units | % Housing Units |
| 1-Person Household | 97 | 41.4% |
| 2-Person Household | 82 | 35.0% |
| 3-Person Household | 15 | 6.4% |
| 4+ Person Household | 40 | 17.1% |
| Total Housing Units | 234 | 100.0% |
Occupancy by Ownership by Household Size in Protection
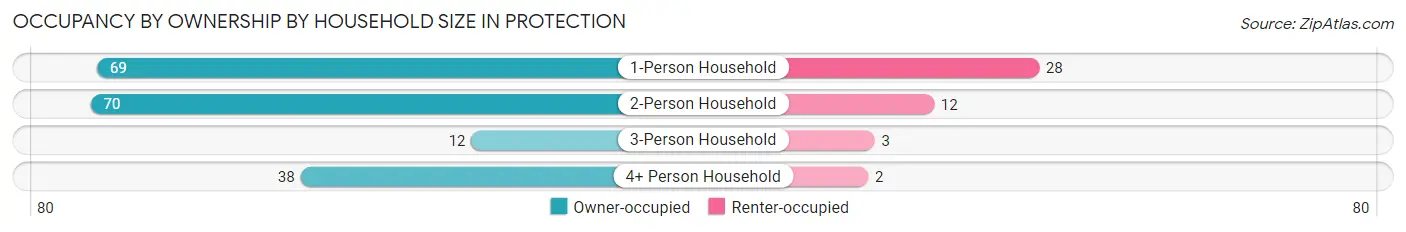
| Household Size | Owner-occupied | Renter-occupied |
| 1-Person Household | 69 (71.1%) | 28 (28.9%) |
| 2-Person Household | 70 (85.4%) | 12 (14.6%) |
| 3-Person Household | 12 (80.0%) | 3 (20.0%) |
| 4+ Person Household | 38 (95.0%) | 2 (5.0%) |
| Total Housing Units | 189 (80.8%) | 45 (19.2%) |
Occupancy by Educational Attainment in Protection
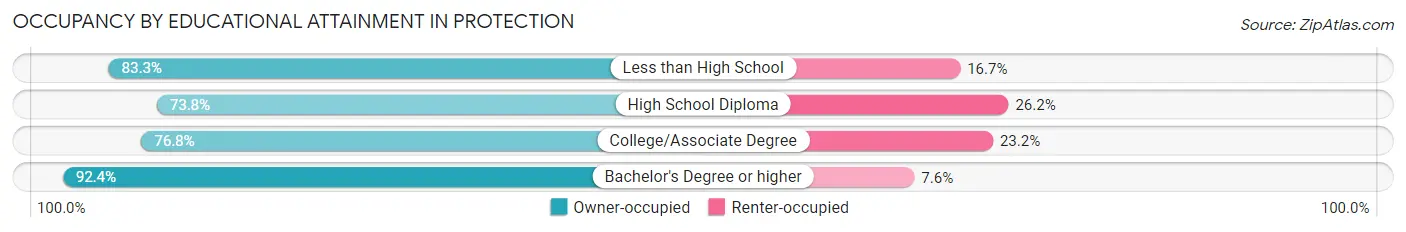
| Household Size | Owner-occupied | Renter-occupied |
| Less than High School | 10 (83.3%) | 2 (16.7%) |
| High School Diploma | 45 (73.8%) | 16 (26.2%) |
| College/Associate Degree | 73 (76.8%) | 22 (23.2%) |
| Bachelor's Degree or higher | 61 (92.4%) | 5 (7.6%) |
Occupancy by Age of Householder in Protection
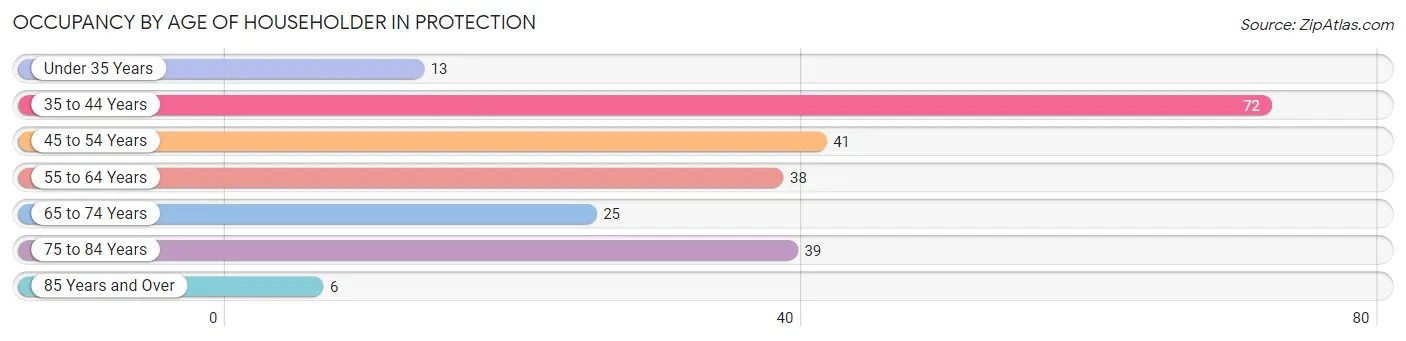
| Age Bracket | # Households | % Households |
| Under 35 Years | 13 | 5.6% |
| 35 to 44 Years | 72 | 30.8% |
| 45 to 54 Years | 41 | 17.5% |
| 55 to 64 Years | 38 | 16.2% |
| 65 to 74 Years | 25 | 10.7% |
| 75 to 84 Years | 39 | 16.7% |
| 85 Years and Over | 6 | 2.6% |
| Total | 234 | 100.0% |
Housing Finances in Protection
Median Income by Occupancy in Protection
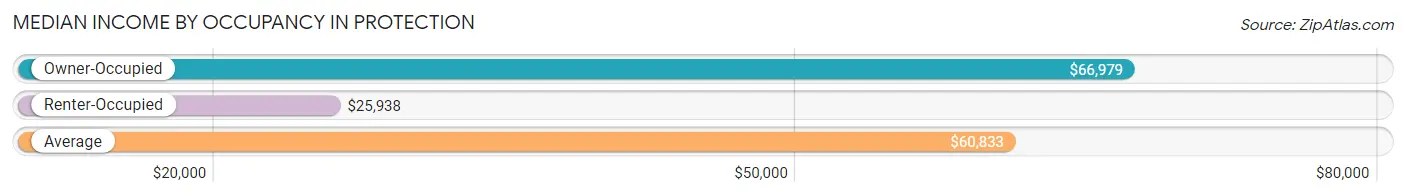
| Occupancy Type | # Households | Median Income |
| Owner-Occupied | 189 (80.8%) | $66,979 |
| Renter-Occupied | 45 (19.2%) | $25,938 |
| Average | 234 (100.0%) | $60,833 |
Occupancy by Householder Income Bracket in Protection
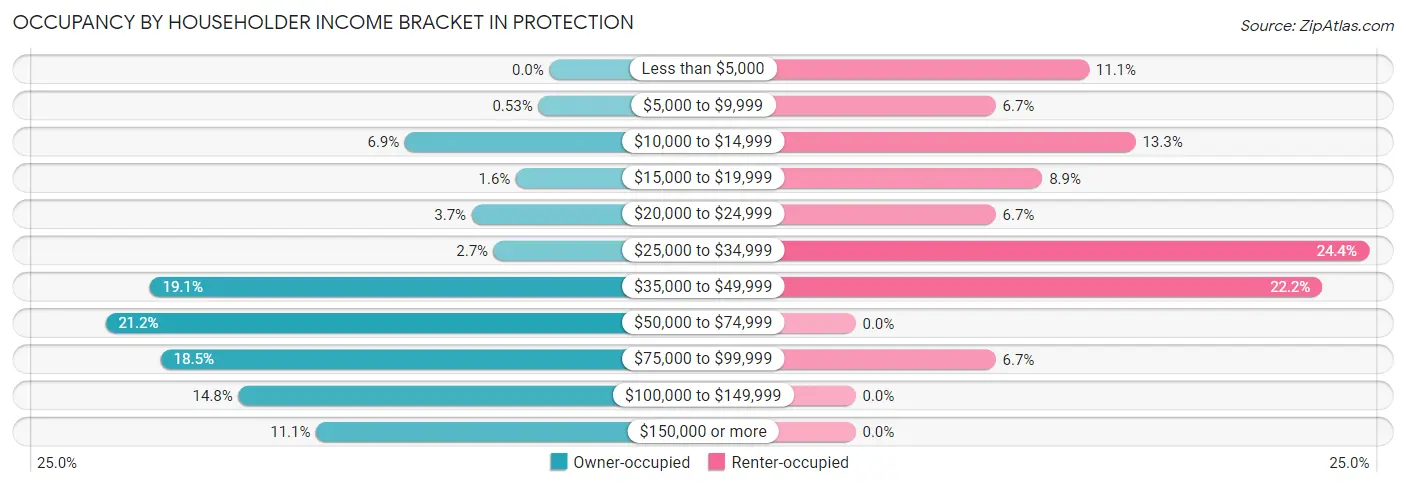
| Income Bracket | Owner-occupied | Renter-occupied |
| Less than $5,000 | 0 (0.0%) | 5 (11.1%) |
| $5,000 to $9,999 | 1 (0.5%) | 3 (6.7%) |
| $10,000 to $14,999 | 13 (6.9%) | 6 (13.3%) |
| $15,000 to $19,999 | 3 (1.6%) | 4 (8.9%) |
| $20,000 to $24,999 | 7 (3.7%) | 3 (6.7%) |
| $25,000 to $34,999 | 5 (2.6%) | 11 (24.4%) |
| $35,000 to $49,999 | 36 (19.1%) | 10 (22.2%) |
| $50,000 to $74,999 | 40 (21.2%) | 0 (0.0%) |
| $75,000 to $99,999 | 35 (18.5%) | 3 (6.7%) |
| $100,000 to $149,999 | 28 (14.8%) | 0 (0.0%) |
| $150,000 or more | 21 (11.1%) | 0 (0.0%) |
| Total | 189 (100.0%) | 45 (100.0%) |
Monthly Housing Cost Tiers in Protection
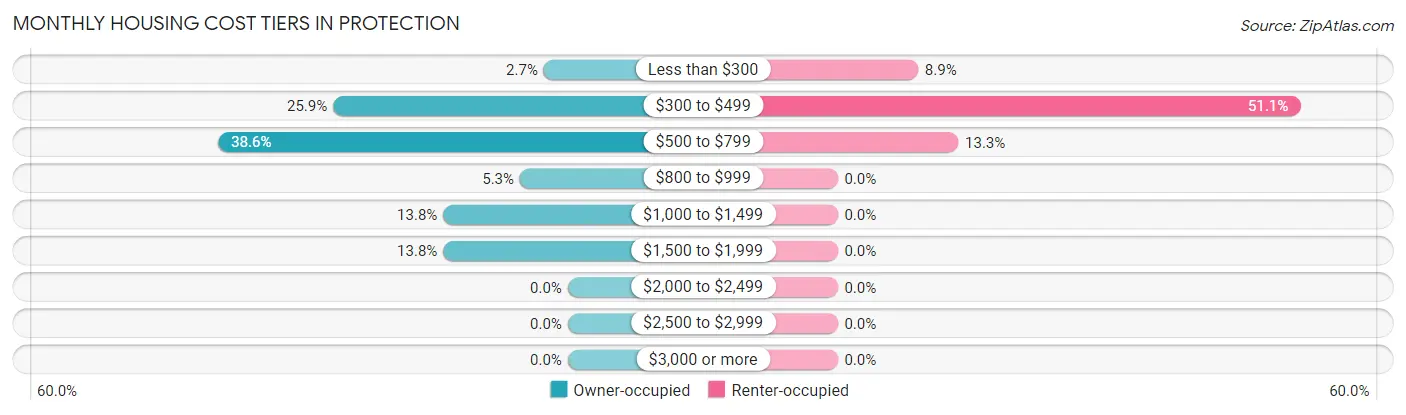
| Monthly Cost | Owner-occupied | Renter-occupied |
| Less than $300 | 5 (2.6%) | 4 (8.9%) |
| $300 to $499 | 49 (25.9%) | 23 (51.1%) |
| $500 to $799 | 73 (38.6%) | 6 (13.3%) |
| $800 to $999 | 10 (5.3%) | 0 (0.0%) |
| $1,000 to $1,499 | 26 (13.8%) | 0 (0.0%) |
| $1,500 to $1,999 | 26 (13.8%) | 0 (0.0%) |
| $2,000 to $2,499 | 0 (0.0%) | 0 (0.0%) |
| $2,500 to $2,999 | 0 (0.0%) | 0 (0.0%) |
| $3,000 or more | 0 (0.0%) | 0 (0.0%) |
| Total | 189 (100.0%) | 45 (100.0%) |
Physical Housing Characteristics in Protection
Housing Structures in Protection
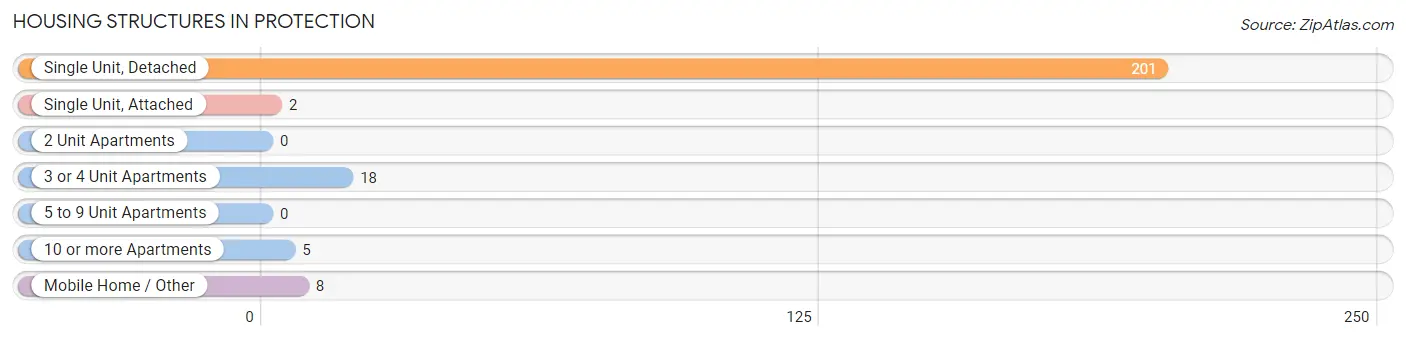
| Structure Type | # Housing Units | % Housing Units |
| Single Unit, Detached | 201 | 85.9% |
| Single Unit, Attached | 2 | 0.9% |
| 2 Unit Apartments | 0 | 0.0% |
| 3 or 4 Unit Apartments | 18 | 7.7% |
| 5 to 9 Unit Apartments | 0 | 0.0% |
| 10 or more Apartments | 5 | 2.1% |
| Mobile Home / Other | 8 | 3.4% |
| Total | 234 | 100.0% |
Housing Structures by Occupancy in Protection
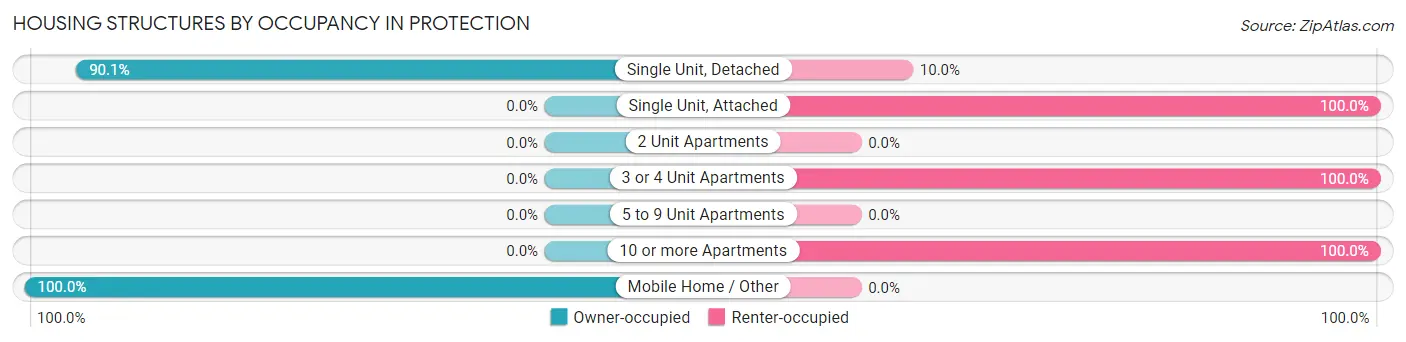
| Structure Type | Owner-occupied | Renter-occupied |
| Single Unit, Detached | 181 (90.0%) | 20 (10.0%) |
| Single Unit, Attached | 0 (0.0%) | 2 (100.0%) |
| 2 Unit Apartments | 0 (0.0%) | 0 (0.0%) |
| 3 or 4 Unit Apartments | 0 (0.0%) | 18 (100.0%) |
| 5 to 9 Unit Apartments | 0 (0.0%) | 0 (0.0%) |
| 10 or more Apartments | 0 (0.0%) | 5 (100.0%) |
| Mobile Home / Other | 8 (100.0%) | 0 (0.0%) |
| Total | 189 (80.8%) | 45 (19.2%) |
Housing Structures by Number of Rooms in Protection
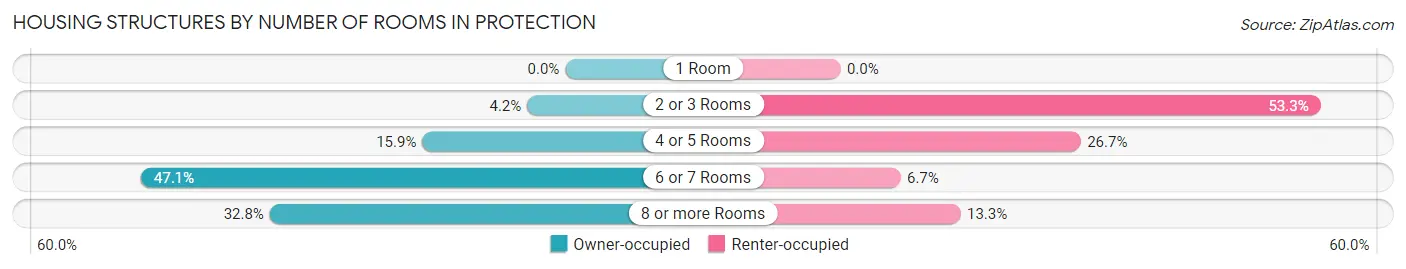
| Number of Rooms | Owner-occupied | Renter-occupied |
| 1 Room | 0 (0.0%) | 0 (0.0%) |
| 2 or 3 Rooms | 8 (4.2%) | 24 (53.3%) |
| 4 or 5 Rooms | 30 (15.9%) | 12 (26.7%) |
| 6 or 7 Rooms | 89 (47.1%) | 3 (6.7%) |
| 8 or more Rooms | 62 (32.8%) | 6 (13.3%) |
| Total | 189 (100.0%) | 45 (100.0%) |
Housing Structure by Heating Type in Protection
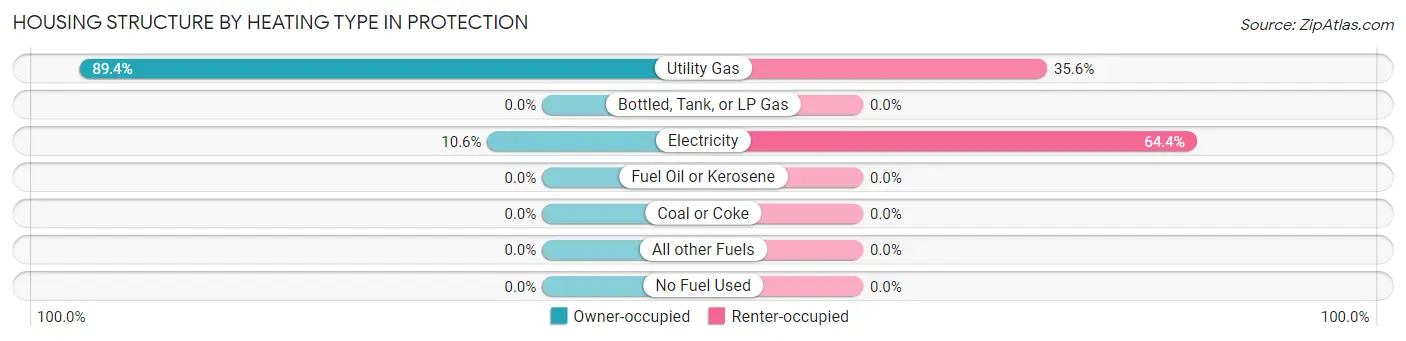
| Heating Type | Owner-occupied | Renter-occupied |
| Utility Gas | 169 (89.4%) | 16 (35.6%) |
| Bottled, Tank, or LP Gas | 0 (0.0%) | 0 (0.0%) |
| Electricity | 20 (10.6%) | 29 (64.4%) |
| Fuel Oil or Kerosene | 0 (0.0%) | 0 (0.0%) |
| Coal or Coke | 0 (0.0%) | 0 (0.0%) |
| All other Fuels | 0 (0.0%) | 0 (0.0%) |
| No Fuel Used | 0 (0.0%) | 0 (0.0%) |
| Total | 189 (100.0%) | 45 (100.0%) |
Household Vehicle Usage in Protection
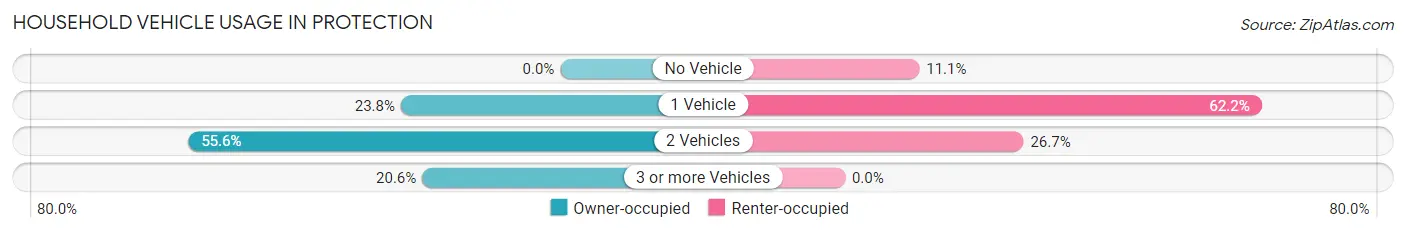
| Vehicles per Household | Owner-occupied | Renter-occupied |
| No Vehicle | 0 (0.0%) | 5 (11.1%) |
| 1 Vehicle | 45 (23.8%) | 28 (62.2%) |
| 2 Vehicles | 105 (55.6%) | 12 (26.7%) |
| 3 or more Vehicles | 39 (20.6%) | 0 (0.0%) |
| Total | 189 (100.0%) | 45 (100.0%) |
Real Estate & Mortgages in Protection
Real Estate and Mortgage Overview in Protection
| Characteristic | Without Mortgage | With Mortgage |
| Housing Units | 95 | 94 |
| Median Property Value | $42,100 | $57,900 |
| Median Household Income | $57,083 | $12 |
| Monthly Housing Costs | $450 | $0 |
| Real Estate Taxes | $892 | $0 |
Property Value by Mortgage Status in Protection
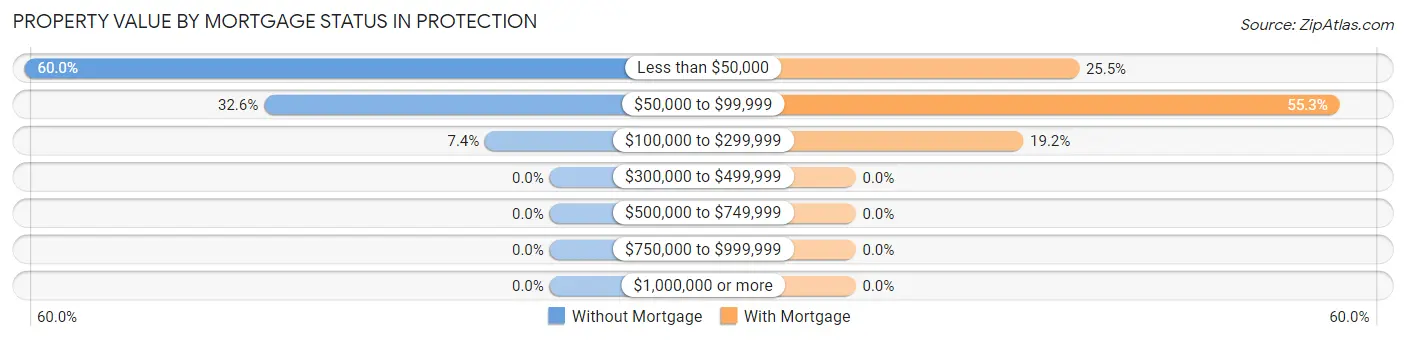
| Property Value | Without Mortgage | With Mortgage |
| Less than $50,000 | 57 (60.0%) | 24 (25.5%) |
| $50,000 to $99,999 | 31 (32.6%) | 52 (55.3%) |
| $100,000 to $299,999 | 7 (7.4%) | 18 (19.2%) |
| $300,000 to $499,999 | 0 (0.0%) | 0 (0.0%) |
| $500,000 to $749,999 | 0 (0.0%) | 0 (0.0%) |
| $750,000 to $999,999 | 0 (0.0%) | 0 (0.0%) |
| $1,000,000 or more | 0 (0.0%) | 0 (0.0%) |
| Total | 95 (100.0%) | 94 (100.0%) |
Household Income by Mortgage Status in Protection
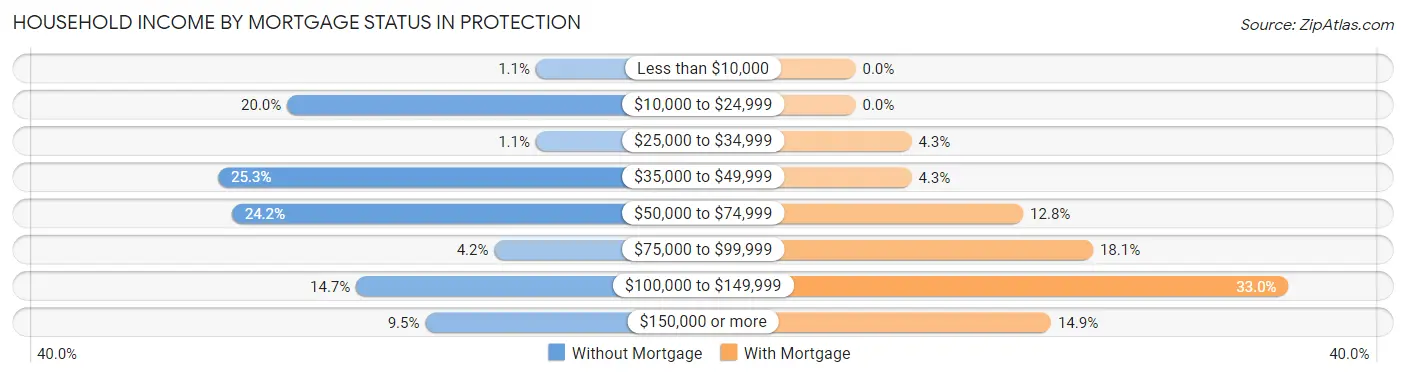
| Household Income | Without Mortgage | With Mortgage |
| Less than $10,000 | 1 (1.1%) | 0 (0.0%) |
| $10,000 to $24,999 | 19 (20.0%) | 0 (0.0%) |
| $25,000 to $34,999 | 1 (1.1%) | 4 (4.3%) |
| $35,000 to $49,999 | 24 (25.3%) | 4 (4.3%) |
| $50,000 to $74,999 | 23 (24.2%) | 12 (12.8%) |
| $75,000 to $99,999 | 4 (4.2%) | 17 (18.1%) |
| $100,000 to $149,999 | 14 (14.7%) | 31 (33.0%) |
| $150,000 or more | 9 (9.5%) | 14 (14.9%) |
| Total | 95 (100.0%) | 94 (100.0%) |
Property Value to Household Income Ratio in Protection
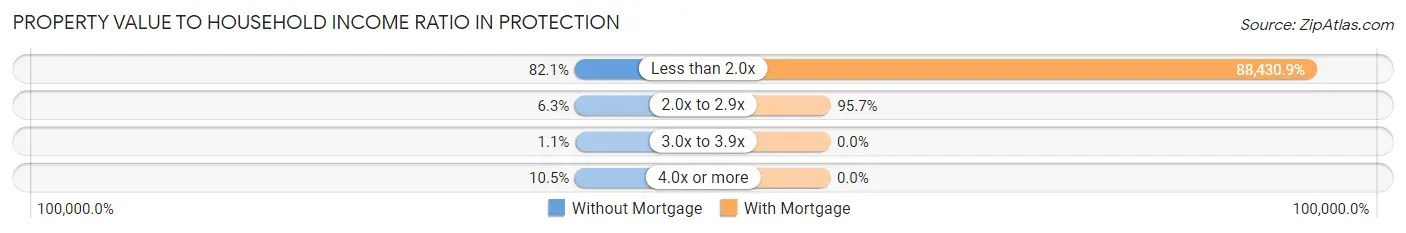
| Value-to-Income Ratio | Without Mortgage | With Mortgage |
| Less than 2.0x | 78 (82.1%) | 83,125 (88,430.8%) |
| 2.0x to 2.9x | 6 (6.3%) | 90 (95.7%) |
| 3.0x to 3.9x | 1 (1.1%) | 0 (0.0%) |
| 4.0x or more | 10 (10.5%) | 0 (0.0%) |
| Total | 95 (100.0%) | 94 (100.0%) |
Real Estate Taxes by Mortgage Status in Protection
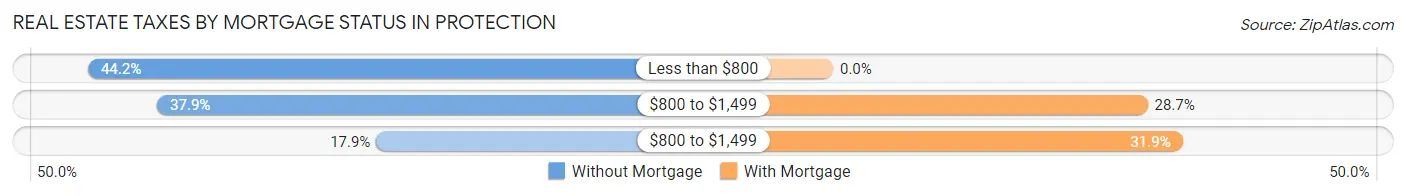
| Property Taxes | Without Mortgage | With Mortgage |
| Less than $800 | 42 (44.2%) | 0 (0.0%) |
| $800 to $1,499 | 36 (37.9%) | 27 (28.7%) |
| $800 to $1,499 | 17 (17.9%) | 30 (31.9%) |
| Total | 95 (100.0%) | 94 (100.0%) |
Health & Disability in Protection
Health Insurance Coverage by Age in Protection
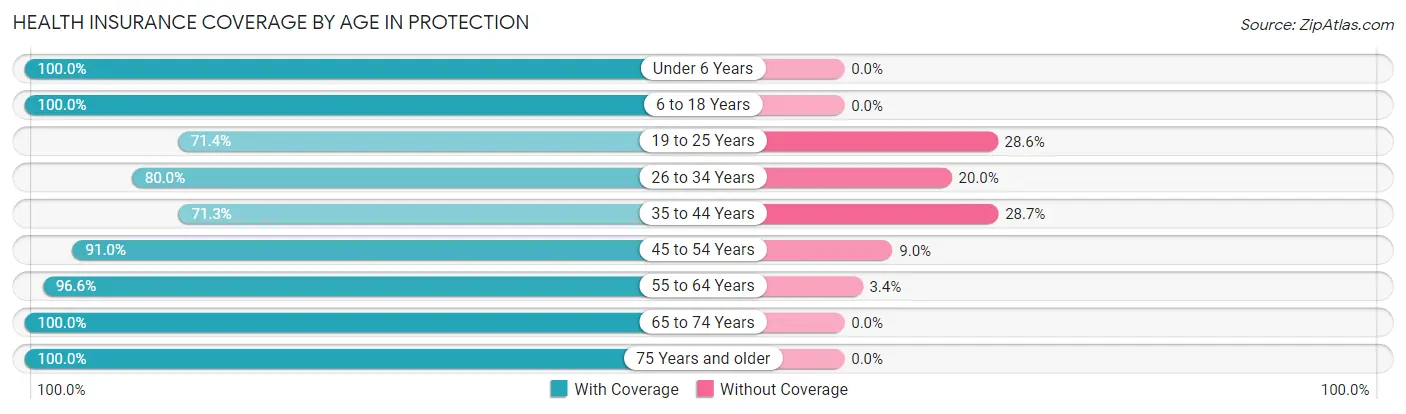
| Age Bracket | With Coverage | Without Coverage |
| Under 6 Years | 30 (100.0%) | 0 (0.0%) |
| 6 to 18 Years | 89 (100.0%) | 0 (0.0%) |
| 19 to 25 Years | 10 (71.4%) | 4 (28.6%) |
| 26 to 34 Years | 12 (80.0%) | 3 (20.0%) |
| 35 to 44 Years | 82 (71.3%) | 33 (28.7%) |
| 45 to 54 Years | 61 (91.0%) | 6 (9.0%) |
| 55 to 64 Years | 57 (96.6%) | 2 (3.4%) |
| 65 to 74 Years | 43 (100.0%) | 0 (0.0%) |
| 75 Years and older | 53 (100.0%) | 0 (0.0%) |
| Total | 437 (90.1%) | 48 (9.9%) |
Health Insurance Coverage by Citizenship Status in Protection
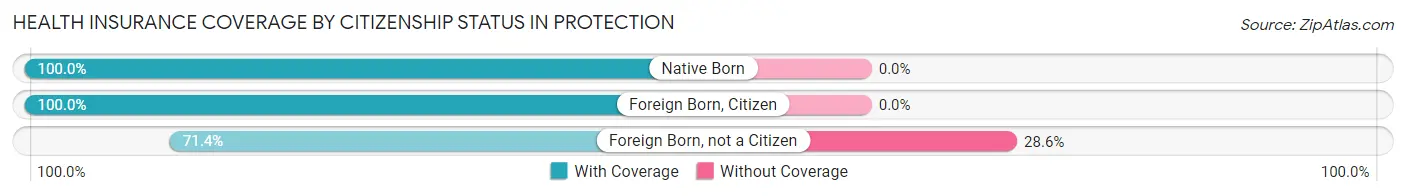
| Citizenship Status | With Coverage | Without Coverage |
| Native Born | 30 (100.0%) | 0 (0.0%) |
| Foreign Born, Citizen | 89 (100.0%) | 0 (0.0%) |
| Foreign Born, not a Citizen | 10 (71.4%) | 4 (28.6%) |
Health Insurance Coverage by Household Income in Protection
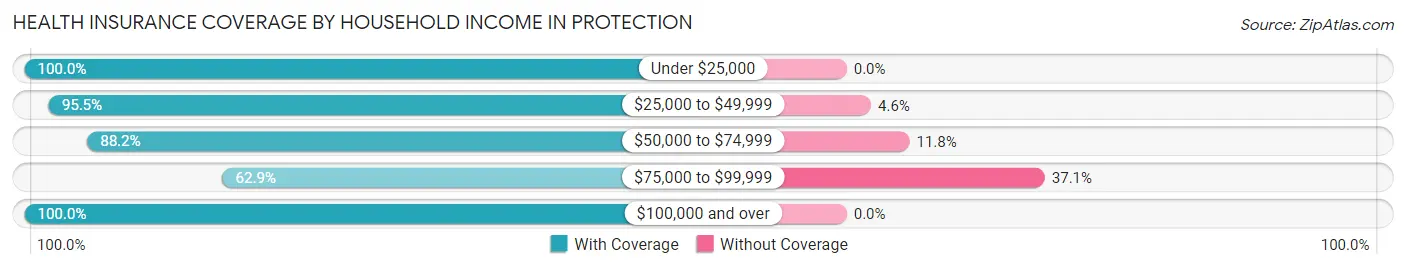
| Household Income | With Coverage | Without Coverage |
| Under $25,000 | 55 (100.0%) | 0 (0.0%) |
| $25,000 to $49,999 | 84 (95.5%) | 4 (4.5%) |
| $50,000 to $74,999 | 60 (88.2%) | 8 (11.8%) |
| $75,000 to $99,999 | 61 (62.9%) | 36 (37.1%) |
| $100,000 and over | 177 (100.0%) | 0 (0.0%) |
Public vs Private Health Insurance Coverage by Age in Protection
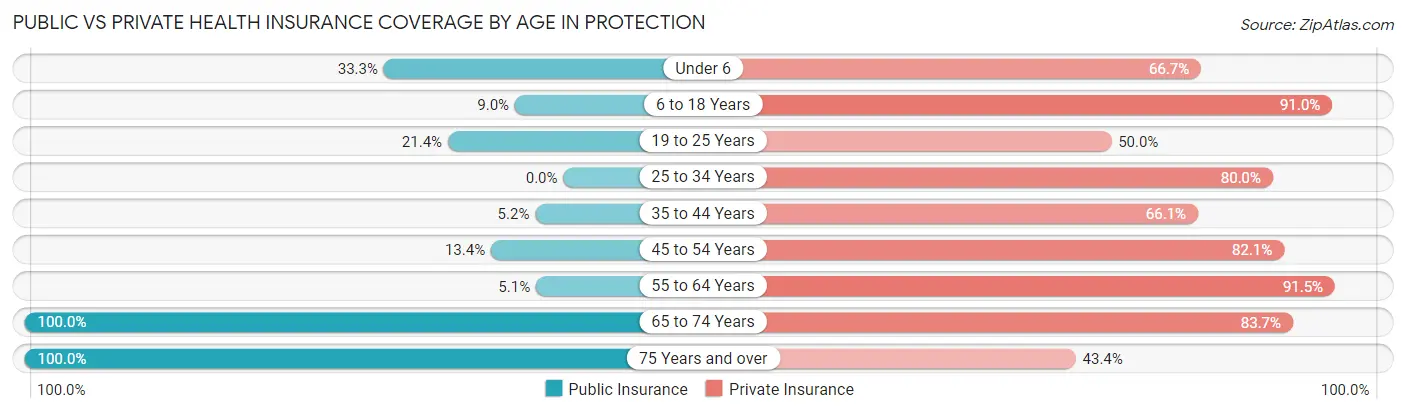
| Age Bracket | Public Insurance | Private Insurance |
| Under 6 | 10 (33.3%) | 20 (66.7%) |
| 6 to 18 Years | 8 (9.0%) | 81 (91.0%) |
| 19 to 25 Years | 3 (21.4%) | 7 (50.0%) |
| 25 to 34 Years | 0 (0.0%) | 12 (80.0%) |
| 35 to 44 Years | 6 (5.2%) | 76 (66.1%) |
| 45 to 54 Years | 9 (13.4%) | 55 (82.1%) |
| 55 to 64 Years | 3 (5.1%) | 54 (91.5%) |
| 65 to 74 Years | 43 (100.0%) | 36 (83.7%) |
| 75 Years and over | 53 (100.0%) | 23 (43.4%) |
| Total | 135 (27.8%) | 364 (75.0%) |
Disability Status by Sex by Age in Protection
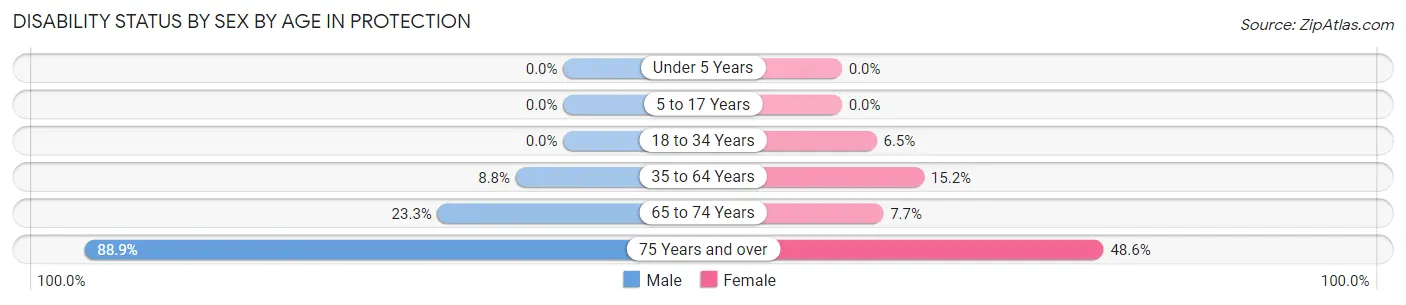
| Age Bracket | Male | Female |
| Under 5 Years | 0 (0.0%) | 0 (0.0%) |
| 5 to 17 Years | 0 (0.0%) | 0 (0.0%) |
| 18 to 34 Years | 0 (0.0%) | 2 (6.5%) |
| 35 to 64 Years | 12 (8.8%) | 16 (15.2%) |
| 65 to 74 Years | 7 (23.3%) | 1 (7.7%) |
| 75 Years and over | 16 (88.9%) | 17 (48.6%) |
Disability Class by Sex by Age in Protection
Disability Class: Hearing Difficulty
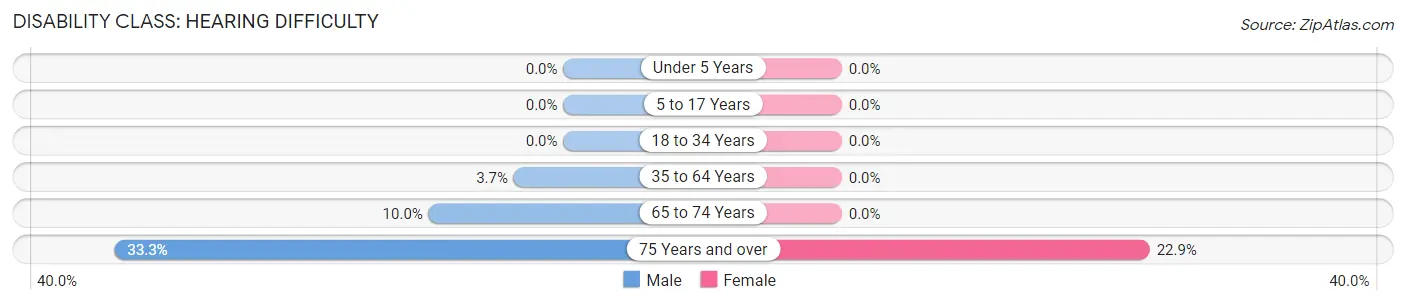
| Age Bracket | Male | Female |
| Under 5 Years | 0 (0.0%) | 0 (0.0%) |
| 5 to 17 Years | 0 (0.0%) | 0 (0.0%) |
| 18 to 34 Years | 0 (0.0%) | 0 (0.0%) |
| 35 to 64 Years | 5 (3.7%) | 0 (0.0%) |
| 65 to 74 Years | 3 (10.0%) | 0 (0.0%) |
| 75 Years and over | 6 (33.3%) | 8 (22.9%) |
Disability Class: Vision Difficulty
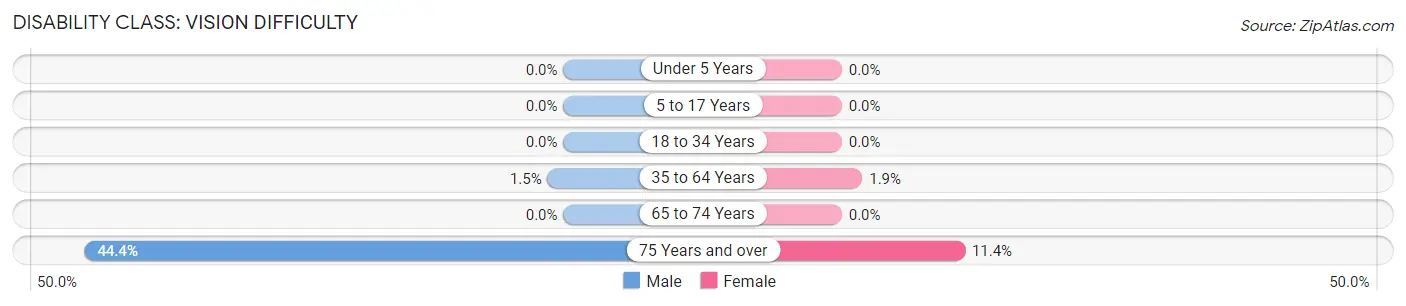
| Age Bracket | Male | Female |
| Under 5 Years | 0 (0.0%) | 0 (0.0%) |
| 5 to 17 Years | 0 (0.0%) | 0 (0.0%) |
| 18 to 34 Years | 0 (0.0%) | 0 (0.0%) |
| 35 to 64 Years | 2 (1.5%) | 2 (1.9%) |
| 65 to 74 Years | 0 (0.0%) | 0 (0.0%) |
| 75 Years and over | 8 (44.4%) | 4 (11.4%) |
Disability Class: Cognitive Difficulty
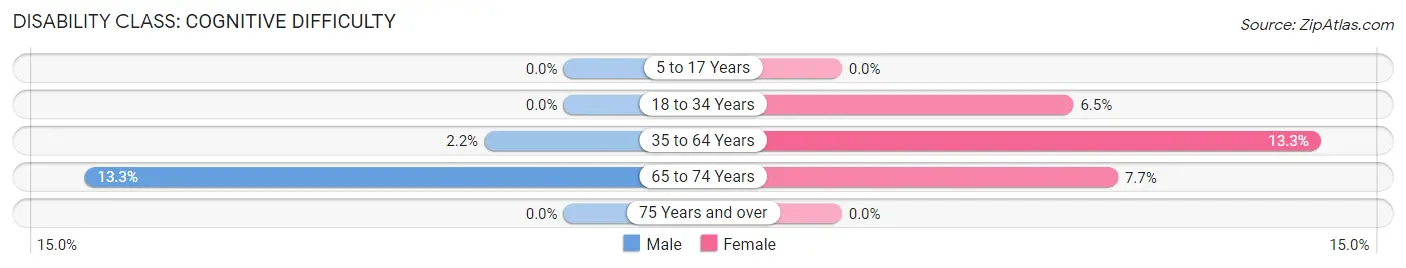
| Age Bracket | Male | Female |
| 5 to 17 Years | 0 (0.0%) | 0 (0.0%) |
| 18 to 34 Years | 0 (0.0%) | 2 (6.5%) |
| 35 to 64 Years | 3 (2.2%) | 14 (13.3%) |
| 65 to 74 Years | 4 (13.3%) | 1 (7.7%) |
| 75 Years and over | 0 (0.0%) | 0 (0.0%) |
Disability Class: Ambulatory Difficulty

| Age Bracket | Male | Female |
| 5 to 17 Years | 0 (0.0%) | 0 (0.0%) |
| 18 to 34 Years | 0 (0.0%) | 0 (0.0%) |
| 35 to 64 Years | 1 (0.7%) | 12 (11.4%) |
| 65 to 74 Years | 3 (10.0%) | 1 (7.7%) |
| 75 Years and over | 12 (66.7%) | 11 (31.4%) |
Disability Class: Self-Care Difficulty
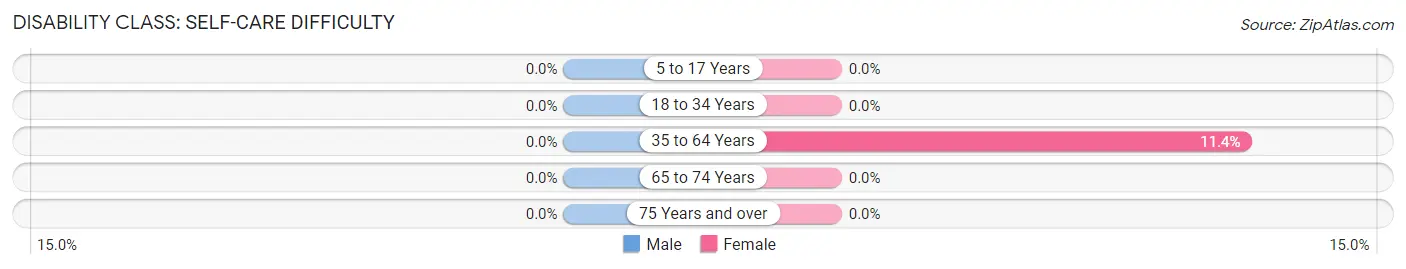
| Age Bracket | Male | Female |
| 5 to 17 Years | 0 (0.0%) | 0 (0.0%) |
| 18 to 34 Years | 0 (0.0%) | 0 (0.0%) |
| 35 to 64 Years | 0 (0.0%) | 12 (11.4%) |
| 65 to 74 Years | 0 (0.0%) | 0 (0.0%) |
| 75 Years and over | 0 (0.0%) | 0 (0.0%) |
Technology Access in Protection
Computing Device Access in Protection
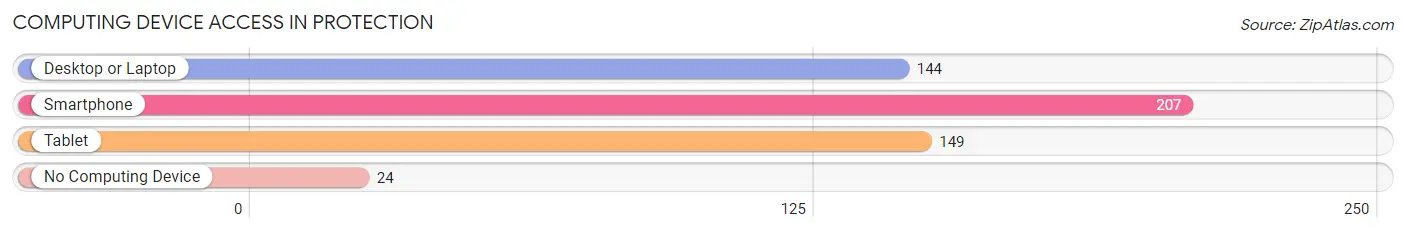
| Device Type | # Households | % Households |
| Desktop or Laptop | 144 | 61.5% |
| Smartphone | 207 | 88.5% |
| Tablet | 149 | 63.7% |
| No Computing Device | 24 | 10.3% |
| Total | 234 | 100.0% |
Internet Access in Protection
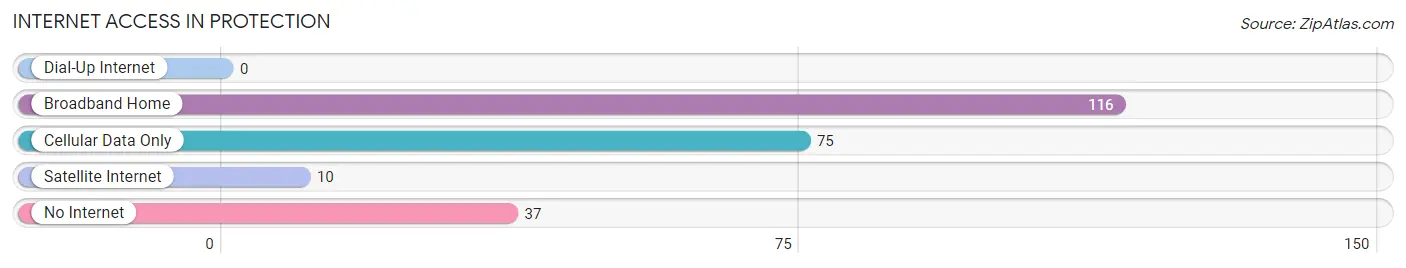
| Internet Type | # Households | % Households |
| Dial-Up Internet | 0 | 0.0% |
| Broadband Home | 116 | 49.6% |
| Cellular Data Only | 75 | 32.1% |
| Satellite Internet | 10 | 4.3% |
| No Internet | 37 | 15.8% |
| Total | 234 | 100.0% |
Protection Summary
Kansas is a state located in the Midwestern United States. It is bordered by Nebraska to the north, Missouri to the east, Oklahoma to the south, and Colorado to the west. Kansas is the 15th most populous state in the United States, with an estimated population of 2,913,314 in 2019.
Geography
Kansas is located in the Great Plains region of the United States. It is the 15th largest state in the country, with an area of 82,278 square miles. The state is divided into 105 counties and has 628 incorporated cities and towns. The highest point in Kansas is Mount Sunflower, which has an elevation of 4,041 feet. The state is home to several rivers, including the Kansas, Arkansas, and Missouri rivers.
History
Kansas was first inhabited by Native American tribes, including the Kansa, Osage, and Pawnee. The first European settlers arrived in the area in the early 19th century. In 1854, the Kansas-Nebraska Act opened the area to settlement by white settlers. This led to a period of conflict between pro-slavery and anti-slavery settlers, known as “Bleeding Kansas.” In 1861, Kansas was admitted to the Union as a free state.
During the late 19th and early 20th centuries, Kansas experienced a period of rapid growth and development. The state’s economy was largely based on agriculture, and it became a major producer of wheat and other grains. In the 1920s, the state’s economy shifted to manufacturing, and Kansas became a major producer of aircraft and other industrial products.
Economy
Kansas has a diverse economy, with a mix of agriculture, manufacturing, and services. The state’s largest industries are agriculture, manufacturing, and services. Agriculture is the state’s largest industry, accounting for about 20% of the state’s total economic output. The state is a major producer of wheat, corn, sorghum, soybeans, and other crops.
Manufacturing is the second-largest industry in Kansas, accounting for about 17% of the state’s total economic output. The state is a major producer of aircraft, automobiles, and other industrial products. Services are the third-largest industry in Kansas, accounting for about 16% of the state’s total economic output.
Demographics
As of 2019, the population of Kansas was estimated to be 2,913,314. The state has a population density of 35.3 people per square mile. The largest city in Kansas is Wichita, with an estimated population of 389,255. The state’s capital is Topeka, with an estimated population of 127,473.
The racial makeup of Kansas is 87.2% White, 6.3% Black or African American, 1.7% Asian, 0.7% Native American, and 3.1% from other races. The state’s Hispanic or Latino population is 8.9%. The median household income in Kansas is $54,935, and the median home value is $153,400.
Kansas is a state with a rich history and a diverse economy. It is home to a variety of industries, including agriculture, manufacturing, and services. The state’s population is diverse, with a mix of racial and ethnic backgrounds. Kansas is a great place to live and work, and it offers a variety of opportunities for its residents.
Common Questions
What is Per Capita Income in Protection?
Per Capita income in Protection is $31,569.
What is the Median Family Income in Protection?
Median Family Income in Protection is $86,250.
What is the Median Household income in Protection?
Median Household Income in Protection is $60,833.
What is Income or Wage Gap in Protection?
Income or Wage Gap in Protection is 56.0%.
Women in Protection earn 44.0 cents for every dollar earned by a man.
What is Inequality or Gini Index in Protection?
Inequality or Gini Index in Protection is 0.40.
What is the Total Population of Protection?
Total Population of Protection is 529.
What is the Total Male Population of Protection?
Total Male Population of Protection is 279.
What is the Total Female Population of Protection?
Total Female Population of Protection is 250.
What is the Ratio of Males per 100 Females in Protection?
There are 111.60 Males per 100 Females in Protection.
What is the Ratio of Females per 100 Males in Protection?
There are 89.61 Females per 100 Males in Protection.
What is the Median Population Age in Protection?
Median Population Age in Protection is 45.1 Years.
What is the Average Family Size in Protection
Average Family Size in Protection is 2.8 People.
What is the Average Household Size in Protection
Average Household Size in Protection is 2.1 People.
How Large is the Labor Force in Protection?
There are 288 People in the Labor Forcein in Protection.
What is the Percentage of People in the Labor Force in Protection?
64.7% of People are in the Labor Force in Protection.
What is the Unemployment Rate in Protection?
Unemployment Rate in Protection is 0.7%.