Otis, KS Map & Demographics
Otis Map
Otis Overview
$21,074
PER CAPITA INCOME
$63,750
AVG FAMILY INCOME
$52,708
AVG HOUSEHOLD INCOME
5.0%
WAGE / INCOME GAP [ % ]
95.0¢/ $1
WAGE / INCOME GAP [ $ ]
$6,520
FAMILY INCOME DEFICIT
0.37
INEQUALITY / GINI INDEX
375
TOTAL POPULATION
169
MALE POPULATION
206
FEMALE POPULATION
82.04
MALES / 100 FEMALES
121.89
FEMALES / 100 MALES
32.4
MEDIAN AGE
4.9
AVG FAMILY SIZE
3.6
AVG HOUSEHOLD SIZE
147
LABOR FORCE [ PEOPLE ]
60.2%
PERCENT IN LABOR FORCE
6.1%
UNEMPLOYMENT RATE
Otis Zip Codes
Income in Otis
Income Overview in Otis
Per Capita Income in Otis is $21,074, while median incomes of families and households are $63,750 and $52,708 respectively.
| Characteristic | Number | Measure |
| Per Capita Income | 375 | $21,074 |
| Median Family Income | 65 | $63,750 |
| Mean Family Income | 65 | $67,168 |
| Median Household Income | 105 | $52,708 |
| Mean Household Income | 105 | $54,421 |
| Income Deficit | 65 | $6,520 |
| Wage / Income Gap (%) | 375 | 5.02% |
| Wage / Income Gap ($) | 375 | 94.98¢ per $1 |
| Gini / Inequality Index | 375 | 0.37 |
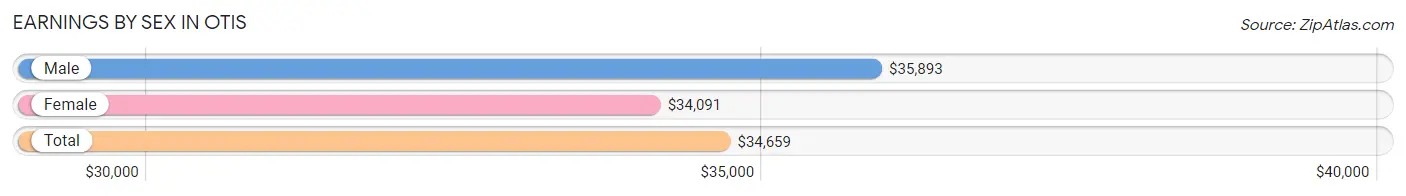
Earnings by Sex in Otis
Average Earnings in Otis are $34,659, $35,893 for men and $34,091 for women, a difference of 5.0%.
| Sex | Number | Average Earnings |
| Male | 63 (38.2%) | $35,893 |
| Female | 102 (61.8%) | $34,091 |
| Total | 165 (100.0%) | $34,659 |
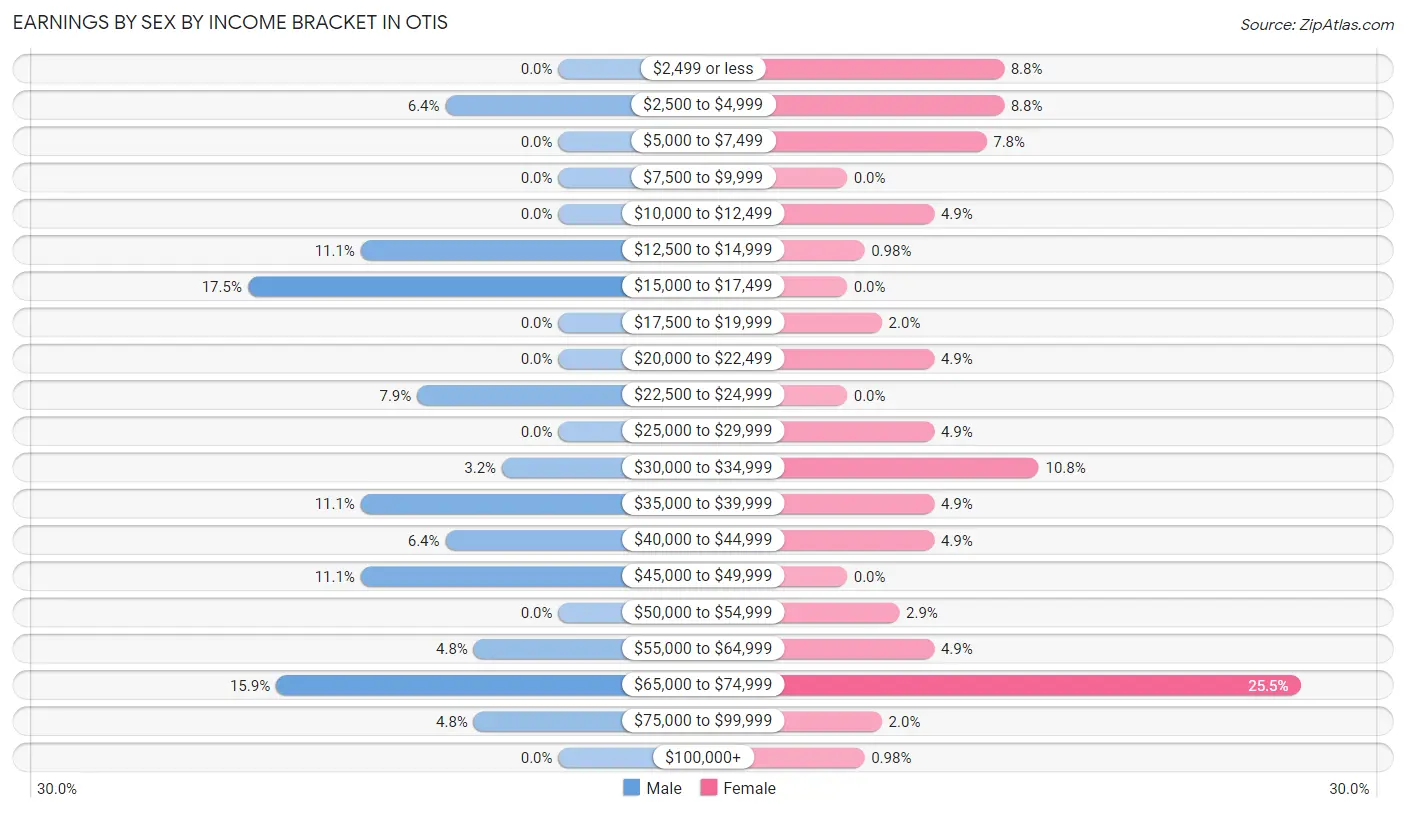
Earnings by Sex by Income Bracket in Otis
The most common earnings brackets in Otis are $15,000 to $17,499 for men (11 | 17.5%) and $65,000 to $74,999 for women (26 | 25.5%).
| Income | Male | Female |
| $2,499 or less | 0 (0.0%) | 9 (8.8%) |
| $2,500 to $4,999 | 4 (6.4%) | 9 (8.8%) |
| $5,000 to $7,499 | 0 (0.0%) | 8 (7.8%) |
| $7,500 to $9,999 | 0 (0.0%) | 0 (0.0%) |
| $10,000 to $12,499 | 0 (0.0%) | 5 (4.9%) |
| $12,500 to $14,999 | 7 (11.1%) | 1 (1.0%) |
| $15,000 to $17,499 | 11 (17.5%) | 0 (0.0%) |
| $17,500 to $19,999 | 0 (0.0%) | 2 (2.0%) |
| $20,000 to $22,499 | 0 (0.0%) | 5 (4.9%) |
| $22,500 to $24,999 | 5 (7.9%) | 0 (0.0%) |
| $25,000 to $29,999 | 0 (0.0%) | 5 (4.9%) |
| $30,000 to $34,999 | 2 (3.2%) | 11 (10.8%) |
| $35,000 to $39,999 | 7 (11.1%) | 5 (4.9%) |
| $40,000 to $44,999 | 4 (6.4%) | 5 (4.9%) |
| $45,000 to $49,999 | 7 (11.1%) | 0 (0.0%) |
| $50,000 to $54,999 | 0 (0.0%) | 3 (2.9%) |
| $55,000 to $64,999 | 3 (4.8%) | 5 (4.9%) |
| $65,000 to $74,999 | 10 (15.9%) | 26 (25.5%) |
| $75,000 to $99,999 | 3 (4.8%) | 2 (2.0%) |
| $100,000+ | 0 (0.0%) | 1 (1.0%) |
| Total | 63 (100.0%) | 102 (100.0%) |
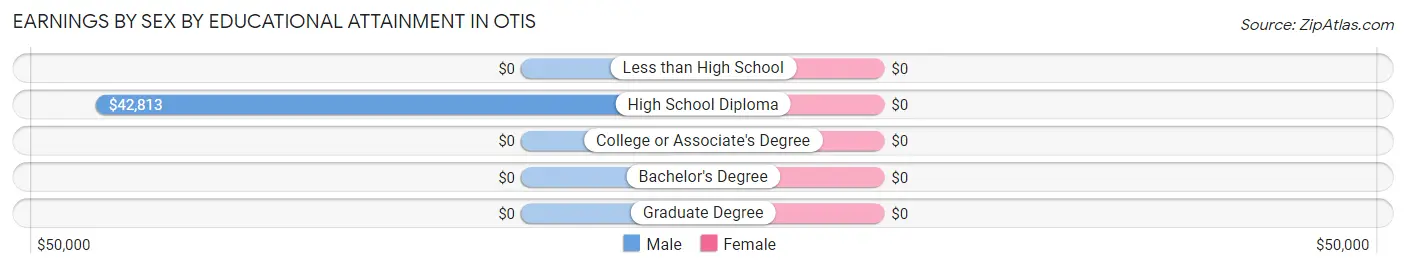
Earnings by Sex by Educational Attainment in Otis
| Educational Attainment | Male Income | Female Income |
| Less than High School | - | - |
| High School Diploma | $42,813 | $0 |
| College or Associate's Degree | - | - |
| Bachelor's Degree | - | - |
| Graduate Degree | - | - |
| Total | $36,786 | $36,250 |
Family Income in Otis
Family Income Brackets in Otis
According to the Otis family income data, there are 26 families falling into the $50,000 to $74,999 income range, which is the most common income bracket and makes up 40.0% of all families.
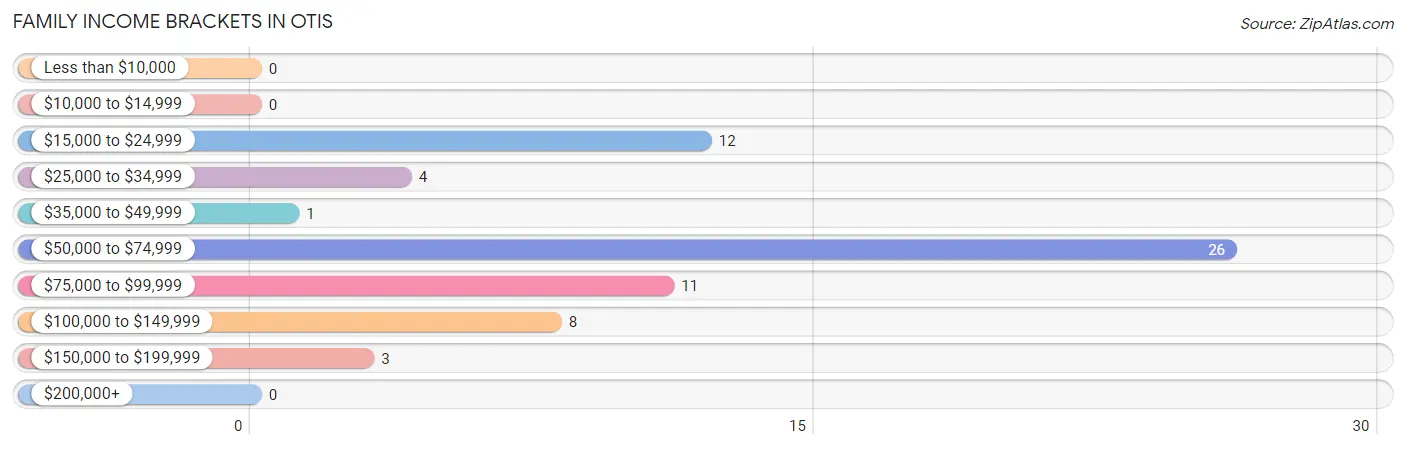
| Income Bracket | # Families | % Families |
| Less than $10,000 | 0 | 0.0% |
| $10,000 to $14,999 | 0 | 0.0% |
| $15,000 to $24,999 | 12 | 18.5% |
| $25,000 to $34,999 | 4 | 6.2% |
| $35,000 to $49,999 | 1 | 1.5% |
| $50,000 to $74,999 | 26 | 40.0% |
| $75,000 to $99,999 | 11 | 16.9% |
| $100,000 to $149,999 | 8 | 12.3% |
| $150,000 to $199,999 | 3 | 4.6% |
| $200,000+ | 0 | 0.0% |
Family Income by Famaliy Size in Otis
3-person families (8 | 12.3%) account for the highest median family income in Otis with $110,833 per family, while 3-person families (8 | 12.3%) have the highest median income of $36,944 per family member.
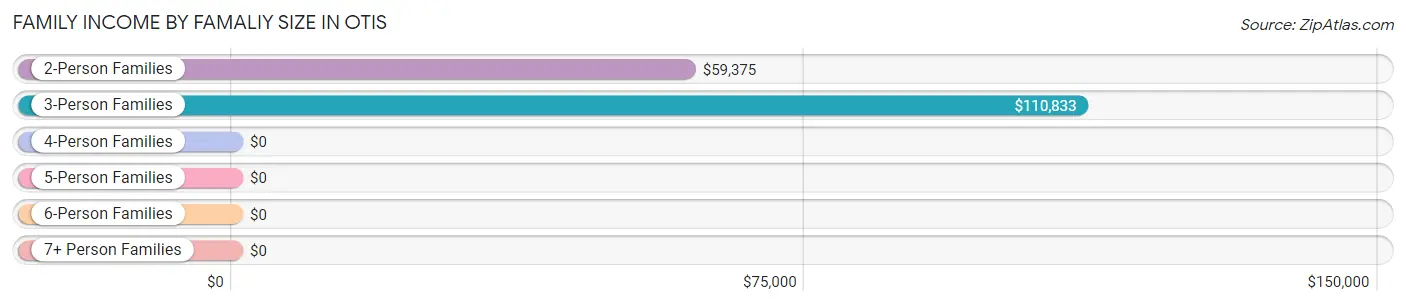
| Income Bracket | # Families | Median Income |
| 2-Person Families | 38 (58.5%) | $59,375 |
| 3-Person Families | 8 (12.3%) | $110,833 |
| 4-Person Families | 17 (26.2%) | $0 |
| 5-Person Families | 2 (3.1%) | $0 |
| 6-Person Families | 0 (0.0%) | $0 |
| 7+ Person Families | 0 (0.0%) | $0 |
| Total | 65 (100.0%) | $63,750 |
Family Income by Number of Earners in Otis
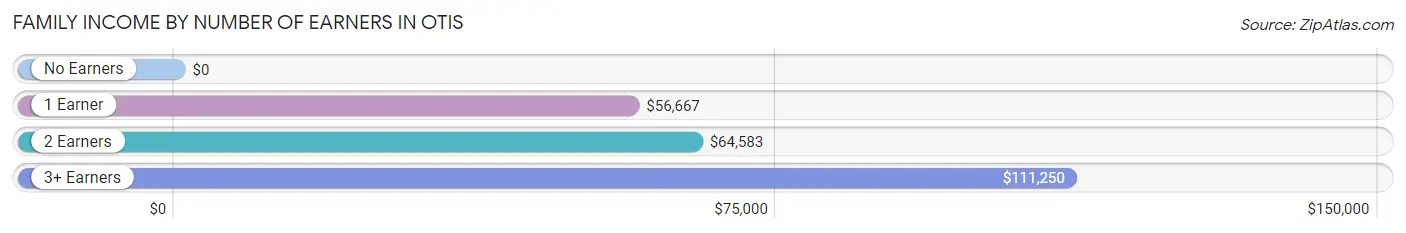
| Number of Earners | # Families | Median Income |
| No Earners | 9 (13.9%) | $0 |
| 1 Earner | 26 (40.0%) | $56,667 |
| 2 Earners | 23 (35.4%) | $64,583 |
| 3+ Earners | 7 (10.8%) | $111,250 |
| Total | 65 (100.0%) | $63,750 |
Household Income in Otis
Household Income Brackets in Otis
With 32 households falling in the category, the $15,000 to $24,999 income range is the most frequent in Otis, accounting for 30.5% of all households.
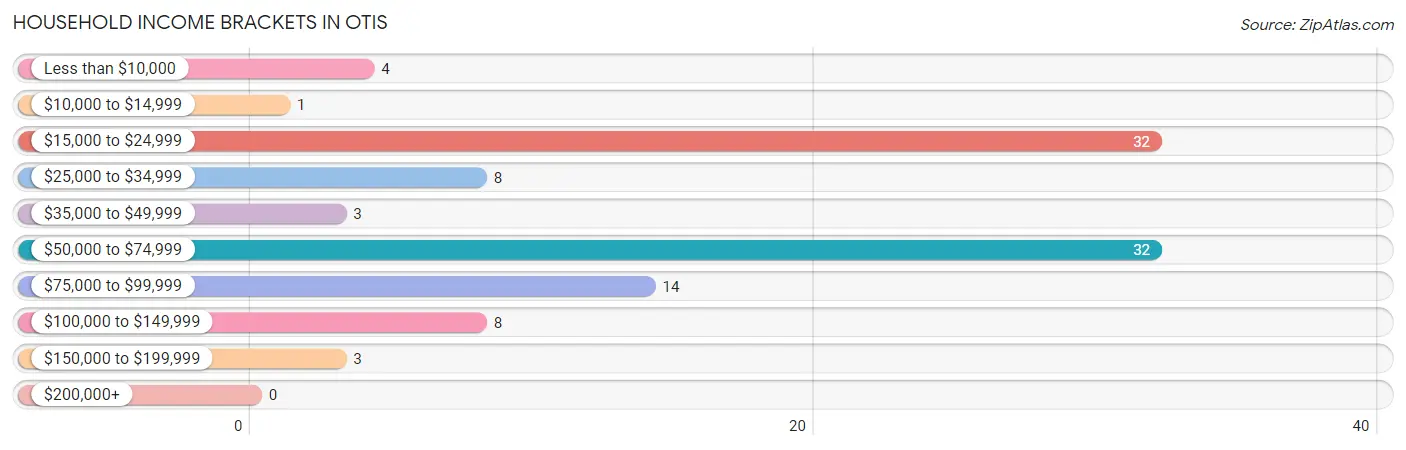
| Income Bracket | # Households | % Households |
| Less than $10,000 | 4 | 3.8% |
| $10,000 to $14,999 | 1 | 1.0% |
| $15,000 to $24,999 | 32 | 30.5% |
| $25,000 to $34,999 | 8 | 7.6% |
| $35,000 to $49,999 | 3 | 2.9% |
| $50,000 to $74,999 | 32 | 30.5% |
| $75,000 to $99,999 | 14 | 13.3% |
| $100,000 to $149,999 | 8 | 7.6% |
| $150,000 to $199,999 | 3 | 2.9% |
| $200,000+ | 0 | 0.0% |
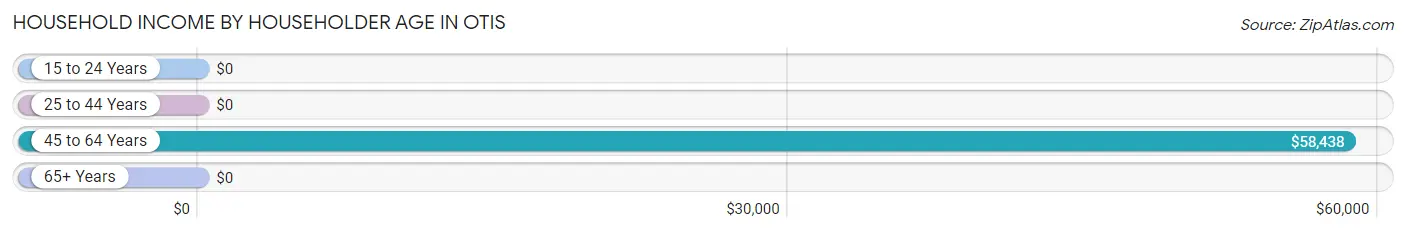
Household Income by Householder Age in Otis
The median household income in Otis is $52,708, with the highest median household income of $58,438 found in the 45 to 64 years age bracket for the primary householder. A total of 45 households (42.9%) fall into this category. Meanwhile, the 15 to 24 years age bracket for the primary householder has the lowest median household income of $0, with 5 households (4.8%) in this group.
| Income Bracket | # Households | Median Income |
| 15 to 24 Years | 5 (4.8%) | $0 |
| 25 to 44 Years | 18 (17.1%) | $0 |
| 45 to 64 Years | 45 (42.9%) | $58,438 |
| 65+ Years | 37 (35.2%) | $0 |
| Total | 105 (100.0%) | $52,708 |
Poverty in Otis
Income Below Poverty by Sex and Age in Otis
With 16.6% poverty level for males and 27.7% for females among the residents of Otis, 18 to 24 year old males and under 5 year old females are the most vulnerable to poverty, with 5 males (100.0%) and 12 females (100.0%) in their respective age groups living below the poverty level.
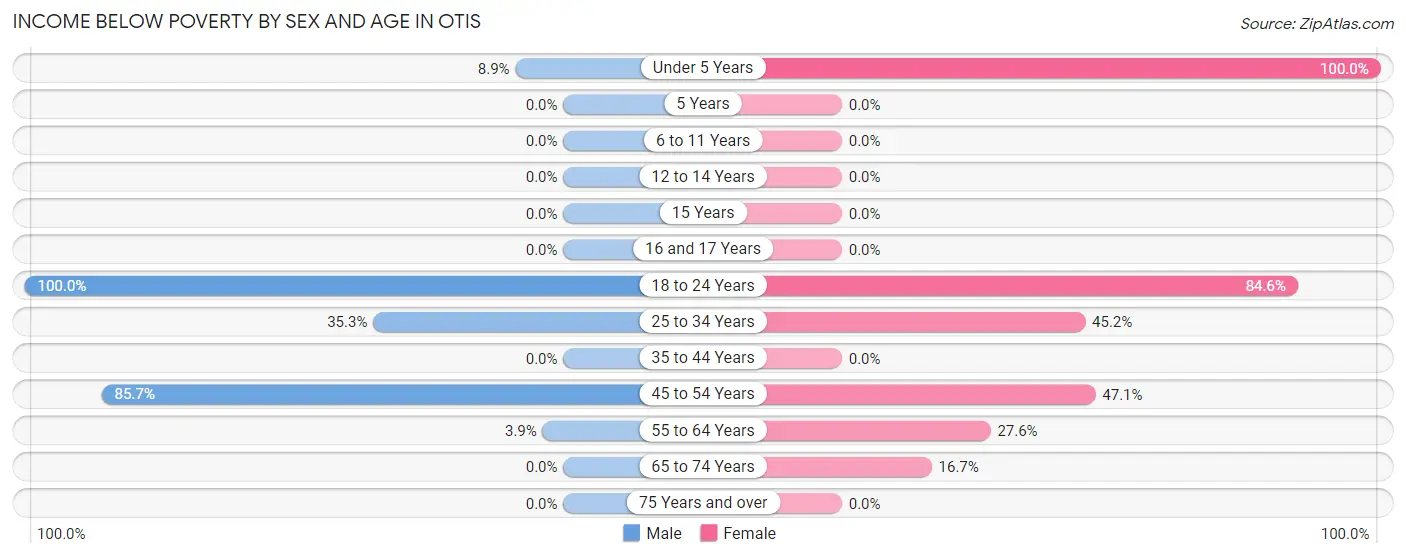
| Age Bracket | Male | Female |
| Under 5 Years | 4 (8.9%) | 12 (100.0%) |
| 5 Years | 0 (0.0%) | 0 (0.0%) |
| 6 to 11 Years | 0 (0.0%) | 0 (0.0%) |
| 12 to 14 Years | 0 (0.0%) | 0 (0.0%) |
| 15 Years | 0 (0.0%) | 0 (0.0%) |
| 16 and 17 Years | 0 (0.0%) | 0 (0.0%) |
| 18 to 24 Years | 5 (100.0%) | 11 (84.6%) |
| 25 to 34 Years | 6 (35.3%) | 14 (45.2%) |
| 35 to 44 Years | 0 (0.0%) | 0 (0.0%) |
| 45 to 54 Years | 12 (85.7%) | 8 (47.1%) |
| 55 to 64 Years | 1 (3.8%) | 8 (27.6%) |
| 65 to 74 Years | 0 (0.0%) | 4 (16.7%) |
| 75 Years and over | 0 (0.0%) | 0 (0.0%) |
| Total | 28 (16.6%) | 57 (27.7%) |
Income Above Poverty by Sex and Age in Otis
According to the poverty statistics in Otis, males aged 6 to 11 years and females aged 6 to 11 years are the age groups that are most secure financially, with 100.0% of males and 100.0% of females in these age groups living above the poverty line.
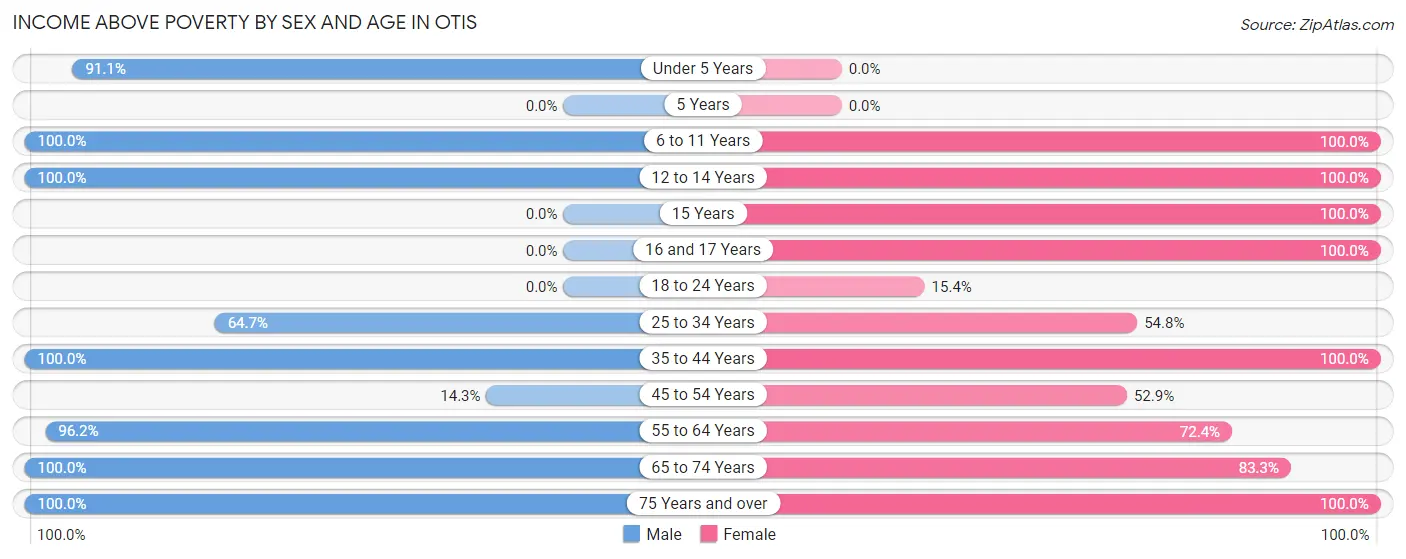
| Age Bracket | Male | Female |
| Under 5 Years | 41 (91.1%) | 0 (0.0%) |
| 5 Years | 0 (0.0%) | 0 (0.0%) |
| 6 to 11 Years | 39 (100.0%) | 4 (100.0%) |
| 12 to 14 Years | 1 (100.0%) | 5 (100.0%) |
| 15 Years | 0 (0.0%) | 25 (100.0%) |
| 16 and 17 Years | 0 (0.0%) | 4 (100.0%) |
| 18 to 24 Years | 0 (0.0%) | 2 (15.4%) |
| 25 to 34 Years | 11 (64.7%) | 17 (54.8%) |
| 35 to 44 Years | 1 (100.0%) | 36 (100.0%) |
| 45 to 54 Years | 2 (14.3%) | 9 (52.9%) |
| 55 to 64 Years | 25 (96.2%) | 21 (72.4%) |
| 65 to 74 Years | 14 (100.0%) | 20 (83.3%) |
| 75 Years and over | 7 (100.0%) | 6 (100.0%) |
| Total | 141 (83.4%) | 149 (72.3%) |
Income Below Poverty Among Married-Couple Families in Otis
The poverty statistics for married-couple families in Otis show that 28.3% or 15 of the total 53 families live below the poverty line. Families with 1 or 2 children have the highest poverty rate of 57.1%, comprising of 8 families. On the other hand, families with no children have the lowest poverty rate of 17.9%, which includes 7 families.
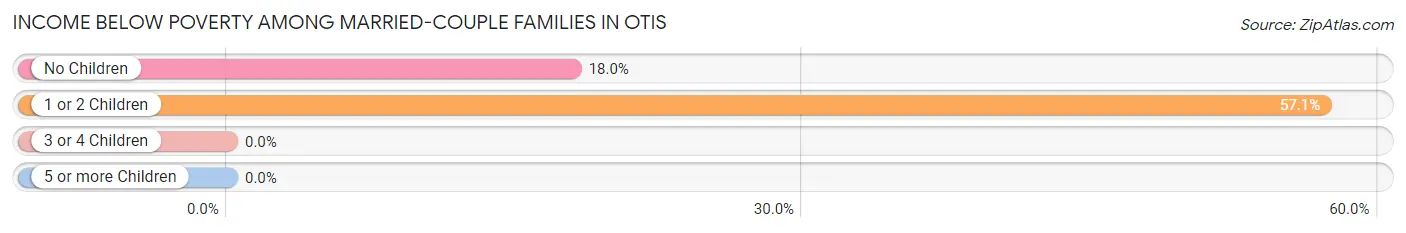
| Children | Above Poverty | Below Poverty |
| No Children | 32 (82.1%) | 7 (17.9%) |
| 1 or 2 Children | 6 (42.9%) | 8 (57.1%) |
| 3 or 4 Children | 0 (0.0%) | 0 (0.0%) |
| 5 or more Children | 0 (0.0%) | 0 (0.0%) |
| Total | 38 (71.7%) | 15 (28.3%) |
Income Below Poverty Among Single-Parent Households in Otis
| Children | Single Father | Single Mother |
| No Children | 0 (0.0%) | 0 (0.0%) |
| 1 or 2 Children | 0 (0.0%) | 0 (0.0%) |
| 3 or 4 Children | 0 (0.0%) | 0 (0.0%) |
| 5 or more Children | 0 (0.0%) | 0 (0.0%) |
| Total | 0 (0.0%) | 0 (0.0%) |
Income Below Poverty Among Married-Couple vs Single-Parent Households in Otis
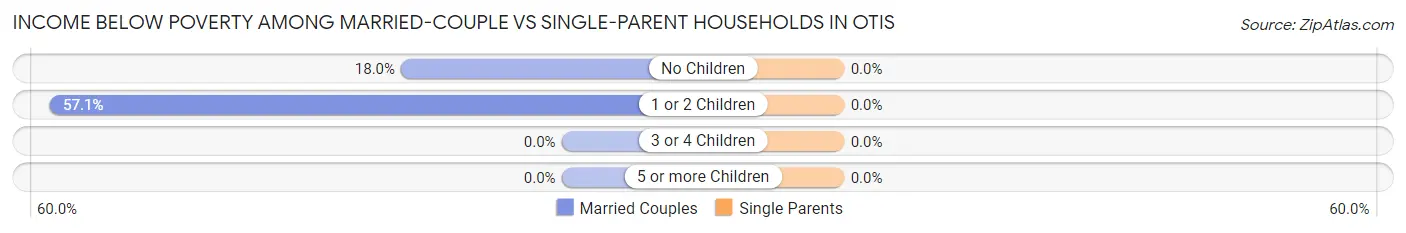
| Children | Married-Couple Families | Single-Parent Households |
| No Children | 7 (17.9%) | 0 (0.0%) |
| 1 or 2 Children | 8 (57.1%) | 0 (0.0%) |
| 3 or 4 Children | 0 (0.0%) | 0 (0.0%) |
| 5 or more Children | 0 (0.0%) | 0 (0.0%) |
| Total | 15 (28.3%) | 0 (0.0%) |
Race in Otis
The most populous races in Otis are White / Caucasian (341 | 90.9%), Two or more Races (31 | 8.3%), and Hispanic or Latino (23 | 6.1%).
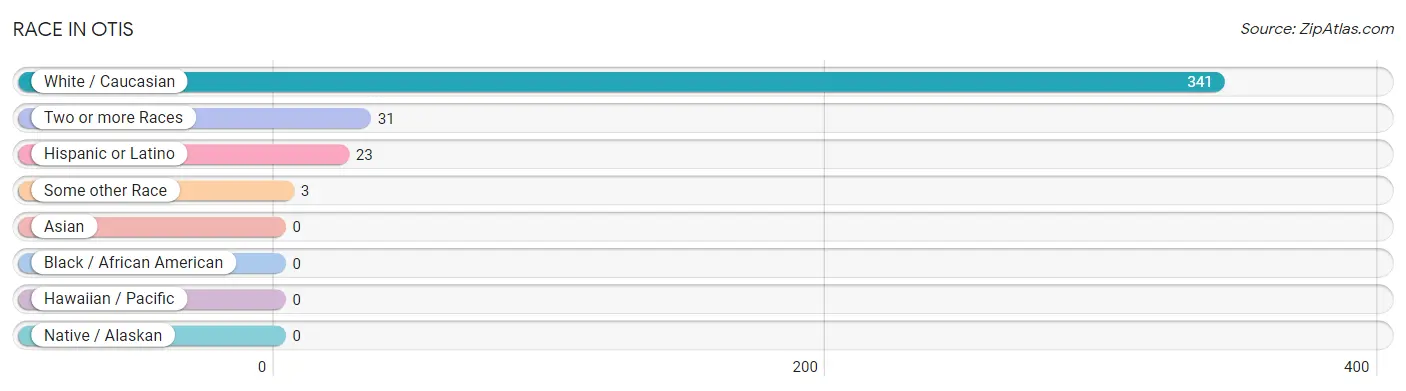
| Race | # Population | % Population |
| Asian | 0 | 0.0% |
| Black / African American | 0 | 0.0% |
| Hawaiian / Pacific | 0 | 0.0% |
| Hispanic or Latino | 23 | 6.1% |
| Native / Alaskan | 0 | 0.0% |
| White / Caucasian | 341 | 90.9% |
| Two or more Races | 31 | 8.3% |
| Some other Race | 3 | 0.8% |
| Total | 375 | 100.0% |
Ancestry in Otis
The most populous ancestries reported in Otis are German (254 | 67.7%), French (142 | 37.9%), Irish (34 | 9.1%), English (33 | 8.8%), and Mexican (23 | 6.1%), together accounting for 129.6% of all Otis residents.
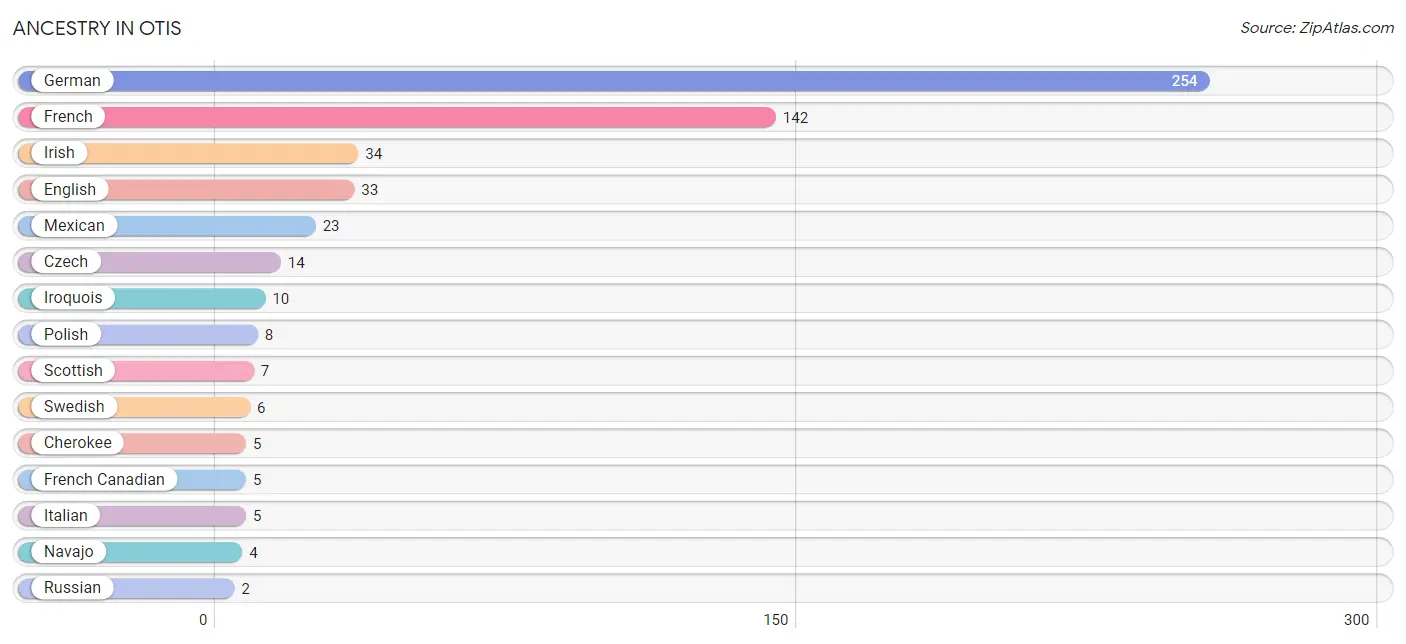
| Ancestry | # Population | % Population |
| Cherokee | 5 | 1.3% |
| Czech | 14 | 3.7% |
| English | 33 | 8.8% |
| French | 142 | 37.9% |
| French Canadian | 5 | 1.3% |
| German | 254 | 67.7% |
| Irish | 34 | 9.1% |
| Iroquois | 10 | 2.7% |
| Italian | 5 | 1.3% |
| Mexican | 23 | 6.1% |
| Navajo | 4 | 1.1% |
| Polish | 8 | 2.1% |
| Russian | 2 | 0.5% |
| Scottish | 7 | 1.9% |
| Swedish | 6 | 1.6% |
| Welsh | 1 | 0.3% | View All 16 Rows |
Immigrants in Otis
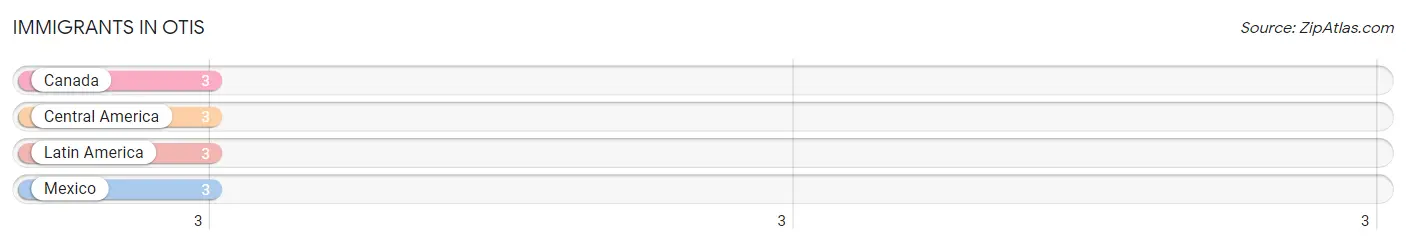
The most numerous immigrant groups reported in Otis came from Canada (3 | 0.8%), Central America (3 | 0.8%), Latin America (3 | 0.8%), and Mexico (3 | 0.8%), together accounting for 3.2% of all Otis residents.
| Immigration Origin | # Population | % Population |
| Canada | 3 | 0.8% |
| Central America | 3 | 0.8% |
| Latin America | 3 | 0.8% |
| Mexico | 3 | 0.8% | View All 4 Rows |
Sex and Age in Otis
Sex and Age in Otis
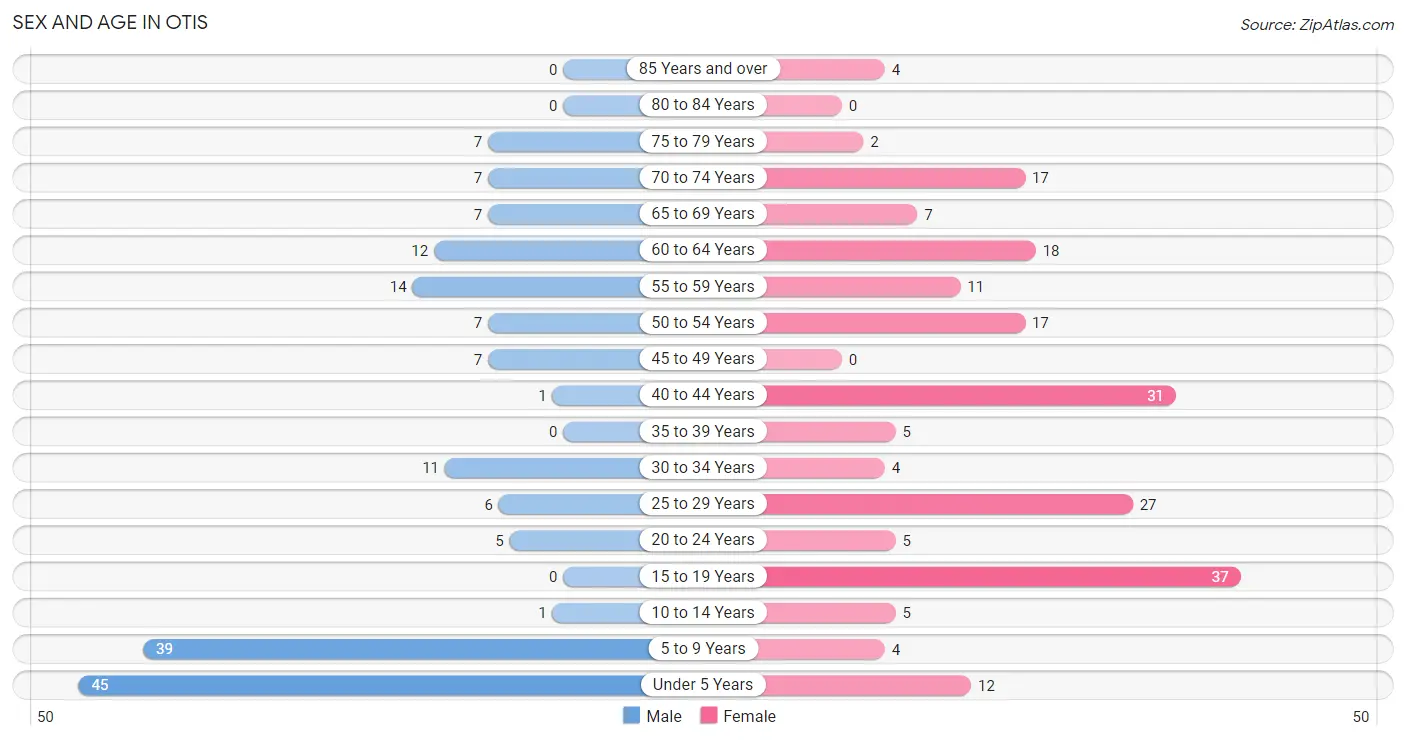
The most populous age groups in Otis are Under 5 Years (45 | 26.6%) for men and 15 to 19 Years (37 | 18.0%) for women.
| Age Bracket | Male | Female |
| Under 5 Years | 45 (26.6%) | 12 (5.8%) |
| 5 to 9 Years | 39 (23.1%) | 4 (1.9%) |
| 10 to 14 Years | 1 (0.6%) | 5 (2.4%) |
| 15 to 19 Years | 0 (0.0%) | 37 (18.0%) |
| 20 to 24 Years | 5 (3.0%) | 5 (2.4%) |
| 25 to 29 Years | 6 (3.5%) | 27 (13.1%) |
| 30 to 34 Years | 11 (6.5%) | 4 (1.9%) |
| 35 to 39 Years | 0 (0.0%) | 5 (2.4%) |
| 40 to 44 Years | 1 (0.6%) | 31 (15.0%) |
| 45 to 49 Years | 7 (4.1%) | 0 (0.0%) |
| 50 to 54 Years | 7 (4.1%) | 17 (8.3%) |
| 55 to 59 Years | 14 (8.3%) | 11 (5.3%) |
| 60 to 64 Years | 12 (7.1%) | 18 (8.7%) |
| 65 to 69 Years | 7 (4.1%) | 7 (3.4%) |
| 70 to 74 Years | 7 (4.1%) | 17 (8.3%) |
| 75 to 79 Years | 7 (4.1%) | 2 (1.0%) |
| 80 to 84 Years | 0 (0.0%) | 0 (0.0%) |
| 85 Years and over | 0 (0.0%) | 4 (1.9%) |
| Total | 169 (100.0%) | 206 (100.0%) |
Families and Households in Otis
Median Family Size in Otis
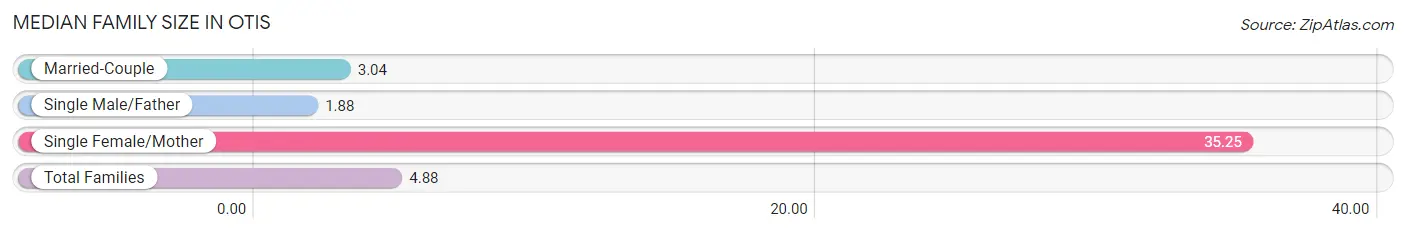
The median family size in Otis is 4.88 persons per family, with single female/mother families (4 | 6.1%) accounting for the largest median family size of 35.25 persons per family. On the other hand, single male/father families (8 | 12.3%) represent the smallest median family size with 1.88 persons per family.
| Family Type | # Families | Family Size |
| Married-Couple | 53 (81.5%) | 3.04 |
| Single Male/Father | 8 (12.3%) | 1.88 |
| Single Female/Mother | 4 (6.1%) | 35.25 |
| Total Families | 65 (100.0%) | 4.88 |
Median Household Size in Otis
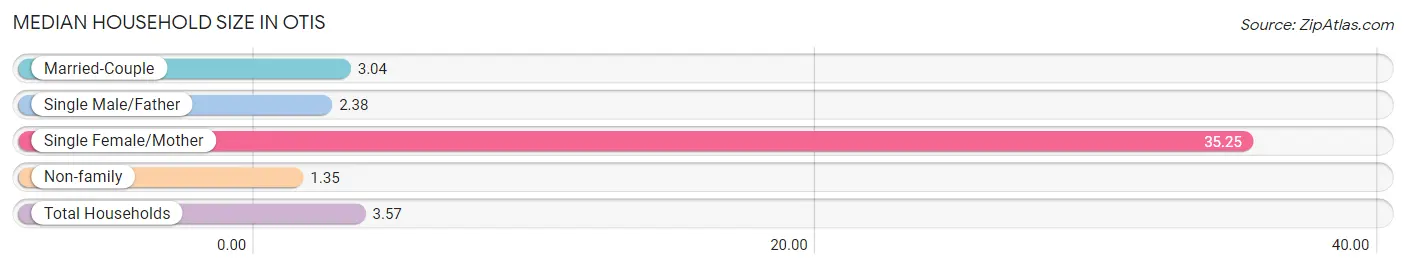
The median household size in Otis is 3.57 persons per household, with single female/mother households (4 | 3.8%) accounting for the largest median household size of 35.25 persons per household. non-family households (40 | 38.1%) represent the smallest median household size with 1.35 persons per household.
| Household Type | # Households | Household Size |
| Married-Couple | 53 (50.5%) | 3.04 |
| Single Male/Father | 8 (7.6%) | 2.38 |
| Single Female/Mother | 4 (3.8%) | 35.25 |
| Non-family | 40 (38.1%) | 1.35 |
| Total Households | 105 (100.0%) | 3.57 |
Household Size by Marriage Status in Otis
Out of a total of 105 households in Otis, 65 (61.9%) are family households, while 40 (38.1%) are nonfamily households. The most numerous type of family households are 2-person households, comprising 35, and the most common type of nonfamily households are 1-person households, comprising 30.
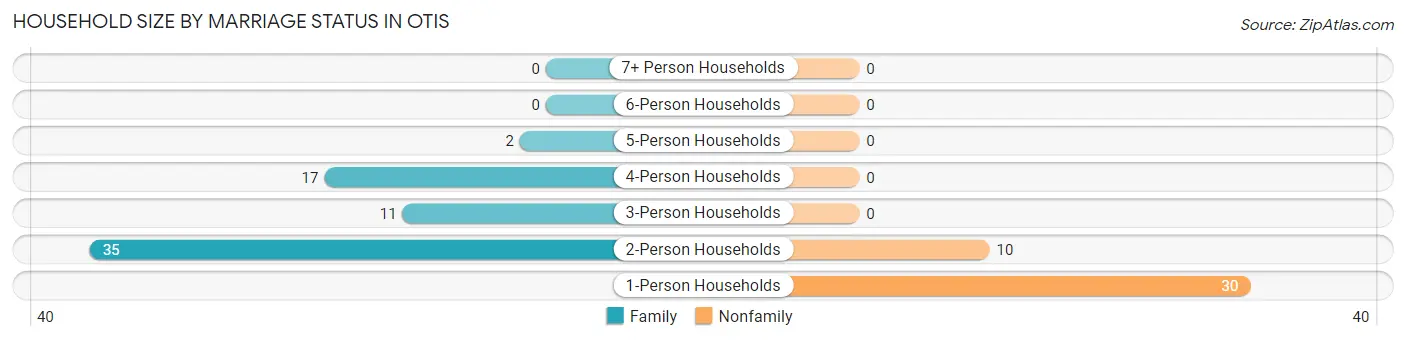
| Household Size | Family Households | Nonfamily Households |
| 1-Person Households | - | 30 (28.6%) |
| 2-Person Households | 35 (33.3%) | 10 (9.5%) |
| 3-Person Households | 11 (10.5%) | 0 (0.0%) |
| 4-Person Households | 17 (16.2%) | 0 (0.0%) |
| 5-Person Households | 2 (1.9%) | 0 (0.0%) |
| 6-Person Households | 0 (0.0%) | 0 (0.0%) |
| 7+ Person Households | 0 (0.0%) | 0 (0.0%) |
| Total | 65 (61.9%) | 40 (38.1%) |
Female Fertility in Otis
Fertility by Age in Otis
| Age Bracket | Women with Births | Births / 1,000 Women |
| 15 to 19 years | 0 (0.0%) | 0.0 |
| 20 to 34 years | 0 (0.0%) | 0.0 |
| 35 to 50 years | 0 (0.0%) | 0.0 |
| Total | 0 (0.0%) | 0.0 |
Fertility by Age by Marriage Status in Otis
| Age Bracket | Married | Unmarried |
| 15 to 19 years | 0 (0.0%) | 0 (0.0%) |
| 20 to 34 years | 0 (0.0%) | 0 (0.0%) |
| 35 to 50 years | 0 (0.0%) | 0 (0.0%) |
| Total | 0 (0.0%) | 0 (0.0%) |
Fertility by Education in Otis
| Educational Attainment | Women with Births | Births / 1,000 Women |
| Less than High School | 0 (0.0%) | 0.0 |
| High School Diploma | 0 (0.0%) | 0.0 |
| College or Associate's Degree | 0 (0.0%) | 0.0 |
| Bachelor's Degree | 0 (0.0%) | 0.0 |
| Graduate Degree | 0 (0.0%) | 0.0 |
| Total | 0 (0.0%) | 0.0 |
Fertility by Education by Marriage Status in Otis
| Educational Attainment | Married | Unmarried |
| Less than High School | 0 (0.0%) | 0 (0.0%) |
| High School Diploma | 0 (0.0%) | 0 (0.0%) |
| College or Associate's Degree | 0 (0.0%) | 0 (0.0%) |
| Bachelor's Degree | 0 (0.0%) | 0 (0.0%) |
| Graduate Degree | 0 (0.0%) | 0 (0.0%) |
| Total | 0 (0.0%) | 0 (0.0%) |
Employment Characteristics in Otis
Employment by Class of Employer in Otis
Among the 138 employed individuals in Otis, private company employees (78 | 56.5%), local government employees (19 | 13.8%), and state government employees (12 | 8.7%) make up the most common classes of employment.
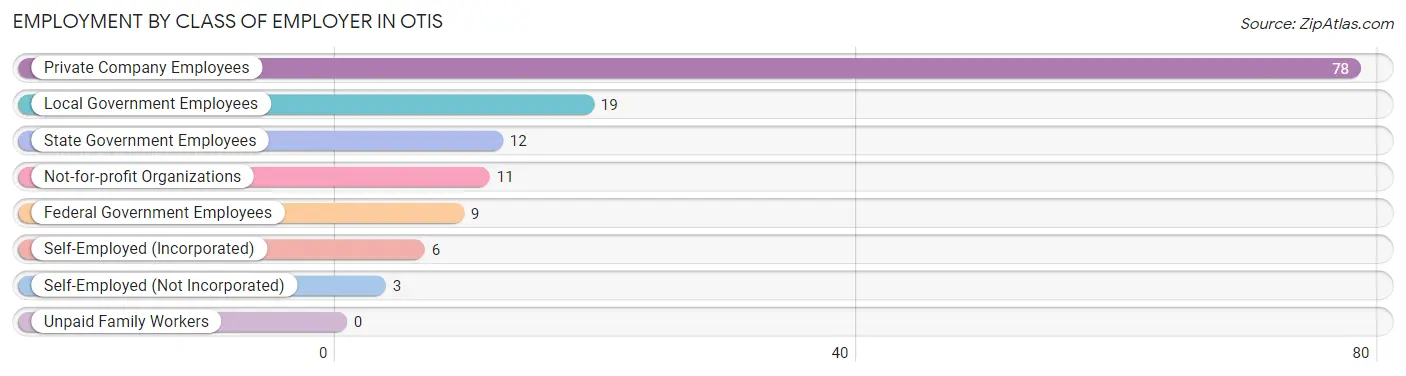
| Employer Class | # Employees | % Employees |
| Private Company Employees | 78 | 56.5% |
| Self-Employed (Incorporated) | 6 | 4.3% |
| Self-Employed (Not Incorporated) | 3 | 2.2% |
| Not-for-profit Organizations | 11 | 8.0% |
| Local Government Employees | 19 | 13.8% |
| State Government Employees | 12 | 8.7% |
| Federal Government Employees | 9 | 6.5% |
| Unpaid Family Workers | 0 | 0.0% |
| Total | 138 | 100.0% |
Employment Status by Age in Otis
According to the labor force statistics for Otis, out of the total population over 16 years of age (244), 60.2% or 147 individuals are in the labor force, with 6.1% or 9 of them unemployed. The age group with the highest labor force participation rate is 30 to 34 years, with 100.0% or 15 individuals in the labor force. Within the labor force, the 45 to 54 years age range has the highest percentage of unemployed individuals, with 50.0% or 5 of them being unemployed.
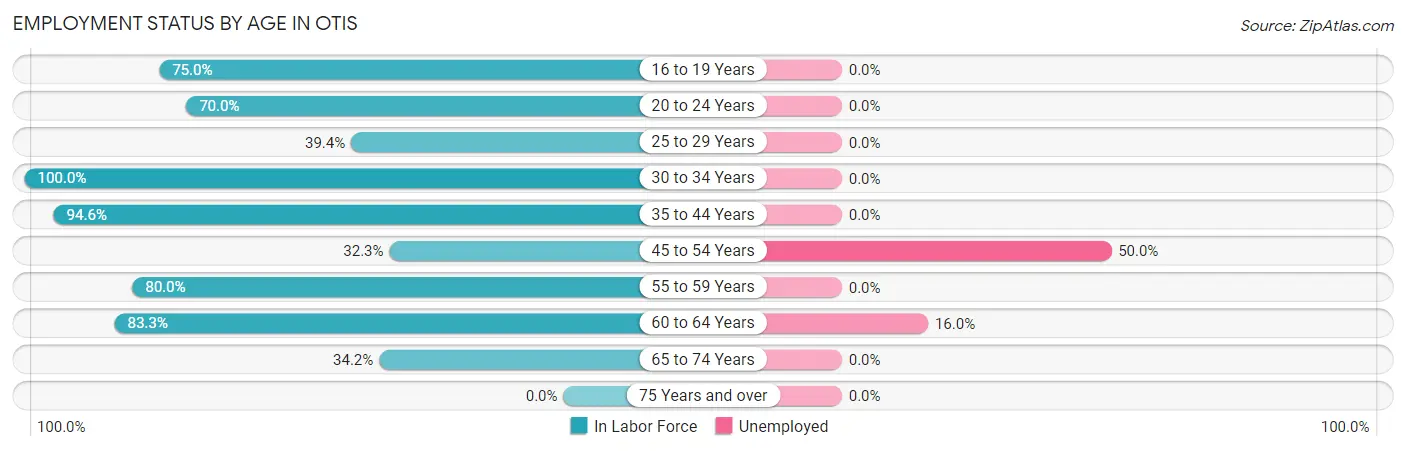
| Age Bracket | In Labor Force | Unemployed |
| 16 to 19 Years | 9 (75.0%) | 0 (0.0%) |
| 20 to 24 Years | 7 (70.0%) | 0 (0.0%) |
| 25 to 29 Years | 13 (39.4%) | 0 (0.0%) |
| 30 to 34 Years | 15 (100.0%) | 0 (0.0%) |
| 35 to 44 Years | 35 (94.6%) | 0 (0.0%) |
| 45 to 54 Years | 10 (32.3%) | 5 (50.0%) |
| 55 to 59 Years | 20 (80.0%) | 0 (0.0%) |
| 60 to 64 Years | 25 (83.3%) | 4 (16.0%) |
| 65 to 74 Years | 13 (34.2%) | 0 (0.0%) |
| 75 Years and over | 0 (0.0%) | 0 (0.0%) |
| Total | 147 (60.2%) | 9 (6.1%) |
Employment Status by Educational Attainment in Otis
According to labor force statistics for Otis, 69.0% of individuals (118) out of the total population between 25 and 64 years of age (171) are in the labor force, with 7.6% or 9 of them being unemployed. The group with the highest labor force participation rate are those with the educational attainment of high school diploma, with 86.9% or 73 individuals in the labor force. Within the labor force, individuals with less than high school education have the highest percentage of unemployment, with 100.0% or 5 of them being unemployed.
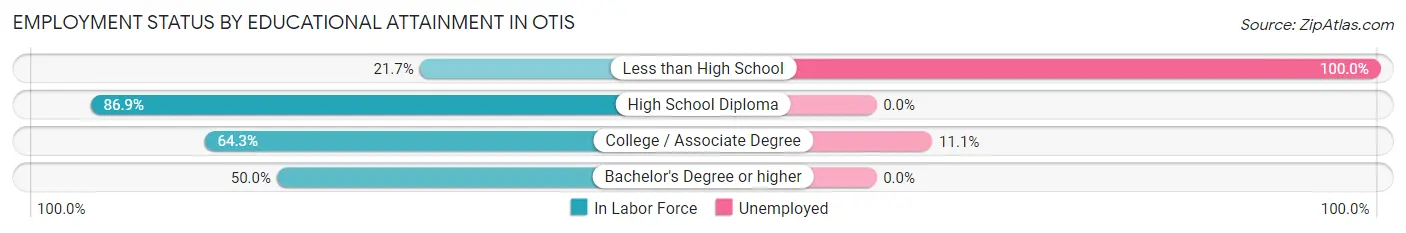
| Educational Attainment | In Labor Force | Unemployed |
| Less than High School | 5 (21.7%) | 23 (100.0%) |
| High School Diploma | 73 (86.9%) | 0 (0.0%) |
| College / Associate Degree | 36 (64.3%) | 6 (11.1%) |
| Bachelor's Degree or higher | 4 (50.0%) | 0 (0.0%) |
| Total | 118 (69.0%) | 13 (7.6%) |
Employment Occupations by Sex in Otis
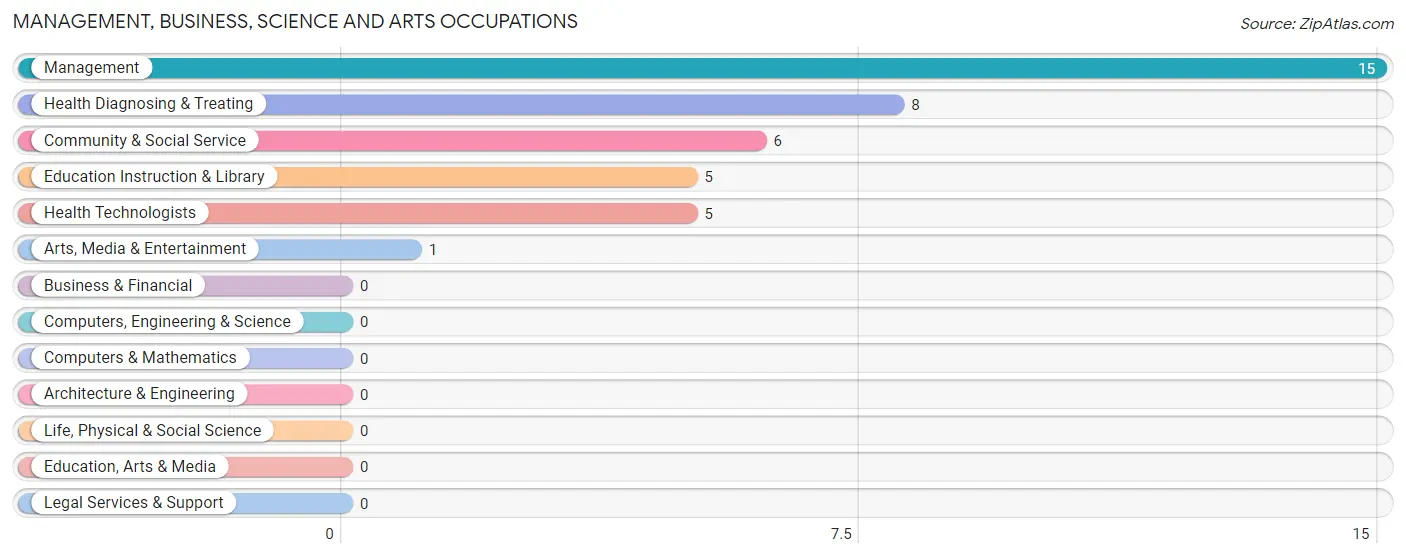
Management, Business, Science and Arts Occupations
The most common Management, Business, Science and Arts occupations in Otis are Management (15 | 10.9%), Health Diagnosing & Treating (8 | 5.8%), Community & Social Service (6 | 4.3%), Education Instruction & Library (5 | 3.6%), and Health Technologists (5 | 3.6%).
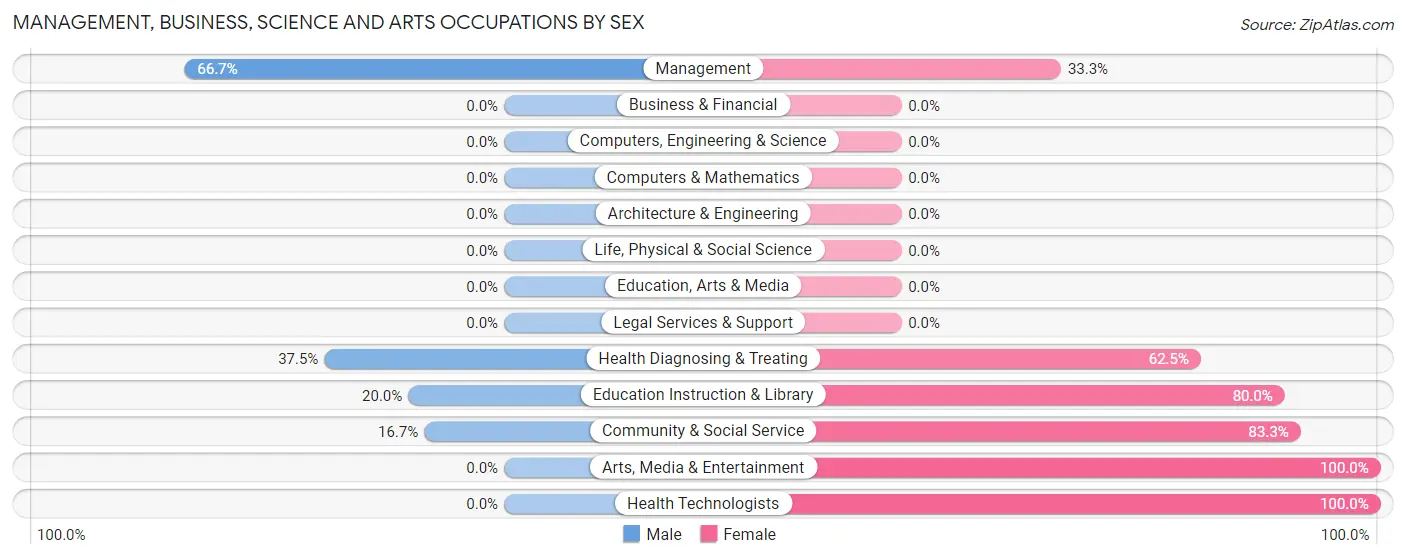
Management, Business, Science and Arts Occupations by Sex
Within the Management, Business, Science and Arts occupations in Otis, the most male-oriented occupations are Management (66.7%), Health Diagnosing & Treating (37.5%), and Education Instruction & Library (20.0%), while the most female-oriented occupations are Arts, Media & Entertainment (100.0%), Health Technologists (100.0%), and Community & Social Service (83.3%).
| Occupation | Male | Female |
| Management | 10 (66.7%) | 5 (33.3%) |
| Business & Financial | 0 (0.0%) | 0 (0.0%) |
| Computers, Engineering & Science | 0 (0.0%) | 0 (0.0%) |
| Computers & Mathematics | 0 (0.0%) | 0 (0.0%) |
| Architecture & Engineering | 0 (0.0%) | 0 (0.0%) |
| Life, Physical & Social Science | 0 (0.0%) | 0 (0.0%) |
| Community & Social Service | 1 (16.7%) | 5 (83.3%) |
| Education, Arts & Media | 0 (0.0%) | 0 (0.0%) |
| Legal Services & Support | 0 (0.0%) | 0 (0.0%) |
| Education Instruction & Library | 1 (20.0%) | 4 (80.0%) |
| Arts, Media & Entertainment | 0 (0.0%) | 1 (100.0%) |
| Health Diagnosing & Treating | 3 (37.5%) | 5 (62.5%) |
| Health Technologists | 0 (0.0%) | 5 (100.0%) |
| Total (Category) | 14 (48.3%) | 15 (51.7%) |
| Total (Overall) | 53 (38.4%) | 85 (61.6%) |
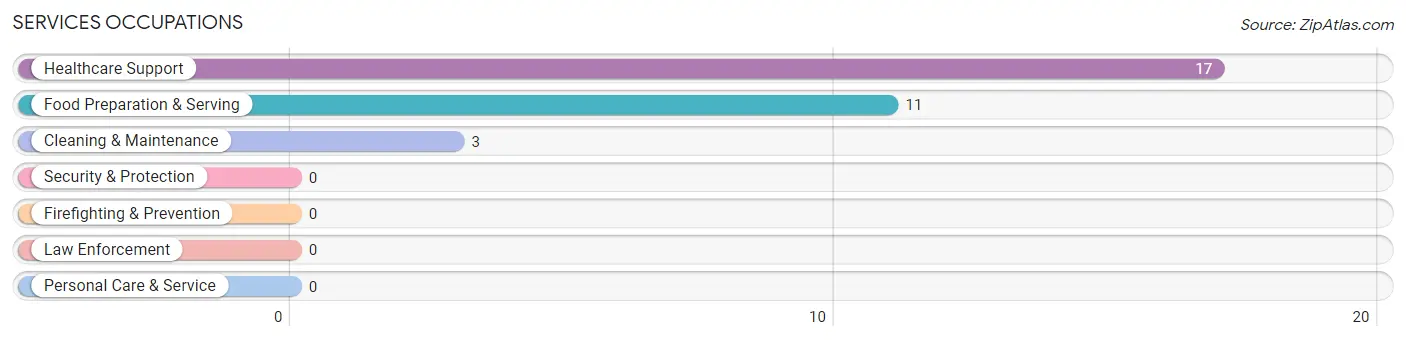
Services Occupations
The most common Services occupations in Otis are Healthcare Support (17 | 12.3%), Food Preparation & Serving (11 | 8.0%), and Cleaning & Maintenance (3 | 2.2%).
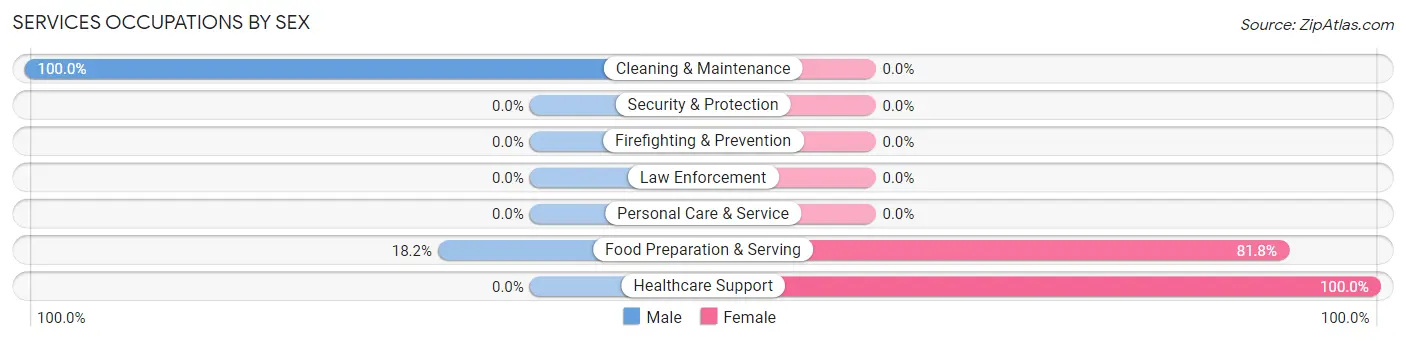
Services Occupations by Sex
Within the Services occupations in Otis, the most male-oriented occupations are Cleaning & Maintenance (100.0%), and Food Preparation & Serving (18.2%), while the most female-oriented occupations are Healthcare Support (100.0%), and Food Preparation & Serving (81.8%).
| Occupation | Male | Female |
| Healthcare Support | 0 (0.0%) | 17 (100.0%) |
| Security & Protection | 0 (0.0%) | 0 (0.0%) |
| Firefighting & Prevention | 0 (0.0%) | 0 (0.0%) |
| Law Enforcement | 0 (0.0%) | 0 (0.0%) |
| Food Preparation & Serving | 2 (18.2%) | 9 (81.8%) |
| Cleaning & Maintenance | 3 (100.0%) | 0 (0.0%) |
| Personal Care & Service | 0 (0.0%) | 0 (0.0%) |
| Total (Category) | 5 (16.1%) | 26 (83.9%) |
| Total (Overall) | 53 (38.4%) | 85 (61.6%) |
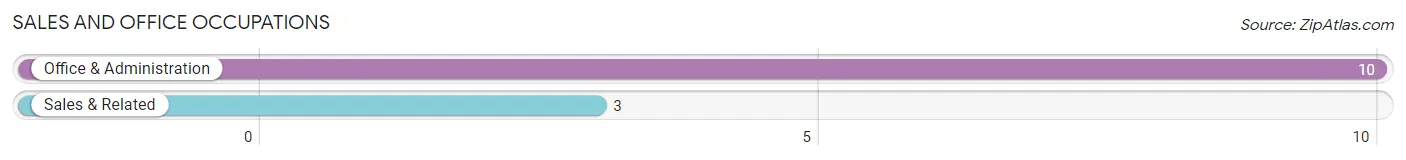
Sales and Office Occupations
The most common Sales and Office occupations in Otis are Office & Administration (10 | 7.2%), and Sales & Related (3 | 2.2%).
Sales and Office Occupations by Sex
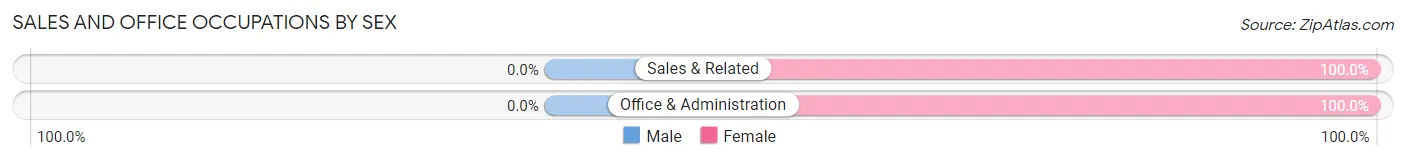
| Occupation | Male | Female |
| Sales & Related | 0 (0.0%) | 3 (100.0%) |
| Office & Administration | 0 (0.0%) | 10 (100.0%) |
| Total (Category) | 0 (0.0%) | 13 (100.0%) |
| Total (Overall) | 53 (38.4%) | 85 (61.6%) |
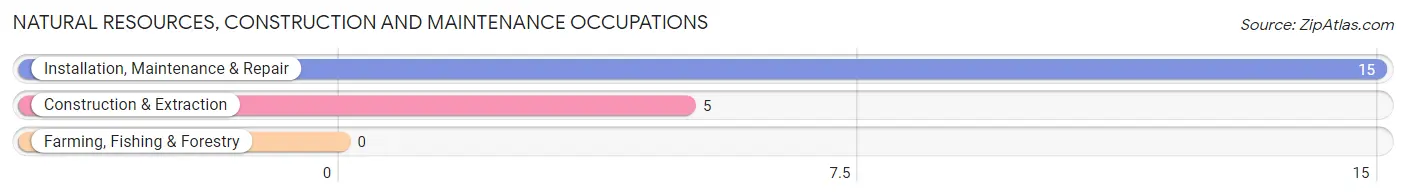
Natural Resources, Construction and Maintenance Occupations
The most common Natural Resources, Construction and Maintenance occupations in Otis are Installation, Maintenance & Repair (15 | 10.9%), and Construction & Extraction (5 | 3.6%).
Natural Resources, Construction and Maintenance Occupations by Sex
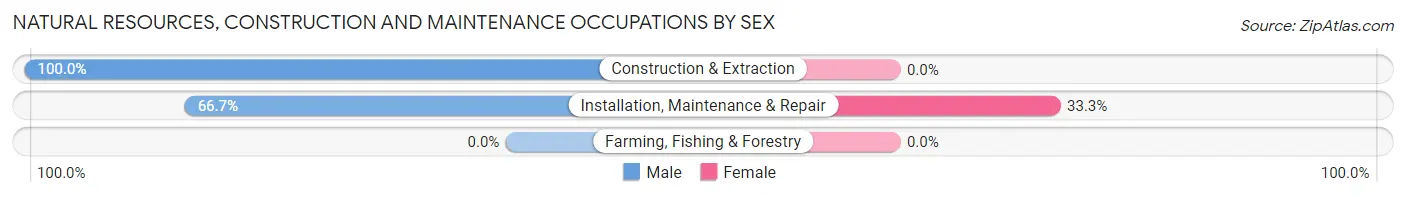
| Occupation | Male | Female |
| Farming, Fishing & Forestry | 0 (0.0%) | 0 (0.0%) |
| Construction & Extraction | 5 (100.0%) | 0 (0.0%) |
| Installation, Maintenance & Repair | 10 (66.7%) | 5 (33.3%) |
| Total (Category) | 15 (75.0%) | 5 (25.0%) |
| Total (Overall) | 53 (38.4%) | 85 (61.6%) |
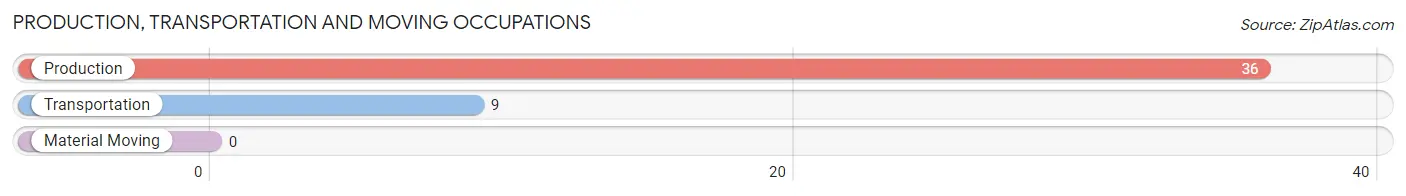
Production, Transportation and Moving Occupations
The most common Production, Transportation and Moving occupations in Otis are Production (36 | 26.1%), and Transportation (9 | 6.5%).
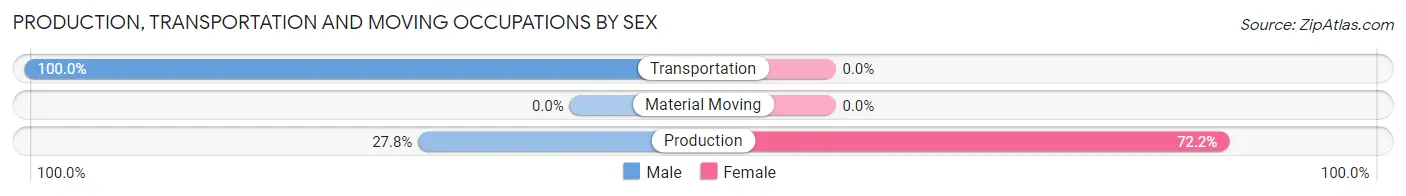
Production, Transportation and Moving Occupations by Sex
| Occupation | Male | Female |
| Production | 10 (27.8%) | 26 (72.2%) |
| Transportation | 9 (100.0%) | 0 (0.0%) |
| Material Moving | 0 (0.0%) | 0 (0.0%) |
| Total (Category) | 19 (42.2%) | 26 (57.8%) |
| Total (Overall) | 53 (38.4%) | 85 (61.6%) |
Employment Industries by Sex in Otis
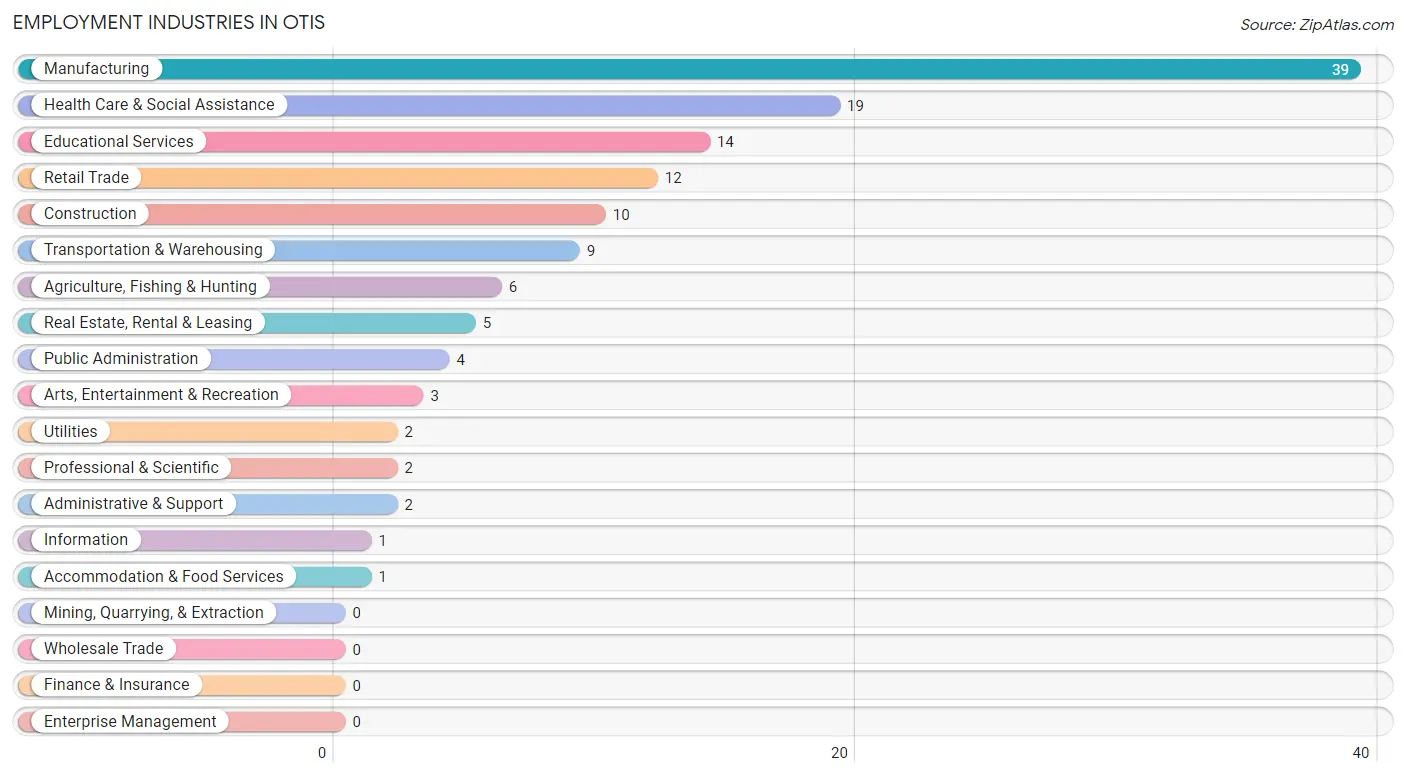
Employment Industries in Otis
The major employment industries in Otis include Manufacturing (39 | 28.3%), Health Care & Social Assistance (19 | 13.8%), Educational Services (14 | 10.1%), Retail Trade (12 | 8.7%), and Construction (10 | 7.2%).
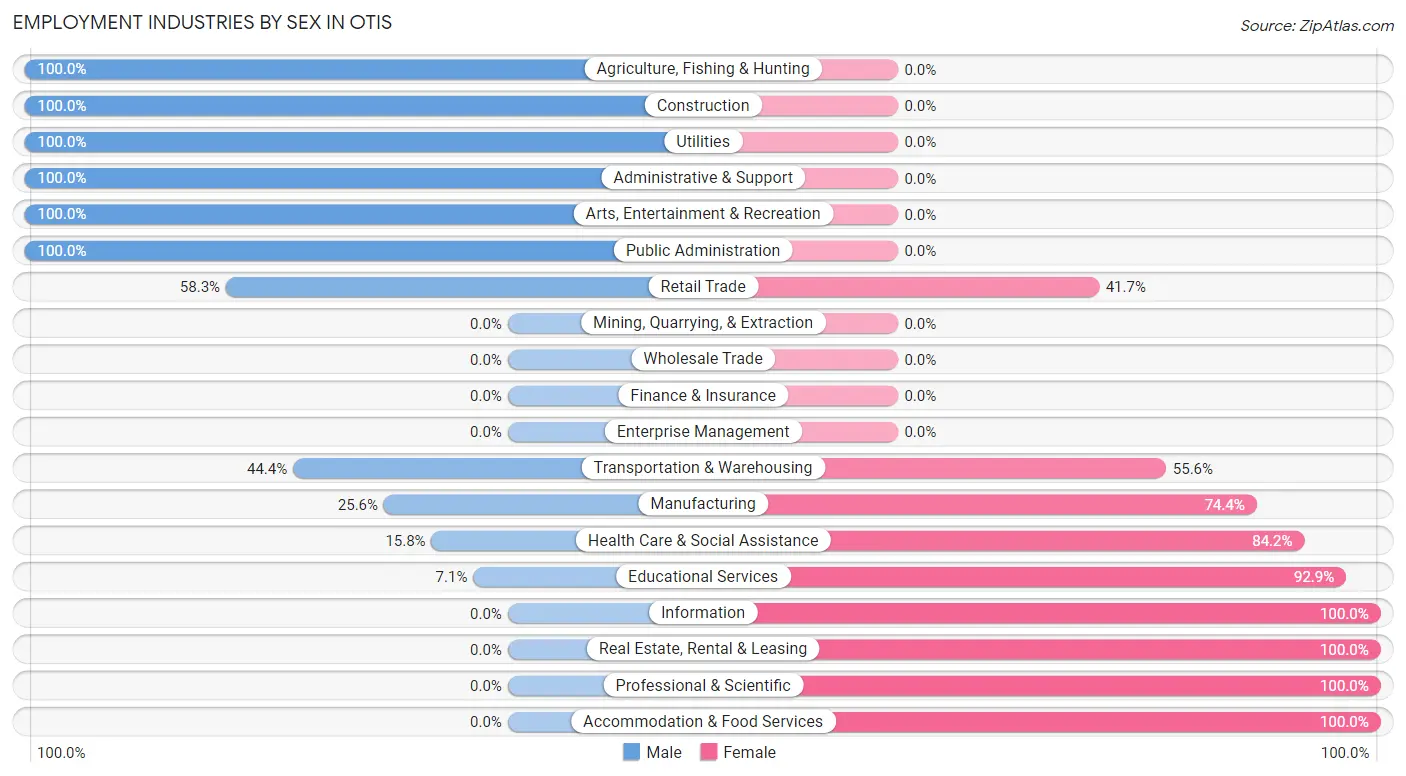
Employment Industries by Sex in Otis
The Otis industries that see more men than women are Agriculture, Fishing & Hunting (100.0%), Construction (100.0%), and Utilities (100.0%), whereas the industries that tend to have a higher number of women are Information (100.0%), Real Estate, Rental & Leasing (100.0%), and Professional & Scientific (100.0%).
| Industry | Male | Female |
| Agriculture, Fishing & Hunting | 6 (100.0%) | 0 (0.0%) |
| Mining, Quarrying, & Extraction | 0 (0.0%) | 0 (0.0%) |
| Construction | 10 (100.0%) | 0 (0.0%) |
| Manufacturing | 10 (25.6%) | 29 (74.4%) |
| Wholesale Trade | 0 (0.0%) | 0 (0.0%) |
| Retail Trade | 7 (58.3%) | 5 (41.7%) |
| Transportation & Warehousing | 4 (44.4%) | 5 (55.6%) |
| Utilities | 2 (100.0%) | 0 (0.0%) |
| Information | 0 (0.0%) | 1 (100.0%) |
| Finance & Insurance | 0 (0.0%) | 0 (0.0%) |
| Real Estate, Rental & Leasing | 0 (0.0%) | 5 (100.0%) |
| Professional & Scientific | 0 (0.0%) | 2 (100.0%) |
| Enterprise Management | 0 (0.0%) | 0 (0.0%) |
| Administrative & Support | 2 (100.0%) | 0 (0.0%) |
| Educational Services | 1 (7.1%) | 13 (92.9%) |
| Health Care & Social Assistance | 3 (15.8%) | 16 (84.2%) |
| Arts, Entertainment & Recreation | 3 (100.0%) | 0 (0.0%) |
| Accommodation & Food Services | 0 (0.0%) | 1 (100.0%) |
| Public Administration | 4 (100.0%) | 0 (0.0%) |
| Total | 53 (38.4%) | 85 (61.6%) |
Education in Otis
School Enrollment in Otis
The most common levels of schooling among the 138 students in Otis are nursery / preschool (45 | 32.6%), elementary school (43 | 31.2%), and high school (29 | 21.0%).
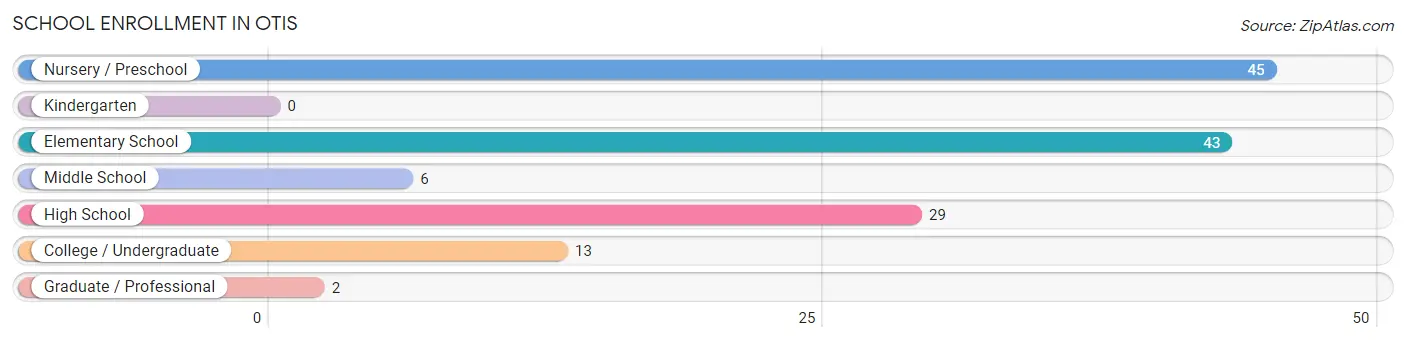
| School Level | # Students | % Students |
| Nursery / Preschool | 45 | 32.6% |
| Kindergarten | 0 | 0.0% |
| Elementary School | 43 | 31.2% |
| Middle School | 6 | 4.3% |
| High School | 29 | 21.0% |
| College / Undergraduate | 13 | 9.4% |
| Graduate / Professional | 2 | 1.5% |
| Total | 138 | 100.0% |
School Enrollment by Age by Funding Source in Otis
Out of a total of 138 students who are enrolled in schools in Otis, 7 (5.1%) attend a private institution, while the remaining 131 (94.9%) are enrolled in public schools. The age group of 20 to 24 year olds has the highest likelihood of being enrolled in private schools, with 7 (100.0% in the age bracket) enrolled. Conversely, the age group of 3 to 4 year olds has the lowest likelihood of being enrolled in a private school, with 45 (100.0% in the age bracket) attending a public institution.
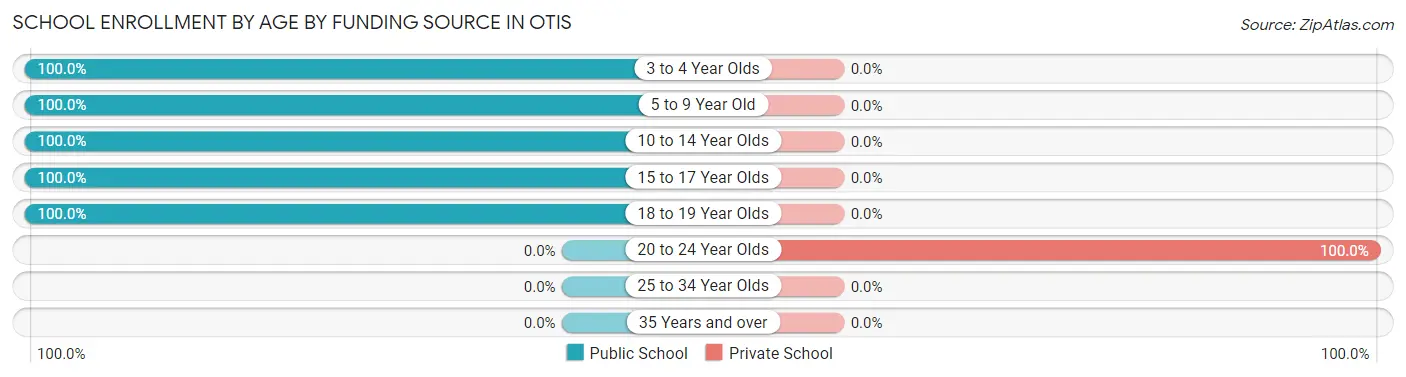
| Age Bracket | Public School | Private School |
| 3 to 4 Year Olds | 45 (100.0%) | 0 (0.0%) |
| 5 to 9 Year Old | 43 (100.0%) | 0 (0.0%) |
| 10 to 14 Year Olds | 6 (100.0%) | 0 (0.0%) |
| 15 to 17 Year Olds | 29 (100.0%) | 0 (0.0%) |
| 18 to 19 Year Olds | 8 (100.0%) | 0 (0.0%) |
| 20 to 24 Year Olds | 0 (0.0%) | 7 (100.0%) |
| 25 to 34 Year Olds | 0 (0.0%) | 0 (0.0%) |
| 35 Years and over | 0 (0.0%) | 0 (0.0%) |
| Total | 131 (94.9%) | 7 (5.1%) |
Educational Attainment by Field of Study in Otis
Psychology (6 | 35.3%), education (4 | 23.5%), arts & humanities (3 | 17.6%), social sciences (2 | 11.8%), and bio, nature & agricultural (1 | 5.9%) are the most common fields of study among 17 individuals in Otis who have obtained a bachelor's degree or higher.
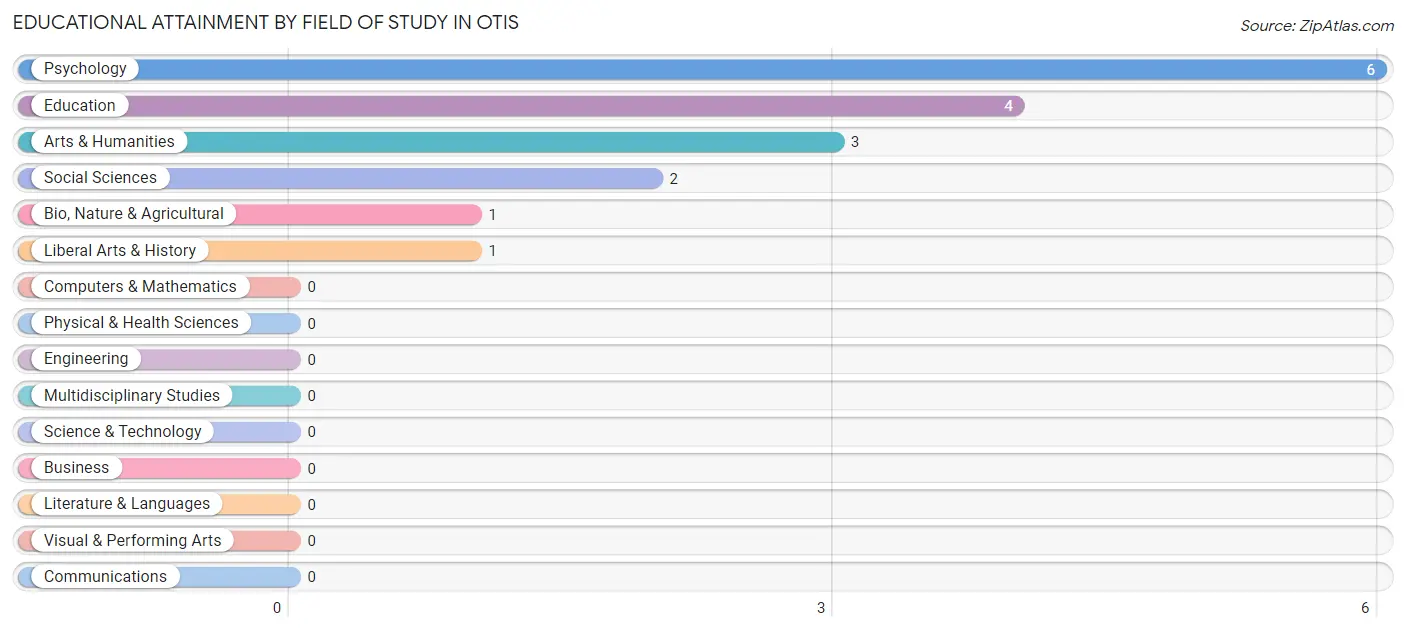
| Field of Study | # Graduates | % Graduates |
| Computers & Mathematics | 0 | 0.0% |
| Bio, Nature & Agricultural | 1 | 5.9% |
| Physical & Health Sciences | 0 | 0.0% |
| Psychology | 6 | 35.3% |
| Social Sciences | 2 | 11.8% |
| Engineering | 0 | 0.0% |
| Multidisciplinary Studies | 0 | 0.0% |
| Science & Technology | 0 | 0.0% |
| Business | 0 | 0.0% |
| Education | 4 | 23.5% |
| Literature & Languages | 0 | 0.0% |
| Liberal Arts & History | 1 | 5.9% |
| Visual & Performing Arts | 0 | 0.0% |
| Communications | 0 | 0.0% |
| Arts & Humanities | 3 | 17.6% |
| Total | 17 | 100.0% |
Transportation & Commute in Otis
Vehicle Availability by Sex in Otis
The most prevalent vehicle ownership categories in Otis are males with 3 vehicles (21, accounting for 39.6%) and females with 3 vehicles (11, making up 24.7%).
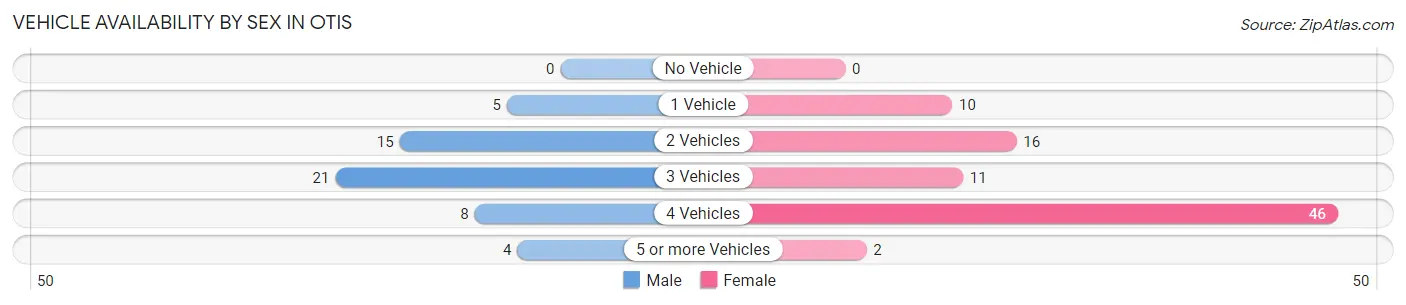
| Vehicles Available | Male | Female |
| No Vehicle | 0 (0.0%) | 0 (0.0%) |
| 1 Vehicle | 5 (9.4%) | 10 (11.8%) |
| 2 Vehicles | 15 (28.3%) | 16 (18.8%) |
| 3 Vehicles | 21 (39.6%) | 11 (12.9%) |
| 4 Vehicles | 8 (15.1%) | 46 (54.1%) |
| 5 or more Vehicles | 4 (7.5%) | 2 (2.4%) |
| Total | 53 (100.0%) | 85 (100.0%) |
Commute Time in Otis
The most frequently occuring commute durations in Otis are 90 or more minutes (29 commuters, 22.1%), 25 to 29 minutes (23 commuters, 17.6%), and 5 to 9 minutes (15 commuters, 11.5%).
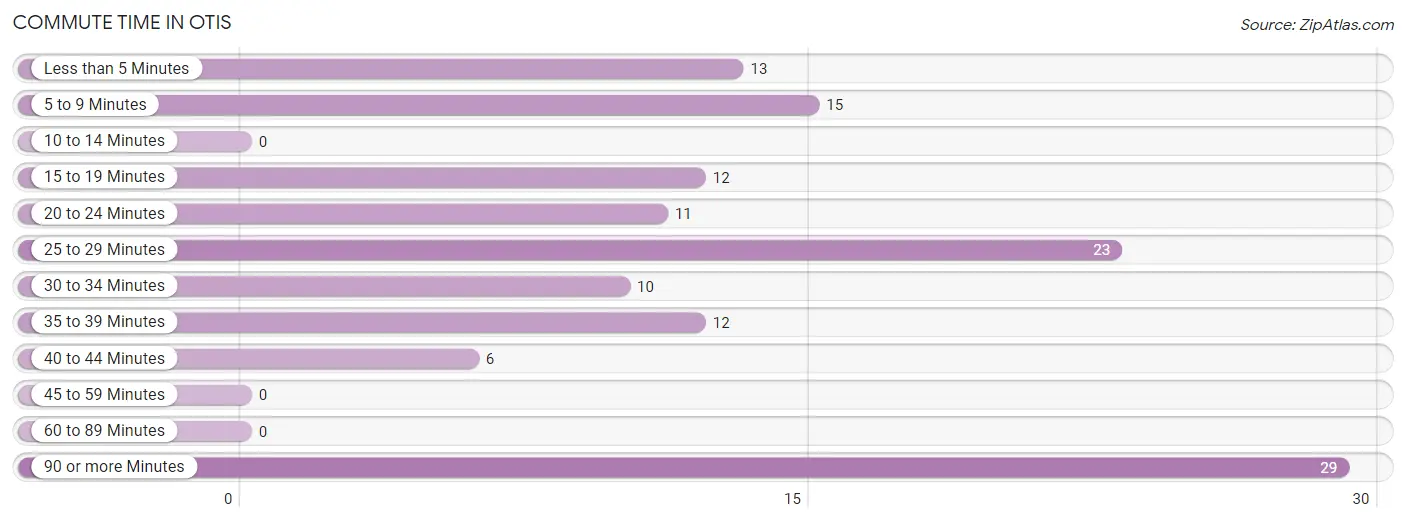
| Commute Time | # Commuters | % Commuters |
| Less than 5 Minutes | 13 | 9.9% |
| 5 to 9 Minutes | 15 | 11.5% |
| 10 to 14 Minutes | 0 | 0.0% |
| 15 to 19 Minutes | 12 | 9.2% |
| 20 to 24 Minutes | 11 | 8.4% |
| 25 to 29 Minutes | 23 | 17.6% |
| 30 to 34 Minutes | 10 | 7.6% |
| 35 to 39 Minutes | 12 | 9.2% |
| 40 to 44 Minutes | 6 | 4.6% |
| 45 to 59 Minutes | 0 | 0.0% |
| 60 to 89 Minutes | 0 | 0.0% |
| 90 or more Minutes | 29 | 22.1% |
Commute Time by Sex in Otis
The most common commute times in Otis are 25 to 29 minutes (13 commuters, 27.1%) for males and 90 or more minutes (29 commuters, 34.9%) for females.
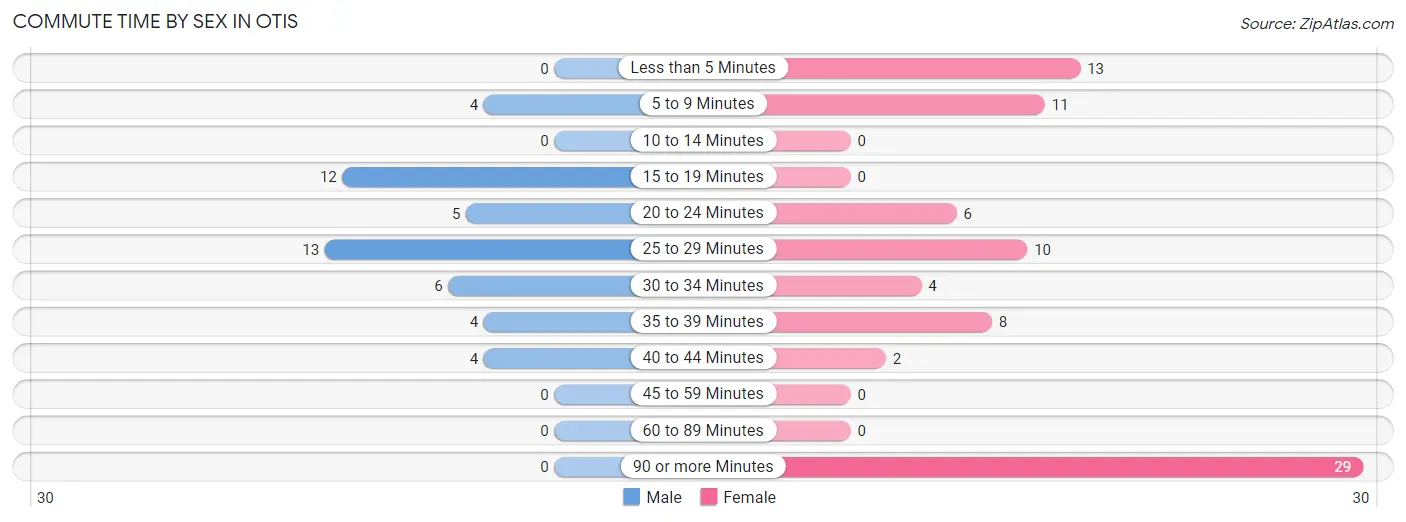
| Commute Time | Male | Female |
| Less than 5 Minutes | 0 (0.0%) | 13 (15.7%) |
| 5 to 9 Minutes | 4 (8.3%) | 11 (13.3%) |
| 10 to 14 Minutes | 0 (0.0%) | 0 (0.0%) |
| 15 to 19 Minutes | 12 (25.0%) | 0 (0.0%) |
| 20 to 24 Minutes | 5 (10.4%) | 6 (7.2%) |
| 25 to 29 Minutes | 13 (27.1%) | 10 (12.0%) |
| 30 to 34 Minutes | 6 (12.5%) | 4 (4.8%) |
| 35 to 39 Minutes | 4 (8.3%) | 8 (9.6%) |
| 40 to 44 Minutes | 4 (8.3%) | 2 (2.4%) |
| 45 to 59 Minutes | 0 (0.0%) | 0 (0.0%) |
| 60 to 89 Minutes | 0 (0.0%) | 0 (0.0%) |
| 90 or more Minutes | 0 (0.0%) | 29 (34.9%) |
Time of Departure to Work by Sex in Otis
The most frequent times of departure to work in Otis are 7:00 AM to 7:29 AM (11, 22.9%) for males and 12:00 AM to 4:59 AM (30, 36.1%) for females.
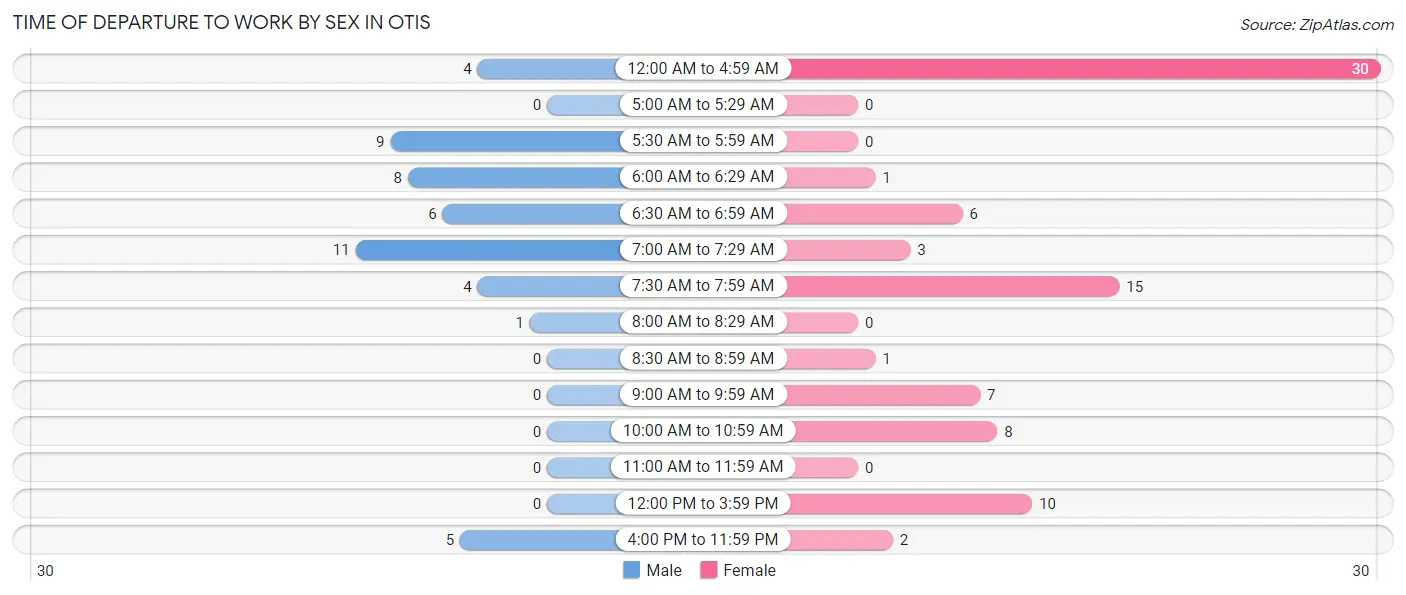
| Time of Departure | Male | Female |
| 12:00 AM to 4:59 AM | 4 (8.3%) | 30 (36.1%) |
| 5:00 AM to 5:29 AM | 0 (0.0%) | 0 (0.0%) |
| 5:30 AM to 5:59 AM | 9 (18.8%) | 0 (0.0%) |
| 6:00 AM to 6:29 AM | 8 (16.7%) | 1 (1.2%) |
| 6:30 AM to 6:59 AM | 6 (12.5%) | 6 (7.2%) |
| 7:00 AM to 7:29 AM | 11 (22.9%) | 3 (3.6%) |
| 7:30 AM to 7:59 AM | 4 (8.3%) | 15 (18.1%) |
| 8:00 AM to 8:29 AM | 1 (2.1%) | 0 (0.0%) |
| 8:30 AM to 8:59 AM | 0 (0.0%) | 1 (1.2%) |
| 9:00 AM to 9:59 AM | 0 (0.0%) | 7 (8.4%) |
| 10:00 AM to 10:59 AM | 0 (0.0%) | 8 (9.6%) |
| 11:00 AM to 11:59 AM | 0 (0.0%) | 0 (0.0%) |
| 12:00 PM to 3:59 PM | 0 (0.0%) | 10 (12.0%) |
| 4:00 PM to 11:59 PM | 5 (10.4%) | 2 (2.4%) |
| Total | 48 (100.0%) | 83 (100.0%) |
Housing Occupancy in Otis
Occupancy by Ownership in Otis
Of the total 105 dwellings in Otis, owner-occupied units account for 93 (88.6%), while renter-occupied units make up 12 (11.4%).
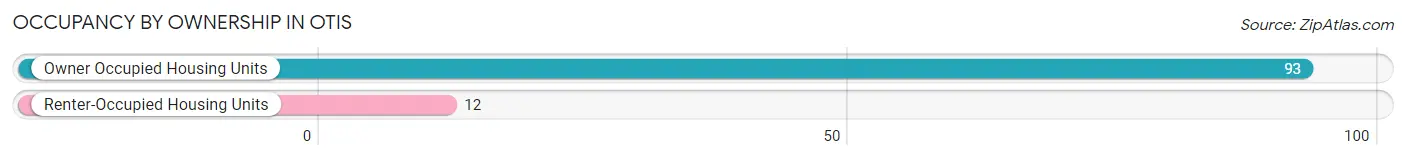
| Occupancy | # Housing Units | % Housing Units |
| Owner Occupied Housing Units | 93 | 88.6% |
| Renter-Occupied Housing Units | 12 | 11.4% |
| Total Occupied Housing Units | 105 | 100.0% |
Occupancy by Household Size in Otis
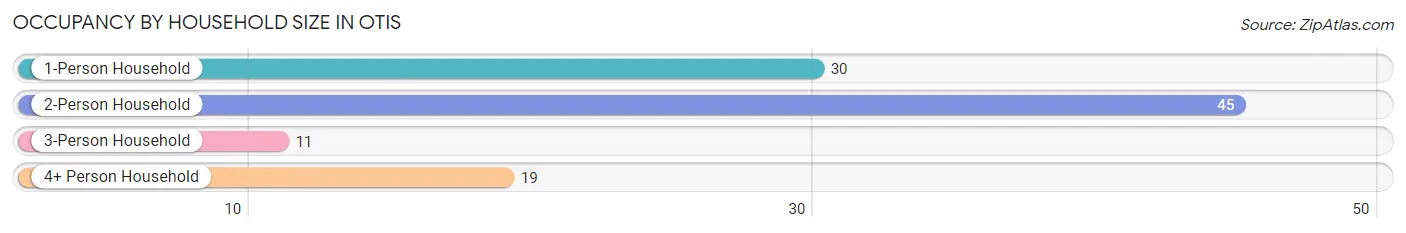
| Household Size | # Housing Units | % Housing Units |
| 1-Person Household | 30 | 28.6% |
| 2-Person Household | 45 | 42.9% |
| 3-Person Household | 11 | 10.5% |
| 4+ Person Household | 19 | 18.1% |
| Total Housing Units | 105 | 100.0% |
Occupancy by Ownership by Household Size in Otis
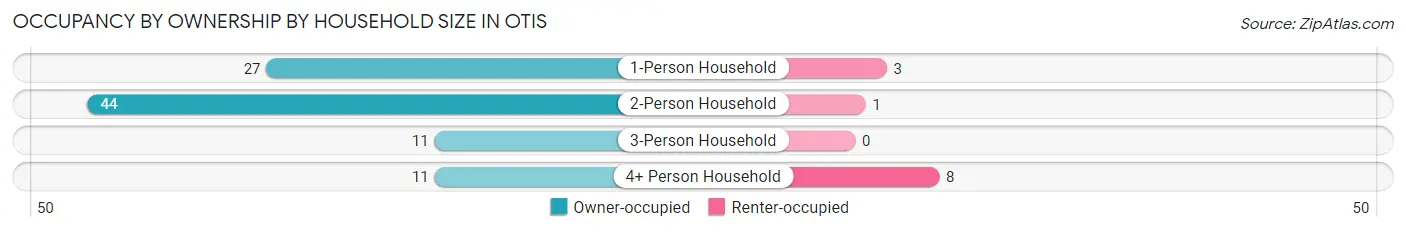
| Household Size | Owner-occupied | Renter-occupied |
| 1-Person Household | 27 (90.0%) | 3 (10.0%) |
| 2-Person Household | 44 (97.8%) | 1 (2.2%) |
| 3-Person Household | 11 (100.0%) | 0 (0.0%) |
| 4+ Person Household | 11 (57.9%) | 8 (42.1%) |
| Total Housing Units | 93 (88.6%) | 12 (11.4%) |
Occupancy by Educational Attainment in Otis
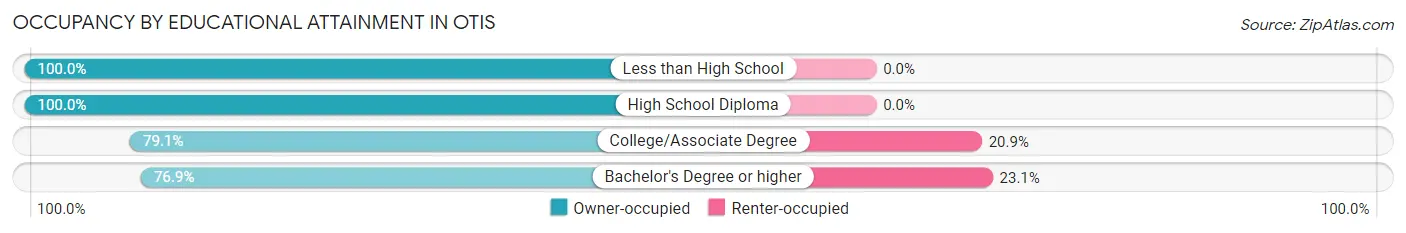
| Household Size | Owner-occupied | Renter-occupied |
| Less than High School | 15 (100.0%) | 0 (0.0%) |
| High School Diploma | 34 (100.0%) | 0 (0.0%) |
| College/Associate Degree | 34 (79.1%) | 9 (20.9%) |
| Bachelor's Degree or higher | 10 (76.9%) | 3 (23.1%) |
Occupancy by Age of Householder in Otis
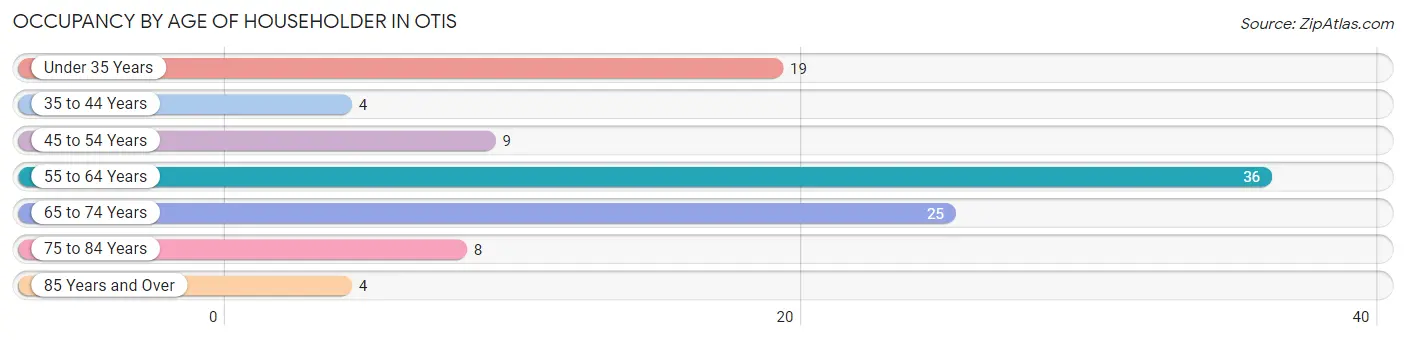
| Age Bracket | # Households | % Households |
| Under 35 Years | 19 | 18.1% |
| 35 to 44 Years | 4 | 3.8% |
| 45 to 54 Years | 9 | 8.6% |
| 55 to 64 Years | 36 | 34.3% |
| 65 to 74 Years | 25 | 23.8% |
| 75 to 84 Years | 8 | 7.6% |
| 85 Years and Over | 4 | 3.8% |
| Total | 105 | 100.0% |
Housing Finances in Otis
Median Income by Occupancy in Otis
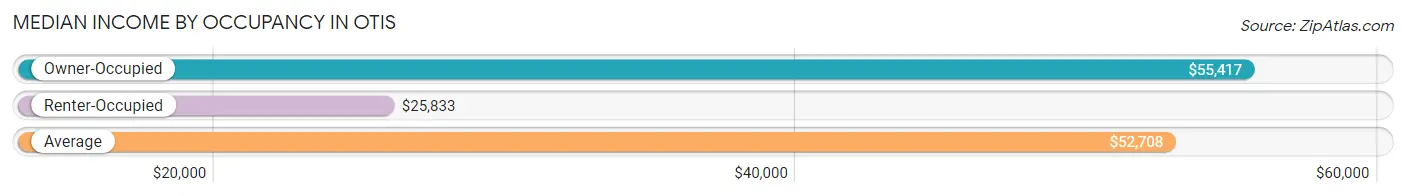
| Occupancy Type | # Households | Median Income |
| Owner-Occupied | 93 (88.6%) | $55,417 |
| Renter-Occupied | 12 (11.4%) | $25,833 |
| Average | 105 (100.0%) | $52,708 |
Occupancy by Householder Income Bracket in Otis
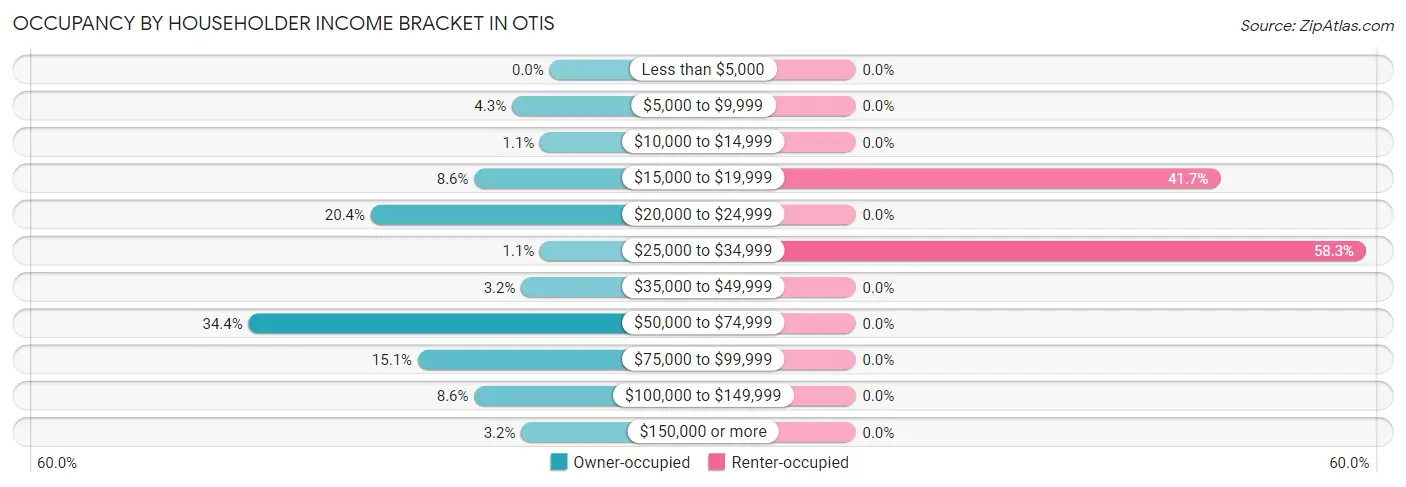
| Income Bracket | Owner-occupied | Renter-occupied |
| Less than $5,000 | 0 (0.0%) | 0 (0.0%) |
| $5,000 to $9,999 | 4 (4.3%) | 0 (0.0%) |
| $10,000 to $14,999 | 1 (1.1%) | 0 (0.0%) |
| $15,000 to $19,999 | 8 (8.6%) | 5 (41.7%) |
| $20,000 to $24,999 | 19 (20.4%) | 0 (0.0%) |
| $25,000 to $34,999 | 1 (1.1%) | 7 (58.3%) |
| $35,000 to $49,999 | 3 (3.2%) | 0 (0.0%) |
| $50,000 to $74,999 | 32 (34.4%) | 0 (0.0%) |
| $75,000 to $99,999 | 14 (15.0%) | 0 (0.0%) |
| $100,000 to $149,999 | 8 (8.6%) | 0 (0.0%) |
| $150,000 or more | 3 (3.2%) | 0 (0.0%) |
| Total | 93 (100.0%) | 12 (100.0%) |
Monthly Housing Cost Tiers in Otis
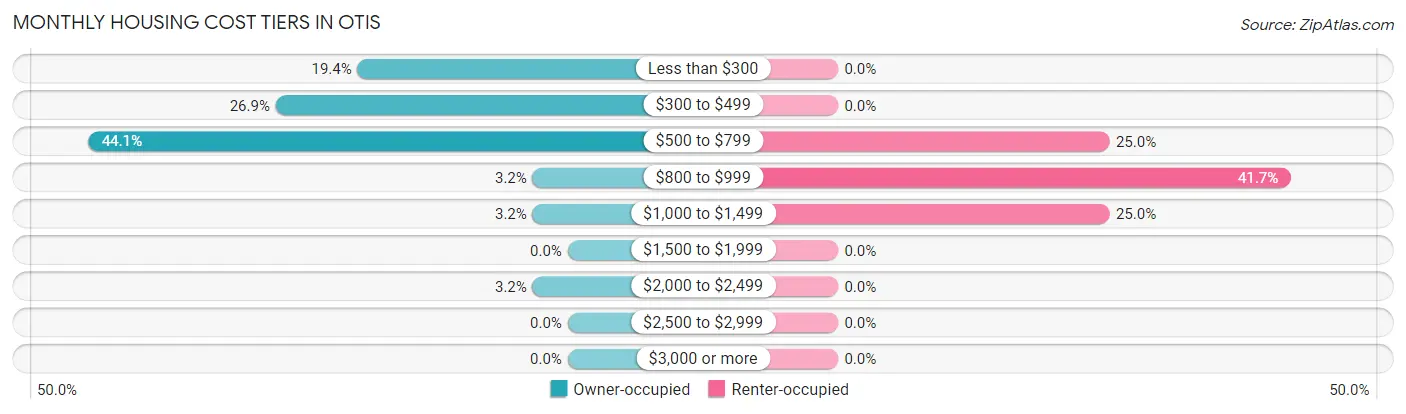
| Monthly Cost | Owner-occupied | Renter-occupied |
| Less than $300 | 18 (19.4%) | 0 (0.0%) |
| $300 to $499 | 25 (26.9%) | 0 (0.0%) |
| $500 to $799 | 41 (44.1%) | 3 (25.0%) |
| $800 to $999 | 3 (3.2%) | 5 (41.7%) |
| $1,000 to $1,499 | 3 (3.2%) | 3 (25.0%) |
| $1,500 to $1,999 | 0 (0.0%) | 0 (0.0%) |
| $2,000 to $2,499 | 3 (3.2%) | 0 (0.0%) |
| $2,500 to $2,999 | 0 (0.0%) | 0 (0.0%) |
| $3,000 or more | 0 (0.0%) | 0 (0.0%) |
| Total | 93 (100.0%) | 12 (100.0%) |
Physical Housing Characteristics in Otis
Housing Structures in Otis
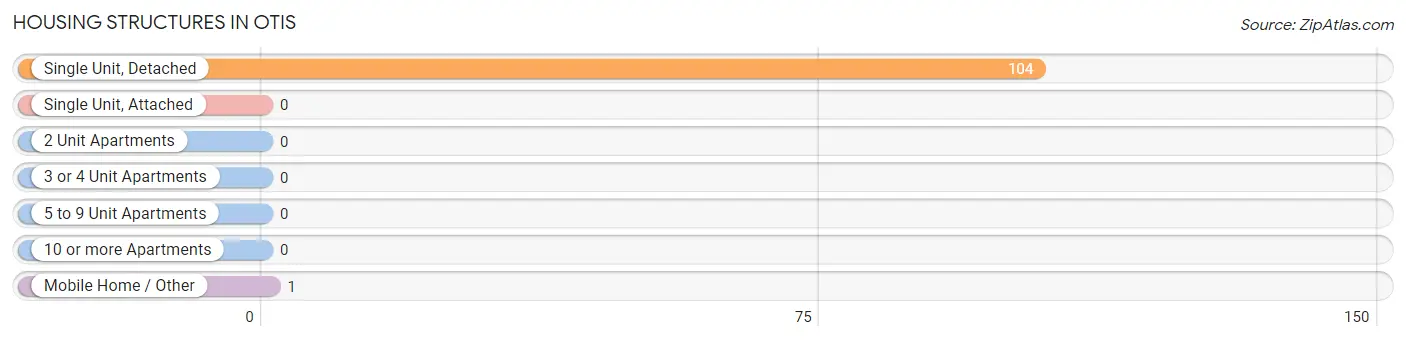
| Structure Type | # Housing Units | % Housing Units |
| Single Unit, Detached | 104 | 99.1% |
| Single Unit, Attached | 0 | 0.0% |
| 2 Unit Apartments | 0 | 0.0% |
| 3 or 4 Unit Apartments | 0 | 0.0% |
| 5 to 9 Unit Apartments | 0 | 0.0% |
| 10 or more Apartments | 0 | 0.0% |
| Mobile Home / Other | 1 | 0.9% |
| Total | 105 | 100.0% |
Housing Structures by Occupancy in Otis
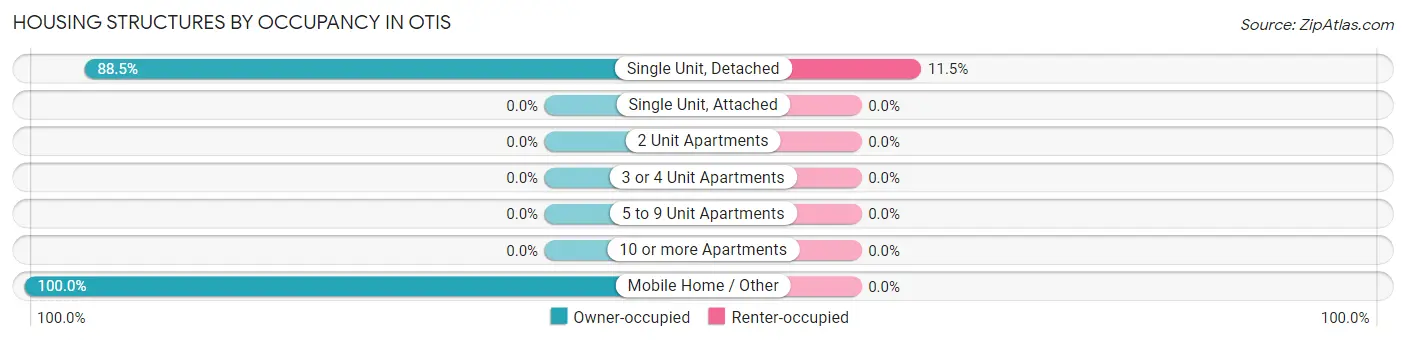
| Structure Type | Owner-occupied | Renter-occupied |
| Single Unit, Detached | 92 (88.5%) | 12 (11.5%) |
| Single Unit, Attached | 0 (0.0%) | 0 (0.0%) |
| 2 Unit Apartments | 0 (0.0%) | 0 (0.0%) |
| 3 or 4 Unit Apartments | 0 (0.0%) | 0 (0.0%) |
| 5 to 9 Unit Apartments | 0 (0.0%) | 0 (0.0%) |
| 10 or more Apartments | 0 (0.0%) | 0 (0.0%) |
| Mobile Home / Other | 1 (100.0%) | 0 (0.0%) |
| Total | 93 (88.6%) | 12 (11.4%) |
Housing Structures by Number of Rooms in Otis
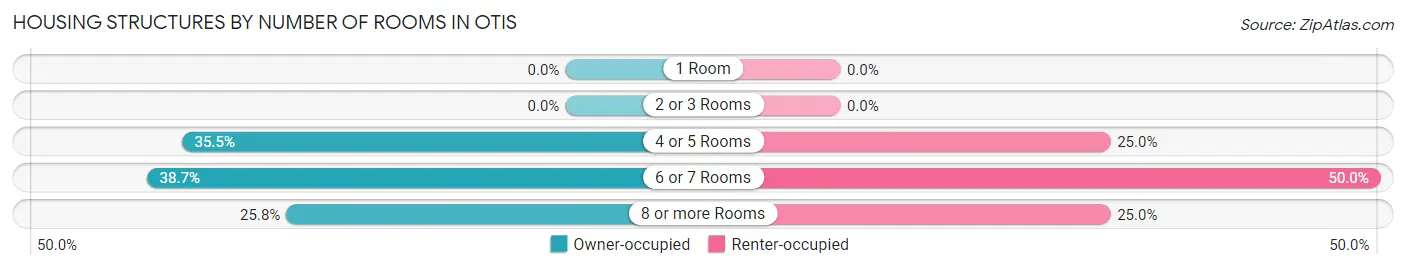
| Number of Rooms | Owner-occupied | Renter-occupied |
| 1 Room | 0 (0.0%) | 0 (0.0%) |
| 2 or 3 Rooms | 0 (0.0%) | 0 (0.0%) |
| 4 or 5 Rooms | 33 (35.5%) | 3 (25.0%) |
| 6 or 7 Rooms | 36 (38.7%) | 6 (50.0%) |
| 8 or more Rooms | 24 (25.8%) | 3 (25.0%) |
| Total | 93 (100.0%) | 12 (100.0%) |
Housing Structure by Heating Type in Otis
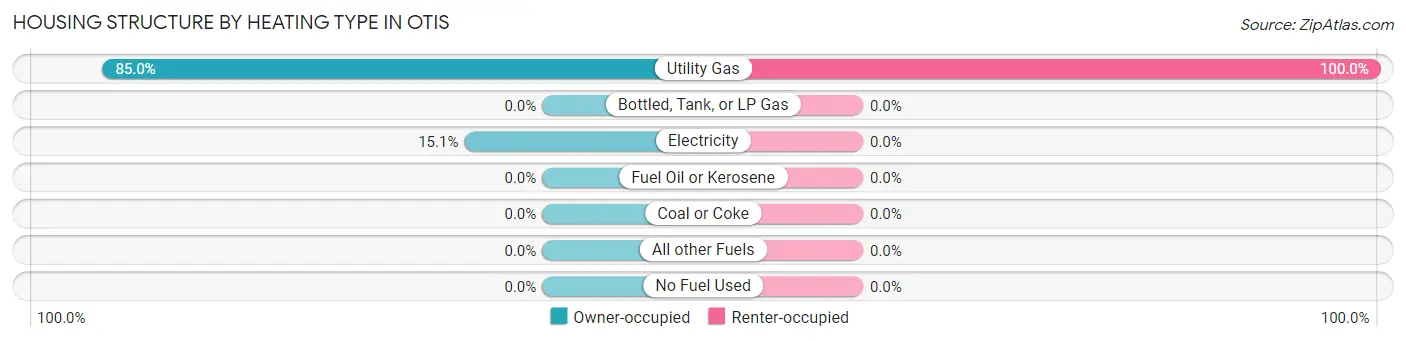
| Heating Type | Owner-occupied | Renter-occupied |
| Utility Gas | 79 (85.0%) | 12 (100.0%) |
| Bottled, Tank, or LP Gas | 0 (0.0%) | 0 (0.0%) |
| Electricity | 14 (15.0%) | 0 (0.0%) |
| Fuel Oil or Kerosene | 0 (0.0%) | 0 (0.0%) |
| Coal or Coke | 0 (0.0%) | 0 (0.0%) |
| All other Fuels | 0 (0.0%) | 0 (0.0%) |
| No Fuel Used | 0 (0.0%) | 0 (0.0%) |
| Total | 93 (100.0%) | 12 (100.0%) |
Household Vehicle Usage in Otis
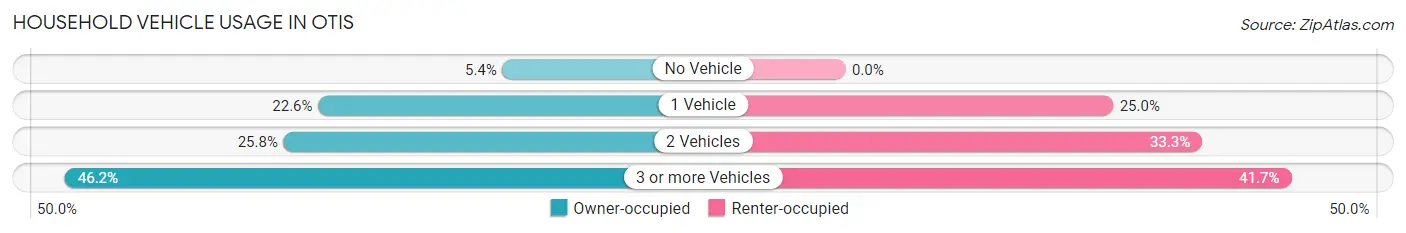
| Vehicles per Household | Owner-occupied | Renter-occupied |
| No Vehicle | 5 (5.4%) | 0 (0.0%) |
| 1 Vehicle | 21 (22.6%) | 3 (25.0%) |
| 2 Vehicles | 24 (25.8%) | 4 (33.3%) |
| 3 or more Vehicles | 43 (46.2%) | 5 (41.7%) |
| Total | 93 (100.0%) | 12 (100.0%) |
Real Estate & Mortgages in Otis
Real Estate and Mortgage Overview in Otis
| Characteristic | Without Mortgage | With Mortgage |
| Housing Units | 68 | 25 |
| Median Property Value | $55,000 | $58,800 |
| Median Household Income | $56,667 | $0 |
| Monthly Housing Costs | $397 | $0 |
| Real Estate Taxes | $955 | $0 |
Property Value by Mortgage Status in Otis
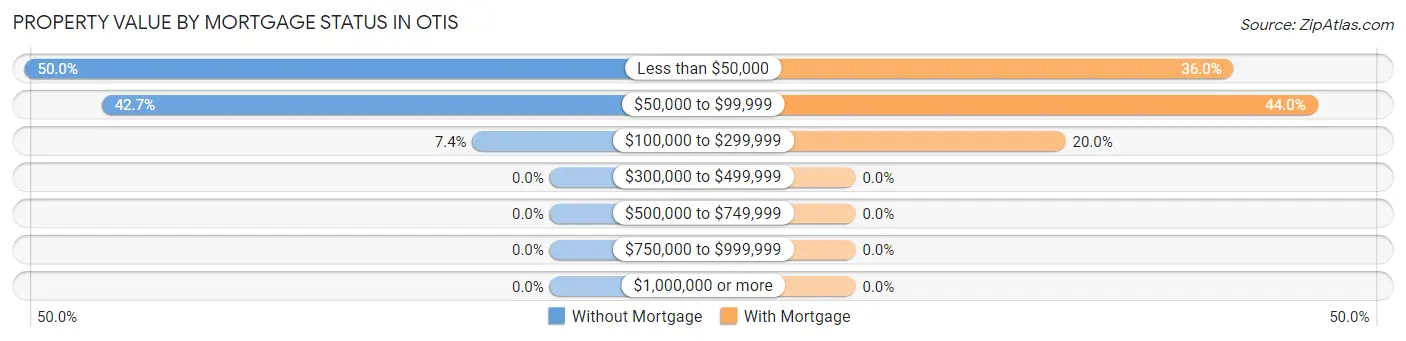
| Property Value | Without Mortgage | With Mortgage |
| Less than $50,000 | 34 (50.0%) | 9 (36.0%) |
| $50,000 to $99,999 | 29 (42.6%) | 11 (44.0%) |
| $100,000 to $299,999 | 5 (7.3%) | 5 (20.0%) |
| $300,000 to $499,999 | 0 (0.0%) | 0 (0.0%) |
| $500,000 to $749,999 | 0 (0.0%) | 0 (0.0%) |
| $750,000 to $999,999 | 0 (0.0%) | 0 (0.0%) |
| $1,000,000 or more | 0 (0.0%) | 0 (0.0%) |
| Total | 68 (100.0%) | 25 (100.0%) |
Household Income by Mortgage Status in Otis
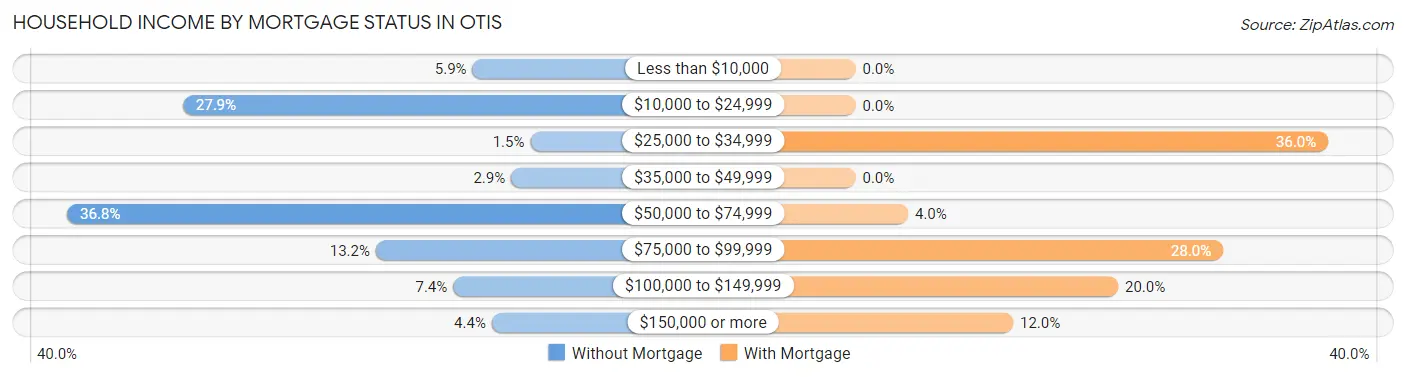
| Household Income | Without Mortgage | With Mortgage |
| Less than $10,000 | 4 (5.9%) | 0 (0.0%) |
| $10,000 to $24,999 | 19 (27.9%) | 0 (0.0%) |
| $25,000 to $34,999 | 1 (1.5%) | 9 (36.0%) |
| $35,000 to $49,999 | 2 (2.9%) | 0 (0.0%) |
| $50,000 to $74,999 | 25 (36.8%) | 1 (4.0%) |
| $75,000 to $99,999 | 9 (13.2%) | 7 (28.0%) |
| $100,000 to $149,999 | 5 (7.3%) | 5 (20.0%) |
| $150,000 or more | 3 (4.4%) | 3 (12.0%) |
| Total | 68 (100.0%) | 25 (100.0%) |
Property Value to Household Income Ratio in Otis
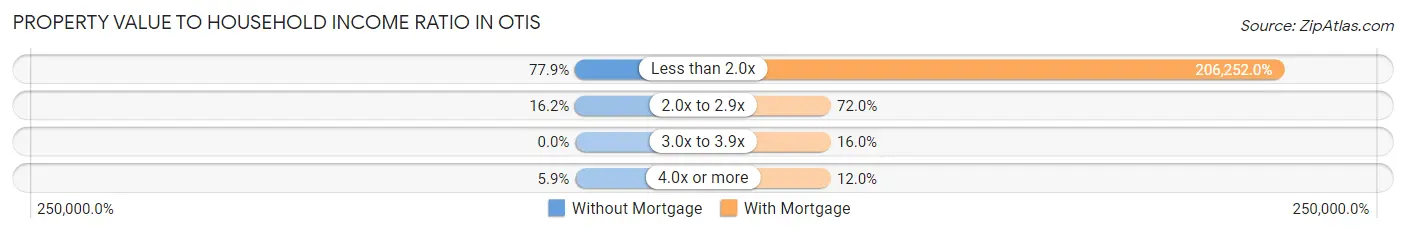
| Value-to-Income Ratio | Without Mortgage | With Mortgage |
| Less than 2.0x | 53 (77.9%) | 51,563 (206,252.0%) |
| 2.0x to 2.9x | 11 (16.2%) | 18 (72.0%) |
| 3.0x to 3.9x | 0 (0.0%) | 4 (16.0%) |
| 4.0x or more | 4 (5.9%) | 3 (12.0%) |
| Total | 68 (100.0%) | 25 (100.0%) |
Real Estate Taxes by Mortgage Status in Otis
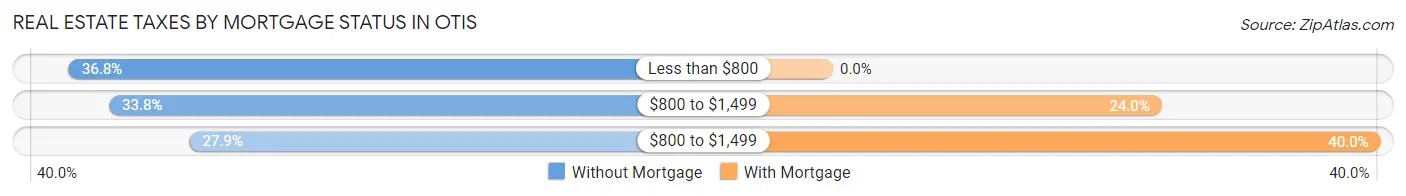
| Property Taxes | Without Mortgage | With Mortgage |
| Less than $800 | 25 (36.8%) | 0 (0.0%) |
| $800 to $1,499 | 23 (33.8%) | 6 (24.0%) |
| $800 to $1,499 | 19 (27.9%) | 10 (40.0%) |
| Total | 68 (100.0%) | 25 (100.0%) |
Health & Disability in Otis
Health Insurance Coverage by Age in Otis
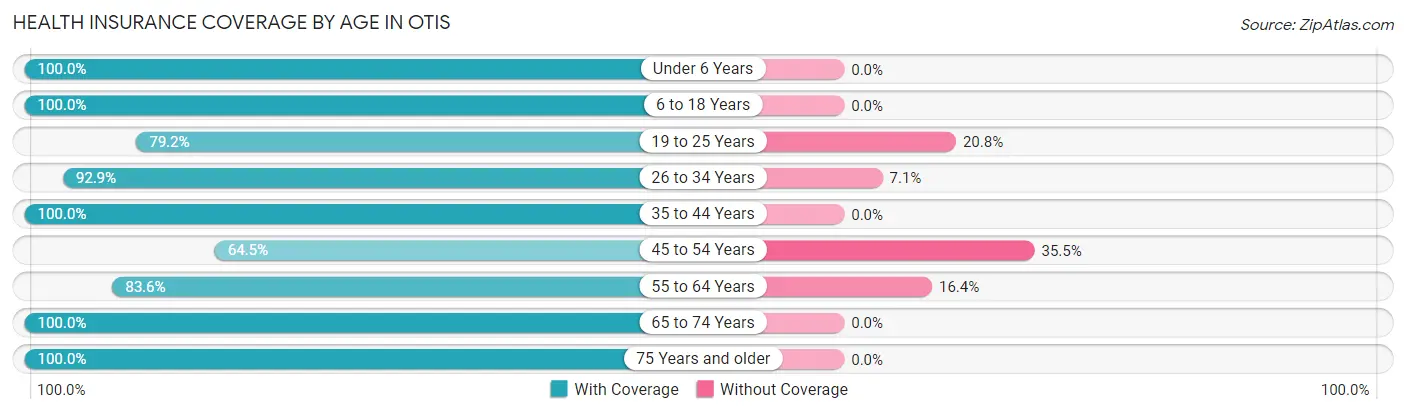
| Age Bracket | With Coverage | Without Coverage |
| Under 6 Years | 57 (100.0%) | 0 (0.0%) |
| 6 to 18 Years | 78 (100.0%) | 0 (0.0%) |
| 19 to 25 Years | 19 (79.2%) | 5 (20.8%) |
| 26 to 34 Years | 39 (92.9%) | 3 (7.1%) |
| 35 to 44 Years | 37 (100.0%) | 0 (0.0%) |
| 45 to 54 Years | 20 (64.5%) | 11 (35.5%) |
| 55 to 64 Years | 46 (83.6%) | 9 (16.4%) |
| 65 to 74 Years | 38 (100.0%) | 0 (0.0%) |
| 75 Years and older | 13 (100.0%) | 0 (0.0%) |
| Total | 347 (92.5%) | 28 (7.5%) |
Health Insurance Coverage by Citizenship Status in Otis
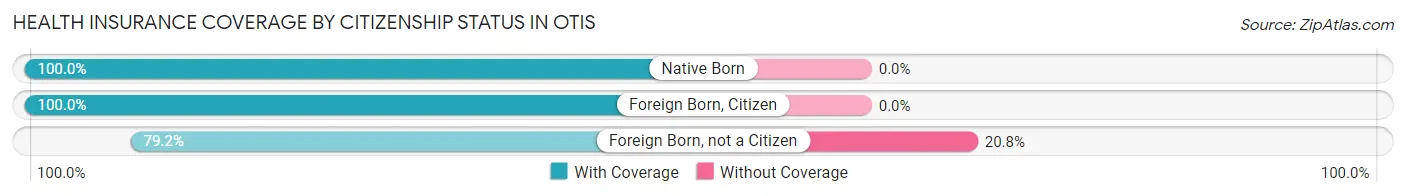
| Citizenship Status | With Coverage | Without Coverage |
| Native Born | 57 (100.0%) | 0 (0.0%) |
| Foreign Born, Citizen | 78 (100.0%) | 0 (0.0%) |
| Foreign Born, not a Citizen | 19 (79.2%) | 5 (20.8%) |
Health Insurance Coverage by Household Income in Otis
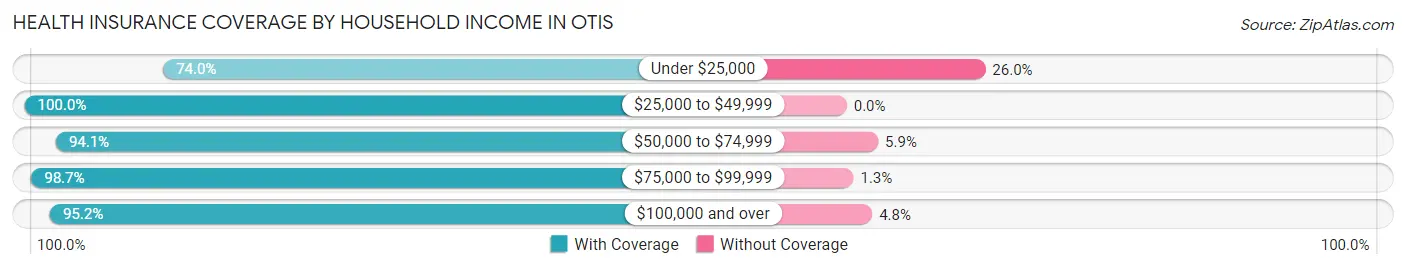
| Household Income | With Coverage | Without Coverage |
| Under $25,000 | 57 (74.0%) | 20 (26.0%) |
| $25,000 to $49,999 | 29 (100.0%) | 0 (0.0%) |
| $50,000 to $74,999 | 64 (94.1%) | 4 (5.9%) |
| $75,000 to $99,999 | 157 (98.7%) | 2 (1.3%) |
| $100,000 and over | 40 (95.2%) | 2 (4.8%) |
Public vs Private Health Insurance Coverage by Age in Otis
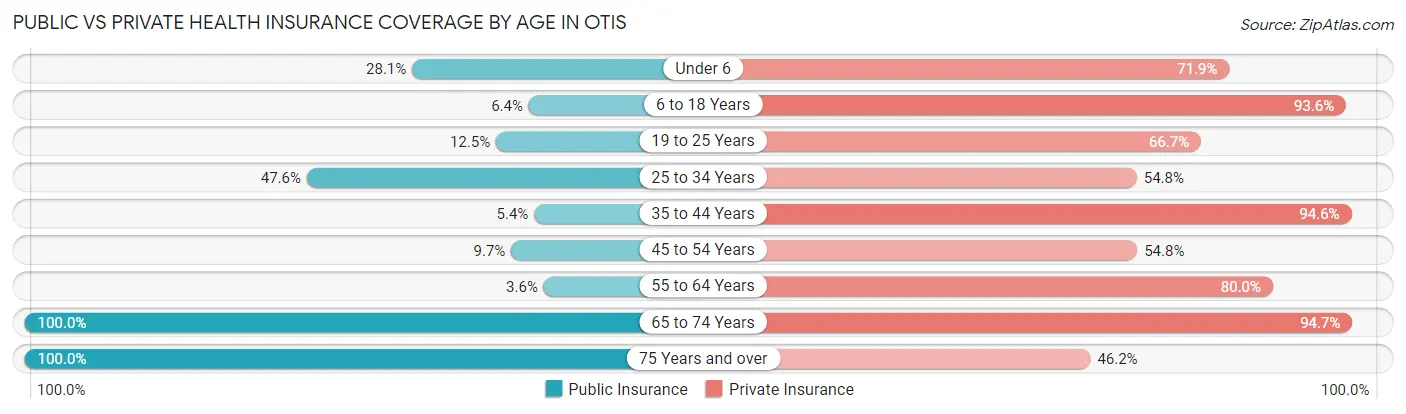
| Age Bracket | Public Insurance | Private Insurance |
| Under 6 | 16 (28.1%) | 41 (71.9%) |
| 6 to 18 Years | 5 (6.4%) | 73 (93.6%) |
| 19 to 25 Years | 3 (12.5%) | 16 (66.7%) |
| 25 to 34 Years | 20 (47.6%) | 23 (54.8%) |
| 35 to 44 Years | 2 (5.4%) | 35 (94.6%) |
| 45 to 54 Years | 3 (9.7%) | 17 (54.8%) |
| 55 to 64 Years | 2 (3.6%) | 44 (80.0%) |
| 65 to 74 Years | 38 (100.0%) | 36 (94.7%) |
| 75 Years and over | 13 (100.0%) | 6 (46.2%) |
| Total | 102 (27.2%) | 291 (77.6%) |
Disability Status by Sex by Age in Otis
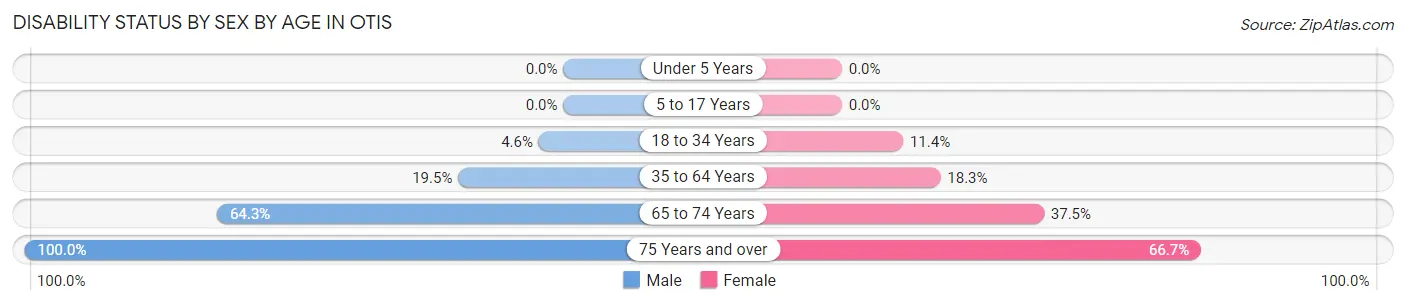
| Age Bracket | Male | Female |
| Under 5 Years | 0 (0.0%) | 0 (0.0%) |
| 5 to 17 Years | 0 (0.0%) | 0 (0.0%) |
| 18 to 34 Years | 1 (4.5%) | 5 (11.4%) |
| 35 to 64 Years | 8 (19.5%) | 15 (18.3%) |
| 65 to 74 Years | 9 (64.3%) | 9 (37.5%) |
| 75 Years and over | 7 (100.0%) | 4 (66.7%) |
Disability Class by Sex by Age in Otis
Disability Class: Hearing Difficulty
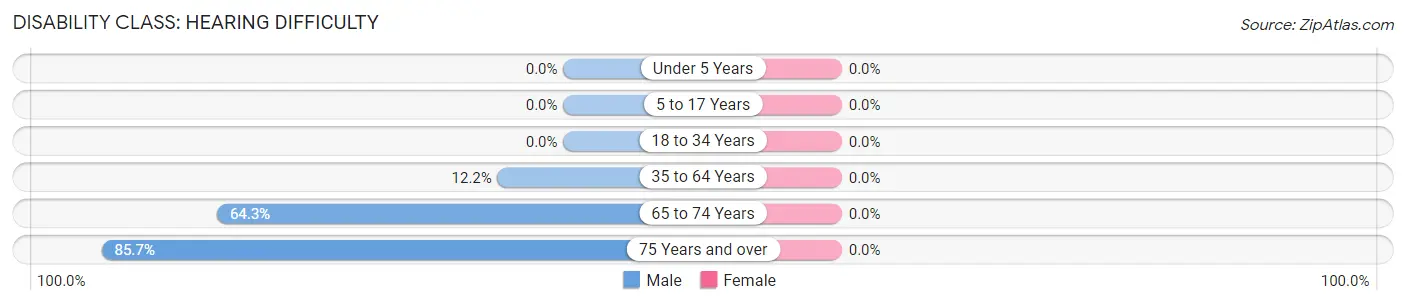
| Age Bracket | Male | Female |
| Under 5 Years | 0 (0.0%) | 0 (0.0%) |
| 5 to 17 Years | 0 (0.0%) | 0 (0.0%) |
| 18 to 34 Years | 0 (0.0%) | 0 (0.0%) |
| 35 to 64 Years | 5 (12.2%) | 0 (0.0%) |
| 65 to 74 Years | 9 (64.3%) | 0 (0.0%) |
| 75 Years and over | 6 (85.7%) | 0 (0.0%) |
Disability Class: Vision Difficulty
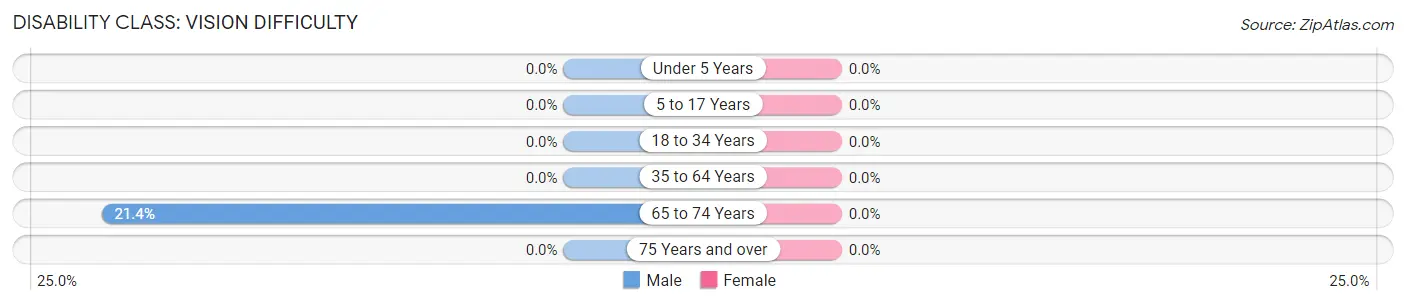
| Age Bracket | Male | Female |
| Under 5 Years | 0 (0.0%) | 0 (0.0%) |
| 5 to 17 Years | 0 (0.0%) | 0 (0.0%) |
| 18 to 34 Years | 0 (0.0%) | 0 (0.0%) |
| 35 to 64 Years | 0 (0.0%) | 0 (0.0%) |
| 65 to 74 Years | 3 (21.4%) | 0 (0.0%) |
| 75 Years and over | 0 (0.0%) | 0 (0.0%) |
Disability Class: Cognitive Difficulty
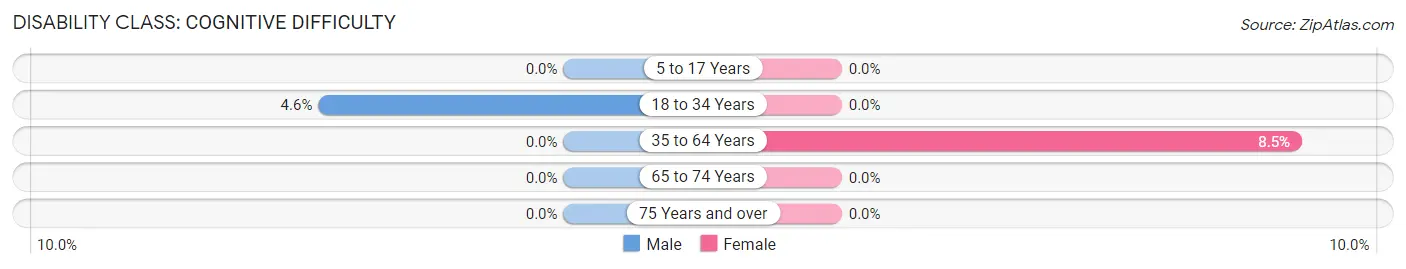
| Age Bracket | Male | Female |
| 5 to 17 Years | 0 (0.0%) | 0 (0.0%) |
| 18 to 34 Years | 1 (4.5%) | 0 (0.0%) |
| 35 to 64 Years | 0 (0.0%) | 7 (8.5%) |
| 65 to 74 Years | 0 (0.0%) | 0 (0.0%) |
| 75 Years and over | 0 (0.0%) | 0 (0.0%) |
Disability Class: Ambulatory Difficulty
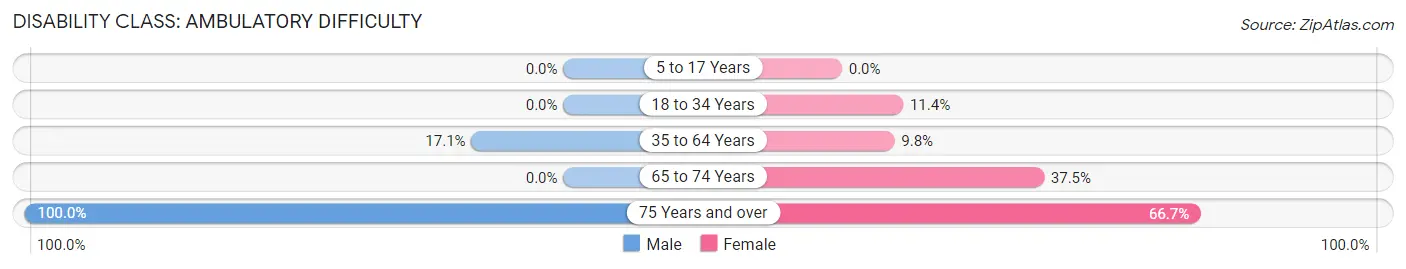
| Age Bracket | Male | Female |
| 5 to 17 Years | 0 (0.0%) | 0 (0.0%) |
| 18 to 34 Years | 0 (0.0%) | 5 (11.4%) |
| 35 to 64 Years | 7 (17.1%) | 8 (9.8%) |
| 65 to 74 Years | 0 (0.0%) | 9 (37.5%) |
| 75 Years and over | 7 (100.0%) | 4 (66.7%) |
Disability Class: Self-Care Difficulty
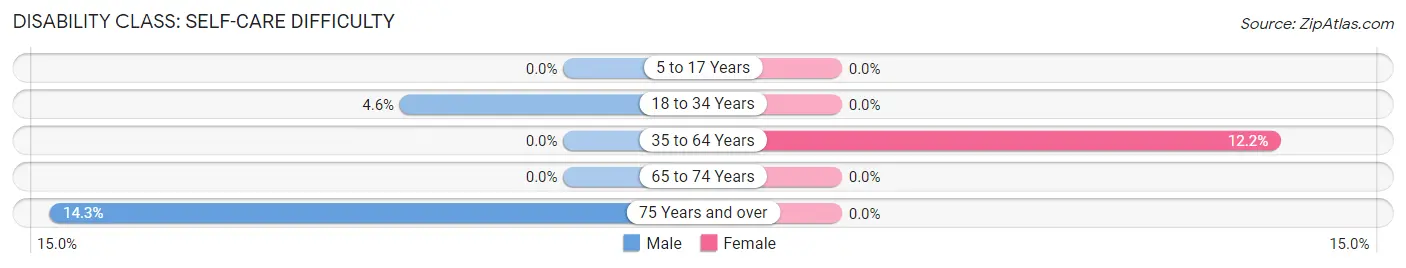
| Age Bracket | Male | Female |
| 5 to 17 Years | 0 (0.0%) | 0 (0.0%) |
| 18 to 34 Years | 1 (4.5%) | 0 (0.0%) |
| 35 to 64 Years | 0 (0.0%) | 10 (12.2%) |
| 65 to 74 Years | 0 (0.0%) | 0 (0.0%) |
| 75 Years and over | 1 (14.3%) | 0 (0.0%) |
Technology Access in Otis
Computing Device Access in Otis
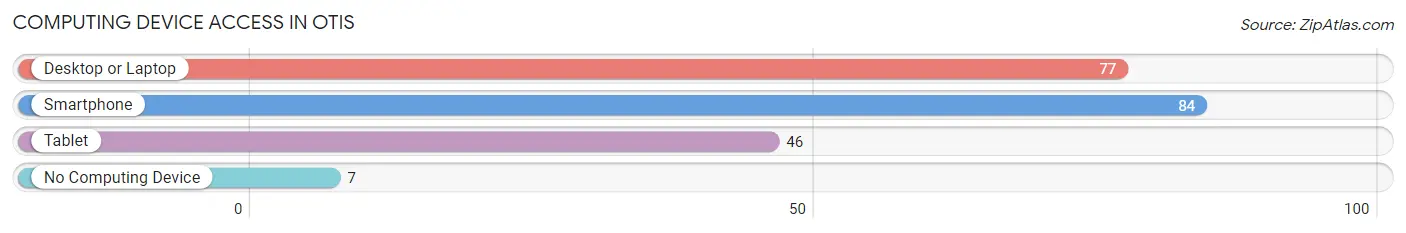
| Device Type | # Households | % Households |
| Desktop or Laptop | 77 | 73.3% |
| Smartphone | 84 | 80.0% |
| Tablet | 46 | 43.8% |
| No Computing Device | 7 | 6.7% |
| Total | 105 | 100.0% |
Internet Access in Otis
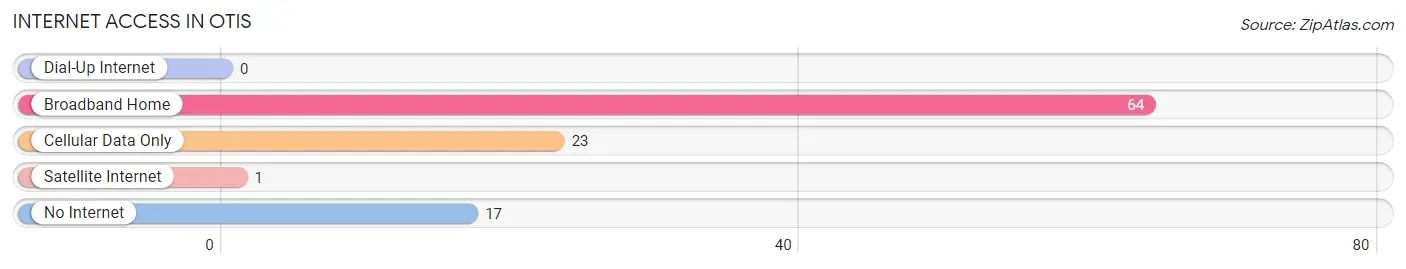
| Internet Type | # Households | % Households |
| Dial-Up Internet | 0 | 0.0% |
| Broadband Home | 64 | 61.0% |
| Cellular Data Only | 23 | 21.9% |
| Satellite Internet | 1 | 0.9% |
| No Internet | 17 | 16.2% |
| Total | 105 | 100.0% |
Otis Summary
Otis, Kansas is a small town located in the northwest corner of the state, in the county of Thomas. It is situated on the banks of the Smoky Hill River, and is surrounded by rolling hills and prairies. The town was founded in 1887, and has a population of just over 500 people.
Geography
Otis is located in the northwest corner of Kansas, in Thomas County. It is situated on the banks of the Smoky Hill River, and is surrounded by rolling hills and prairies. The town is located at an elevation of 1,845 feet above sea level. The climate in Otis is semi-arid, with hot summers and cold winters. The average annual temperature is around 55 degrees Fahrenheit.
Economy
The economy of Otis is largely based on agriculture. The town is home to several farms, which produce a variety of crops, including wheat, corn, soybeans, and sorghum. The town also has a few small businesses, including a grocery store, a hardware store, and a few restaurants.
Demographics
As of the 2010 census, the population of Otis was 514. The racial makeup of the town was 97.3% White, 0.6% African American, 0.2% Native American, 0.2% Asian, 0.2% from other races, and 1.7% from two or more races. The median household income was $37,500, and the median family income was $45,000.
History
Otis was founded in 1887 by a group of settlers from the nearby town of Hays. The town was named after the first postmaster, Otis B. Smith. The town quickly grew, and by the early 1900s, it had become a thriving agricultural center. The town was also home to several churches, a school, and a few businesses.
In the early 1900s, the town was hit hard by the Great Depression, and many of the businesses and farms closed. However, the town was able to recover, and by the 1950s, it had become a thriving agricultural center once again.
Today, Otis is a small, quiet town. It is home to a few small businesses, and the town is still largely dependent on agriculture. The town is also home to several churches, a school, and a few restaurants.
Common Questions
What is Per Capita Income in Otis?
Per Capita income in Otis is $21,074.
What is the Median Family Income in Otis?
Median Family Income in Otis is $63,750.
What is the Median Household income in Otis?
Median Household Income in Otis is $52,708.
What is Income or Wage Gap in Otis?
Income or Wage Gap in Otis is 5.0%.
Women in Otis earn 95.0 cents for every dollar earned by a man.
What is Family Income Deficit in Otis?
Family Income Deficit in Otis is $6,520.
Families that are below poverty line in Otis earn $6,520 less on average than the poverty threshold level.
What is Inequality or Gini Index in Otis?
Inequality or Gini Index in Otis is 0.37.
What is the Total Population of Otis?
Total Population of Otis is 375.
What is the Total Male Population of Otis?
Total Male Population of Otis is 169.
What is the Total Female Population of Otis?
Total Female Population of Otis is 206.
What is the Ratio of Males per 100 Females in Otis?
There are 82.04 Males per 100 Females in Otis.
What is the Ratio of Females per 100 Males in Otis?
There are 121.89 Females per 100 Males in Otis.
What is the Median Population Age in Otis?
Median Population Age in Otis is 32.4 Years.
What is the Average Family Size in Otis
Average Family Size in Otis is 4.9 People.
What is the Average Household Size in Otis
Average Household Size in Otis is 3.6 People.
How Large is the Labor Force in Otis?
There are 147 People in the Labor Forcein in Otis.
What is the Percentage of People in the Labor Force in Otis?
60.2% of People are in the Labor Force in Otis.
What is the Unemployment Rate in Otis?
Unemployment Rate in Otis is 6.1%.