Osborne, KS Map & Demographics
Osborne Map
Osborne Overview
$30,722
PER CAPITA INCOME
$66,250
AVG FAMILY INCOME
$46,422
AVG HOUSEHOLD INCOME
43.1%
WAGE / INCOME GAP [ % ]
56.9¢/ $1
WAGE / INCOME GAP [ $ ]
$4,986
FAMILY INCOME DEFICIT
0.42
INEQUALITY / GINI INDEX
1,512
TOTAL POPULATION
716
MALE POPULATION
796
FEMALE POPULATION
89.95
MALES / 100 FEMALES
111.17
FEMALES / 100 MALES
43.7
MEDIAN AGE
2.7
AVG FAMILY SIZE
2.1
AVG HOUSEHOLD SIZE
848
LABOR FORCE [ PEOPLE ]
66.9%
PERCENT IN LABOR FORCE
2.1%
UNEMPLOYMENT RATE
Osborne Zip Codes
Osborne Area Codes
Income in Osborne
Income Overview in Osborne
Per Capita Income in Osborne is $30,722, while median incomes of families and households are $66,250 and $46,422 respectively.
| Characteristic | Number | Measure |
| Per Capita Income | 1,512 | $30,722 |
| Median Family Income | 394 | $66,250 |
| Mean Family Income | 394 | $77,315 |
| Median Household Income | 707 | $46,422 |
| Mean Household Income | 707 | $63,195 |
| Income Deficit | 394 | $4,986 |
| Wage / Income Gap (%) | 1,512 | 43.11% |
| Wage / Income Gap ($) | 1,512 | 56.89¢ per $1 |
| Gini / Inequality Index | 1,512 | 0.42 |
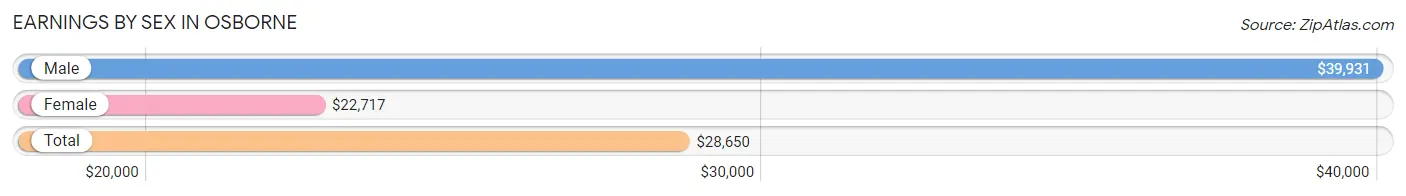
Earnings by Sex in Osborne
Average Earnings in Osborne are $28,650, $39,931 for men and $22,717 for women, a difference of 43.1%.
| Sex | Number | Average Earnings |
| Male | 417 (46.2%) | $39,931 |
| Female | 486 (53.8%) | $22,717 |
| Total | 903 (100.0%) | $28,650 |
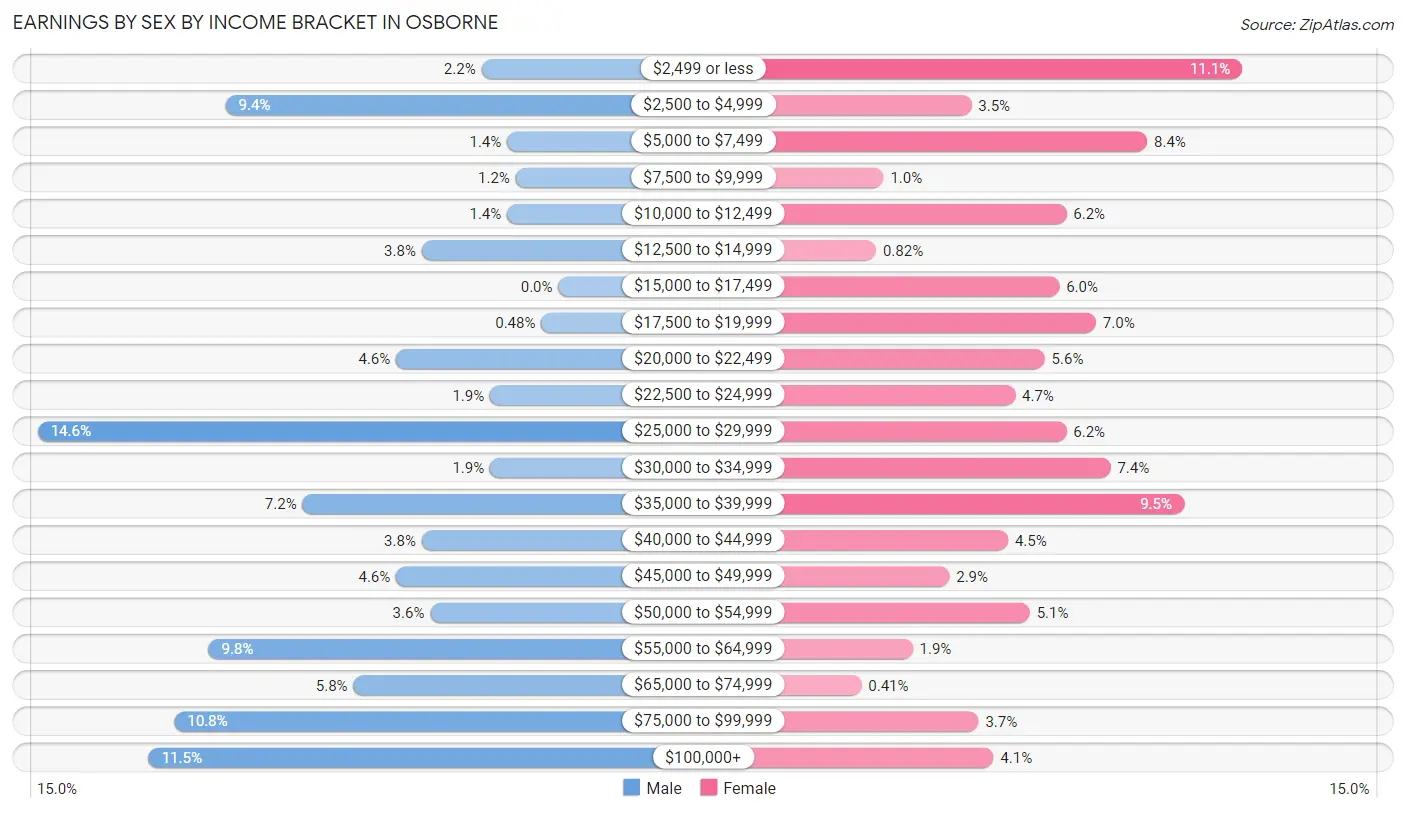
Earnings by Sex by Income Bracket in Osborne
The most common earnings brackets in Osborne are $25,000 to $29,999 for men (61 | 14.6%) and $2,499 or less for women (54 | 11.1%).
| Income | Male | Female |
| $2,499 or less | 9 (2.2%) | 54 (11.1%) |
| $2,500 to $4,999 | 39 (9.3%) | 17 (3.5%) |
| $5,000 to $7,499 | 6 (1.4%) | 41 (8.4%) |
| $7,500 to $9,999 | 5 (1.2%) | 5 (1.0%) |
| $10,000 to $12,499 | 6 (1.4%) | 30 (6.2%) |
| $12,500 to $14,999 | 16 (3.8%) | 4 (0.8%) |
| $15,000 to $17,499 | 0 (0.0%) | 29 (6.0%) |
| $17,500 to $19,999 | 2 (0.5%) | 34 (7.0%) |
| $20,000 to $22,499 | 19 (4.6%) | 27 (5.6%) |
| $22,500 to $24,999 | 8 (1.9%) | 23 (4.7%) |
| $25,000 to $29,999 | 61 (14.6%) | 30 (6.2%) |
| $30,000 to $34,999 | 8 (1.9%) | 36 (7.4%) |
| $35,000 to $39,999 | 30 (7.2%) | 46 (9.5%) |
| $40,000 to $44,999 | 16 (3.8%) | 22 (4.5%) |
| $45,000 to $49,999 | 19 (4.6%) | 14 (2.9%) |
| $50,000 to $54,999 | 15 (3.6%) | 25 (5.1%) |
| $55,000 to $64,999 | 41 (9.8%) | 9 (1.8%) |
| $65,000 to $74,999 | 24 (5.8%) | 2 (0.4%) |
| $75,000 to $99,999 | 45 (10.8%) | 18 (3.7%) |
| $100,000+ | 48 (11.5%) | 20 (4.1%) |
| Total | 417 (100.0%) | 486 (100.0%) |
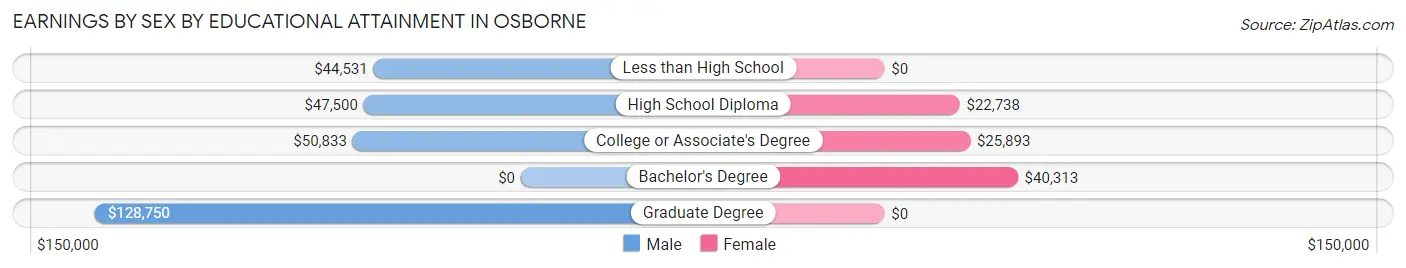
Earnings by Sex by Educational Attainment in Osborne
Average earnings in Osborne are $49,792 for men and $25,982 for women, a difference of 47.8%. Men with an educational attainment of graduate degree enjoy the highest average annual earnings of $128,750, while those with less than high school education earn the least with $44,531. Women with an educational attainment of bachelor's degree earn the most with the average annual earnings of $40,313, while those with high school diploma education have the smallest earnings of $22,738.
| Educational Attainment | Male Income | Female Income |
| Less than High School | $44,531 | $0 |
| High School Diploma | $47,500 | $22,738 |
| College or Associate's Degree | $50,833 | $25,893 |
| Bachelor's Degree | - | - |
| Graduate Degree | $128,750 | $0 |
| Total | $49,792 | $25,982 |
Family Income in Osborne
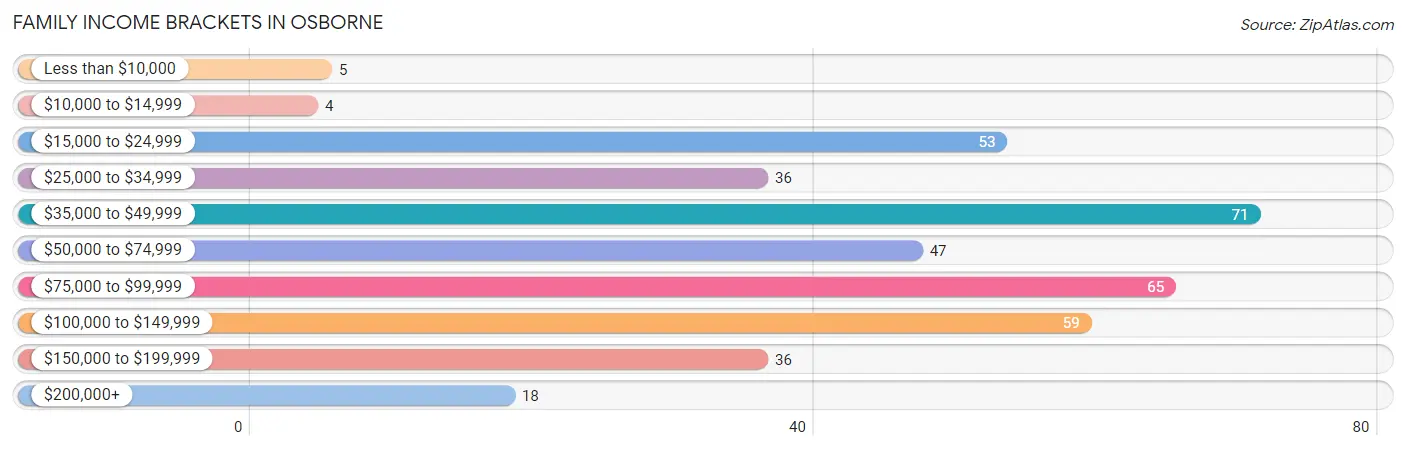
Family Income Brackets in Osborne
According to the Osborne family income data, there are 71 families falling into the $35,000 to $49,999 income range, which is the most common income bracket and makes up 18.0% of all families. Conversely, the $10,000 to $14,999 income bracket is the least frequent group with only 4 families (1.0%) belonging to this category.
| Income Bracket | # Families | % Families |
| Less than $10,000 | 5 | 1.3% |
| $10,000 to $14,999 | 4 | 1.0% |
| $15,000 to $24,999 | 53 | 13.5% |
| $25,000 to $34,999 | 36 | 9.1% |
| $35,000 to $49,999 | 71 | 18.0% |
| $50,000 to $74,999 | 47 | 11.9% |
| $75,000 to $99,999 | 65 | 16.5% |
| $100,000 to $149,999 | 59 | 15.0% |
| $150,000 to $199,999 | 36 | 9.1% |
| $200,000+ | 18 | 4.6% |
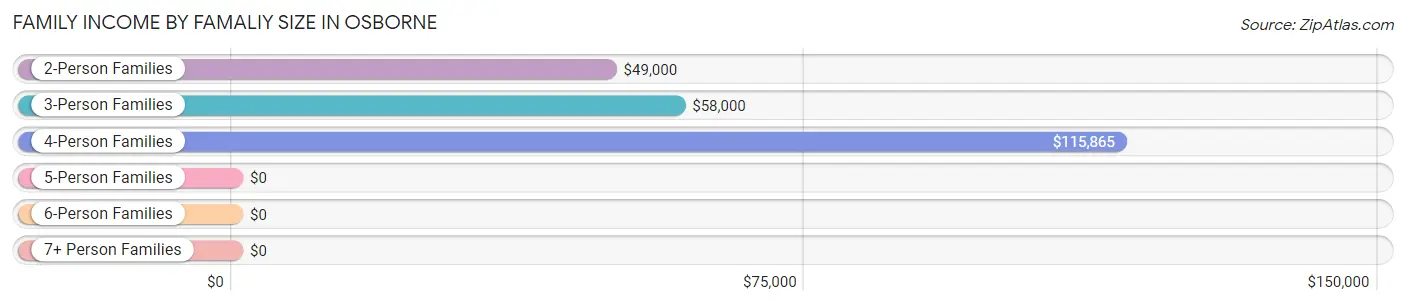
Family Income by Famaliy Size in Osborne
4-person families (63 | 16.0%) account for the highest median family income in Osborne with $115,865 per family, while 4-person families (63 | 16.0%) have the highest median income of $28,966 per family member.
| Income Bracket | # Families | Median Income |
| 2-Person Families | 212 (53.8%) | $49,000 |
| 3-Person Families | 86 (21.8%) | $58,000 |
| 4-Person Families | 63 (16.0%) | $115,865 |
| 5-Person Families | 7 (1.8%) | $0 |
| 6-Person Families | 22 (5.6%) | $0 |
| 7+ Person Families | 4 (1.0%) | $0 |
| Total | 394 (100.0%) | $66,250 |
Family Income by Number of Earners in Osborne
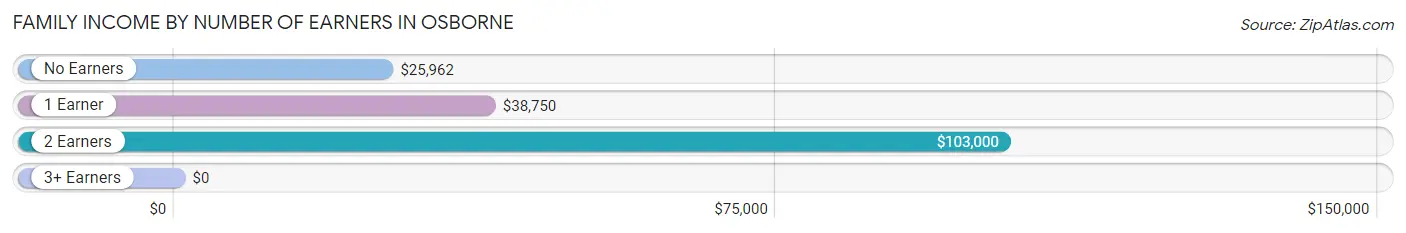
| Number of Earners | # Families | Median Income |
| No Earners | 42 (10.7%) | $25,962 |
| 1 Earner | 154 (39.1%) | $38,750 |
| 2 Earners | 140 (35.5%) | $103,000 |
| 3+ Earners | 58 (14.7%) | $0 |
| Total | 394 (100.0%) | $66,250 |
Household Income in Osborne
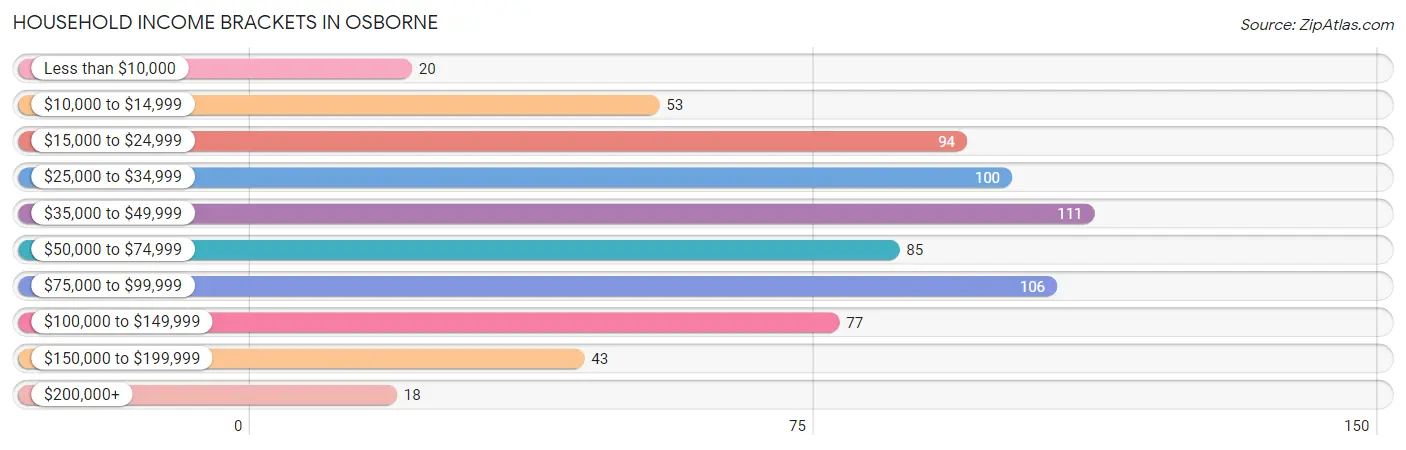
Household Income Brackets in Osborne
With 111 households falling in the category, the $35,000 to $49,999 income range is the most frequent in Osborne, accounting for 15.7% of all households. In contrast, only 18 households (2.5%) fall into the $200,000+ income bracket, making it the least populous group.
| Income Bracket | # Households | % Households |
| Less than $10,000 | 20 | 2.8% |
| $10,000 to $14,999 | 53 | 7.5% |
| $15,000 to $24,999 | 94 | 13.3% |
| $25,000 to $34,999 | 100 | 14.1% |
| $35,000 to $49,999 | 111 | 15.7% |
| $50,000 to $74,999 | 85 | 12.0% |
| $75,000 to $99,999 | 106 | 15.0% |
| $100,000 to $149,999 | 77 | 10.9% |
| $150,000 to $199,999 | 43 | 6.1% |
| $200,000+ | 18 | 2.5% |
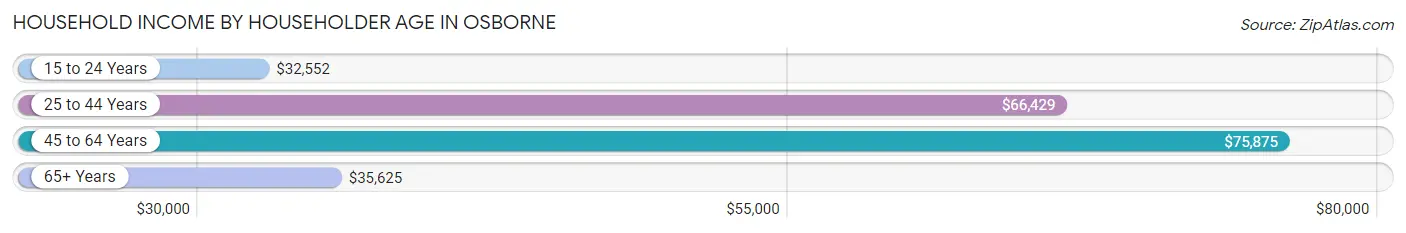
Household Income by Householder Age in Osborne
The median household income in Osborne is $46,422, with the highest median household income of $75,875 found in the 45 to 64 years age bracket for the primary householder. A total of 222 households (31.4%) fall into this category. Meanwhile, the 15 to 24 years age bracket for the primary householder has the lowest median household income of $32,552, with 63 households (8.9%) in this group.
| Income Bracket | # Households | Median Income |
| 15 to 24 Years | 63 (8.9%) | $32,552 |
| 25 to 44 Years | 188 (26.6%) | $66,429 |
| 45 to 64 Years | 222 (31.4%) | $75,875 |
| 65+ Years | 234 (33.1%) | $35,625 |
| Total | 707 (100.0%) | $46,422 |
Poverty in Osborne
Income Below Poverty by Sex and Age in Osborne
With 11.5% poverty level for males and 22.4% for females among the residents of Osborne, 15 year old males and 16 and 17 year old females are the most vulnerable to poverty, with 9 males (69.2%) and 16 females (44.4%) in their respective age groups living below the poverty level.
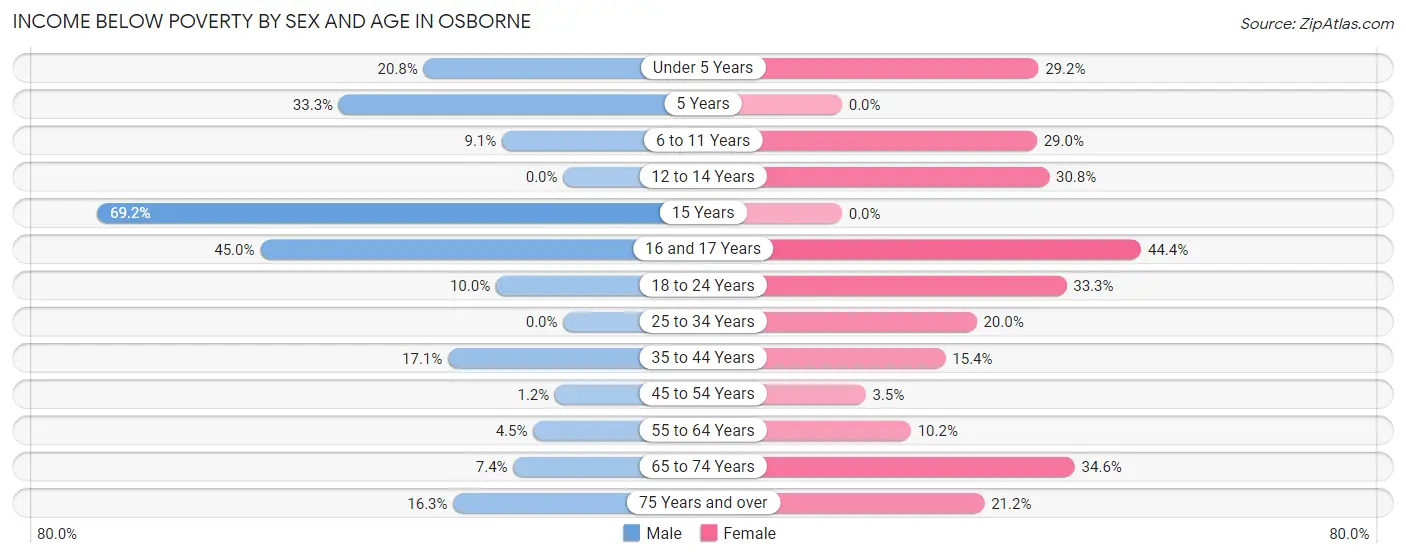
| Age Bracket | Male | Female |
| Under 5 Years | 11 (20.7%) | 7 (29.2%) |
| 5 Years | 6 (33.3%) | 0 (0.0%) |
| 6 to 11 Years | 4 (9.1%) | 11 (28.9%) |
| 12 to 14 Years | 0 (0.0%) | 12 (30.8%) |
| 15 Years | 9 (69.2%) | 0 (0.0%) |
| 16 and 17 Years | 9 (45.0%) | 16 (44.4%) |
| 18 to 24 Years | 8 (10.0%) | 28 (33.3%) |
| 25 to 34 Years | 0 (0.0%) | 12 (20.0%) |
| 35 to 44 Years | 13 (17.1%) | 14 (15.4%) |
| 45 to 54 Years | 1 (1.2%) | 2 (3.5%) |
| 55 to 64 Years | 5 (4.5%) | 13 (10.2%) |
| 65 to 74 Years | 4 (7.4%) | 37 (34.6%) |
| 75 Years and over | 8 (16.3%) | 22 (21.1%) |
| Total | 78 (11.5%) | 174 (22.4%) |
Income Above Poverty by Sex and Age in Osborne
According to the poverty statistics in Osborne, males aged 12 to 14 years and females aged 5 years are the age groups that are most secure financially, with 100.0% of males and 100.0% of females in these age groups living above the poverty line.
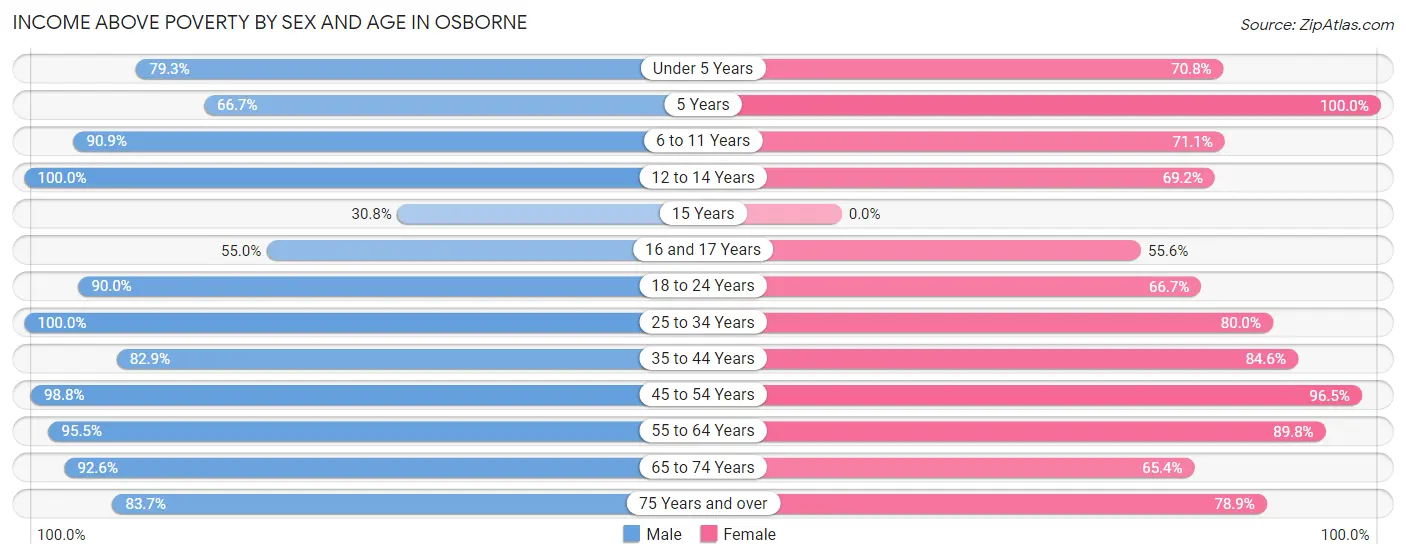
| Age Bracket | Male | Female |
| Under 5 Years | 42 (79.2%) | 17 (70.8%) |
| 5 Years | 12 (66.7%) | 11 (100.0%) |
| 6 to 11 Years | 40 (90.9%) | 27 (71.1%) |
| 12 to 14 Years | 5 (100.0%) | 27 (69.2%) |
| 15 Years | 4 (30.8%) | 0 (0.0%) |
| 16 and 17 Years | 11 (55.0%) | 20 (55.6%) |
| 18 to 24 Years | 72 (90.0%) | 56 (66.7%) |
| 25 to 34 Years | 71 (100.0%) | 48 (80.0%) |
| 35 to 44 Years | 63 (82.9%) | 77 (84.6%) |
| 45 to 54 Years | 81 (98.8%) | 55 (96.5%) |
| 55 to 64 Years | 107 (95.5%) | 114 (89.8%) |
| 65 to 74 Years | 50 (92.6%) | 70 (65.4%) |
| 75 Years and over | 41 (83.7%) | 82 (78.8%) |
| Total | 599 (88.5%) | 604 (77.6%) |
Income Below Poverty Among Married-Couple Families in Osborne
The poverty statistics for married-couple families in Osborne show that 7.8% or 20 of the total 255 families live below the poverty line. Families with 3 or 4 children have the highest poverty rate of 52.0%, comprising of 13 families. On the other hand, families with 1 or 2 children have the lowest poverty rate of 0.0%, which includes 0 families.
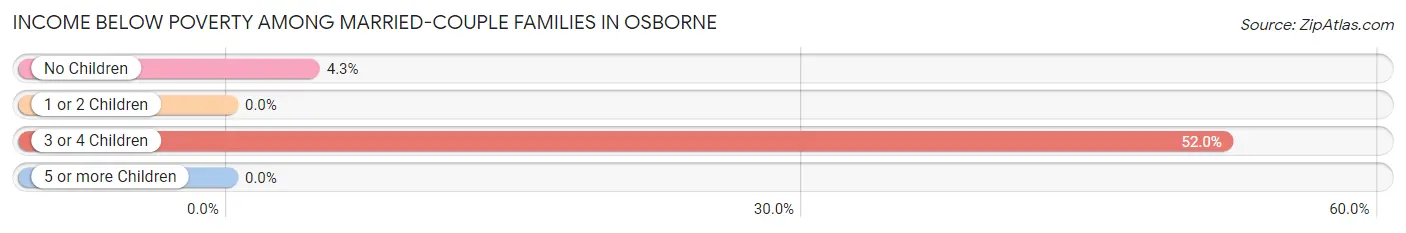
| Children | Above Poverty | Below Poverty |
| No Children | 157 (95.7%) | 7 (4.3%) |
| 1 or 2 Children | 62 (100.0%) | 0 (0.0%) |
| 3 or 4 Children | 12 (48.0%) | 13 (52.0%) |
| 5 or more Children | 4 (100.0%) | 0 (0.0%) |
| Total | 235 (92.2%) | 20 (7.8%) |
Income Below Poverty Among Single-Parent Households in Osborne
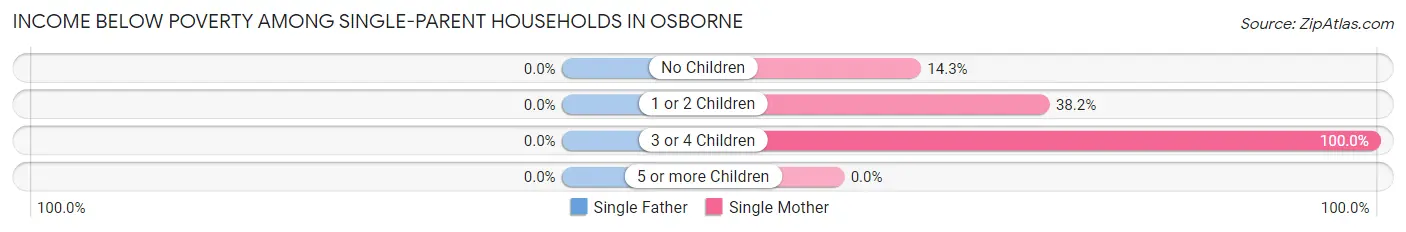
| Children | Single Father | Single Mother |
| No Children | 0 (0.0%) | 2 (14.3%) |
| 1 or 2 Children | 0 (0.0%) | 26 (38.2%) |
| 3 or 4 Children | 0 (0.0%) | 1 (100.0%) |
| 5 or more Children | 0 (0.0%) | 0 (0.0%) |
| Total | 0 (0.0%) | 29 (34.9%) |
Income Below Poverty Among Married-Couple vs Single-Parent Households in Osborne
The poverty data for Osborne shows that 20 of the married-couple family households (7.8%) and 29 of the single-parent households (20.9%) are living below the poverty level. Within the married-couple family households, those with 3 or 4 children have the highest poverty rate, with 13 households (52.0%) falling below the poverty line. Among the single-parent households, those with 3 or 4 children have the highest poverty rate, with 1 household (100.0%) living below poverty.
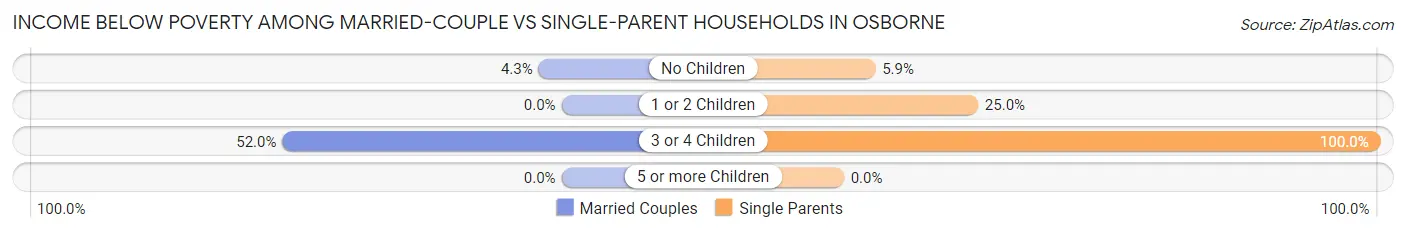
| Children | Married-Couple Families | Single-Parent Households |
| No Children | 7 (4.3%) | 2 (5.9%) |
| 1 or 2 Children | 0 (0.0%) | 26 (25.0%) |
| 3 or 4 Children | 13 (52.0%) | 1 (100.0%) |
| 5 or more Children | 0 (0.0%) | 0 (0.0%) |
| Total | 20 (7.8%) | 29 (20.9%) |
Race in Osborne
The most populous races in Osborne are White / Caucasian (1,385 | 91.6%), Two or more Races (82 | 5.4%), and Hispanic or Latino (63 | 4.2%).
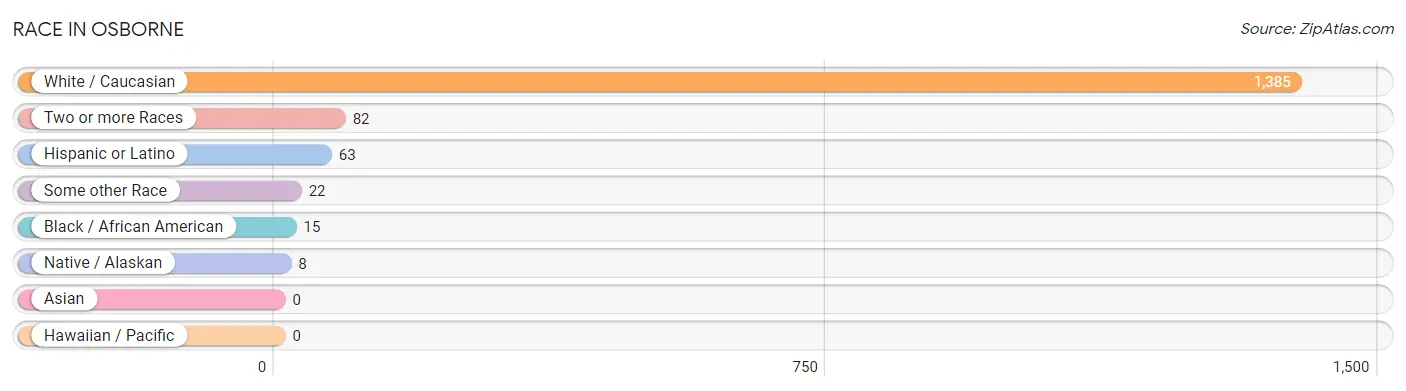
| Race | # Population | % Population |
| Asian | 0 | 0.0% |
| Black / African American | 15 | 1.0% |
| Hawaiian / Pacific | 0 | 0.0% |
| Hispanic or Latino | 63 | 4.2% |
| Native / Alaskan | 8 | 0.5% |
| White / Caucasian | 1,385 | 91.6% |
| Two or more Races | 82 | 5.4% |
| Some other Race | 22 | 1.5% |
| Total | 1,512 | 100.0% |
Ancestry in Osborne
The most populous ancestries reported in Osborne are German (456 | 30.2%), American (268 | 17.7%), English (157 | 10.4%), Irish (112 | 7.4%), and French (59 | 3.9%), together accounting for 69.6% of all Osborne residents.
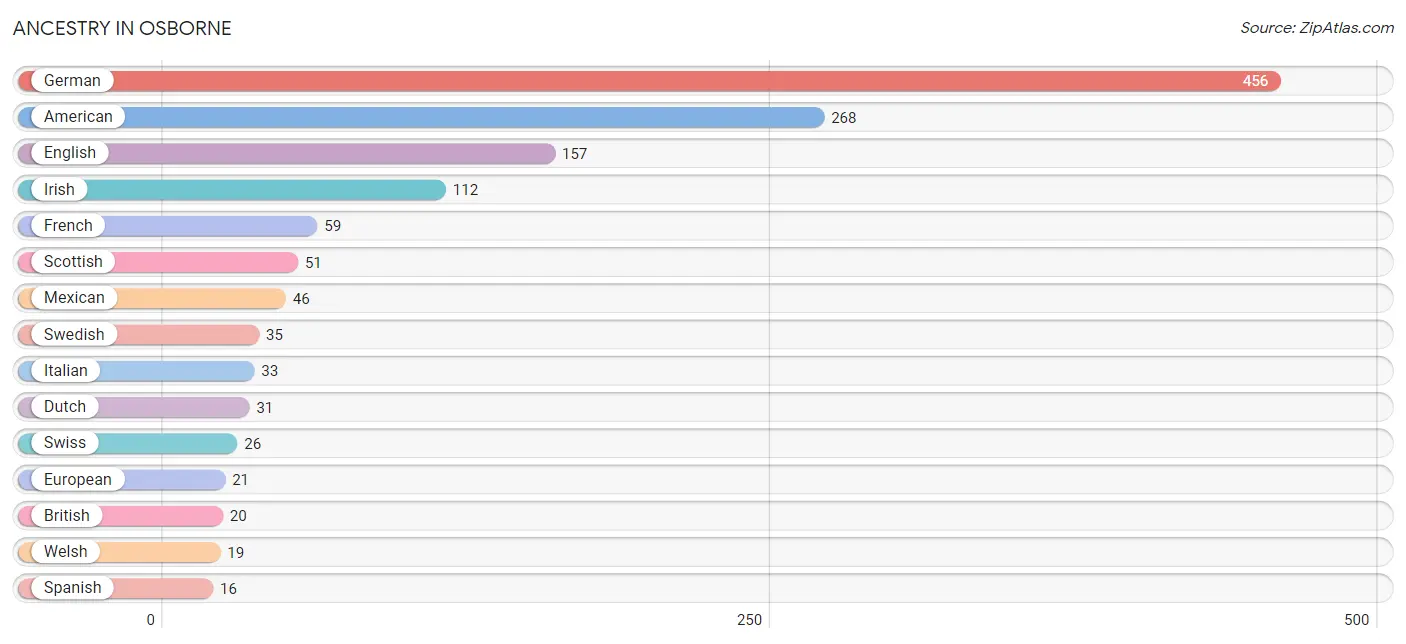
| Ancestry | # Population | % Population |
| American | 268 | 17.7% |
| Bhutanese | 7 | 0.5% |
| British | 20 | 1.3% |
| Burmese | 8 | 0.5% |
| Central American | 1 | 0.1% |
| Cherokee | 14 | 0.9% |
| Choctaw | 8 | 0.5% |
| Comanche | 7 | 0.5% |
| Danish | 4 | 0.3% |
| Dutch | 31 | 2.1% |
| English | 157 | 10.4% |
| European | 21 | 1.4% |
| French | 59 | 3.9% |
| French Canadian | 3 | 0.2% |
| German | 456 | 30.2% |
| Honduran | 1 | 0.1% |
| Irish | 112 | 7.4% |
| Italian | 33 | 2.2% |
| Mexican | 46 | 3.0% |
| Northern European | 2 | 0.1% |
| Norwegian | 2 | 0.1% |
| Russian | 9 | 0.6% |
| Scotch-Irish | 8 | 0.5% |
| Scottish | 51 | 3.4% |
| Spanish | 16 | 1.1% |
| Swedish | 35 | 2.3% |
| Swiss | 26 | 1.7% |
| Welsh | 19 | 1.3% | View All 28 Rows |
Immigrants in Osborne
The most numerous immigrant groups reported in Osborne came from Central America (21 | 1.4%), Latin America (21 | 1.4%), Mexico (20 | 1.3%), Asia (9 | 0.6%), and Eastern Asia (9 | 0.6%), together accounting for 5.3% of all Osborne residents.
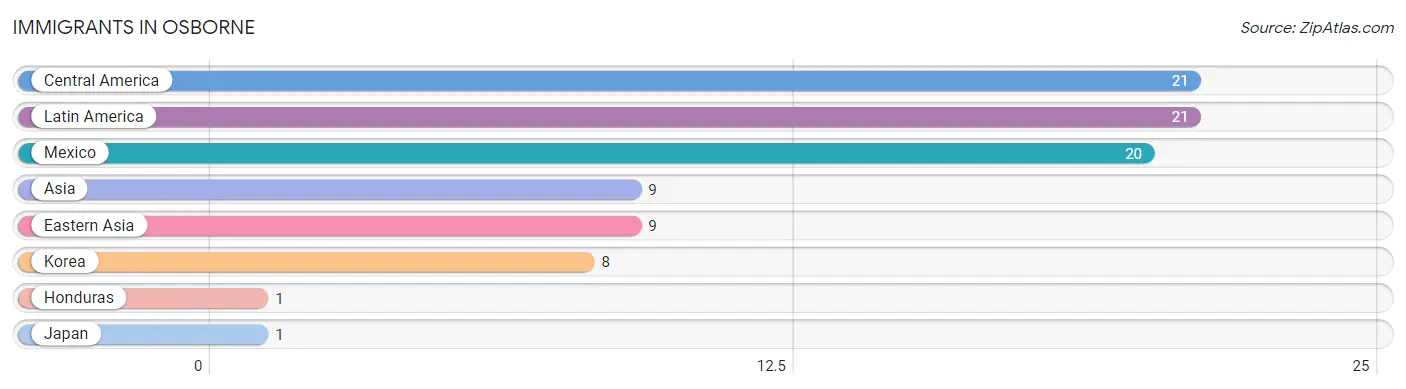
| Immigration Origin | # Population | % Population |
| Asia | 9 | 0.6% |
| Central America | 21 | 1.4% |
| Eastern Asia | 9 | 0.6% |
| Honduras | 1 | 0.1% |
| Japan | 1 | 0.1% |
| Korea | 8 | 0.5% |
| Latin America | 21 | 1.4% |
| Mexico | 20 | 1.3% | View All 8 Rows |
Sex and Age in Osborne
Sex and Age in Osborne
The most populous age groups in Osborne are 15 to 19 Years (74 | 10.3%) for men and 55 to 59 Years (108 | 13.6%) for women.
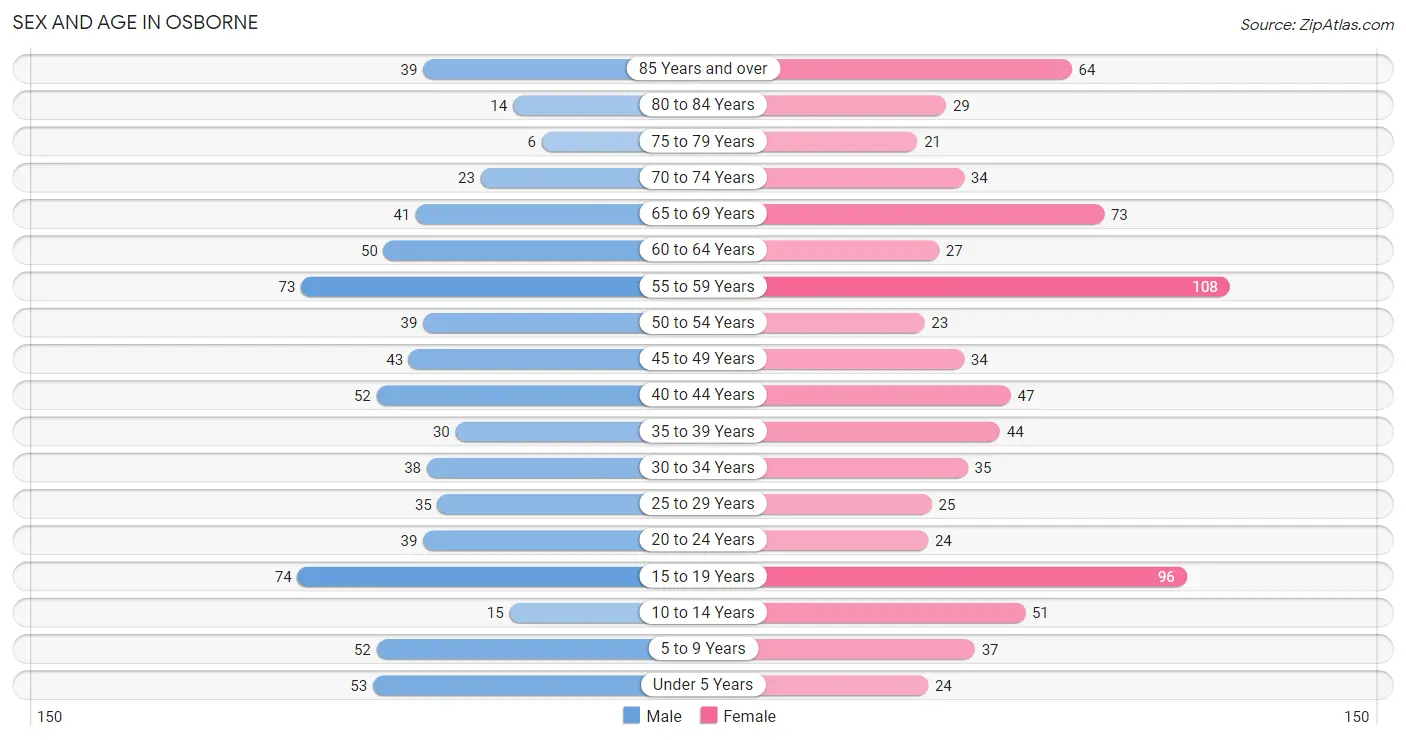
| Age Bracket | Male | Female |
| Under 5 Years | 53 (7.4%) | 24 (3.0%) |
| 5 to 9 Years | 52 (7.3%) | 37 (4.6%) |
| 10 to 14 Years | 15 (2.1%) | 51 (6.4%) |
| 15 to 19 Years | 74 (10.3%) | 96 (12.1%) |
| 20 to 24 Years | 39 (5.4%) | 24 (3.0%) |
| 25 to 29 Years | 35 (4.9%) | 25 (3.1%) |
| 30 to 34 Years | 38 (5.3%) | 35 (4.4%) |
| 35 to 39 Years | 30 (4.2%) | 44 (5.5%) |
| 40 to 44 Years | 52 (7.3%) | 47 (5.9%) |
| 45 to 49 Years | 43 (6.0%) | 34 (4.3%) |
| 50 to 54 Years | 39 (5.4%) | 23 (2.9%) |
| 55 to 59 Years | 73 (10.2%) | 108 (13.6%) |
| 60 to 64 Years | 50 (7.0%) | 27 (3.4%) |
| 65 to 69 Years | 41 (5.7%) | 73 (9.2%) |
| 70 to 74 Years | 23 (3.2%) | 34 (4.3%) |
| 75 to 79 Years | 6 (0.8%) | 21 (2.6%) |
| 80 to 84 Years | 14 (2.0%) | 29 (3.6%) |
| 85 Years and over | 39 (5.4%) | 64 (8.0%) |
| Total | 716 (100.0%) | 796 (100.0%) |
Families and Households in Osborne
Median Family Size in Osborne
The median family size in Osborne is 2.69 persons per family, with married-couple families (255 | 64.7%) accounting for the largest median family size of 3 persons per family. On the other hand, single male/father families (56 | 14.2%) represent the smallest median family size with 1.79 persons per family.
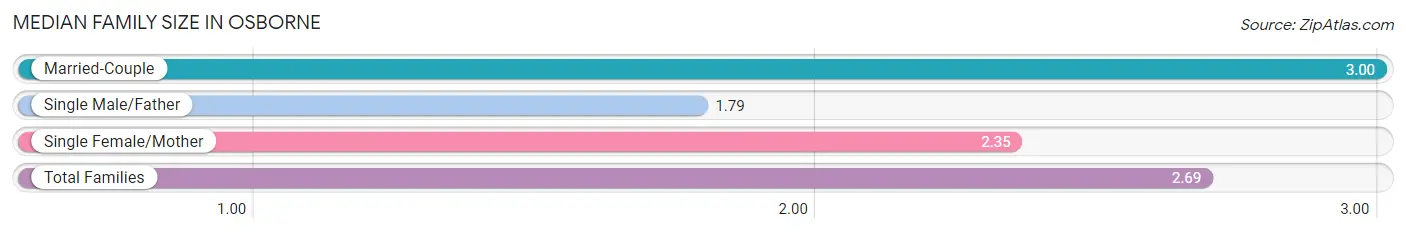
| Family Type | # Families | Family Size |
| Married-Couple | 255 (64.7%) | 3.00 |
| Single Male/Father | 56 (14.2%) | 1.79 |
| Single Female/Mother | 83 (21.1%) | 2.35 |
| Total Families | 394 (100.0%) | 2.69 |
Median Household Size in Osborne
The median household size in Osborne is 2.06 persons per household, with married-couple households (255 | 36.1%) accounting for the largest median household size of 3 persons per household. non-family households (313 | 44.3%) represent the smallest median household size with 1.17 persons per household.
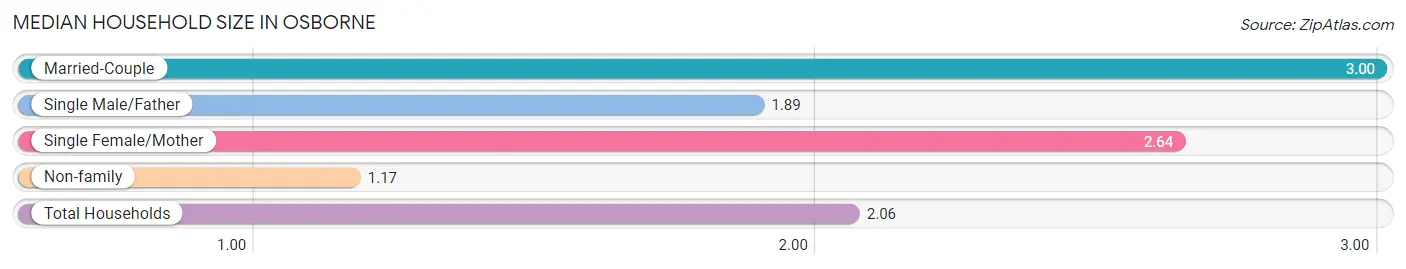
| Household Type | # Households | Household Size |
| Married-Couple | 255 (36.1%) | 3.00 |
| Single Male/Father | 56 (7.9%) | 1.89 |
| Single Female/Mother | 83 (11.7%) | 2.64 |
| Non-family | 313 (44.3%) | 1.17 |
| Total Households | 707 (100.0%) | 2.06 |
Household Size by Marriage Status in Osborne
Out of a total of 707 households in Osborne, 394 (55.7%) are family households, while 313 (44.3%) are nonfamily households. The most numerous type of family households are 2-person households, comprising 204, and the most common type of nonfamily households are 1-person households, comprising 273.
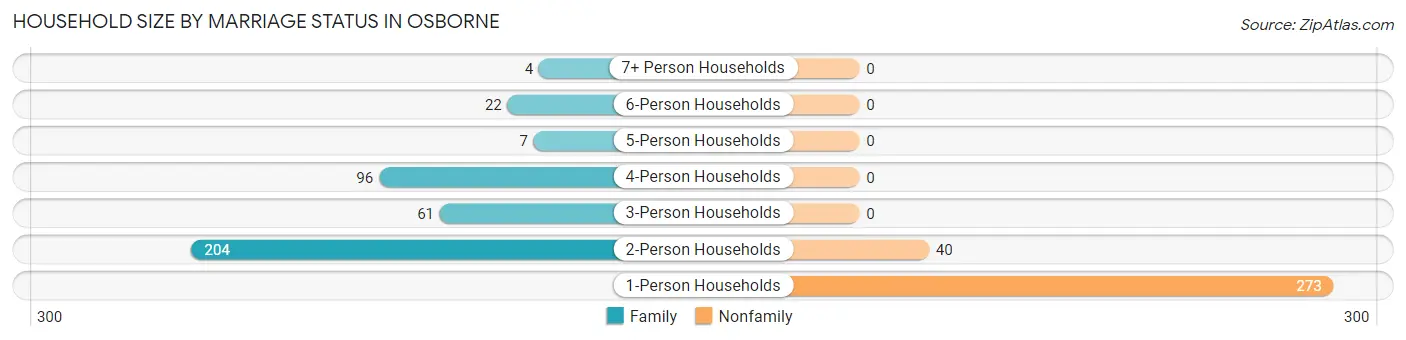
| Household Size | Family Households | Nonfamily Households |
| 1-Person Households | - | 273 (38.6%) |
| 2-Person Households | 204 (28.8%) | 40 (5.7%) |
| 3-Person Households | 61 (8.6%) | 0 (0.0%) |
| 4-Person Households | 96 (13.6%) | 0 (0.0%) |
| 5-Person Households | 7 (1.0%) | 0 (0.0%) |
| 6-Person Households | 22 (3.1%) | 0 (0.0%) |
| 7+ Person Households | 4 (0.6%) | 0 (0.0%) |
| Total | 394 (55.7%) | 313 (44.3%) |
Female Fertility in Osborne
Fertility by Age in Osborne
Average fertility rate in Osborne is 20.0 births per 1,000 women. Women in the age bracket of 35 to 50 years have the highest fertility rate with 31.0 births per 1,000 women. Women in the age bracket of 35 to 50 years acount for 66.7% of all women with births.
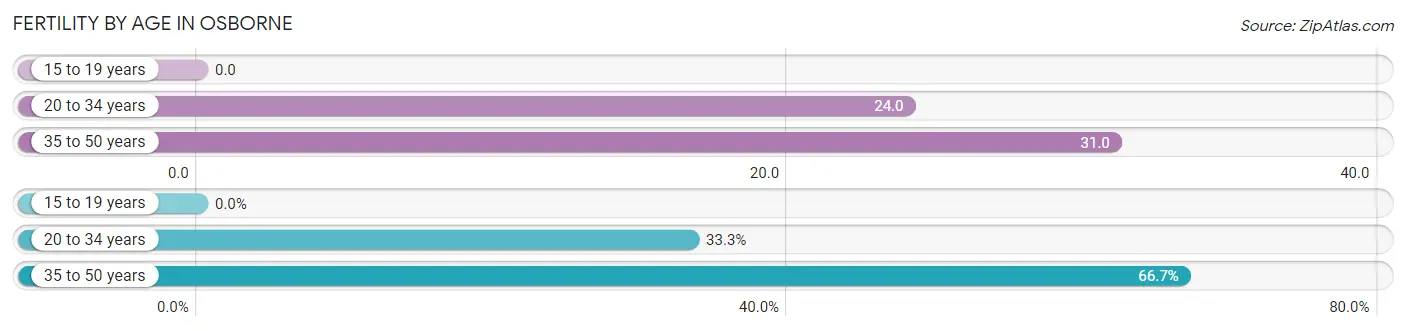
| Age Bracket | Women with Births | Births / 1,000 Women |
| 15 to 19 years | 0 (0.0%) | 0.0 |
| 20 to 34 years | 2 (33.3%) | 24.0 |
| 35 to 50 years | 4 (66.7%) | 31.0 |
| Total | 6 (100.0%) | 20.0 |
Fertility by Age by Marriage Status in Osborne
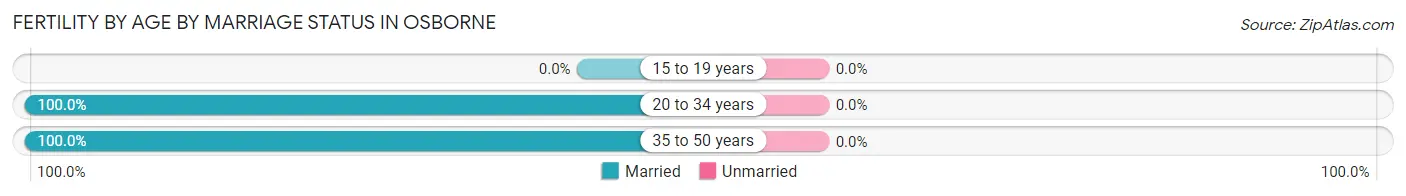
| Age Bracket | Married | Unmarried |
| 15 to 19 years | 0 (0.0%) | 0 (0.0%) |
| 20 to 34 years | 2 (100.0%) | 0 (0.0%) |
| 35 to 50 years | 4 (100.0%) | 0 (0.0%) |
| Total | 6 (100.0%) | 0 (0.0%) |
Fertility by Education in Osborne
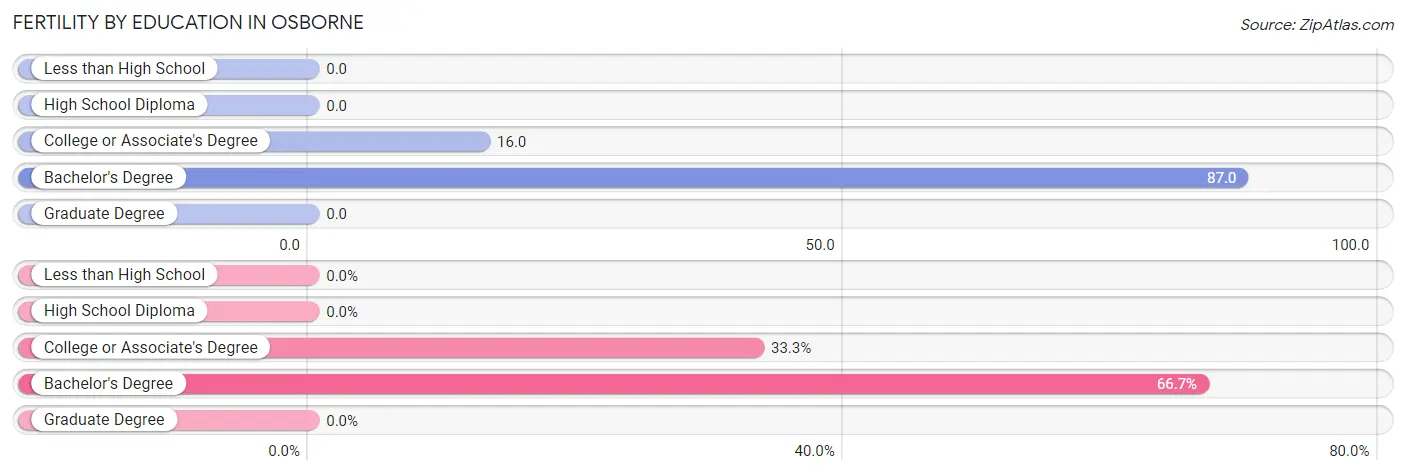
| Educational Attainment | Women with Births | Births / 1,000 Women |
| Less than High School | 0 (0.0%) | 0.0 |
| High School Diploma | 0 (0.0%) | 0.0 |
| College or Associate's Degree | 2 (33.3%) | 16.0 |
| Bachelor's Degree | 4 (66.7%) | 87.0 |
| Graduate Degree | 0 (0.0%) | 0.0 |
| Total | 6 (100.0%) | 20.0 |
Fertility by Education by Marriage Status in Osborne
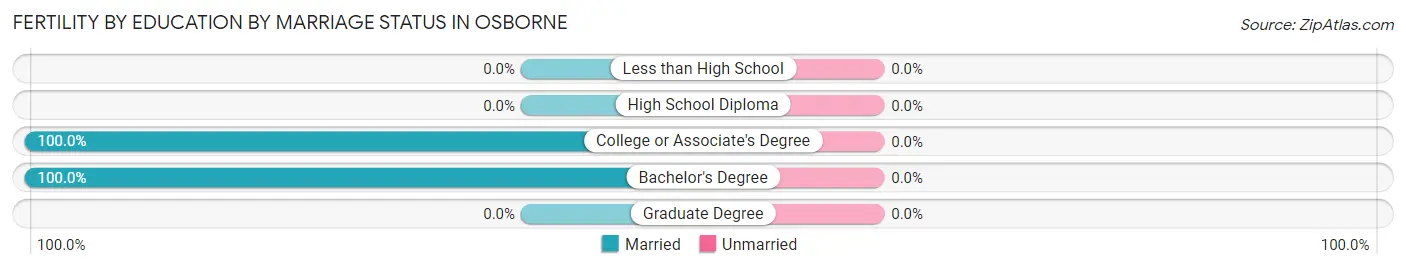
| Educational Attainment | Married | Unmarried |
| Less than High School | 0 (0.0%) | 0 (0.0%) |
| High School Diploma | 0 (0.0%) | 0 (0.0%) |
| College or Associate's Degree | 2 (100.0%) | 0 (0.0%) |
| Bachelor's Degree | 4 (100.0%) | 0 (0.0%) |
| Graduate Degree | 0 (0.0%) | 0 (0.0%) |
| Total | 6 (100.0%) | 0 (0.0%) |
Employment Characteristics in Osborne
Employment by Class of Employer in Osborne
Among the 830 employed individuals in Osborne, private company employees (515 | 62.1%), local government employees (149 | 17.9%), and self-employed (not incorporated) (61 | 7.3%) make up the most common classes of employment.
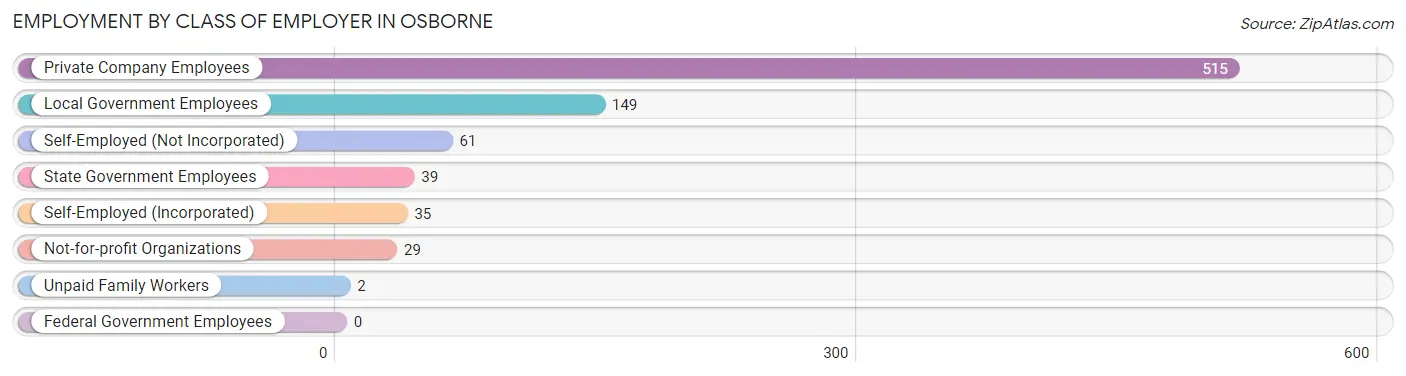
| Employer Class | # Employees | % Employees |
| Private Company Employees | 515 | 62.1% |
| Self-Employed (Incorporated) | 35 | 4.2% |
| Self-Employed (Not Incorporated) | 61 | 7.3% |
| Not-for-profit Organizations | 29 | 3.5% |
| Local Government Employees | 149 | 17.9% |
| State Government Employees | 39 | 4.7% |
| Federal Government Employees | 0 | 0.0% |
| Unpaid Family Workers | 2 | 0.2% |
| Total | 830 | 100.0% |
Employment Status by Age in Osborne
According to the labor force statistics for Osborne, out of the total population over 16 years of age (1,267), 66.9% or 848 individuals are in the labor force, with 2.1% or 18 of them unemployed. The age group with the highest labor force participation rate is 30 to 34 years, with 95.9% or 70 individuals in the labor force. Within the labor force, the 20 to 24 years age range has the highest percentage of unemployed individuals, with 6.1% or 3 of them being unemployed.
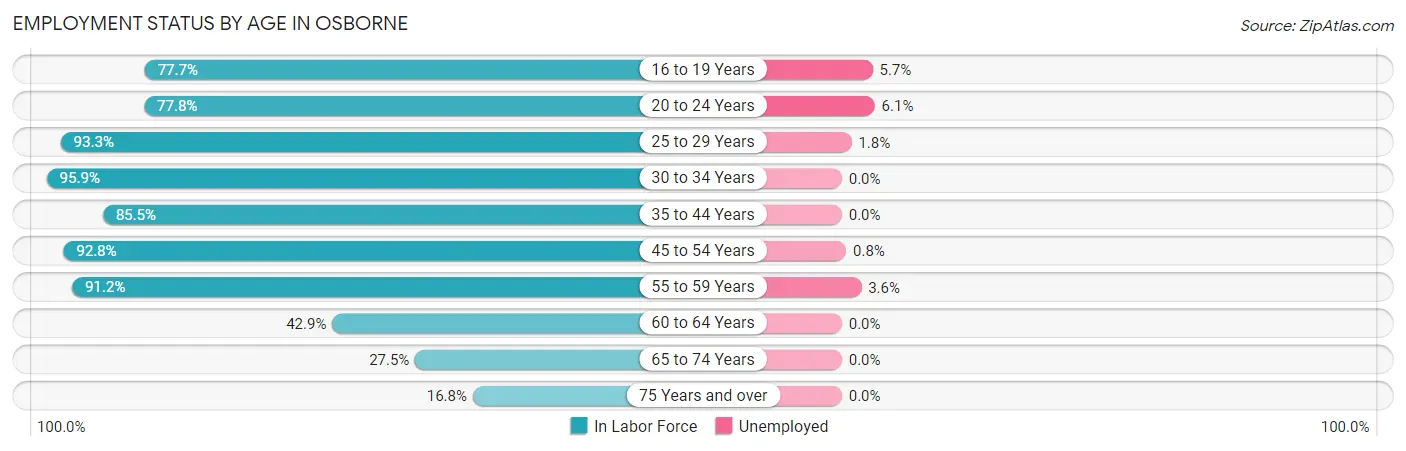
| Age Bracket | In Labor Force | Unemployed |
| 16 to 19 Years | 122 (77.7%) | 7 (5.7%) |
| 20 to 24 Years | 49 (77.8%) | 3 (6.1%) |
| 25 to 29 Years | 56 (93.3%) | 1 (1.8%) |
| 30 to 34 Years | 70 (95.9%) | 0 (0.0%) |
| 35 to 44 Years | 148 (85.5%) | 0 (0.0%) |
| 45 to 54 Years | 129 (92.8%) | 1 (0.8%) |
| 55 to 59 Years | 165 (91.2%) | 6 (3.6%) |
| 60 to 64 Years | 33 (42.9%) | 0 (0.0%) |
| 65 to 74 Years | 47 (27.5%) | 0 (0.0%) |
| 75 Years and over | 29 (16.8%) | 0 (0.0%) |
| Total | 848 (66.9%) | 18 (2.1%) |
Employment Status by Educational Attainment in Osborne
According to labor force statistics for Osborne, 85.5% of individuals (601) out of the total population between 25 and 64 years of age (703) are in the labor force, with 1.3% or 8 of them being unemployed. The group with the highest labor force participation rate are those with the educational attainment of bachelor's degree or higher, with 93.9% or 124 individuals in the labor force. Within the labor force, individuals with less than high school education have the highest percentage of unemployment, with 13.0% or 3 of them being unemployed.
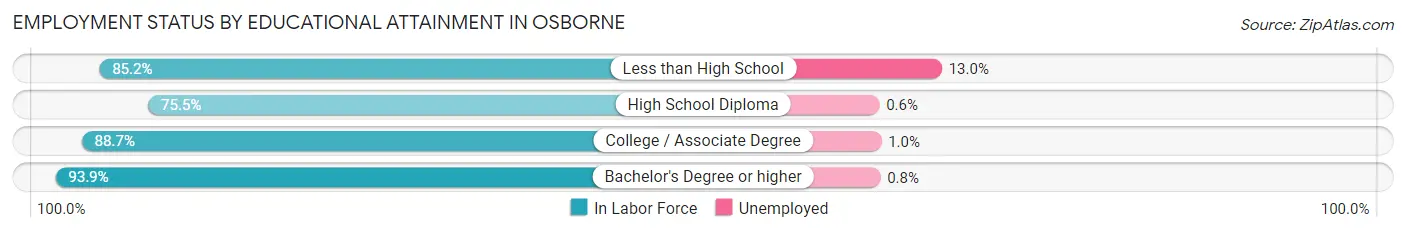
| Educational Attainment | In Labor Force | Unemployed |
| Less than High School | 23 (85.2%) | 4 (13.0%) |
| High School Diploma | 163 (75.5%) | 1 (0.6%) |
| College / Associate Degree | 291 (88.7%) | 3 (1.0%) |
| Bachelor's Degree or higher | 124 (93.9%) | 1 (0.8%) |
| Total | 601 (85.5%) | 9 (1.3%) |
Employment Occupations by Sex in Osborne
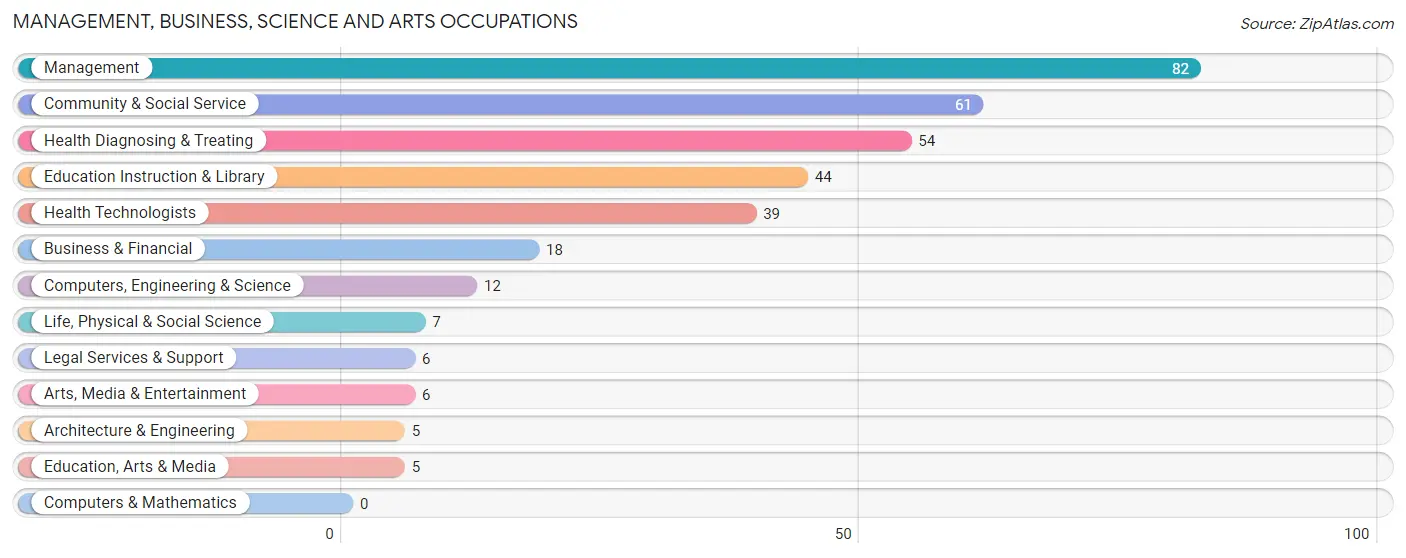
Management, Business, Science and Arts Occupations
The most common Management, Business, Science and Arts occupations in Osborne are Management (82 | 9.9%), Community & Social Service (61 | 7.3%), Health Diagnosing & Treating (54 | 6.5%), Education Instruction & Library (44 | 5.3%), and Health Technologists (39 | 4.7%).
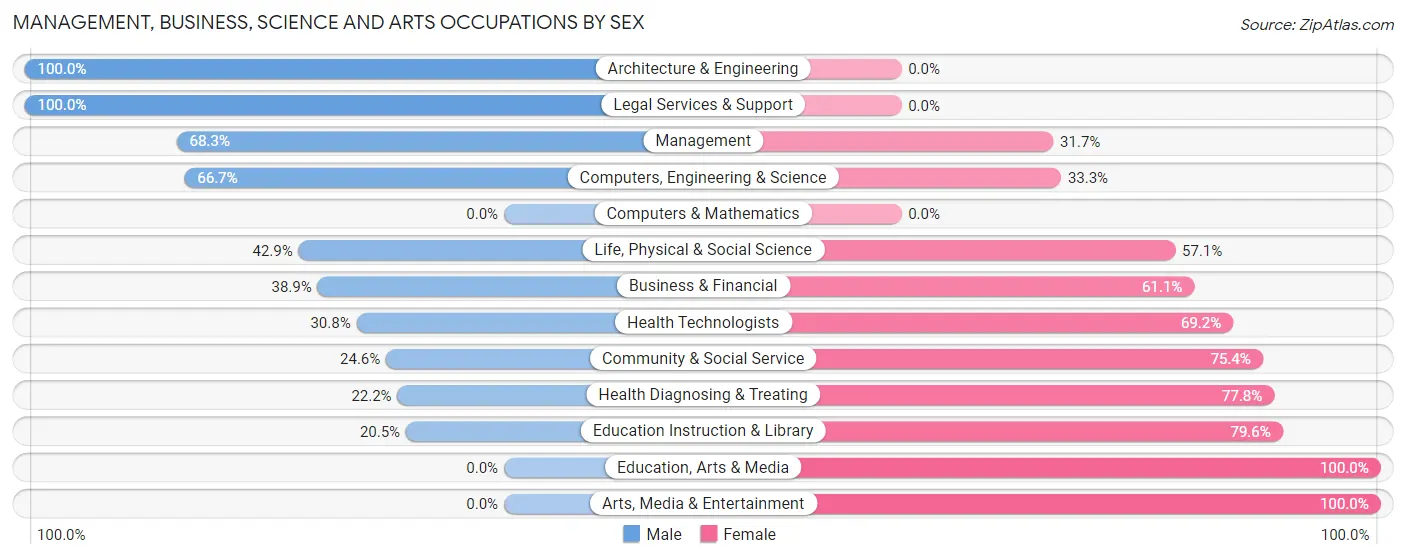
Management, Business, Science and Arts Occupations by Sex
Within the Management, Business, Science and Arts occupations in Osborne, the most male-oriented occupations are Architecture & Engineering (100.0%), Legal Services & Support (100.0%), and Management (68.3%), while the most female-oriented occupations are Education, Arts & Media (100.0%), Arts, Media & Entertainment (100.0%), and Education Instruction & Library (79.5%).
| Occupation | Male | Female |
| Management | 56 (68.3%) | 26 (31.7%) |
| Business & Financial | 7 (38.9%) | 11 (61.1%) |
| Computers, Engineering & Science | 8 (66.7%) | 4 (33.3%) |
| Computers & Mathematics | 0 (0.0%) | 0 (0.0%) |
| Architecture & Engineering | 5 (100.0%) | 0 (0.0%) |
| Life, Physical & Social Science | 3 (42.9%) | 4 (57.1%) |
| Community & Social Service | 15 (24.6%) | 46 (75.4%) |
| Education, Arts & Media | 0 (0.0%) | 5 (100.0%) |
| Legal Services & Support | 6 (100.0%) | 0 (0.0%) |
| Education Instruction & Library | 9 (20.4%) | 35 (79.5%) |
| Arts, Media & Entertainment | 0 (0.0%) | 6 (100.0%) |
| Health Diagnosing & Treating | 12 (22.2%) | 42 (77.8%) |
| Health Technologists | 12 (30.8%) | 27 (69.2%) |
| Total (Category) | 98 (43.2%) | 129 (56.8%) |
| Total (Overall) | 393 (47.3%) | 437 (52.6%) |
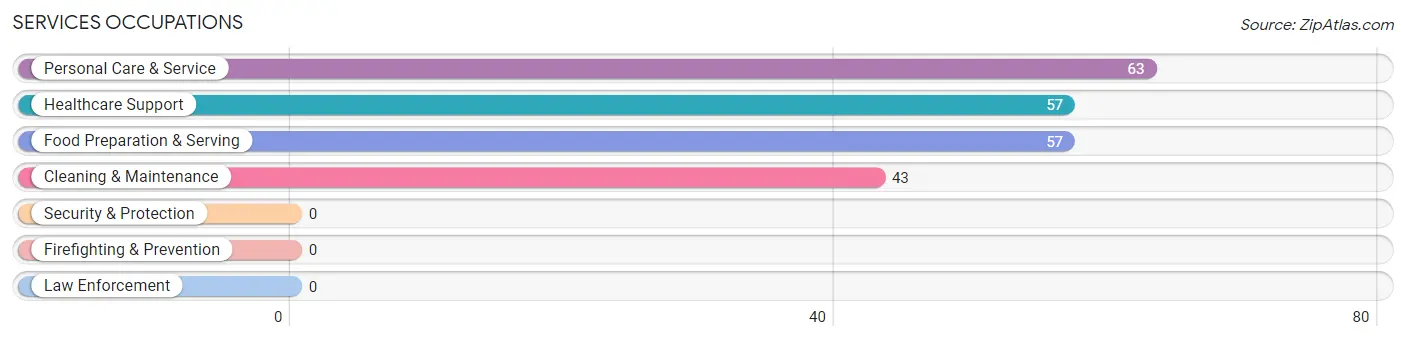
Services Occupations
The most common Services occupations in Osborne are Personal Care & Service (63 | 7.6%), Healthcare Support (57 | 6.9%), Food Preparation & Serving (57 | 6.9%), and Cleaning & Maintenance (43 | 5.2%).
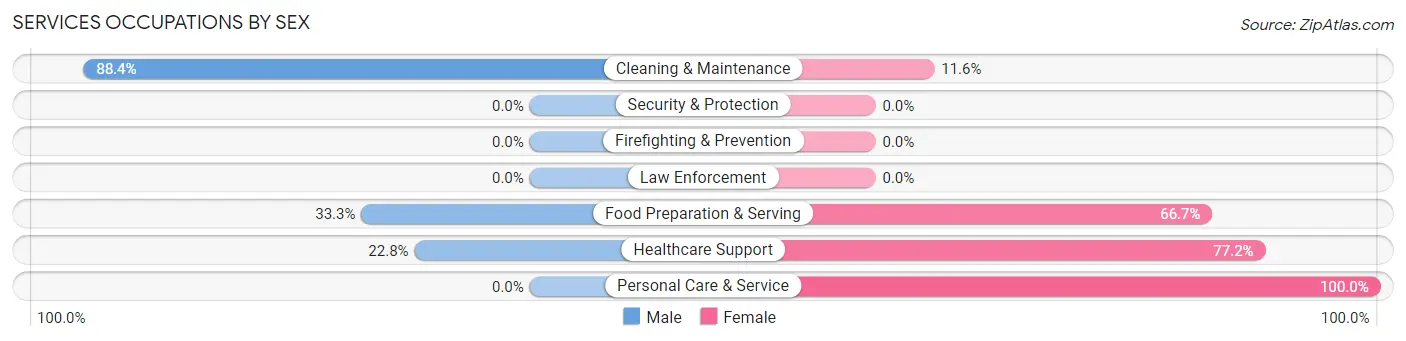
Services Occupations by Sex
Within the Services occupations in Osborne, the most male-oriented occupations are Cleaning & Maintenance (88.4%), Food Preparation & Serving (33.3%), and Healthcare Support (22.8%), while the most female-oriented occupations are Personal Care & Service (100.0%), Healthcare Support (77.2%), and Food Preparation & Serving (66.7%).
| Occupation | Male | Female |
| Healthcare Support | 13 (22.8%) | 44 (77.2%) |
| Security & Protection | 0 (0.0%) | 0 (0.0%) |
| Firefighting & Prevention | 0 (0.0%) | 0 (0.0%) |
| Law Enforcement | 0 (0.0%) | 0 (0.0%) |
| Food Preparation & Serving | 19 (33.3%) | 38 (66.7%) |
| Cleaning & Maintenance | 38 (88.4%) | 5 (11.6%) |
| Personal Care & Service | 0 (0.0%) | 63 (100.0%) |
| Total (Category) | 70 (31.8%) | 150 (68.2%) |
| Total (Overall) | 393 (47.3%) | 437 (52.6%) |
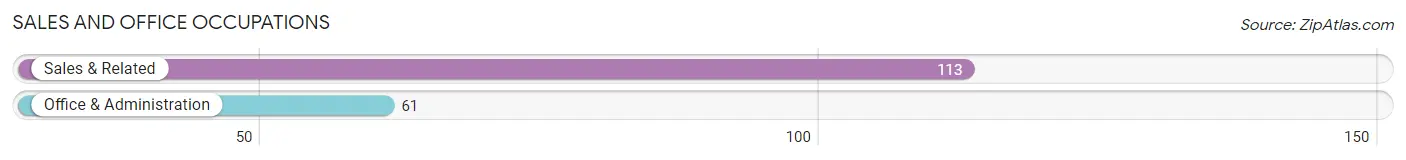
Sales and Office Occupations
The most common Sales and Office occupations in Osborne are Sales & Related (113 | 13.6%), and Office & Administration (61 | 7.3%).
Sales and Office Occupations by Sex
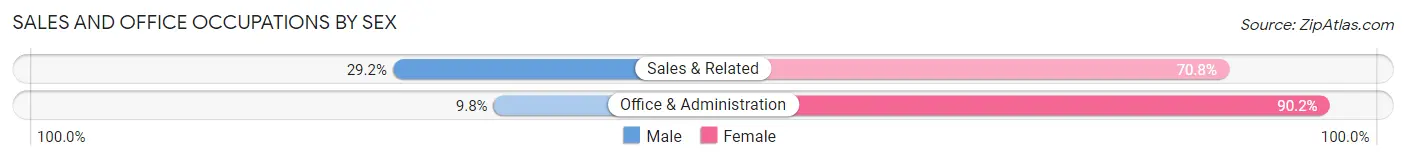
| Occupation | Male | Female |
| Sales & Related | 33 (29.2%) | 80 (70.8%) |
| Office & Administration | 6 (9.8%) | 55 (90.2%) |
| Total (Category) | 39 (22.4%) | 135 (77.6%) |
| Total (Overall) | 393 (47.3%) | 437 (52.6%) |
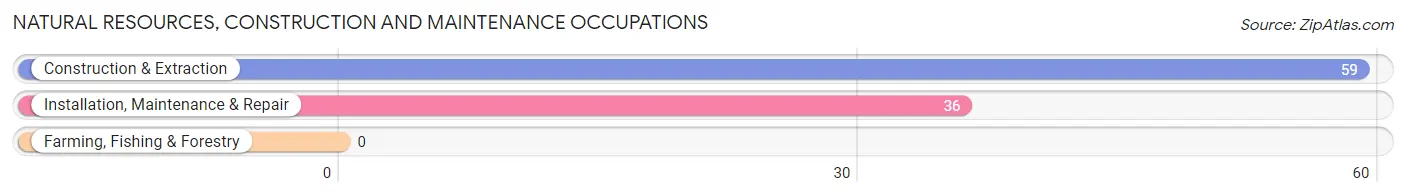
Natural Resources, Construction and Maintenance Occupations
The most common Natural Resources, Construction and Maintenance occupations in Osborne are Construction & Extraction (59 | 7.1%), and Installation, Maintenance & Repair (36 | 4.3%).
Natural Resources, Construction and Maintenance Occupations by Sex
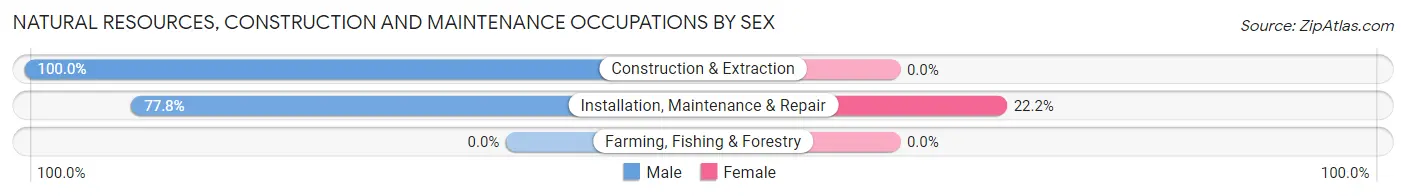
| Occupation | Male | Female |
| Farming, Fishing & Forestry | 0 (0.0%) | 0 (0.0%) |
| Construction & Extraction | 59 (100.0%) | 0 (0.0%) |
| Installation, Maintenance & Repair | 28 (77.8%) | 8 (22.2%) |
| Total (Category) | 87 (91.6%) | 8 (8.4%) |
| Total (Overall) | 393 (47.3%) | 437 (52.6%) |
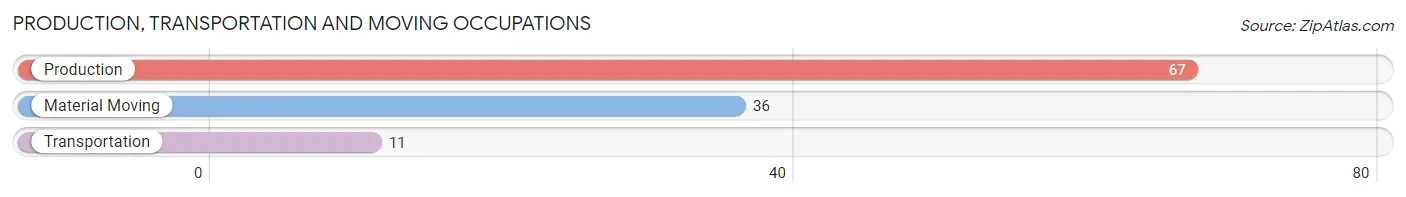
Production, Transportation and Moving Occupations
The most common Production, Transportation and Moving occupations in Osborne are Production (67 | 8.1%), Material Moving (36 | 4.3%), and Transportation (11 | 1.3%).
Production, Transportation and Moving Occupations by Sex
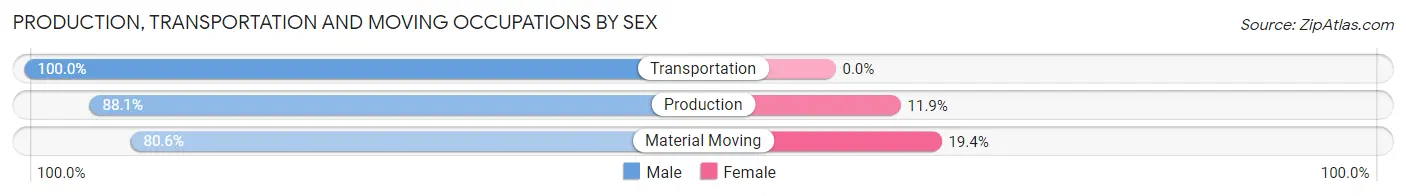
| Occupation | Male | Female |
| Production | 59 (88.1%) | 8 (11.9%) |
| Transportation | 11 (100.0%) | 0 (0.0%) |
| Material Moving | 29 (80.6%) | 7 (19.4%) |
| Total (Category) | 99 (86.8%) | 15 (13.2%) |
| Total (Overall) | 393 (47.3%) | 437 (52.6%) |
Employment Industries by Sex in Osborne
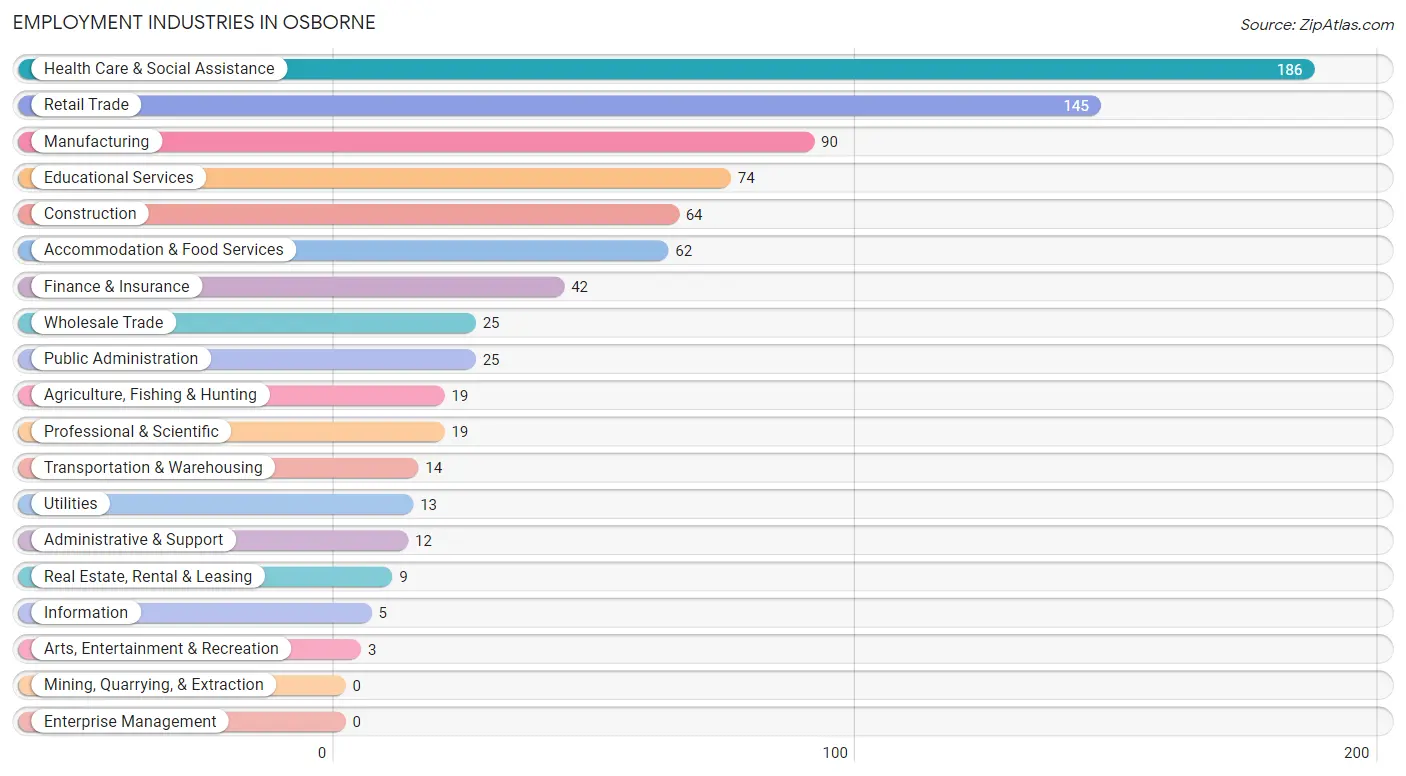
Employment Industries in Osborne
The major employment industries in Osborne include Health Care & Social Assistance (186 | 22.4%), Retail Trade (145 | 17.5%), Manufacturing (90 | 10.8%), Educational Services (74 | 8.9%), and Construction (64 | 7.7%).
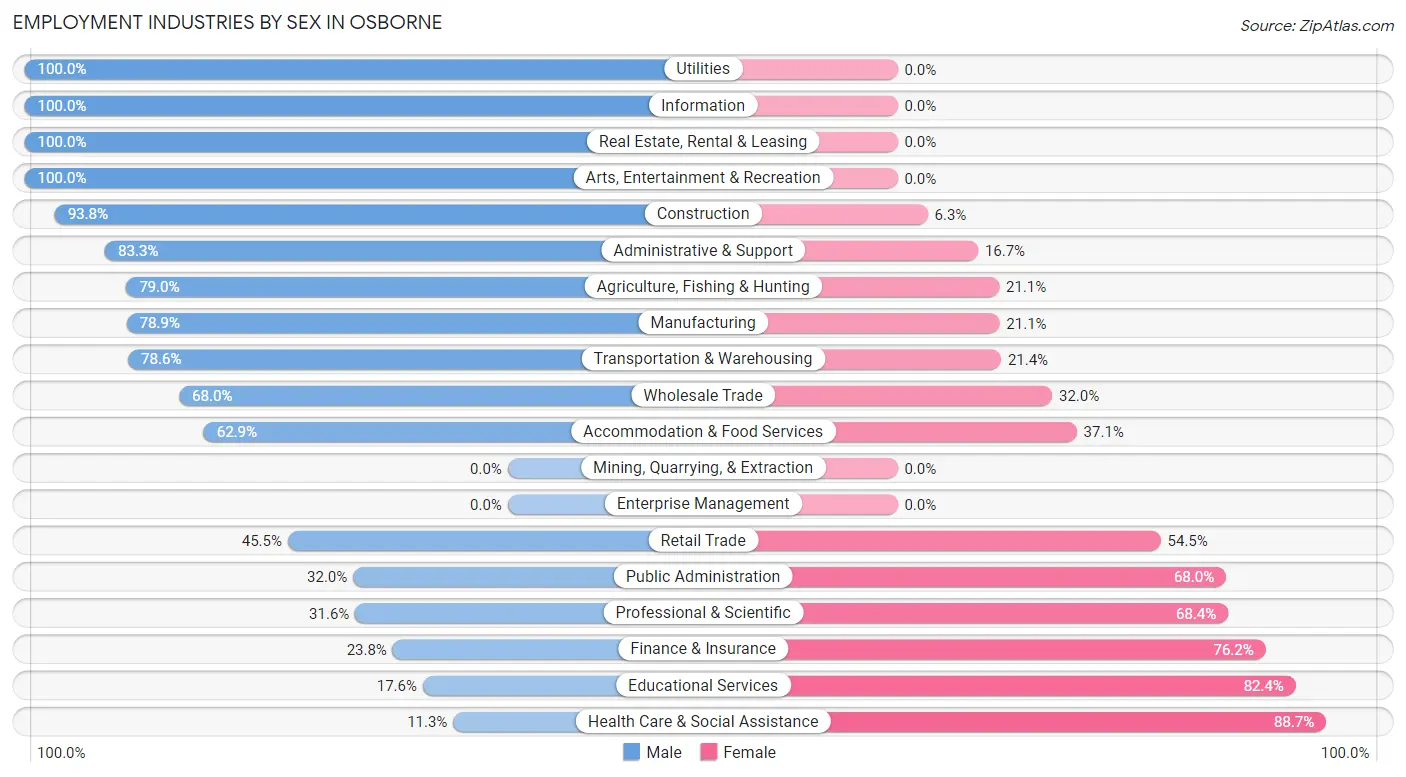
Employment Industries by Sex in Osborne
The Osborne industries that see more men than women are Utilities (100.0%), Information (100.0%), and Real Estate, Rental & Leasing (100.0%), whereas the industries that tend to have a higher number of women are Health Care & Social Assistance (88.7%), Educational Services (82.4%), and Finance & Insurance (76.2%).
| Industry | Male | Female |
| Agriculture, Fishing & Hunting | 15 (78.9%) | 4 (21.0%) |
| Mining, Quarrying, & Extraction | 0 (0.0%) | 0 (0.0%) |
| Construction | 60 (93.8%) | 4 (6.2%) |
| Manufacturing | 71 (78.9%) | 19 (21.1%) |
| Wholesale Trade | 17 (68.0%) | 8 (32.0%) |
| Retail Trade | 66 (45.5%) | 79 (54.5%) |
| Transportation & Warehousing | 11 (78.6%) | 3 (21.4%) |
| Utilities | 13 (100.0%) | 0 (0.0%) |
| Information | 5 (100.0%) | 0 (0.0%) |
| Finance & Insurance | 10 (23.8%) | 32 (76.2%) |
| Real Estate, Rental & Leasing | 9 (100.0%) | 0 (0.0%) |
| Professional & Scientific | 6 (31.6%) | 13 (68.4%) |
| Enterprise Management | 0 (0.0%) | 0 (0.0%) |
| Administrative & Support | 10 (83.3%) | 2 (16.7%) |
| Educational Services | 13 (17.6%) | 61 (82.4%) |
| Health Care & Social Assistance | 21 (11.3%) | 165 (88.7%) |
| Arts, Entertainment & Recreation | 3 (100.0%) | 0 (0.0%) |
| Accommodation & Food Services | 39 (62.9%) | 23 (37.1%) |
| Public Administration | 8 (32.0%) | 17 (68.0%) |
| Total | 393 (47.3%) | 437 (52.6%) |
Education in Osborne
School Enrollment in Osborne
The most common levels of schooling among the 288 students in Osborne are high school (75 | 26.0%), elementary school (65 | 22.6%), and middle school (44 | 15.3%).
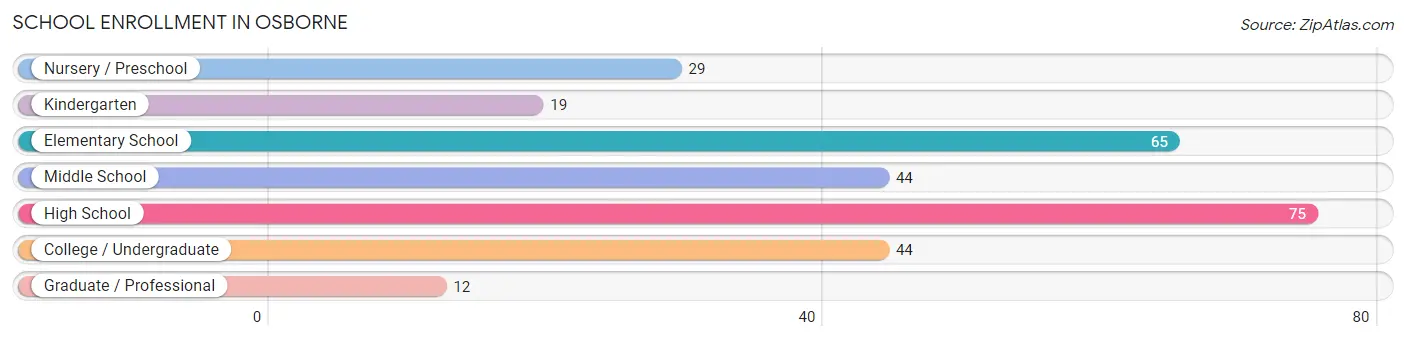
| School Level | # Students | % Students |
| Nursery / Preschool | 29 | 10.1% |
| Kindergarten | 19 | 6.6% |
| Elementary School | 65 | 22.6% |
| Middle School | 44 | 15.3% |
| High School | 75 | 26.0% |
| College / Undergraduate | 44 | 15.3% |
| Graduate / Professional | 12 | 4.2% |
| Total | 288 | 100.0% |
School Enrollment by Age by Funding Source in Osborne
Out of a total of 288 students who are enrolled in schools in Osborne, 14 (4.9%) attend a private institution, while the remaining 274 (95.1%) are enrolled in public schools. The age group of 10 to 14 year olds has the highest likelihood of being enrolled in private schools, with 9 (13.6% in the age bracket) enrolled. Conversely, the age group of 3 to 4 year olds has the lowest likelihood of being enrolled in a private school, with 16 (100.0% in the age bracket) attending a public institution.
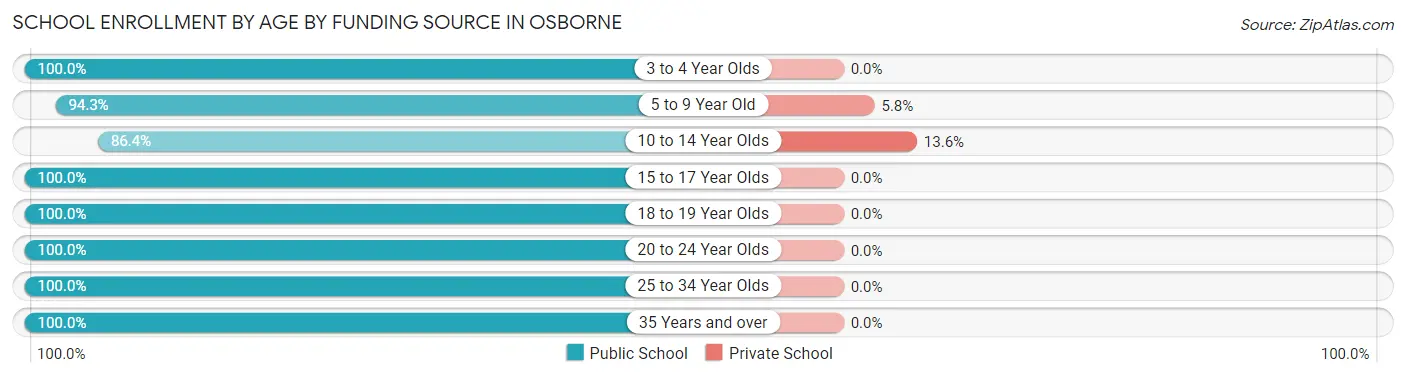
| Age Bracket | Public School | Private School |
| 3 to 4 Year Olds | 16 (100.0%) | 0 (0.0%) |
| 5 to 9 Year Old | 82 (94.3%) | 5 (5.8%) |
| 10 to 14 Year Olds | 57 (86.4%) | 9 (13.6%) |
| 15 to 17 Year Olds | 60 (100.0%) | 0 (0.0%) |
| 18 to 19 Year Olds | 23 (100.0%) | 0 (0.0%) |
| 20 to 24 Year Olds | 12 (100.0%) | 0 (0.0%) |
| 25 to 34 Year Olds | 13 (100.0%) | 0 (0.0%) |
| 35 Years and over | 11 (100.0%) | 0 (0.0%) |
| Total | 274 (95.1%) | 14 (4.9%) |
Educational Attainment by Field of Study in Osborne
Education (61 | 36.7%), arts & humanities (27 | 16.3%), business (17 | 10.2%), bio, nature & agricultural (14 | 8.4%), and science & technology (13 | 7.8%) are the most common fields of study among 166 individuals in Osborne who have obtained a bachelor's degree or higher.
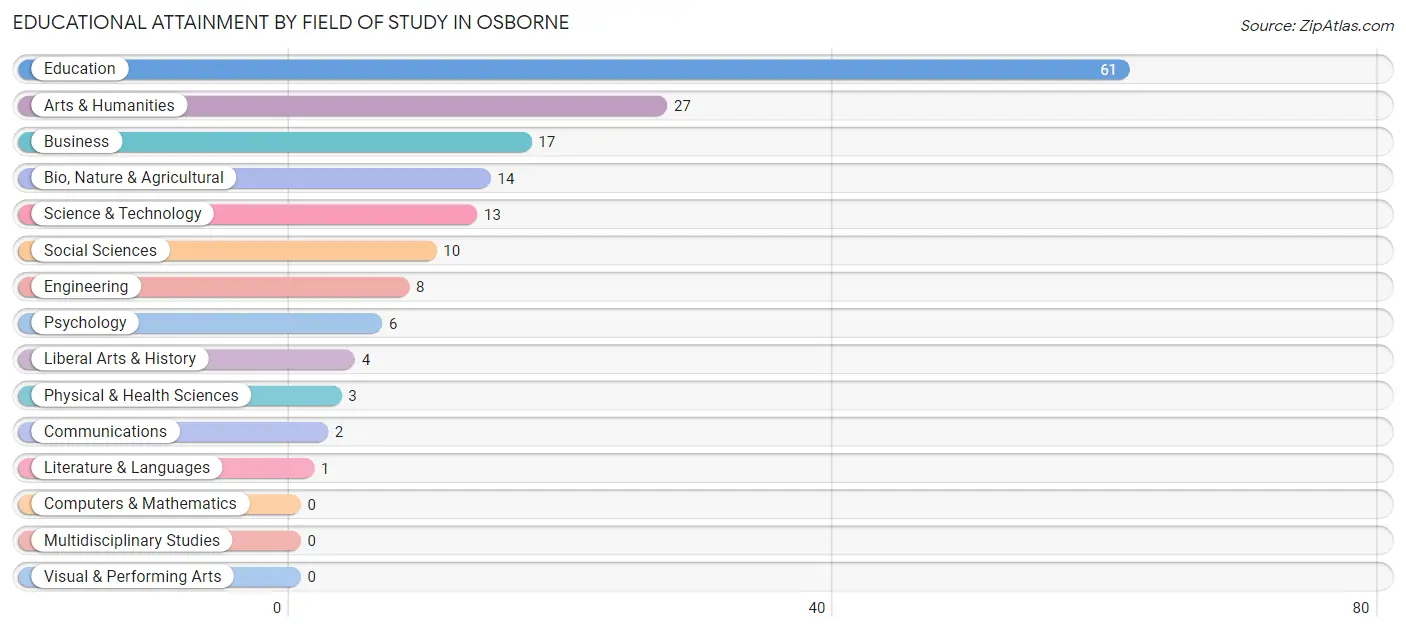
| Field of Study | # Graduates | % Graduates |
| Computers & Mathematics | 0 | 0.0% |
| Bio, Nature & Agricultural | 14 | 8.4% |
| Physical & Health Sciences | 3 | 1.8% |
| Psychology | 6 | 3.6% |
| Social Sciences | 10 | 6.0% |
| Engineering | 8 | 4.8% |
| Multidisciplinary Studies | 0 | 0.0% |
| Science & Technology | 13 | 7.8% |
| Business | 17 | 10.2% |
| Education | 61 | 36.7% |
| Literature & Languages | 1 | 0.6% |
| Liberal Arts & History | 4 | 2.4% |
| Visual & Performing Arts | 0 | 0.0% |
| Communications | 2 | 1.2% |
| Arts & Humanities | 27 | 16.3% |
| Total | 166 | 100.0% |
Transportation & Commute in Osborne
Vehicle Availability by Sex in Osborne
The most prevalent vehicle ownership categories in Osborne are males with 2 vehicles (157, accounting for 40.0%) and females with 2 vehicles (153, making up 35.9%).
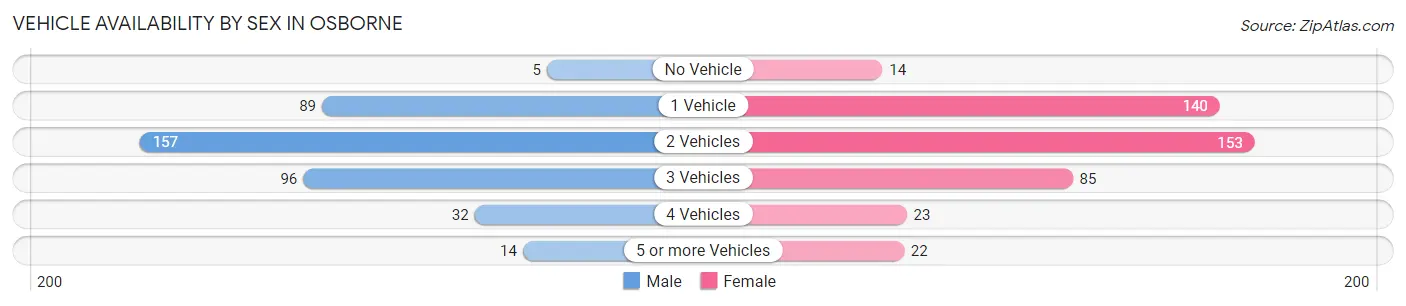
| Vehicles Available | Male | Female |
| No Vehicle | 5 (1.3%) | 14 (3.2%) |
| 1 Vehicle | 89 (22.7%) | 140 (32.0%) |
| 2 Vehicles | 157 (40.0%) | 153 (35.0%) |
| 3 Vehicles | 96 (24.4%) | 85 (19.5%) |
| 4 Vehicles | 32 (8.1%) | 23 (5.3%) |
| 5 or more Vehicles | 14 (3.6%) | 22 (5.0%) |
| Total | 393 (100.0%) | 437 (100.0%) |
Commute Time in Osborne
The most frequently occuring commute durations in Osborne are 5 to 9 minutes (398 commuters, 51.3%), less than 5 minutes (182 commuters, 23.4%), and 30 to 34 minutes (40 commuters, 5.1%).
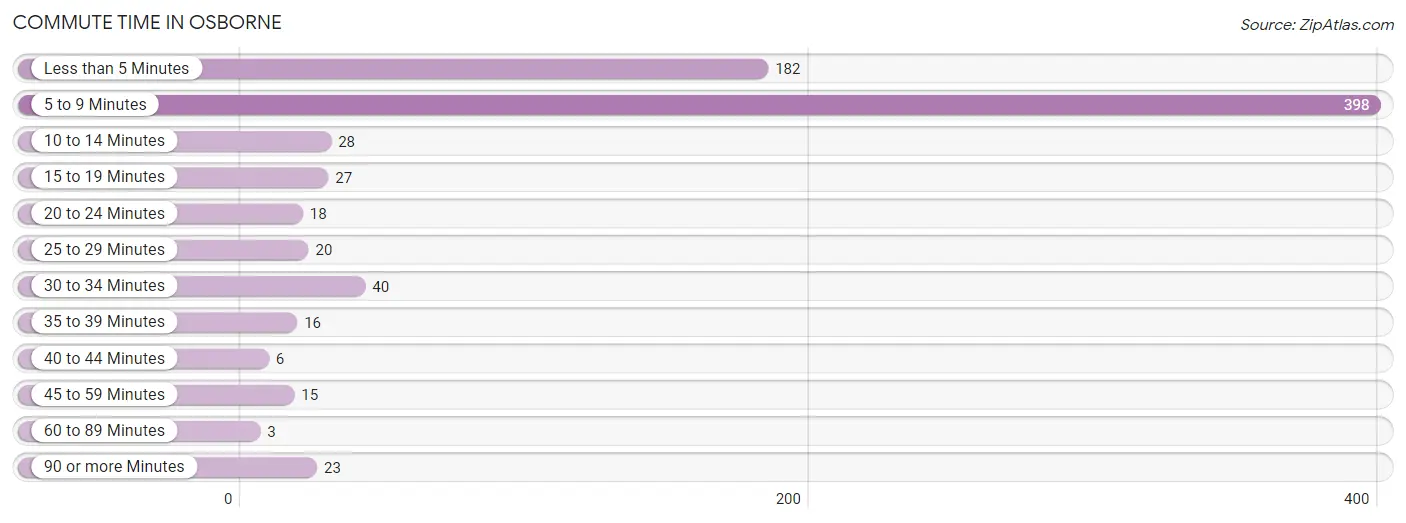
| Commute Time | # Commuters | % Commuters |
| Less than 5 Minutes | 182 | 23.4% |
| 5 to 9 Minutes | 398 | 51.3% |
| 10 to 14 Minutes | 28 | 3.6% |
| 15 to 19 Minutes | 27 | 3.5% |
| 20 to 24 Minutes | 18 | 2.3% |
| 25 to 29 Minutes | 20 | 2.6% |
| 30 to 34 Minutes | 40 | 5.1% |
| 35 to 39 Minutes | 16 | 2.1% |
| 40 to 44 Minutes | 6 | 0.8% |
| 45 to 59 Minutes | 15 | 1.9% |
| 60 to 89 Minutes | 3 | 0.4% |
| 90 or more Minutes | 23 | 3.0% |
Commute Time by Sex in Osborne
The most common commute times in Osborne are 5 to 9 minutes (169 commuters, 44.0%) for males and 5 to 9 minutes (229 commuters, 58.4%) for females.
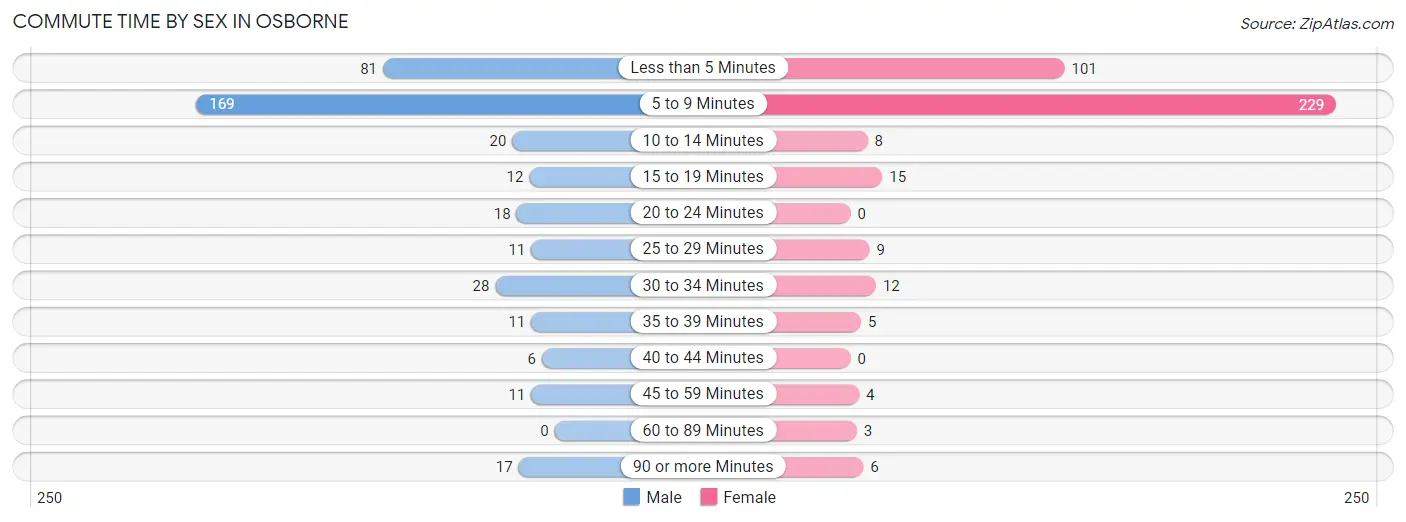
| Commute Time | Male | Female |
| Less than 5 Minutes | 81 (21.1%) | 101 (25.8%) |
| 5 to 9 Minutes | 169 (44.0%) | 229 (58.4%) |
| 10 to 14 Minutes | 20 (5.2%) | 8 (2.0%) |
| 15 to 19 Minutes | 12 (3.1%) | 15 (3.8%) |
| 20 to 24 Minutes | 18 (4.7%) | 0 (0.0%) |
| 25 to 29 Minutes | 11 (2.9%) | 9 (2.3%) |
| 30 to 34 Minutes | 28 (7.3%) | 12 (3.1%) |
| 35 to 39 Minutes | 11 (2.9%) | 5 (1.3%) |
| 40 to 44 Minutes | 6 (1.6%) | 0 (0.0%) |
| 45 to 59 Minutes | 11 (2.9%) | 4 (1.0%) |
| 60 to 89 Minutes | 0 (0.0%) | 3 (0.8%) |
| 90 or more Minutes | 17 (4.4%) | 6 (1.5%) |
Time of Departure to Work by Sex in Osborne
The most frequent times of departure to work in Osborne are 7:30 AM to 7:59 AM (93, 24.2%) for males and 7:30 AM to 7:59 AM (92, 23.5%) for females.
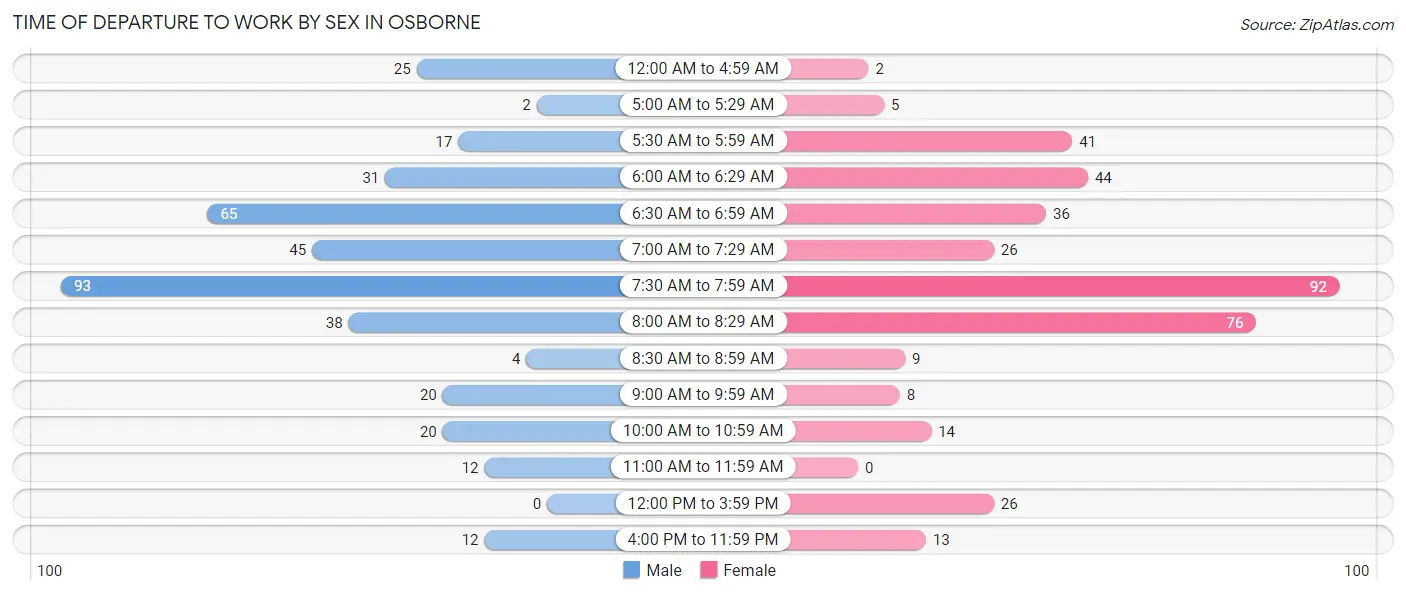
| Time of Departure | Male | Female |
| 12:00 AM to 4:59 AM | 25 (6.5%) | 2 (0.5%) |
| 5:00 AM to 5:29 AM | 2 (0.5%) | 5 (1.3%) |
| 5:30 AM to 5:59 AM | 17 (4.4%) | 41 (10.5%) |
| 6:00 AM to 6:29 AM | 31 (8.1%) | 44 (11.2%) |
| 6:30 AM to 6:59 AM | 65 (16.9%) | 36 (9.2%) |
| 7:00 AM to 7:29 AM | 45 (11.7%) | 26 (6.6%) |
| 7:30 AM to 7:59 AM | 93 (24.2%) | 92 (23.5%) |
| 8:00 AM to 8:29 AM | 38 (9.9%) | 76 (19.4%) |
| 8:30 AM to 8:59 AM | 4 (1.0%) | 9 (2.3%) |
| 9:00 AM to 9:59 AM | 20 (5.2%) | 8 (2.0%) |
| 10:00 AM to 10:59 AM | 20 (5.2%) | 14 (3.6%) |
| 11:00 AM to 11:59 AM | 12 (3.1%) | 0 (0.0%) |
| 12:00 PM to 3:59 PM | 0 (0.0%) | 26 (6.6%) |
| 4:00 PM to 11:59 PM | 12 (3.1%) | 13 (3.3%) |
| Total | 384 (100.0%) | 392 (100.0%) |
Housing Occupancy in Osborne
Occupancy by Ownership in Osborne
Of the total 707 dwellings in Osborne, owner-occupied units account for 467 (66.0%), while renter-occupied units make up 240 (34.0%).
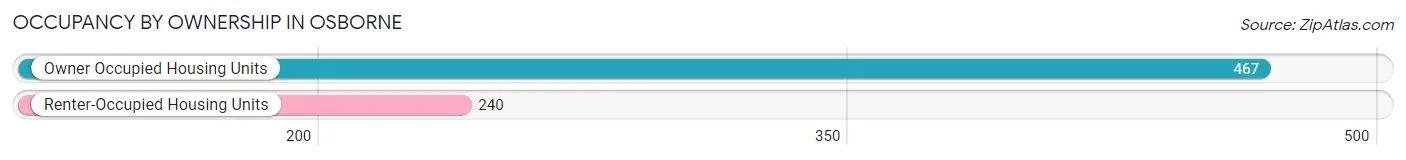
| Occupancy | # Housing Units | % Housing Units |
| Owner Occupied Housing Units | 467 | 66.0% |
| Renter-Occupied Housing Units | 240 | 34.0% |
| Total Occupied Housing Units | 707 | 100.0% |
Occupancy by Household Size in Osborne
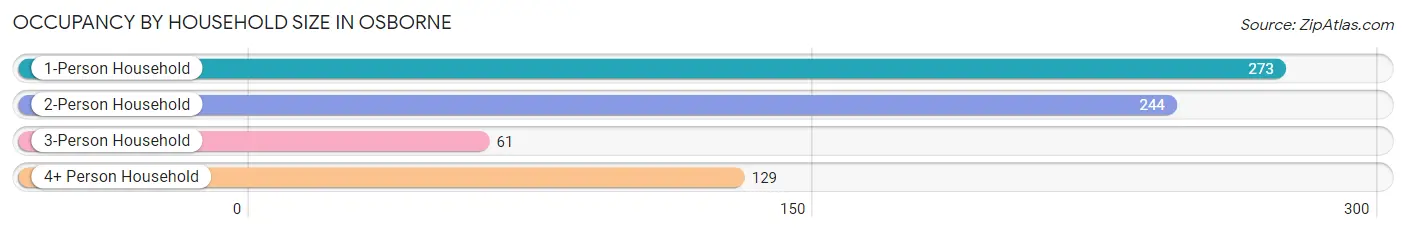
| Household Size | # Housing Units | % Housing Units |
| 1-Person Household | 273 | 38.6% |
| 2-Person Household | 244 | 34.5% |
| 3-Person Household | 61 | 8.6% |
| 4+ Person Household | 129 | 18.2% |
| Total Housing Units | 707 | 100.0% |
Occupancy by Ownership by Household Size in Osborne
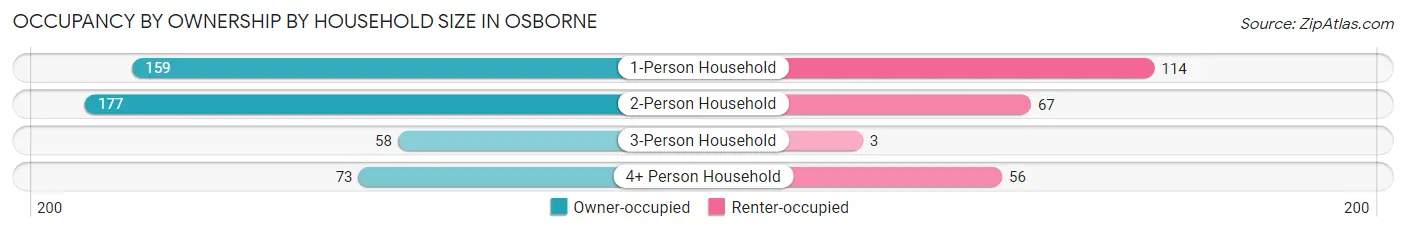
| Household Size | Owner-occupied | Renter-occupied |
| 1-Person Household | 159 (58.2%) | 114 (41.8%) |
| 2-Person Household | 177 (72.5%) | 67 (27.5%) |
| 3-Person Household | 58 (95.1%) | 3 (4.9%) |
| 4+ Person Household | 73 (56.6%) | 56 (43.4%) |
| Total Housing Units | 467 (66.0%) | 240 (34.0%) |
Occupancy by Educational Attainment in Osborne
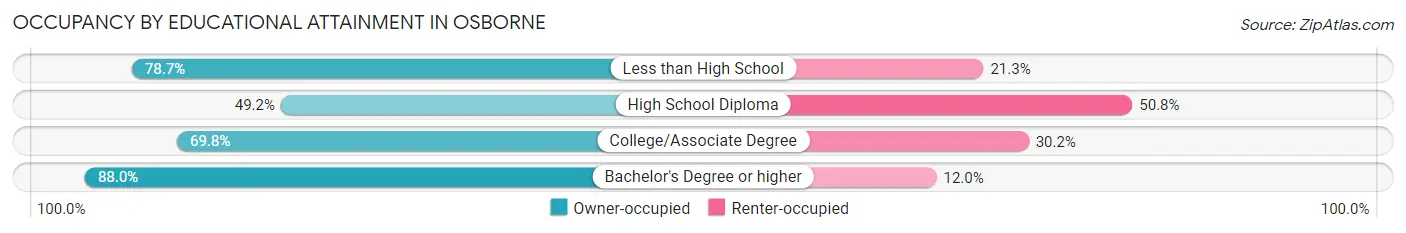
| Household Size | Owner-occupied | Renter-occupied |
| Less than High School | 37 (78.7%) | 10 (21.3%) |
| High School Diploma | 124 (49.2%) | 128 (50.8%) |
| College/Associate Degree | 203 (69.8%) | 88 (30.2%) |
| Bachelor's Degree or higher | 103 (88.0%) | 14 (12.0%) |
Occupancy by Age of Householder in Osborne
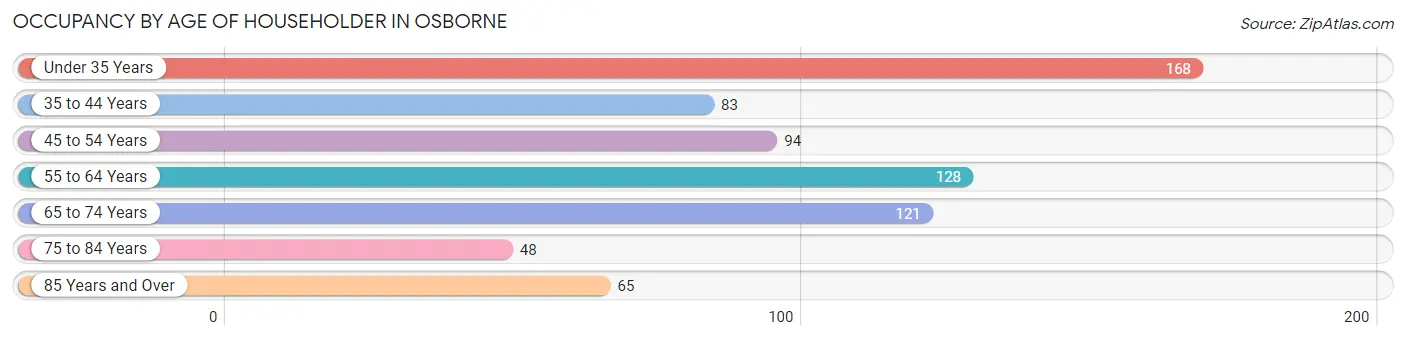
| Age Bracket | # Households | % Households |
| Under 35 Years | 168 | 23.8% |
| 35 to 44 Years | 83 | 11.7% |
| 45 to 54 Years | 94 | 13.3% |
| 55 to 64 Years | 128 | 18.1% |
| 65 to 74 Years | 121 | 17.1% |
| 75 to 84 Years | 48 | 6.8% |
| 85 Years and Over | 65 | 9.2% |
| Total | 707 | 100.0% |
Housing Finances in Osborne
Median Income by Occupancy in Osborne
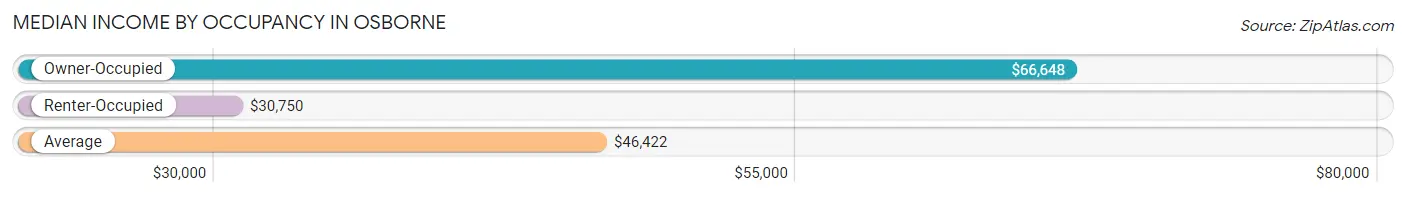
| Occupancy Type | # Households | Median Income |
| Owner-Occupied | 467 (66.0%) | $66,648 |
| Renter-Occupied | 240 (34.0%) | $30,750 |
| Average | 707 (100.0%) | $46,422 |
Occupancy by Householder Income Bracket in Osborne
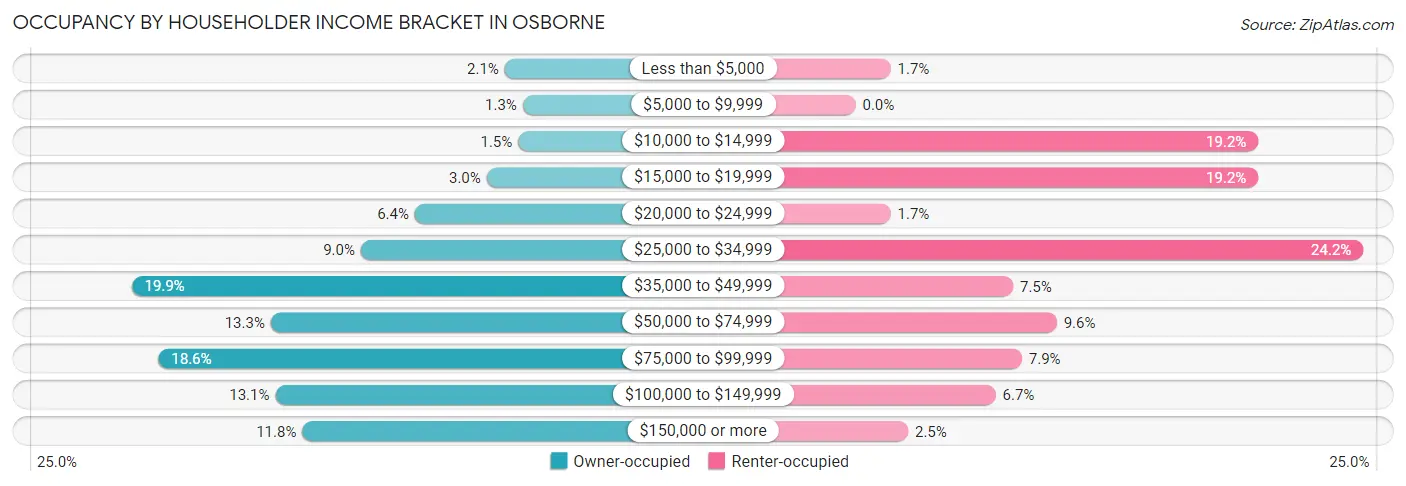
| Income Bracket | Owner-occupied | Renter-occupied |
| Less than $5,000 | 10 (2.1%) | 4 (1.7%) |
| $5,000 to $9,999 | 6 (1.3%) | 0 (0.0%) |
| $10,000 to $14,999 | 7 (1.5%) | 46 (19.2%) |
| $15,000 to $19,999 | 14 (3.0%) | 46 (19.2%) |
| $20,000 to $24,999 | 30 (6.4%) | 4 (1.7%) |
| $25,000 to $34,999 | 42 (9.0%) | 58 (24.2%) |
| $35,000 to $49,999 | 93 (19.9%) | 18 (7.5%) |
| $50,000 to $74,999 | 62 (13.3%) | 23 (9.6%) |
| $75,000 to $99,999 | 87 (18.6%) | 19 (7.9%) |
| $100,000 to $149,999 | 61 (13.1%) | 16 (6.7%) |
| $150,000 or more | 55 (11.8%) | 6 (2.5%) |
| Total | 467 (100.0%) | 240 (100.0%) |
Monthly Housing Cost Tiers in Osborne
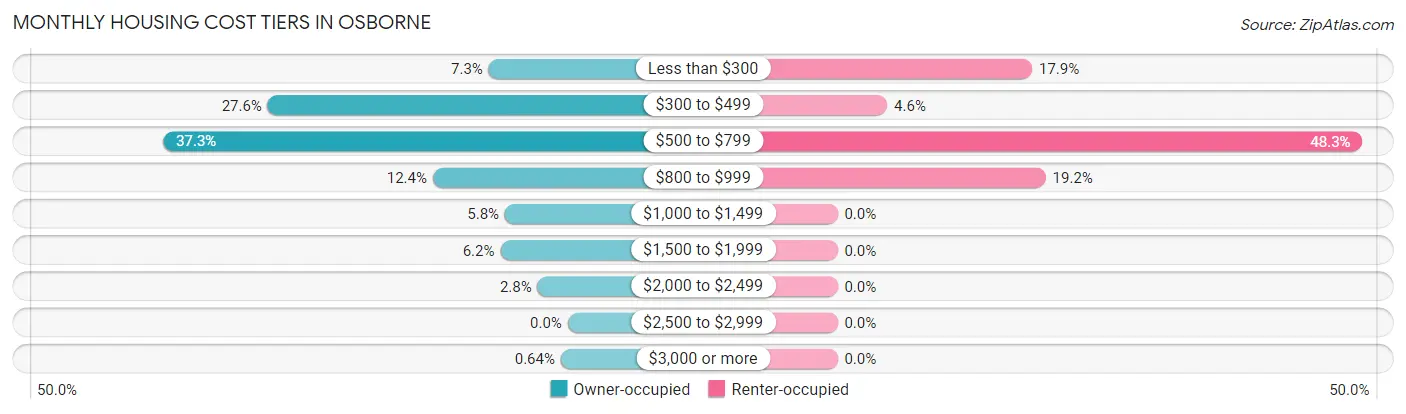
| Monthly Cost | Owner-occupied | Renter-occupied |
| Less than $300 | 34 (7.3%) | 43 (17.9%) |
| $300 to $499 | 129 (27.6%) | 11 (4.6%) |
| $500 to $799 | 174 (37.3%) | 116 (48.3%) |
| $800 to $999 | 58 (12.4%) | 46 (19.2%) |
| $1,000 to $1,499 | 27 (5.8%) | 0 (0.0%) |
| $1,500 to $1,999 | 29 (6.2%) | 0 (0.0%) |
| $2,000 to $2,499 | 13 (2.8%) | 0 (0.0%) |
| $2,500 to $2,999 | 0 (0.0%) | 0 (0.0%) |
| $3,000 or more | 3 (0.6%) | 0 (0.0%) |
| Total | 467 (100.0%) | 240 (100.0%) |
Physical Housing Characteristics in Osborne
Housing Structures in Osborne
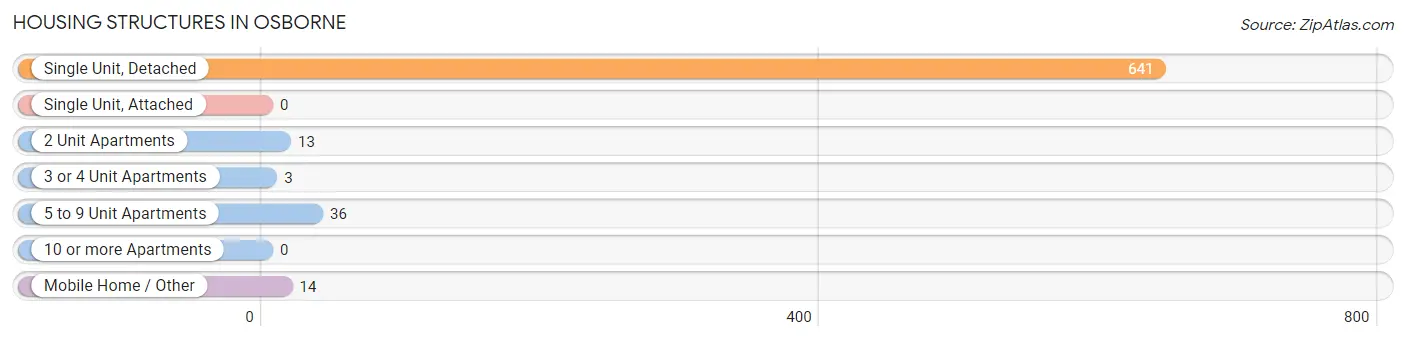
| Structure Type | # Housing Units | % Housing Units |
| Single Unit, Detached | 641 | 90.7% |
| Single Unit, Attached | 0 | 0.0% |
| 2 Unit Apartments | 13 | 1.8% |
| 3 or 4 Unit Apartments | 3 | 0.4% |
| 5 to 9 Unit Apartments | 36 | 5.1% |
| 10 or more Apartments | 0 | 0.0% |
| Mobile Home / Other | 14 | 2.0% |
| Total | 707 | 100.0% |
Housing Structures by Occupancy in Osborne
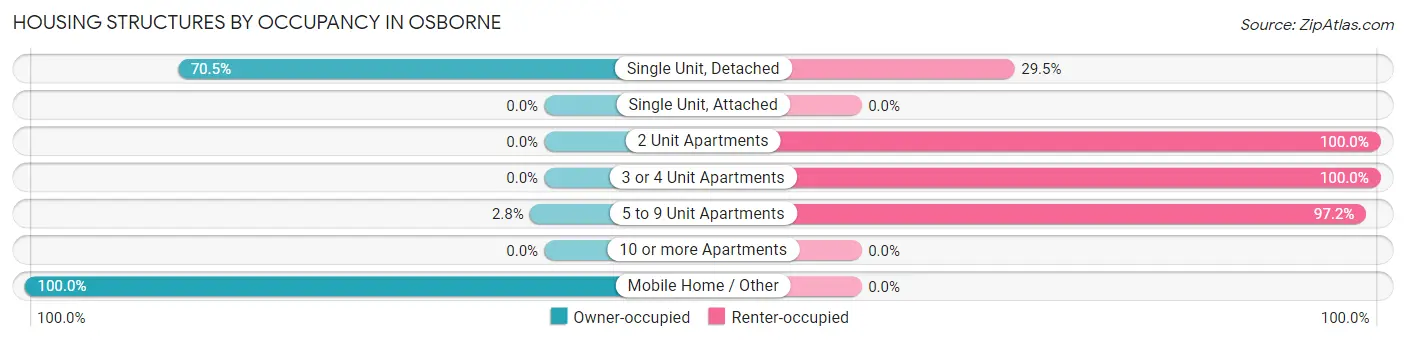
| Structure Type | Owner-occupied | Renter-occupied |
| Single Unit, Detached | 452 (70.5%) | 189 (29.5%) |
| Single Unit, Attached | 0 (0.0%) | 0 (0.0%) |
| 2 Unit Apartments | 0 (0.0%) | 13 (100.0%) |
| 3 or 4 Unit Apartments | 0 (0.0%) | 3 (100.0%) |
| 5 to 9 Unit Apartments | 1 (2.8%) | 35 (97.2%) |
| 10 or more Apartments | 0 (0.0%) | 0 (0.0%) |
| Mobile Home / Other | 14 (100.0%) | 0 (0.0%) |
| Total | 467 (66.0%) | 240 (34.0%) |
Housing Structures by Number of Rooms in Osborne
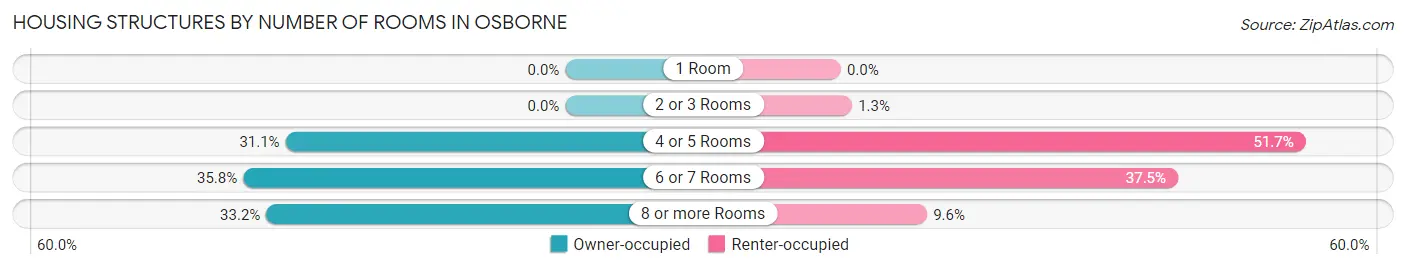
| Number of Rooms | Owner-occupied | Renter-occupied |
| 1 Room | 0 (0.0%) | 0 (0.0%) |
| 2 or 3 Rooms | 0 (0.0%) | 3 (1.3%) |
| 4 or 5 Rooms | 145 (31.0%) | 124 (51.7%) |
| 6 or 7 Rooms | 167 (35.8%) | 90 (37.5%) |
| 8 or more Rooms | 155 (33.2%) | 23 (9.6%) |
| Total | 467 (100.0%) | 240 (100.0%) |
Housing Structure by Heating Type in Osborne
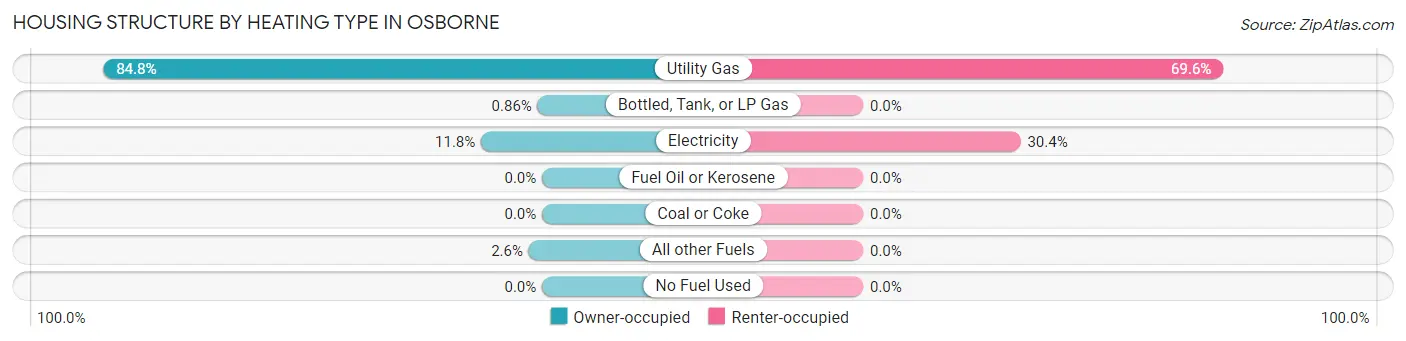
| Heating Type | Owner-occupied | Renter-occupied |
| Utility Gas | 396 (84.8%) | 167 (69.6%) |
| Bottled, Tank, or LP Gas | 4 (0.9%) | 0 (0.0%) |
| Electricity | 55 (11.8%) | 73 (30.4%) |
| Fuel Oil or Kerosene | 0 (0.0%) | 0 (0.0%) |
| Coal or Coke | 0 (0.0%) | 0 (0.0%) |
| All other Fuels | 12 (2.6%) | 0 (0.0%) |
| No Fuel Used | 0 (0.0%) | 0 (0.0%) |
| Total | 467 (100.0%) | 240 (100.0%) |
Household Vehicle Usage in Osborne
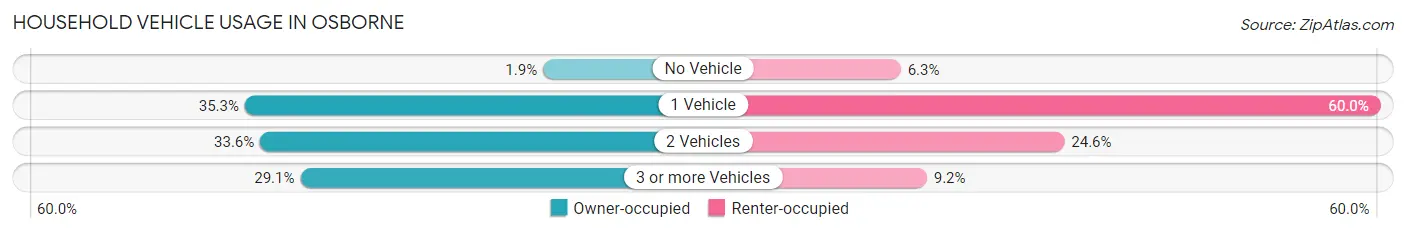
| Vehicles per Household | Owner-occupied | Renter-occupied |
| No Vehicle | 9 (1.9%) | 15 (6.2%) |
| 1 Vehicle | 165 (35.3%) | 144 (60.0%) |
| 2 Vehicles | 157 (33.6%) | 59 (24.6%) |
| 3 or more Vehicles | 136 (29.1%) | 22 (9.2%) |
| Total | 467 (100.0%) | 240 (100.0%) |
Real Estate & Mortgages in Osborne
Real Estate and Mortgage Overview in Osborne
| Characteristic | Without Mortgage | With Mortgage |
| Housing Units | 271 | 196 |
| Median Property Value | $65,800 | $90,400 |
| Median Household Income | $47,163 | $33 |
| Monthly Housing Costs | $460 | $0 |
| Real Estate Taxes | $1,434 | $0 |
Property Value by Mortgage Status in Osborne
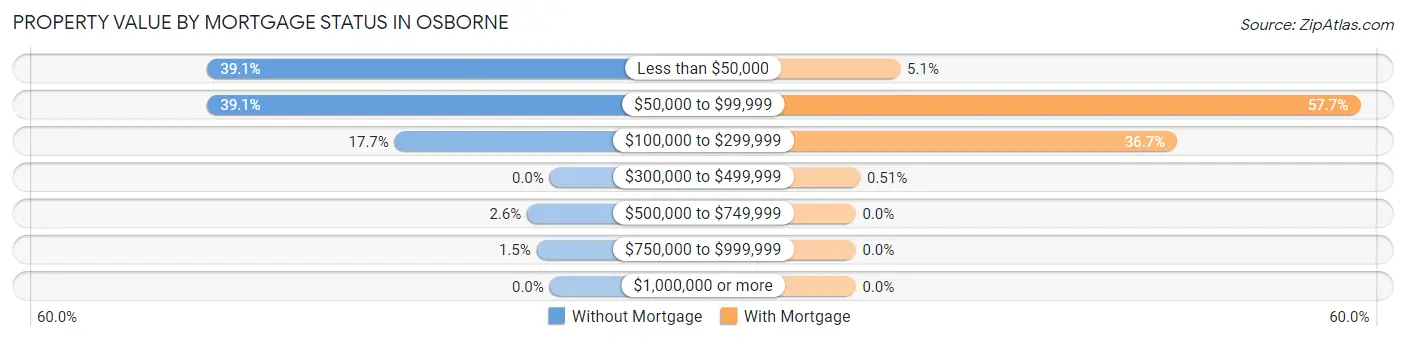
| Property Value | Without Mortgage | With Mortgage |
| Less than $50,000 | 106 (39.1%) | 10 (5.1%) |
| $50,000 to $99,999 | 106 (39.1%) | 113 (57.7%) |
| $100,000 to $299,999 | 48 (17.7%) | 72 (36.7%) |
| $300,000 to $499,999 | 0 (0.0%) | 1 (0.5%) |
| $500,000 to $749,999 | 7 (2.6%) | 0 (0.0%) |
| $750,000 to $999,999 | 4 (1.5%) | 0 (0.0%) |
| $1,000,000 or more | 0 (0.0%) | 0 (0.0%) |
| Total | 271 (100.0%) | 196 (100.0%) |
Household Income by Mortgage Status in Osborne
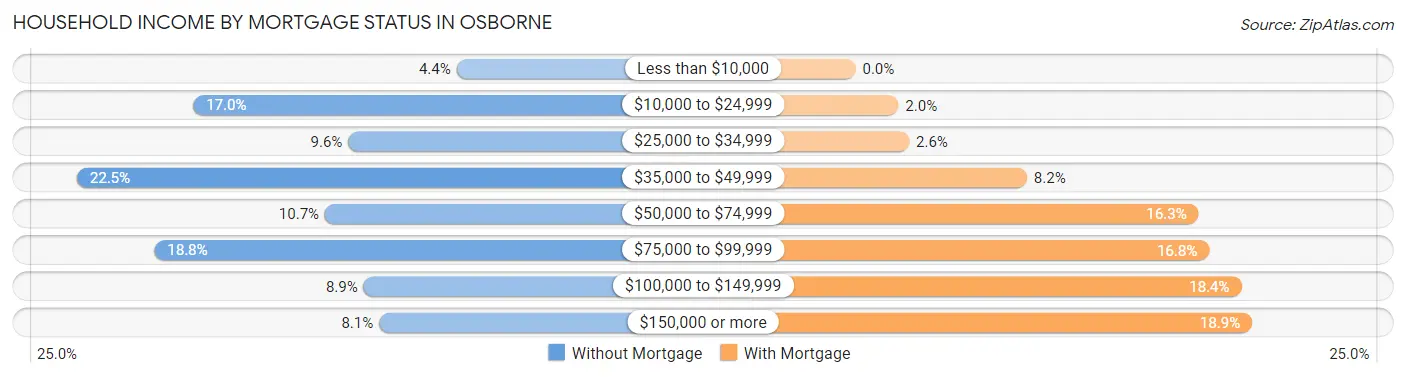
| Household Income | Without Mortgage | With Mortgage |
| Less than $10,000 | 12 (4.4%) | 0 (0.0%) |
| $10,000 to $24,999 | 46 (17.0%) | 4 (2.0%) |
| $25,000 to $34,999 | 26 (9.6%) | 5 (2.5%) |
| $35,000 to $49,999 | 61 (22.5%) | 16 (8.2%) |
| $50,000 to $74,999 | 29 (10.7%) | 32 (16.3%) |
| $75,000 to $99,999 | 51 (18.8%) | 33 (16.8%) |
| $100,000 to $149,999 | 24 (8.9%) | 36 (18.4%) |
| $150,000 or more | 22 (8.1%) | 37 (18.9%) |
| Total | 271 (100.0%) | 196 (100.0%) |
Property Value to Household Income Ratio in Osborne
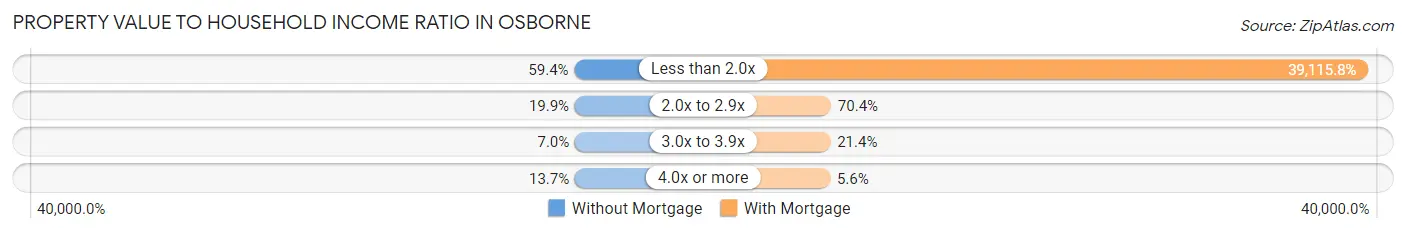
| Value-to-Income Ratio | Without Mortgage | With Mortgage |
| Less than 2.0x | 161 (59.4%) | 76,667 (39,115.8%) |
| 2.0x to 2.9x | 54 (19.9%) | 138 (70.4%) |
| 3.0x to 3.9x | 19 (7.0%) | 42 (21.4%) |
| 4.0x or more | 37 (13.7%) | 11 (5.6%) |
| Total | 271 (100.0%) | 196 (100.0%) |
Real Estate Taxes by Mortgage Status in Osborne
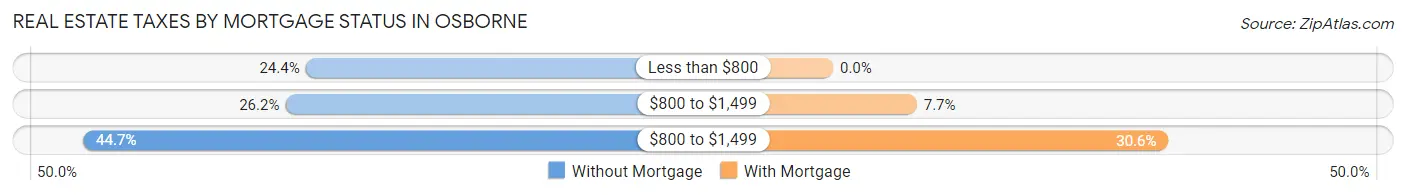
| Property Taxes | Without Mortgage | With Mortgage |
| Less than $800 | 66 (24.3%) | 0 (0.0%) |
| $800 to $1,499 | 71 (26.2%) | 15 (7.6%) |
| $800 to $1,499 | 121 (44.7%) | 60 (30.6%) |
| Total | 271 (100.0%) | 196 (100.0%) |
Health & Disability in Osborne
Health Insurance Coverage by Age in Osborne
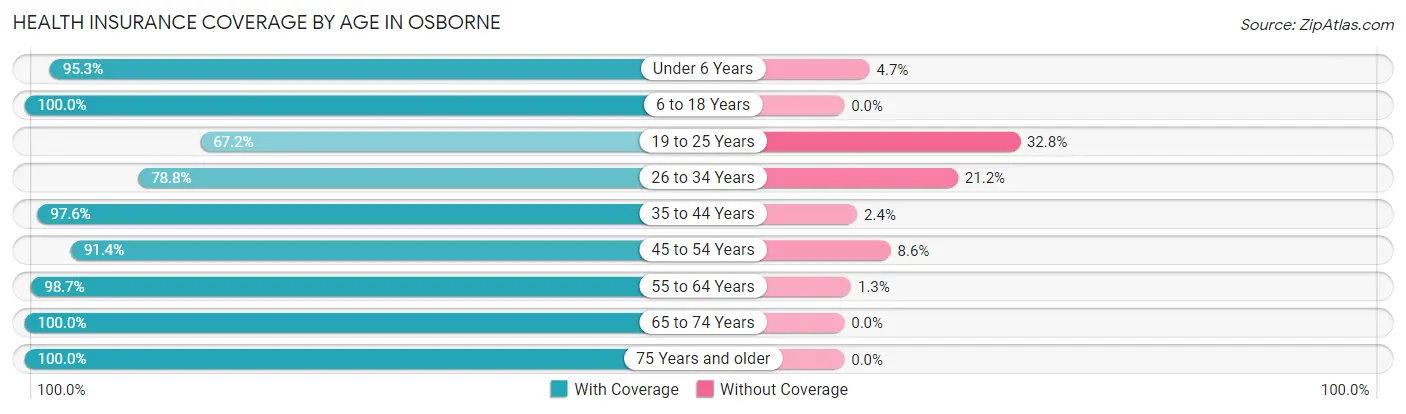
| Age Bracket | With Coverage | Without Coverage |
| Under 6 Years | 101 (95.3%) | 5 (4.7%) |
| 6 to 18 Years | 198 (100.0%) | 0 (0.0%) |
| 19 to 25 Years | 117 (67.2%) | 57 (32.8%) |
| 26 to 34 Years | 93 (78.8%) | 25 (21.2%) |
| 35 to 44 Years | 163 (97.6%) | 4 (2.4%) |
| 45 to 54 Years | 127 (91.4%) | 12 (8.6%) |
| 55 to 64 Years | 236 (98.7%) | 3 (1.3%) |
| 65 to 74 Years | 161 (100.0%) | 0 (0.0%) |
| 75 Years and older | 153 (100.0%) | 0 (0.0%) |
| Total | 1,349 (92.7%) | 106 (7.3%) |
Health Insurance Coverage by Citizenship Status in Osborne
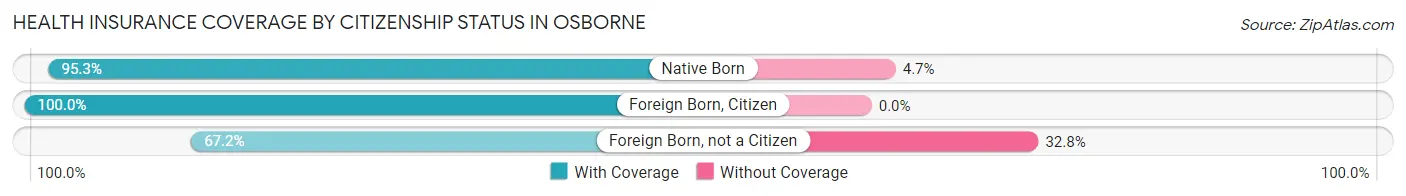
| Citizenship Status | With Coverage | Without Coverage |
| Native Born | 101 (95.3%) | 5 (4.7%) |
| Foreign Born, Citizen | 198 (100.0%) | 0 (0.0%) |
| Foreign Born, not a Citizen | 117 (67.2%) | 57 (32.8%) |
Health Insurance Coverage by Household Income in Osborne
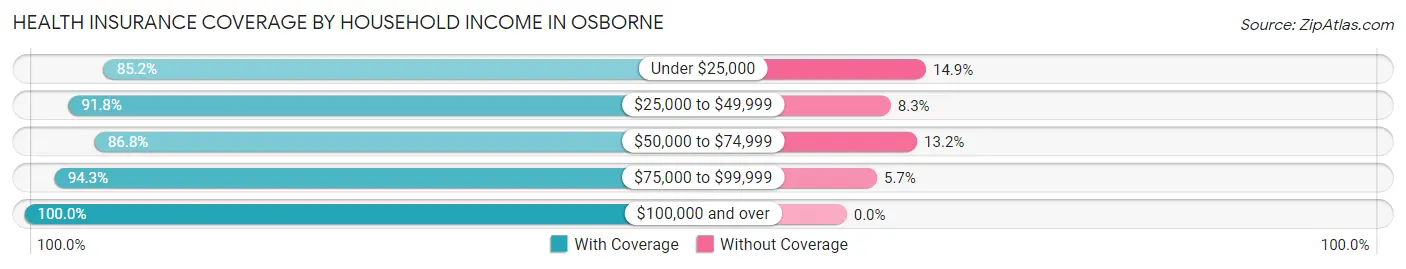
| Household Income | With Coverage | Without Coverage |
| Under $25,000 | 195 (85.2%) | 34 (14.8%) |
| $25,000 to $49,999 | 356 (91.7%) | 32 (8.3%) |
| $50,000 to $74,999 | 191 (86.8%) | 29 (13.2%) |
| $75,000 to $99,999 | 183 (94.3%) | 11 (5.7%) |
| $100,000 and over | 424 (100.0%) | 0 (0.0%) |
Public vs Private Health Insurance Coverage by Age in Osborne
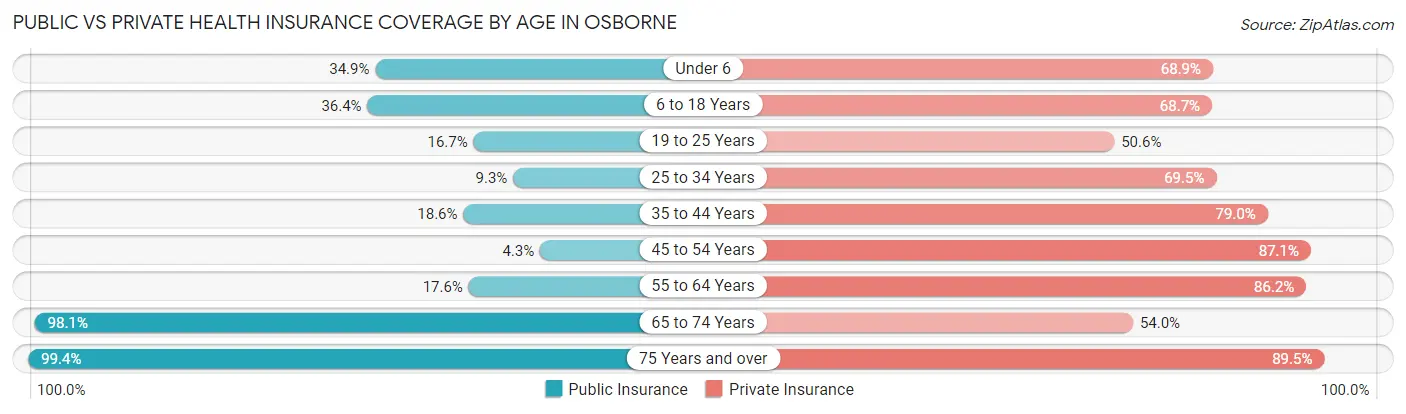
| Age Bracket | Public Insurance | Private Insurance |
| Under 6 | 37 (34.9%) | 73 (68.9%) |
| 6 to 18 Years | 72 (36.4%) | 136 (68.7%) |
| 19 to 25 Years | 29 (16.7%) | 88 (50.6%) |
| 25 to 34 Years | 11 (9.3%) | 82 (69.5%) |
| 35 to 44 Years | 31 (18.6%) | 132 (79.0%) |
| 45 to 54 Years | 6 (4.3%) | 121 (87.1%) |
| 55 to 64 Years | 42 (17.6%) | 206 (86.2%) |
| 65 to 74 Years | 158 (98.1%) | 87 (54.0%) |
| 75 Years and over | 152 (99.4%) | 137 (89.5%) |
| Total | 538 (37.0%) | 1,062 (73.0%) |
Disability Status by Sex by Age in Osborne
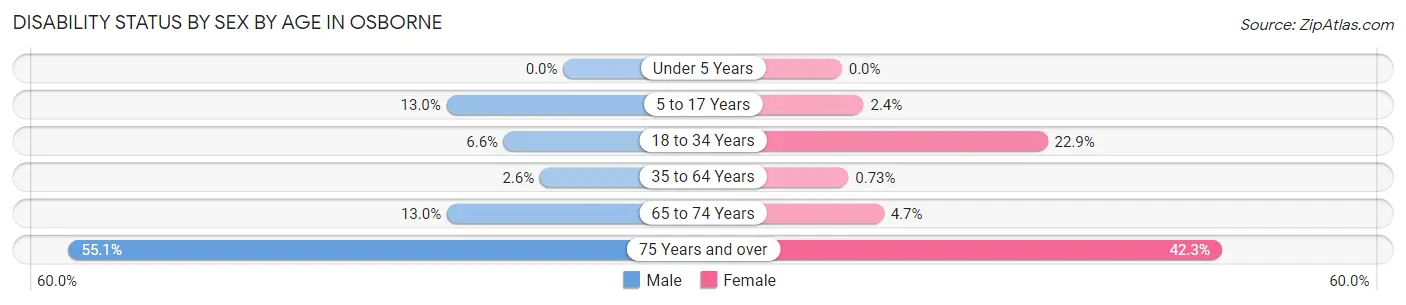
| Age Bracket | Male | Female |
| Under 5 Years | 0 (0.0%) | 0 (0.0%) |
| 5 to 17 Years | 13 (13.0%) | 3 (2.4%) |
| 18 to 34 Years | 10 (6.6%) | 33 (22.9%) |
| 35 to 64 Years | 7 (2.6%) | 2 (0.7%) |
| 65 to 74 Years | 7 (13.0%) | 5 (4.7%) |
| 75 Years and over | 27 (55.1%) | 44 (42.3%) |
Disability Class by Sex by Age in Osborne
Disability Class: Hearing Difficulty
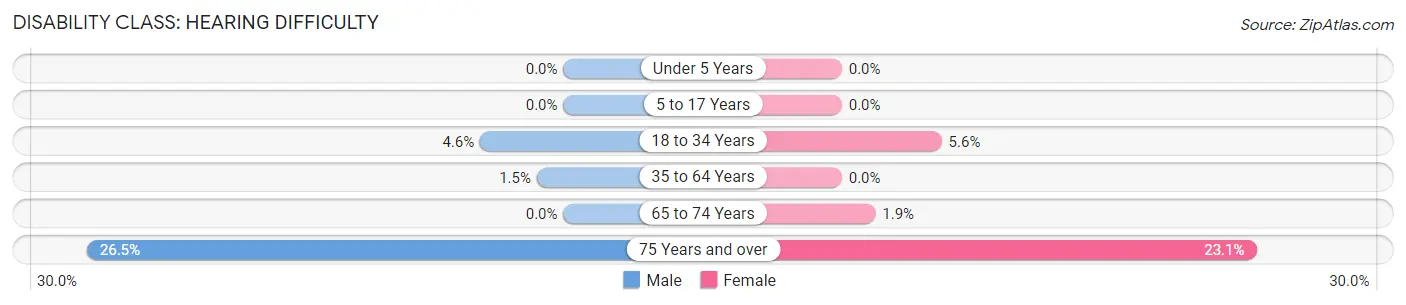
| Age Bracket | Male | Female |
| Under 5 Years | 0 (0.0%) | 0 (0.0%) |
| 5 to 17 Years | 0 (0.0%) | 0 (0.0%) |
| 18 to 34 Years | 7 (4.6%) | 8 (5.6%) |
| 35 to 64 Years | 4 (1.5%) | 0 (0.0%) |
| 65 to 74 Years | 0 (0.0%) | 2 (1.9%) |
| 75 Years and over | 13 (26.5%) | 24 (23.1%) |
Disability Class: Vision Difficulty
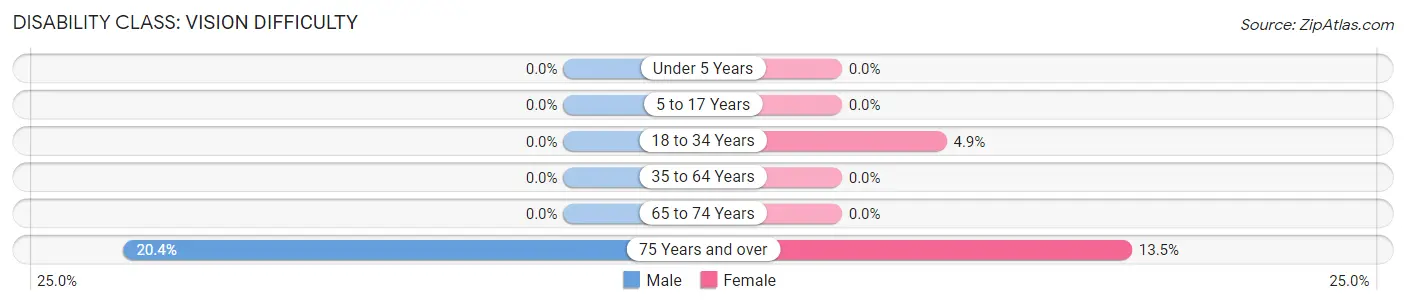
| Age Bracket | Male | Female |
| Under 5 Years | 0 (0.0%) | 0 (0.0%) |
| 5 to 17 Years | 0 (0.0%) | 0 (0.0%) |
| 18 to 34 Years | 0 (0.0%) | 7 (4.9%) |
| 35 to 64 Years | 0 (0.0%) | 0 (0.0%) |
| 65 to 74 Years | 0 (0.0%) | 0 (0.0%) |
| 75 Years and over | 10 (20.4%) | 14 (13.5%) |
Disability Class: Cognitive Difficulty
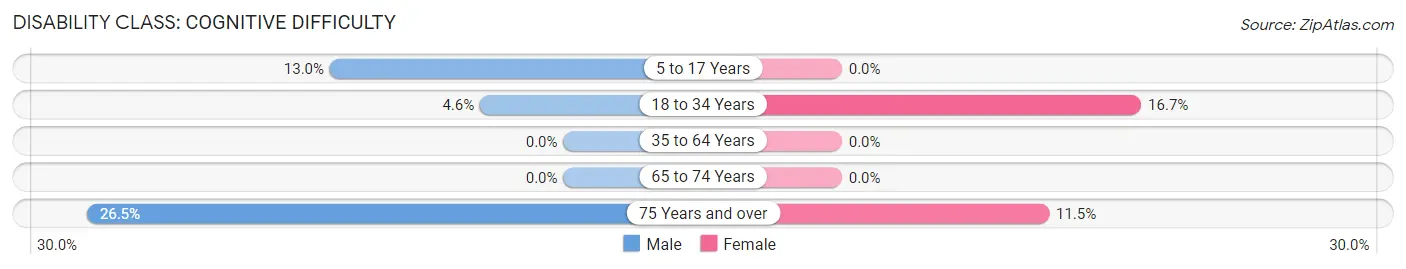
| Age Bracket | Male | Female |
| 5 to 17 Years | 13 (13.0%) | 0 (0.0%) |
| 18 to 34 Years | 7 (4.6%) | 24 (16.7%) |
| 35 to 64 Years | 0 (0.0%) | 0 (0.0%) |
| 65 to 74 Years | 0 (0.0%) | 0 (0.0%) |
| 75 Years and over | 13 (26.5%) | 12 (11.5%) |
Disability Class: Ambulatory Difficulty
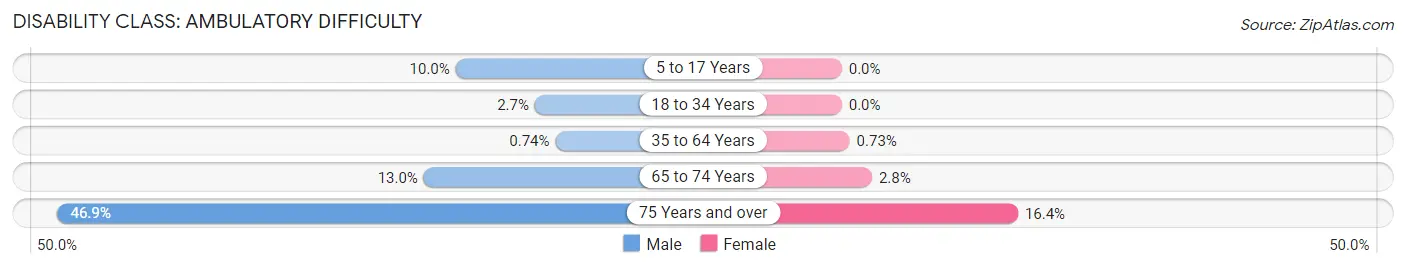
| Age Bracket | Male | Female |
| 5 to 17 Years | 10 (10.0%) | 0 (0.0%) |
| 18 to 34 Years | 4 (2.6%) | 0 (0.0%) |
| 35 to 64 Years | 2 (0.7%) | 2 (0.7%) |
| 65 to 74 Years | 7 (13.0%) | 3 (2.8%) |
| 75 Years and over | 23 (46.9%) | 17 (16.4%) |
Disability Class: Self-Care Difficulty
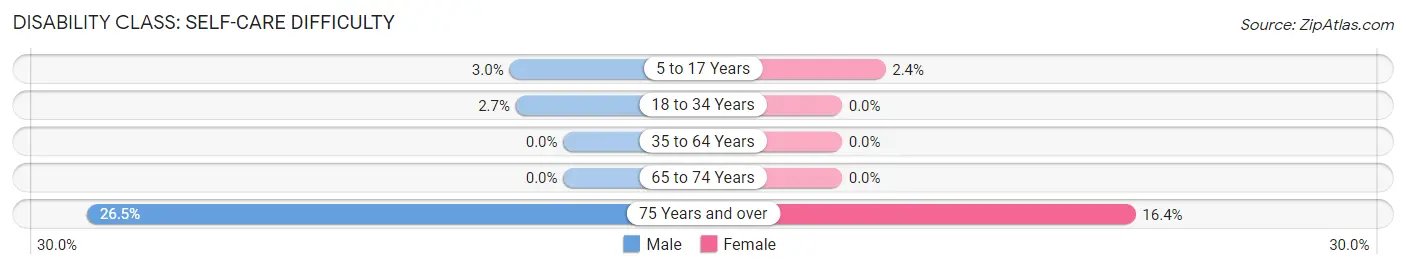
| Age Bracket | Male | Female |
| 5 to 17 Years | 3 (3.0%) | 3 (2.4%) |
| 18 to 34 Years | 4 (2.6%) | 0 (0.0%) |
| 35 to 64 Years | 0 (0.0%) | 0 (0.0%) |
| 65 to 74 Years | 0 (0.0%) | 0 (0.0%) |
| 75 Years and over | 13 (26.5%) | 17 (16.4%) |
Technology Access in Osborne
Computing Device Access in Osborne
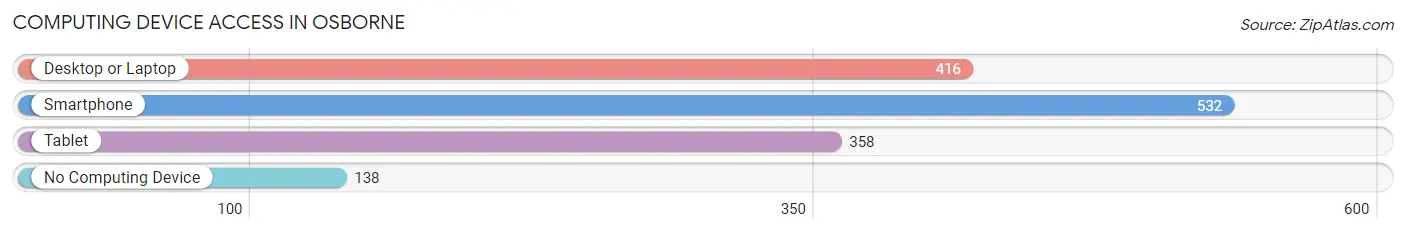
| Device Type | # Households | % Households |
| Desktop or Laptop | 416 | 58.8% |
| Smartphone | 532 | 75.2% |
| Tablet | 358 | 50.6% |
| No Computing Device | 138 | 19.5% |
| Total | 707 | 100.0% |
Internet Access in Osborne
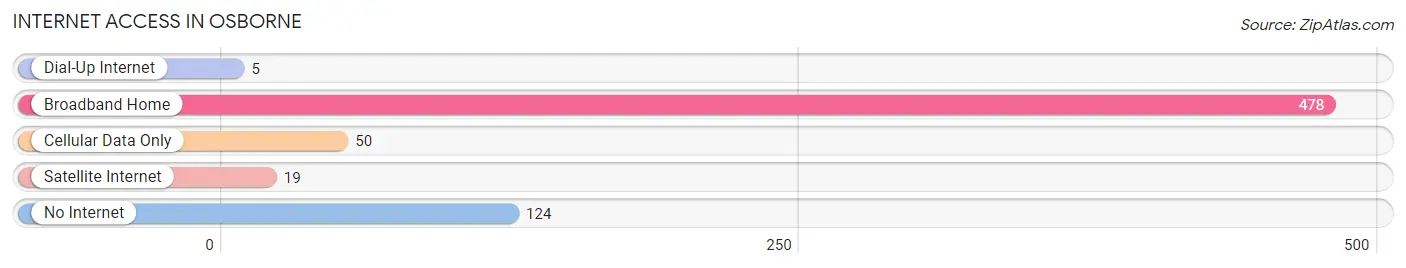
| Internet Type | # Households | % Households |
| Dial-Up Internet | 5 | 0.7% |
| Broadband Home | 478 | 67.6% |
| Cellular Data Only | 50 | 7.1% |
| Satellite Internet | 19 | 2.7% |
| No Internet | 124 | 17.5% |
| Total | 707 | 100.0% |
Osborne Summary
Osborne, Kansas is a small town located in the north-central part of the state. It is the county seat of Osborne County and is situated on the banks of the South Fork of the Solomon River. The town was founded in 1871 and has a population of 1,541 as of the 2010 census.
Osborne is located in the Smoky Hills region of Kansas, which is characterized by rolling hills and prairies. The town is situated at an elevation of 1,845 feet and is surrounded by agricultural land. The climate is semi-arid, with hot summers and cold winters.
The economy of Osborne is largely based on agriculture. The town is home to several grain elevators, as well as a feed mill and a fertilizer plant. The town also has a few small businesses, including a grocery store, a hardware store, and a few restaurants.
The demographics of Osborne are largely white, with a small Hispanic population. The median household income is $37,917, and the median age is 44. The town is home to a small Amish community, which is centered around the nearby town of Downs.
Osborne is served by the Osborne County Unified School District, which includes two elementary schools, a middle school, and a high school. The town also has a public library and a community center.
Osborne is home to several churches, including the First United Methodist Church, the First Presbyterian Church, and the First Baptist Church. The town also has a few parks, including the Osborne City Park and the Osborne County Park.
Osborne is a small town with a rich history and a strong sense of community. The town is home to a variety of businesses and organizations, and its residents are proud of their town and its history. The town is a great place to live and work, and it is a great place to raise a family.
Common Questions
What is Per Capita Income in Osborne?
Per Capita income in Osborne is $30,722.
What is the Median Family Income in Osborne?
Median Family Income in Osborne is $66,250.
What is the Median Household income in Osborne?
Median Household Income in Osborne is $46,422.
What is Income or Wage Gap in Osborne?
Income or Wage Gap in Osborne is 43.1%.
Women in Osborne earn 56.9 cents for every dollar earned by a man.
What is Family Income Deficit in Osborne?
Family Income Deficit in Osborne is $4,986.
Families that are below poverty line in Osborne earn $4,986 less on average than the poverty threshold level.
What is Inequality or Gini Index in Osborne?
Inequality or Gini Index in Osborne is 0.42.
What is the Total Population of Osborne?
Total Population of Osborne is 1,512.
What is the Total Male Population of Osborne?
Total Male Population of Osborne is 716.
What is the Total Female Population of Osborne?
Total Female Population of Osborne is 796.
What is the Ratio of Males per 100 Females in Osborne?
There are 89.95 Males per 100 Females in Osborne.
What is the Ratio of Females per 100 Males in Osborne?
There are 111.17 Females per 100 Males in Osborne.
What is the Median Population Age in Osborne?
Median Population Age in Osborne is 43.7 Years.
What is the Average Family Size in Osborne
Average Family Size in Osborne is 2.7 People.
What is the Average Household Size in Osborne
Average Household Size in Osborne is 2.1 People.
How Large is the Labor Force in Osborne?
There are 848 People in the Labor Forcein in Osborne.
What is the Percentage of People in the Labor Force in Osborne?
66.9% of People are in the Labor Force in Osborne.
What is the Unemployment Rate in Osborne?
Unemployment Rate in Osborne is 2.1%.