Newton, KS Map & Demographics
Newton Map
Newton Overview
$32,192
PER CAPITA INCOME
$77,538
AVG FAMILY INCOME
$66,528
AVG HOUSEHOLD INCOME
26.4%
WAGE / INCOME GAP [ % ]
73.6¢/ $1
WAGE / INCOME GAP [ $ ]
$6,638
FAMILY INCOME DEFICIT
0.38
INEQUALITY / GINI INDEX
18,527
TOTAL POPULATION
9,352
MALE POPULATION
9,175
FEMALE POPULATION
101.93
MALES / 100 FEMALES
98.11
FEMALES / 100 MALES
40.1
MEDIAN AGE
3.0
AVG FAMILY SIZE
2.5
AVG HOUSEHOLD SIZE
10,199
LABOR FORCE [ PEOPLE ]
69.4%
PERCENT IN LABOR FORCE
5.3%
UNEMPLOYMENT RATE
Newton Zip Codes
Income in Newton
Income Overview in Newton
Per Capita Income in Newton is $32,192, while median incomes of families and households are $77,538 and $66,528 respectively.
| Characteristic | Number | Measure |
| Per Capita Income | 18,527 | $32,192 |
| Median Family Income | 4,911 | $77,538 |
| Mean Family Income | 4,911 | $90,834 |
| Median Household Income | 7,291 | $66,528 |
| Mean Household Income | 7,291 | $79,038 |
| Income Deficit | 4,911 | $6,638 |
| Wage / Income Gap (%) | 18,527 | 26.41% |
| Wage / Income Gap ($) | 18,527 | 73.59¢ per $1 |
| Gini / Inequality Index | 18,527 | 0.38 |
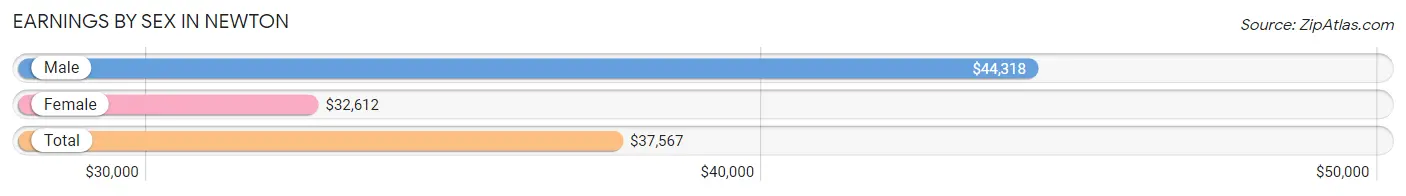
Earnings by Sex in Newton
Average Earnings in Newton are $37,567, $44,318 for men and $32,612 for women, a difference of 26.4%.
| Sex | Number | Average Earnings |
| Male | 5,518 (53.3%) | $44,318 |
| Female | 4,831 (46.7%) | $32,612 |
| Total | 10,349 (100.0%) | $37,567 |
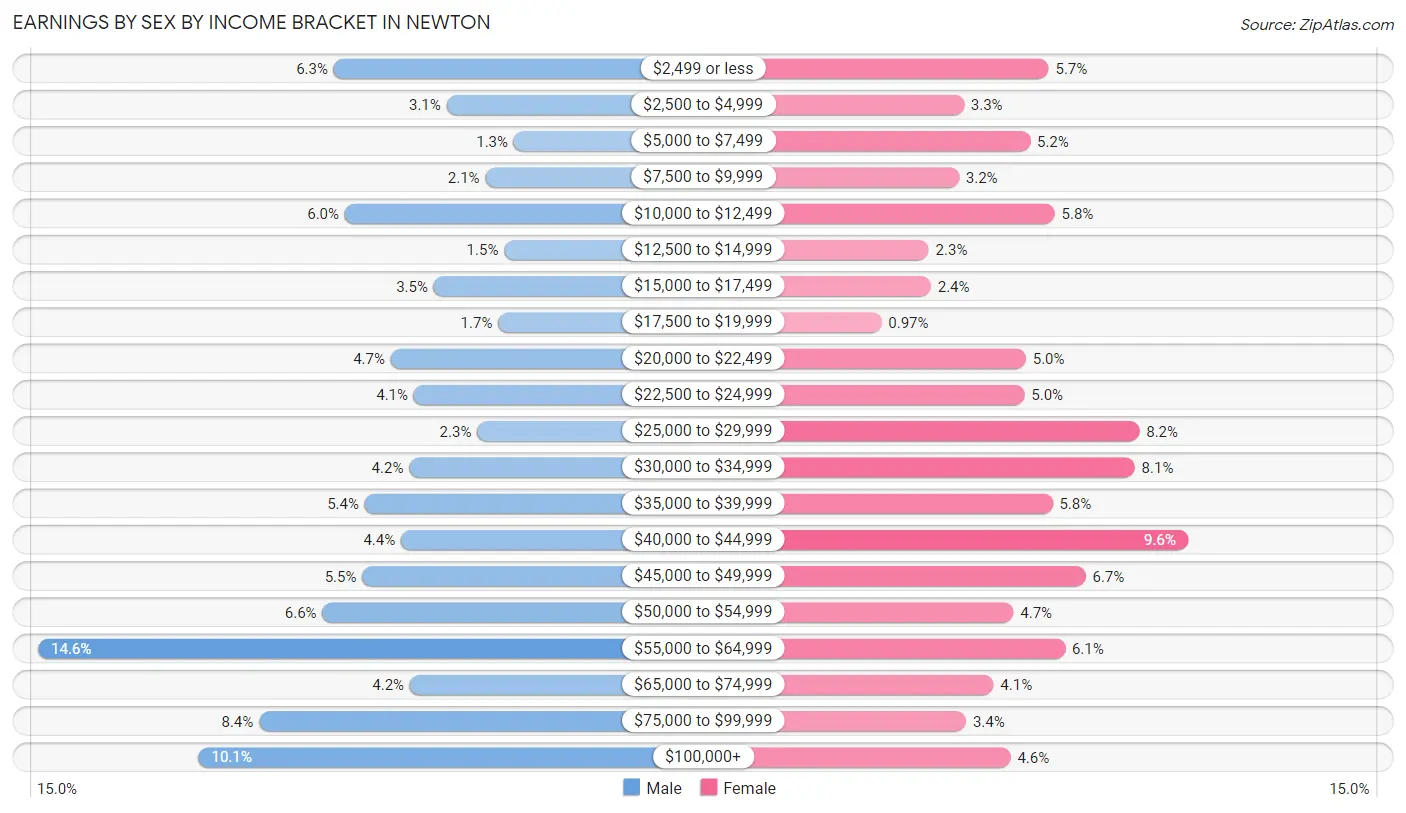
Earnings by Sex by Income Bracket in Newton
The most common earnings brackets in Newton are $55,000 to $64,999 for men (807 | 14.6%) and $40,000 to $44,999 for women (463 | 9.6%).
| Income | Male | Female |
| $2,499 or less | 348 (6.3%) | 274 (5.7%) |
| $2,500 to $4,999 | 173 (3.1%) | 159 (3.3%) |
| $5,000 to $7,499 | 69 (1.3%) | 249 (5.1%) |
| $7,500 to $9,999 | 113 (2.1%) | 152 (3.2%) |
| $10,000 to $12,499 | 331 (6.0%) | 282 (5.8%) |
| $12,500 to $14,999 | 84 (1.5%) | 111 (2.3%) |
| $15,000 to $17,499 | 193 (3.5%) | 114 (2.4%) |
| $17,500 to $19,999 | 93 (1.7%) | 47 (1.0%) |
| $20,000 to $22,499 | 260 (4.7%) | 243 (5.0%) |
| $22,500 to $24,999 | 224 (4.1%) | 241 (5.0%) |
| $25,000 to $29,999 | 126 (2.3%) | 397 (8.2%) |
| $30,000 to $34,999 | 231 (4.2%) | 391 (8.1%) |
| $35,000 to $39,999 | 300 (5.4%) | 279 (5.8%) |
| $40,000 to $44,999 | 244 (4.4%) | 463 (9.6%) |
| $45,000 to $49,999 | 304 (5.5%) | 324 (6.7%) |
| $50,000 to $54,999 | 366 (6.6%) | 226 (4.7%) |
| $55,000 to $64,999 | 807 (14.6%) | 296 (6.1%) |
| $65,000 to $74,999 | 230 (4.2%) | 199 (4.1%) |
| $75,000 to $99,999 | 464 (8.4%) | 162 (3.4%) |
| $100,000+ | 558 (10.1%) | 222 (4.6%) |
| Total | 5,518 (100.0%) | 4,831 (100.0%) |
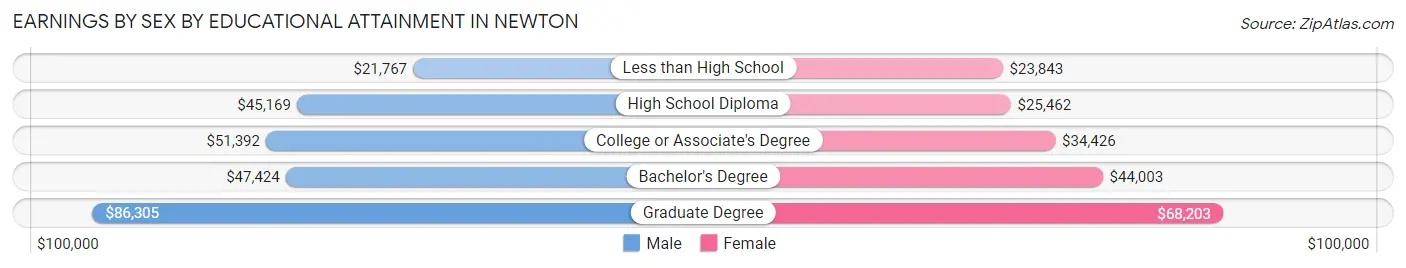
Earnings by Sex by Educational Attainment in Newton
Average earnings in Newton are $47,311 for men and $34,854 for women, a difference of 26.3%. Men with an educational attainment of graduate degree enjoy the highest average annual earnings of $86,305, while those with less than high school education earn the least with $21,767. Women with an educational attainment of graduate degree earn the most with the average annual earnings of $68,203, while those with less than high school education have the smallest earnings of $23,843.
| Educational Attainment | Male Income | Female Income |
| Less than High School | $21,767 | $23,843 |
| High School Diploma | $45,169 | $25,462 |
| College or Associate's Degree | $51,392 | $34,426 |
| Bachelor's Degree | $47,424 | $44,003 |
| Graduate Degree | $86,305 | $68,203 |
| Total | $47,311 | $34,854 |
Family Income in Newton
Family Income Brackets in Newton
According to the Newton family income data, there are 1,223 families falling into the $50,000 to $74,999 income range, which is the most common income bracket and makes up 24.9% of all families. Conversely, the $10,000 to $14,999 income bracket is the least frequent group with only 34 families (0.7%) belonging to this category.
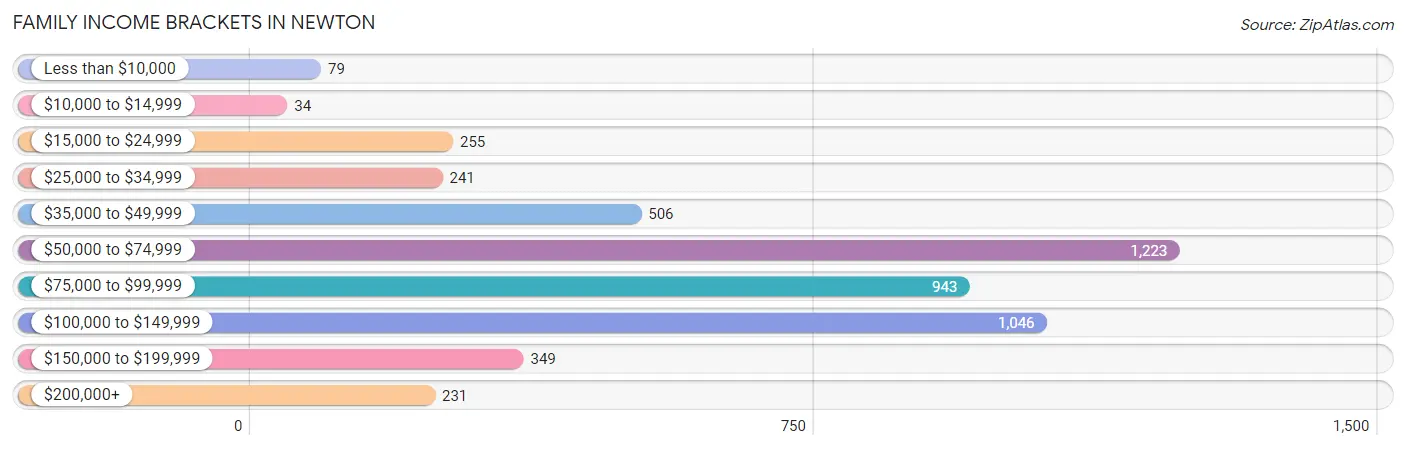
| Income Bracket | # Families | % Families |
| Less than $10,000 | 79 | 1.6% |
| $10,000 to $14,999 | 34 | 0.7% |
| $15,000 to $24,999 | 255 | 5.2% |
| $25,000 to $34,999 | 241 | 4.9% |
| $35,000 to $49,999 | 506 | 10.3% |
| $50,000 to $74,999 | 1,223 | 24.9% |
| $75,000 to $99,999 | 943 | 19.2% |
| $100,000 to $149,999 | 1,046 | 21.3% |
| $150,000 to $199,999 | 349 | 7.1% |
| $200,000+ | 231 | 4.7% |
Family Income by Famaliy Size in Newton
5-person families (392 | 8.0%) account for the highest median family income in Newton with $103,108 per family, while 2-person families (2,363 | 48.1%) have the highest median income of $35,352 per family member.
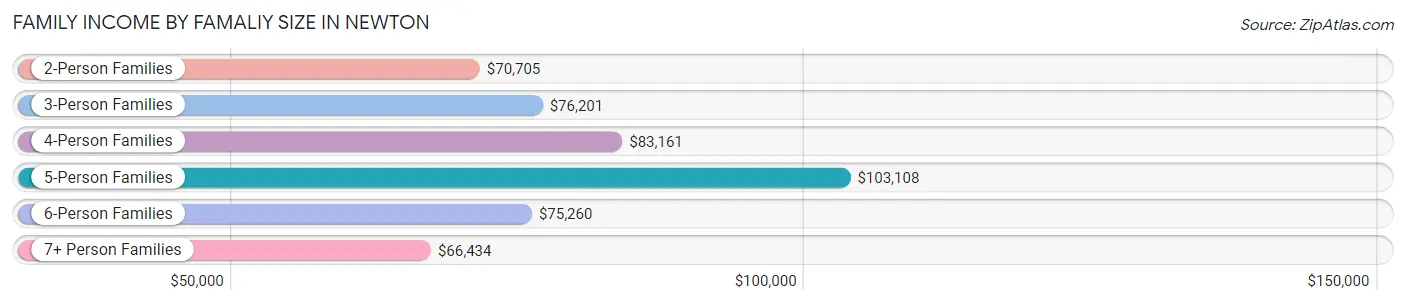
| Income Bracket | # Families | Median Income |
| 2-Person Families | 2,363 (48.1%) | $70,705 |
| 3-Person Families | 1,108 (22.6%) | $76,201 |
| 4-Person Families | 850 (17.3%) | $83,161 |
| 5-Person Families | 392 (8.0%) | $103,108 |
| 6-Person Families | 81 (1.7%) | $75,260 |
| 7+ Person Families | 117 (2.4%) | $66,434 |
| Total | 4,911 (100.0%) | $77,538 |
Family Income by Number of Earners in Newton
The median family income in Newton is $77,538, with families comprising 3+ earners (432) having the highest median family income of $142,794, while families with no earners (522) have the lowest median family income of $62,857, accounting for 8.8% and 10.6% of families, respectively.
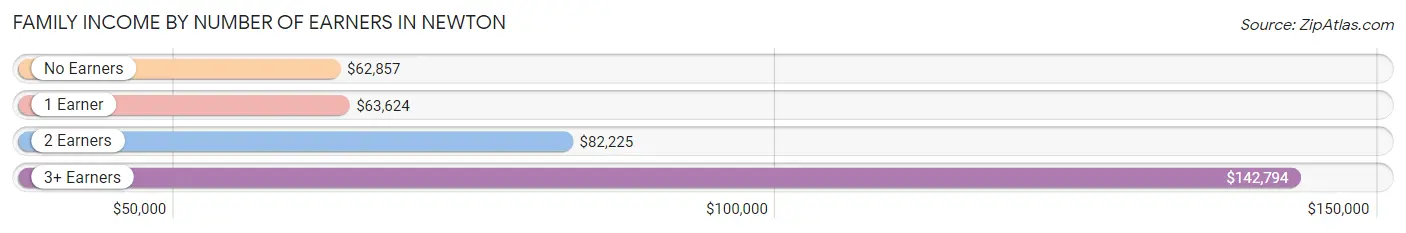
| Number of Earners | # Families | Median Income |
| No Earners | 522 (10.6%) | $62,857 |
| 1 Earner | 1,572 (32.0%) | $63,624 |
| 2 Earners | 2,385 (48.6%) | $82,225 |
| 3+ Earners | 432 (8.8%) | $142,794 |
| Total | 4,911 (100.0%) | $77,538 |
Household Income in Newton
Household Income Brackets in Newton
With 1,422 households falling in the category, the $50,000 to $74,999 income range is the most frequent in Newton, accounting for 19.5% of all households. In contrast, only 131 households (1.8%) fall into the less than $10,000 income bracket, making it the least populous group.
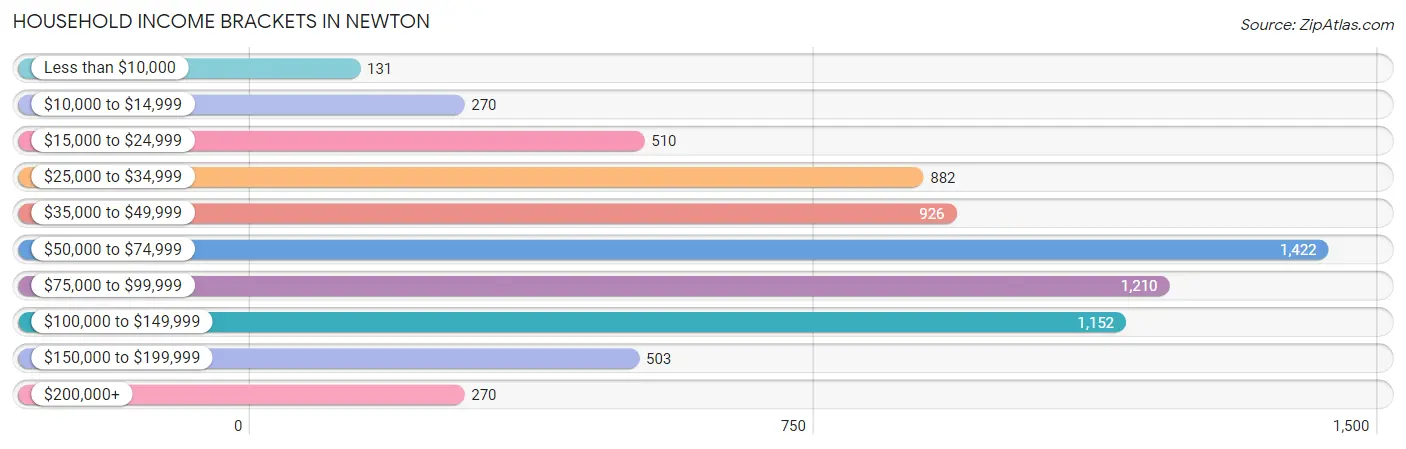
| Income Bracket | # Households | % Households |
| Less than $10,000 | 131 | 1.8% |
| $10,000 to $14,999 | 270 | 3.7% |
| $15,000 to $24,999 | 510 | 7.0% |
| $25,000 to $34,999 | 882 | 12.1% |
| $35,000 to $49,999 | 926 | 12.7% |
| $50,000 to $74,999 | 1,422 | 19.5% |
| $75,000 to $99,999 | 1,210 | 16.6% |
| $100,000 to $149,999 | 1,152 | 15.8% |
| $150,000 to $199,999 | 503 | 6.9% |
| $200,000+ | 270 | 3.7% |
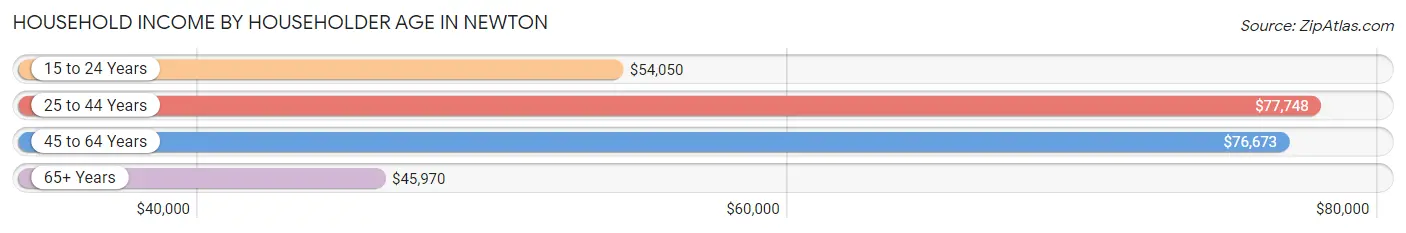
Household Income by Householder Age in Newton
The median household income in Newton is $66,528, with the highest median household income of $77,748 found in the 25 to 44 years age bracket for the primary householder. A total of 2,282 households (31.3%) fall into this category. Meanwhile, the 65+ years age bracket for the primary householder has the lowest median household income of $45,970, with 2,001 households (27.4%) in this group.
| Income Bracket | # Households | Median Income |
| 15 to 24 Years | 455 (6.2%) | $54,050 |
| 25 to 44 Years | 2,282 (31.3%) | $77,748 |
| 45 to 64 Years | 2,553 (35.0%) | $76,673 |
| 65+ Years | 2,001 (27.4%) | $45,970 |
| Total | 7,291 (100.0%) | $66,528 |
Poverty in Newton
Income Below Poverty by Sex and Age in Newton
With 9.1% poverty level for males and 14.4% for females among the residents of Newton, 5 year old males and 15 year old females are the most vulnerable to poverty, with 30 males (23.8%) and 131 females (55.3%) in their respective age groups living below the poverty level.
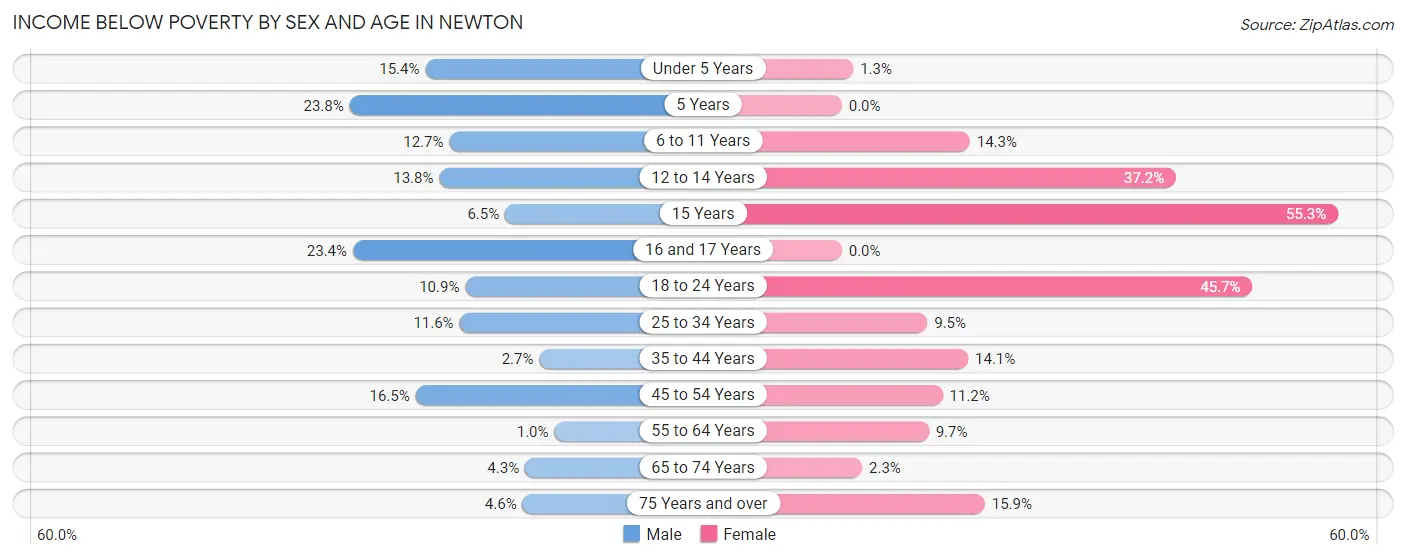
| Age Bracket | Male | Female |
| Under 5 Years | 79 (15.4%) | 7 (1.3%) |
| 5 Years | 30 (23.8%) | 0 (0.0%) |
| 6 to 11 Years | 81 (12.7%) | 79 (14.3%) |
| 12 to 14 Years | 64 (13.8%) | 131 (37.2%) |
| 15 Years | 17 (6.5%) | 131 (55.3%) |
| 16 and 17 Years | 30 (23.4%) | 0 (0.0%) |
| 18 to 24 Years | 88 (10.9%) | 305 (45.7%) |
| 25 to 34 Years | 160 (11.6%) | 106 (9.5%) |
| 35 to 44 Years | 29 (2.7%) | 159 (14.1%) |
| 45 to 54 Years | 182 (16.5%) | 129 (11.2%) |
| 55 to 64 Years | 12 (1.0%) | 126 (9.7%) |
| 65 to 74 Years | 33 (4.3%) | 24 (2.3%) |
| 75 Years and over | 32 (4.5%) | 98 (15.9%) |
| Total | 837 (9.1%) | 1,295 (14.4%) |
Income Above Poverty by Sex and Age in Newton
According to the poverty statistics in Newton, males aged 55 to 64 years and females aged 5 years are the age groups that are most secure financially, with 99.0% of males and 100.0% of females in these age groups living above the poverty line.
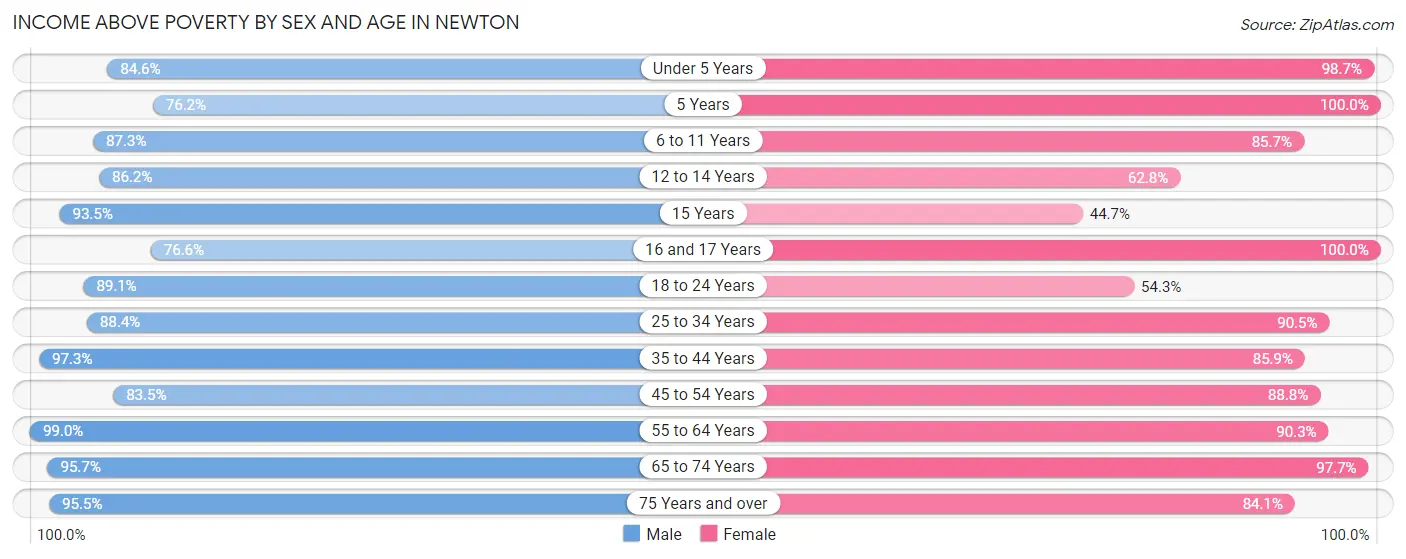
| Age Bracket | Male | Female |
| Under 5 Years | 435 (84.6%) | 543 (98.7%) |
| 5 Years | 96 (76.2%) | 89 (100.0%) |
| 6 to 11 Years | 557 (87.3%) | 475 (85.7%) |
| 12 to 14 Years | 399 (86.2%) | 221 (62.8%) |
| 15 Years | 245 (93.5%) | 106 (44.7%) |
| 16 and 17 Years | 98 (76.6%) | 180 (100.0%) |
| 18 to 24 Years | 717 (89.1%) | 362 (54.3%) |
| 25 to 34 Years | 1,223 (88.4%) | 1,007 (90.5%) |
| 35 to 44 Years | 1,052 (97.3%) | 971 (85.9%) |
| 45 to 54 Years | 924 (83.5%) | 1,020 (88.8%) |
| 55 to 64 Years | 1,187 (99.0%) | 1,175 (90.3%) |
| 65 to 74 Years | 740 (95.7%) | 1,039 (97.7%) |
| 75 Years and over | 671 (95.5%) | 517 (84.1%) |
| Total | 8,344 (90.9%) | 7,705 (85.6%) |
Income Below Poverty Among Married-Couple Families in Newton
The poverty statistics for married-couple families in Newton show that 3.5% or 124 of the total 3,569 families live below the poverty line. Families with 5 or more children have the highest poverty rate of 47.0%, comprising of 39 families. On the other hand, families with 3 or 4 children have the lowest poverty rate of 0.0%, which includes 0 families.
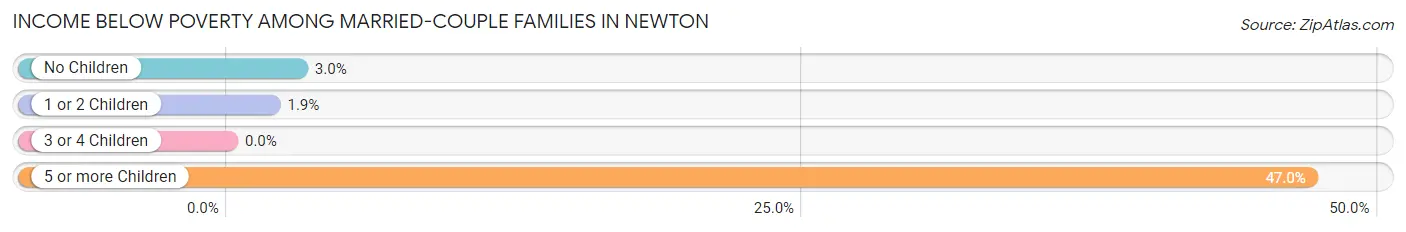
| Children | Above Poverty | Below Poverty |
| No Children | 2,070 (97.0%) | 65 (3.0%) |
| 1 or 2 Children | 1,064 (98.2%) | 20 (1.8%) |
| 3 or 4 Children | 267 (100.0%) | 0 (0.0%) |
| 5 or more Children | 44 (53.0%) | 39 (47.0%) |
| Total | 3,445 (96.5%) | 124 (3.5%) |
Income Below Poverty Among Single-Parent Households in Newton
According to the poverty data in Newton, 10.8% or 46 single-father households and 20.7% or 190 single-mother households are living below the poverty line. Among single-father households, those with 1 or 2 children have the highest poverty rate, with 34 households (22.1%) experiencing poverty. Likewise, among single-mother households, those with no children have the highest poverty rate, with 74 households (25.2%) falling below the poverty line.
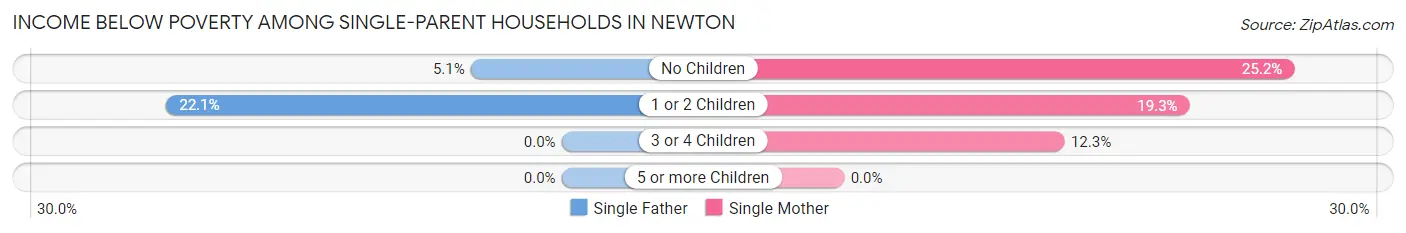
| Children | Single Father | Single Mother |
| No Children | 12 (5.1%) | 74 (25.2%) |
| 1 or 2 Children | 34 (22.1%) | 108 (19.3%) |
| 3 or 4 Children | 0 (0.0%) | 8 (12.3%) |
| 5 or more Children | 0 (0.0%) | 0 (0.0%) |
| Total | 46 (10.8%) | 190 (20.7%) |
Income Below Poverty Among Married-Couple vs Single-Parent Households in Newton
The poverty data for Newton shows that 124 of the married-couple family households (3.5%) and 236 of the single-parent households (17.6%) are living below the poverty level. Within the married-couple family households, those with 5 or more children have the highest poverty rate, with 39 households (47.0%) falling below the poverty line. Among the single-parent households, those with 1 or 2 children have the highest poverty rate, with 142 household (19.9%) living below poverty.
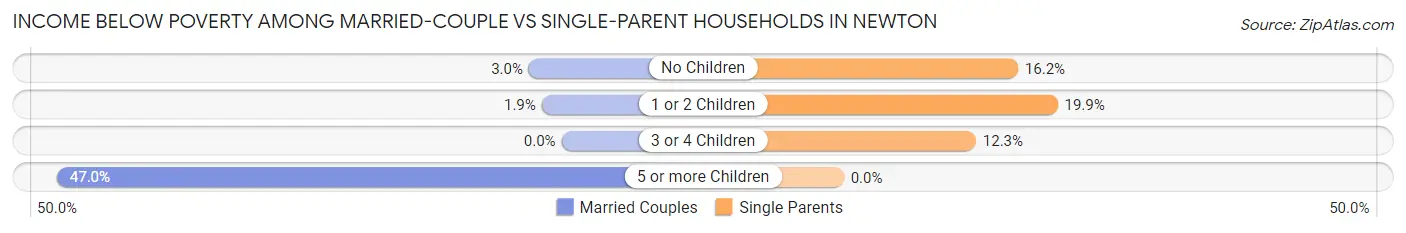
| Children | Married-Couple Families | Single-Parent Households |
| No Children | 65 (3.0%) | 86 (16.2%) |
| 1 or 2 Children | 20 (1.8%) | 142 (19.9%) |
| 3 or 4 Children | 0 (0.0%) | 8 (12.3%) |
| 5 or more Children | 39 (47.0%) | 0 (0.0%) |
| Total | 124 (3.5%) | 236 (17.6%) |
Race in Newton
The most populous races in Newton are White / Caucasian (14,887 | 80.3%), Hispanic or Latino (3,621 | 19.5%), and Two or more Races (2,022 | 10.9%).
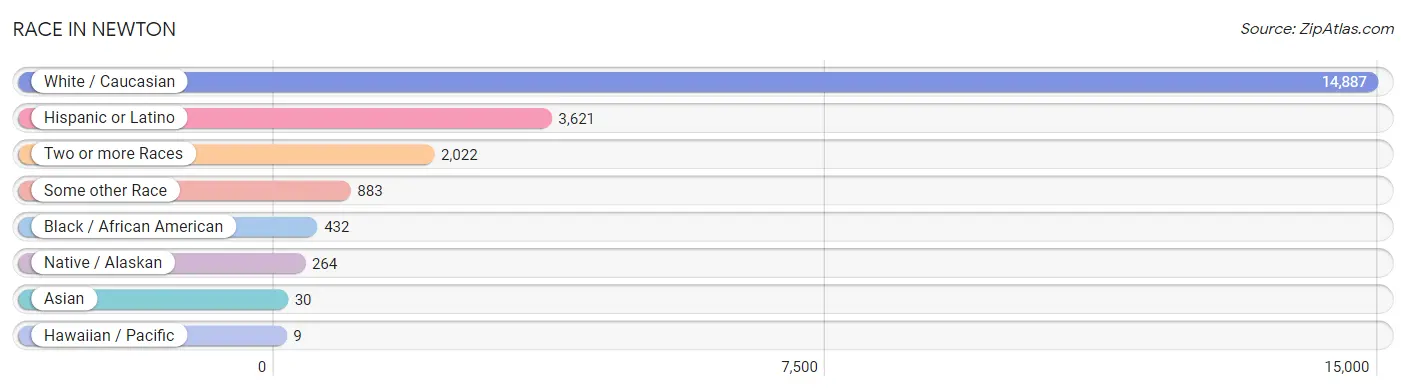
| Race | # Population | % Population |
| Asian | 30 | 0.2% |
| Black / African American | 432 | 2.3% |
| Hawaiian / Pacific | 9 | 0.1% |
| Hispanic or Latino | 3,621 | 19.5% |
| Native / Alaskan | 264 | 1.4% |
| White / Caucasian | 14,887 | 80.3% |
| Two or more Races | 2,022 | 10.9% |
| Some other Race | 883 | 4.8% |
| Total | 18,527 | 100.0% |
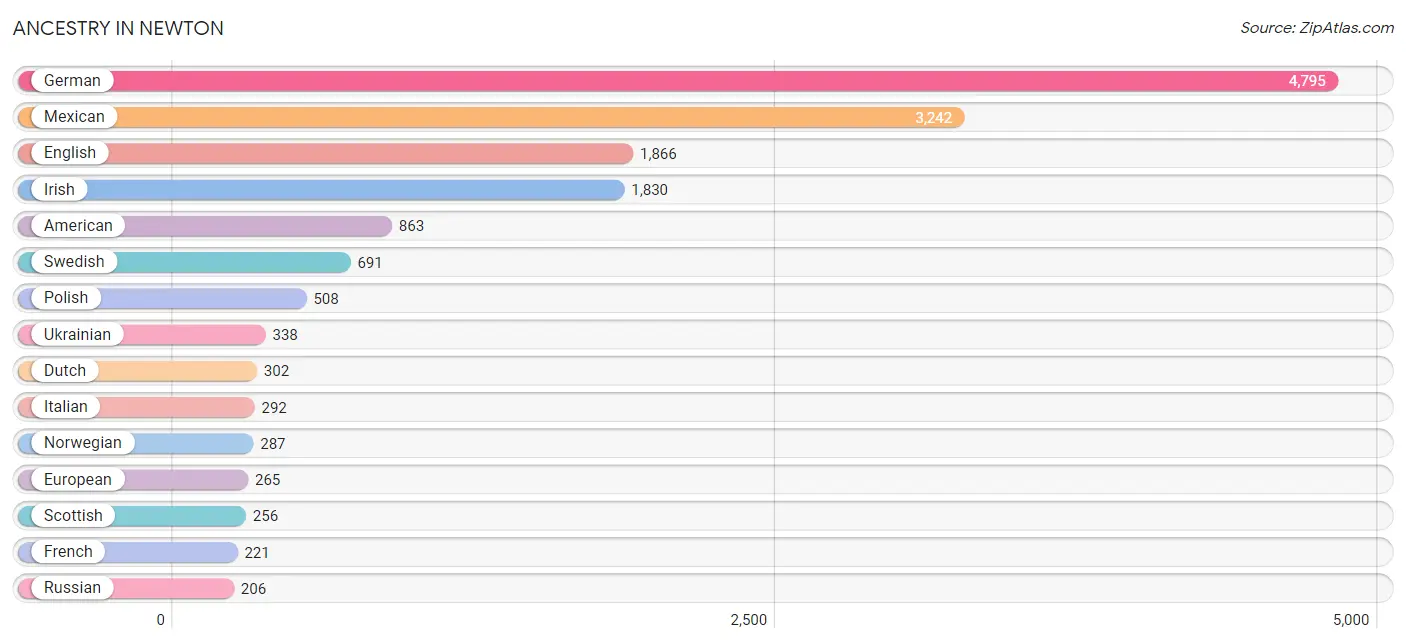
Ancestry in Newton
The most populous ancestries reported in Newton are German (4,795 | 25.9%), Mexican (3,242 | 17.5%), English (1,866 | 10.1%), Irish (1,830 | 9.9%), and American (863 | 4.7%), together accounting for 68.0% of all Newton residents.
| Ancestry | # Population | % Population |
| African | 9 | 0.1% |
| American | 863 | 4.7% |
| Argentinean | 61 | 0.3% |
| Austrian | 6 | 0.0% |
| Belgian | 15 | 0.1% |
| Bhutanese | 120 | 0.6% |
| Blackfeet | 6 | 0.0% |
| British | 54 | 0.3% |
| Cajun | 25 | 0.1% |
| Central American | 34 | 0.2% |
| Central American Indian | 22 | 0.1% |
| Cherokee | 148 | 0.8% |
| Choctaw | 152 | 0.8% |
| Cuban | 48 | 0.3% |
| Czech | 32 | 0.2% |
| Czechoslovakian | 55 | 0.3% |
| Danish | 31 | 0.2% |
| Dutch | 302 | 1.6% |
| Eastern European | 132 | 0.7% |
| Ecuadorian | 19 | 0.1% |
| English | 1,866 | 10.1% |
| European | 265 | 1.4% |
| Finnish | 58 | 0.3% |
| French | 221 | 1.2% |
| German | 4,795 | 25.9% |
| Greek | 15 | 0.1% |
| Guatemalan | 34 | 0.2% |
| Hungarian | 6 | 0.0% |
| Indonesian | 2 | 0.0% |
| Irish | 1,830 | 9.9% |
| Italian | 292 | 1.6% |
| Korean | 28 | 0.2% |
| Mexican | 3,242 | 17.5% |
| Mexican American Indian | 76 | 0.4% |
| Native Hawaiian | 9 | 0.1% |
| Navajo | 3 | 0.0% |
| Northern European | 95 | 0.5% |
| Norwegian | 287 | 1.5% |
| Pakistani | 113 | 0.6% |
| Pennsylvania German | 19 | 0.1% |
| Polish | 508 | 2.7% |
| Puerto Rican | 79 | 0.4% |
| Russian | 206 | 1.1% |
| Scandinavian | 36 | 0.2% |
| Scotch-Irish | 55 | 0.3% |
| Scottish | 256 | 1.4% |
| South American | 80 | 0.4% |
| Spaniard | 29 | 0.2% |
| Spanish | 62 | 0.3% |
| Sri Lankan | 113 | 0.6% |
| Subsaharan African | 9 | 0.1% |
| Swedish | 691 | 3.7% |
| Swiss | 126 | 0.7% |
| Ukrainian | 338 | 1.8% |
| Welsh | 44 | 0.2% | View All 55 Rows |
Immigrants in Newton
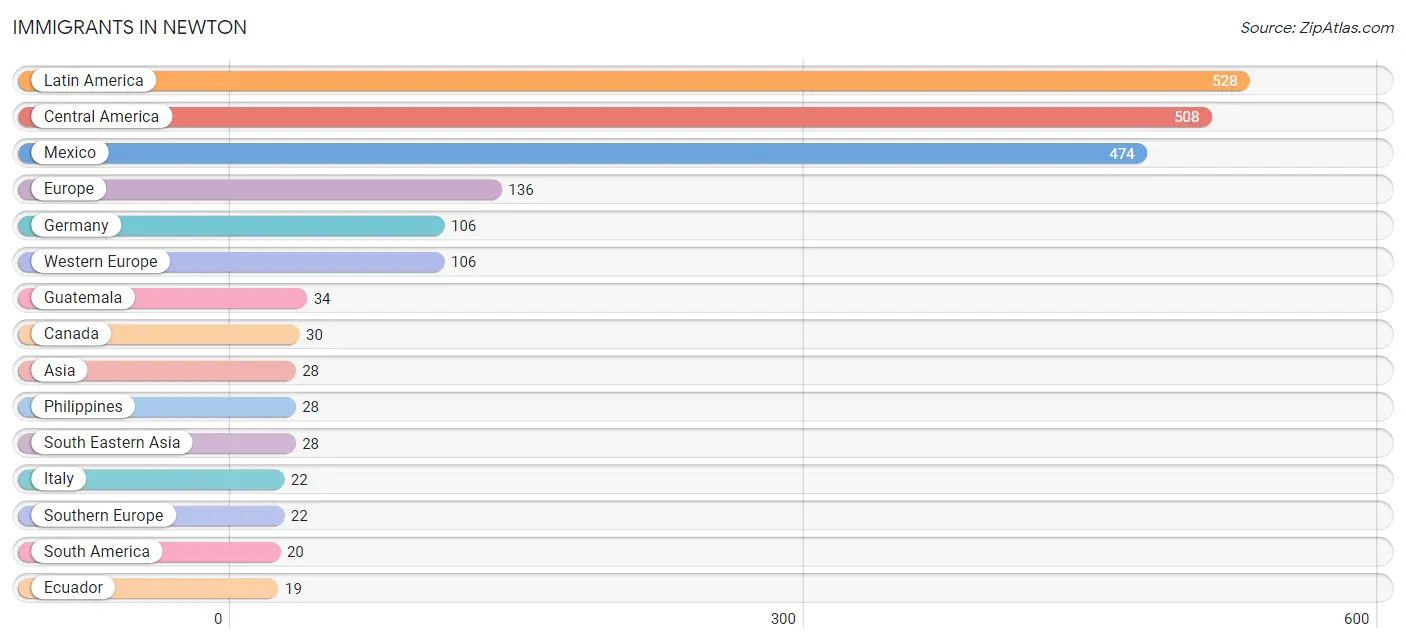
The most numerous immigrant groups reported in Newton came from Latin America (528 | 2.9%), Central America (508 | 2.7%), Mexico (474 | 2.6%), Europe (136 | 0.7%), and Germany (106 | 0.6%), together accounting for 9.5% of all Newton residents.
| Immigration Origin | # Population | % Population |
| Argentina | 1 | 0.0% |
| Asia | 28 | 0.2% |
| Canada | 30 | 0.2% |
| Central America | 508 | 2.7% |
| Ecuador | 19 | 0.1% |
| England | 8 | 0.0% |
| Europe | 136 | 0.7% |
| Germany | 106 | 0.6% |
| Guatemala | 34 | 0.2% |
| Italy | 22 | 0.1% |
| Latin America | 528 | 2.9% |
| Mexico | 474 | 2.6% |
| Northern Europe | 8 | 0.0% |
| Philippines | 28 | 0.2% |
| South America | 20 | 0.1% |
| South Eastern Asia | 28 | 0.2% |
| Southern Europe | 22 | 0.1% |
| Western Europe | 106 | 0.6% | View All 18 Rows |
Sex and Age in Newton
Sex and Age in Newton
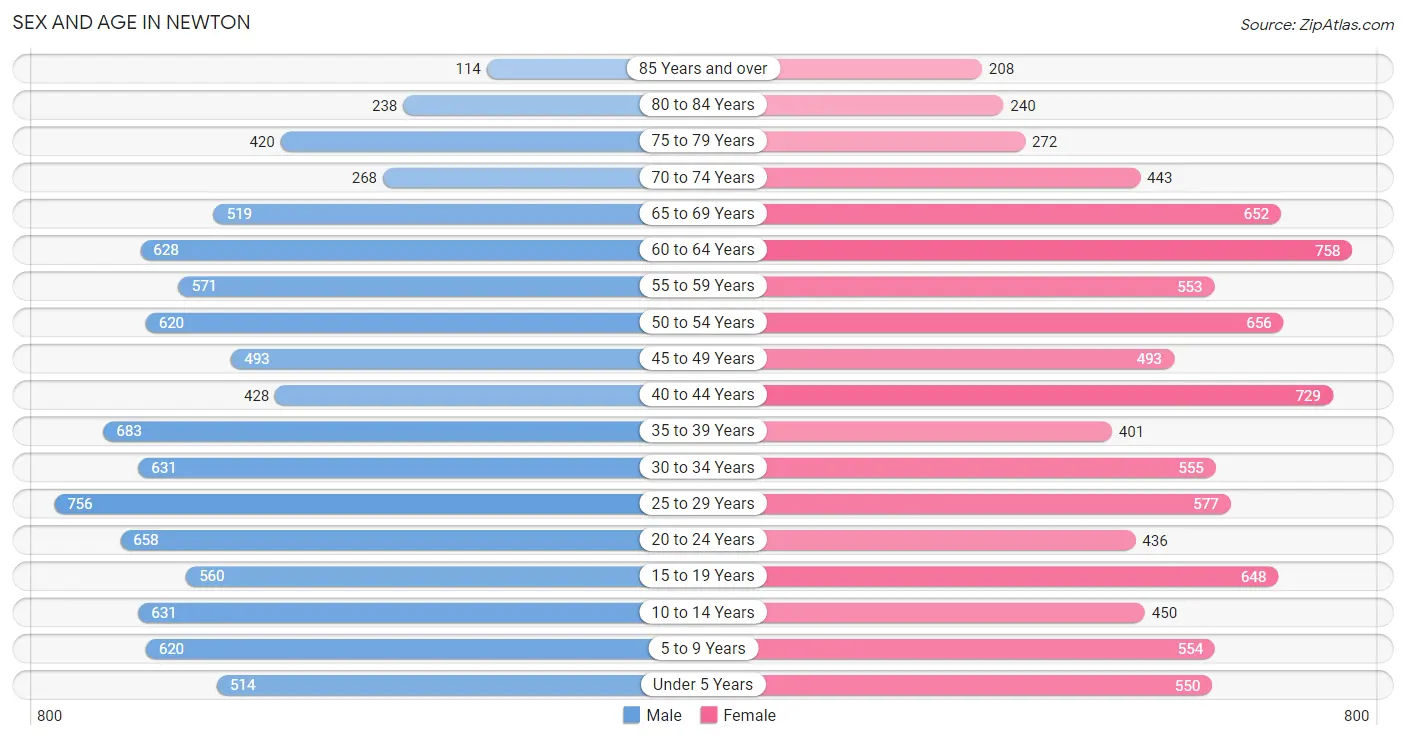
The most populous age groups in Newton are 25 to 29 Years (756 | 8.1%) for men and 60 to 64 Years (758 | 8.3%) for women.
| Age Bracket | Male | Female |
| Under 5 Years | 514 (5.5%) | 550 (6.0%) |
| 5 to 9 Years | 620 (6.6%) | 554 (6.0%) |
| 10 to 14 Years | 631 (6.8%) | 450 (4.9%) |
| 15 to 19 Years | 560 (6.0%) | 648 (7.1%) |
| 20 to 24 Years | 658 (7.0%) | 436 (4.8%) |
| 25 to 29 Years | 756 (8.1%) | 577 (6.3%) |
| 30 to 34 Years | 631 (6.8%) | 555 (6.0%) |
| 35 to 39 Years | 683 (7.3%) | 401 (4.4%) |
| 40 to 44 Years | 428 (4.6%) | 729 (8.0%) |
| 45 to 49 Years | 493 (5.3%) | 493 (5.4%) |
| 50 to 54 Years | 620 (6.6%) | 656 (7.1%) |
| 55 to 59 Years | 571 (6.1%) | 553 (6.0%) |
| 60 to 64 Years | 628 (6.7%) | 758 (8.3%) |
| 65 to 69 Years | 519 (5.6%) | 652 (7.1%) |
| 70 to 74 Years | 268 (2.9%) | 443 (4.8%) |
| 75 to 79 Years | 420 (4.5%) | 272 (3.0%) |
| 80 to 84 Years | 238 (2.5%) | 240 (2.6%) |
| 85 Years and over | 114 (1.2%) | 208 (2.3%) |
| Total | 9,352 (100.0%) | 9,175 (100.0%) |
Families and Households in Newton
Median Family Size in Newton
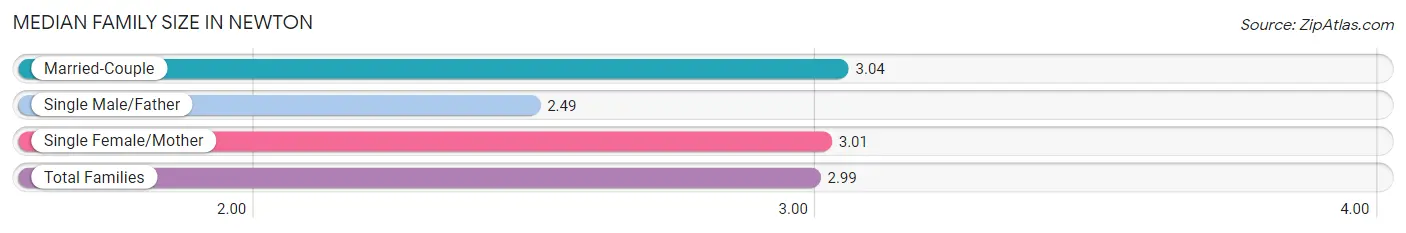
The median family size in Newton is 2.99 persons per family, with married-couple families (3,569 | 72.7%) accounting for the largest median family size of 3.04 persons per family. On the other hand, single male/father families (424 | 8.6%) represent the smallest median family size with 2.49 persons per family.
| Family Type | # Families | Family Size |
| Married-Couple | 3,569 (72.7%) | 3.04 |
| Single Male/Father | 424 (8.6%) | 2.49 |
| Single Female/Mother | 918 (18.7%) | 3.01 |
| Total Families | 4,911 (100.0%) | 2.99 |
Median Household Size in Newton
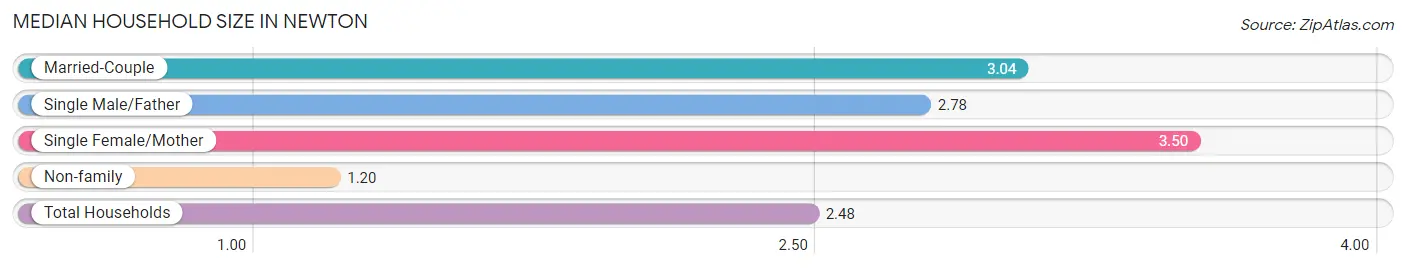
The median household size in Newton is 2.48 persons per household, with single female/mother households (918 | 12.6%) accounting for the largest median household size of 3.5 persons per household. non-family households (2,380 | 32.6%) represent the smallest median household size with 1.20 persons per household.
| Household Type | # Households | Household Size |
| Married-Couple | 3,569 (48.9%) | 3.04 |
| Single Male/Father | 424 (5.8%) | 2.78 |
| Single Female/Mother | 918 (12.6%) | 3.50 |
| Non-family | 2,380 (32.6%) | 1.20 |
| Total Households | 7,291 (100.0%) | 2.48 |
Household Size by Marriage Status in Newton
Out of a total of 7,291 households in Newton, 4,911 (67.4%) are family households, while 2,380 (32.6%) are nonfamily households. The most numerous type of family households are 2-person households, comprising 2,183, and the most common type of nonfamily households are 1-person households, comprising 1,942.
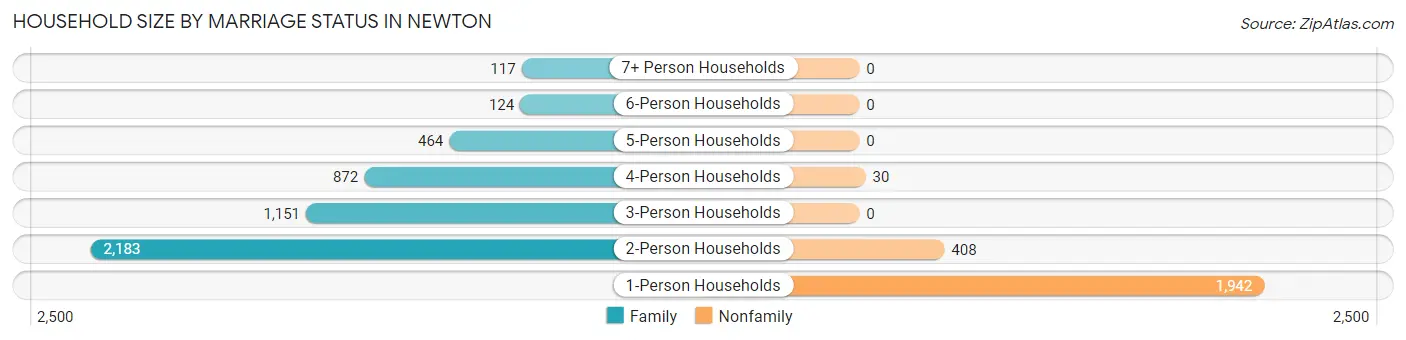
| Household Size | Family Households | Nonfamily Households |
| 1-Person Households | - | 1,942 (26.6%) |
| 2-Person Households | 2,183 (29.9%) | 408 (5.6%) |
| 3-Person Households | 1,151 (15.8%) | 0 (0.0%) |
| 4-Person Households | 872 (12.0%) | 30 (0.4%) |
| 5-Person Households | 464 (6.4%) | 0 (0.0%) |
| 6-Person Households | 124 (1.7%) | 0 (0.0%) |
| 7+ Person Households | 117 (1.6%) | 0 (0.0%) |
| Total | 4,911 (67.4%) | 2,380 (32.6%) |
Female Fertility in Newton
Fertility by Age in Newton
Average fertility rate in Newton is 98.0 births per 1,000 women. Women in the age bracket of 20 to 34 years have the highest fertility rate with 249.0 births per 1,000 women. Women in the age bracket of 20 to 34 years acount for 100.0% of all women with births.
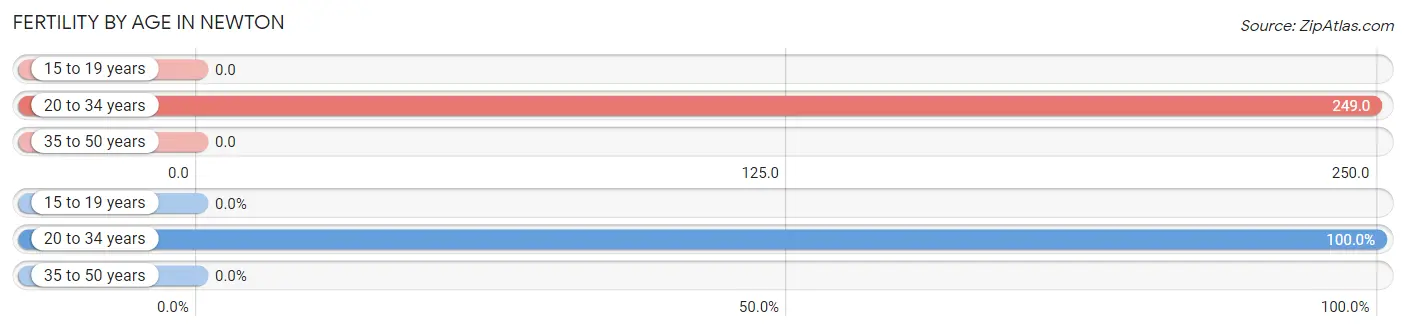
| Age Bracket | Women with Births | Births / 1,000 Women |
| 15 to 19 years | 0 (0.0%) | 0.0 |
| 20 to 34 years | 390 (100.0%) | 249.0 |
| 35 to 50 years | 0 (0.0%) | 0.0 |
| Total | 390 (100.0%) | 98.0 |
Fertility by Age by Marriage Status in Newton
78.2% of women with births (390) in Newton are married. The highest percentage of unmarried women with births falls into 20 to 34 years age bracket with 21.8% of them unmarried at the time of birth, while the lowest percentage of unmarried women with births belong to 20 to 34 years age bracket with 21.8% of them unmarried.
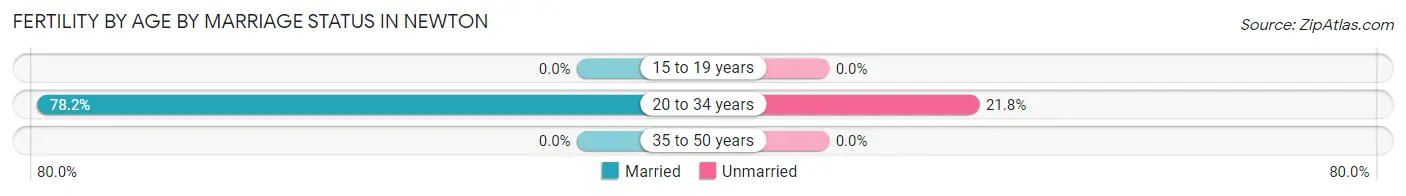
| Age Bracket | Married | Unmarried |
| 15 to 19 years | 0 (0.0%) | 0 (0.0%) |
| 20 to 34 years | 305 (78.2%) | 85 (21.8%) |
| 35 to 50 years | 0 (0.0%) | 0 (0.0%) |
| Total | 305 (78.2%) | 85 (21.8%) |
Fertility by Education in Newton
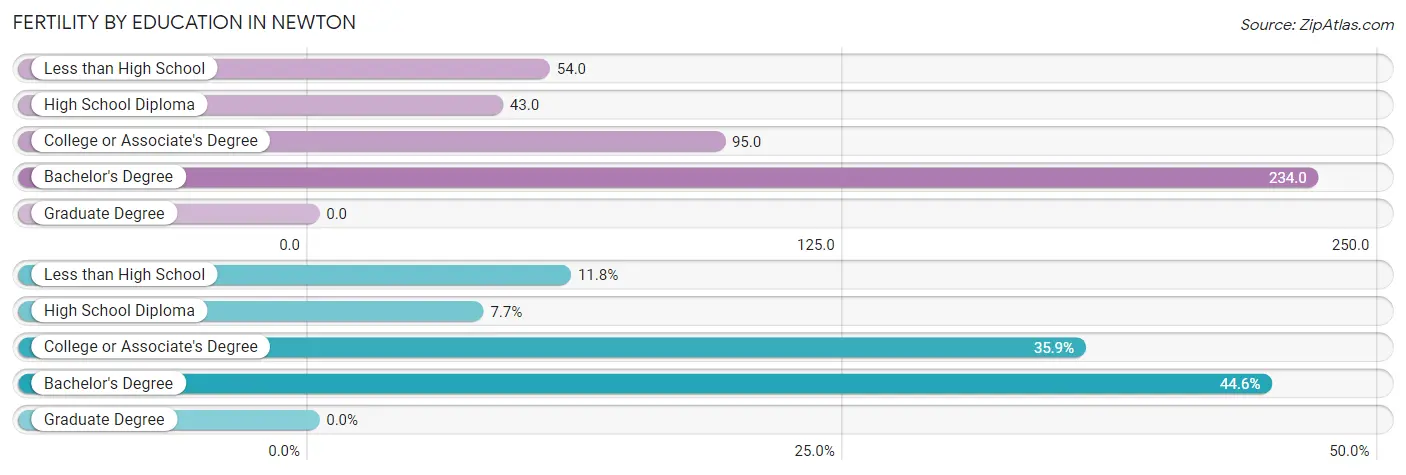
| Educational Attainment | Women with Births | Births / 1,000 Women |
| Less than High School | 46 (11.8%) | 54.0 |
| High School Diploma | 30 (7.7%) | 43.0 |
| College or Associate's Degree | 140 (35.9%) | 95.0 |
| Bachelor's Degree | 174 (44.6%) | 234.0 |
| Graduate Degree | 0 (0.0%) | 0.0 |
| Total | 390 (100.0%) | 98.0 |
Fertility by Education by Marriage Status in Newton
21.8% of women with births in Newton are unmarried. Women with the educational attainment of bachelor's degree are most likely to be married with 100.0% of them married at childbirth, while women with the educational attainment of less than high school are least likely to be married with 100.0% of them unmarried at childbirth.
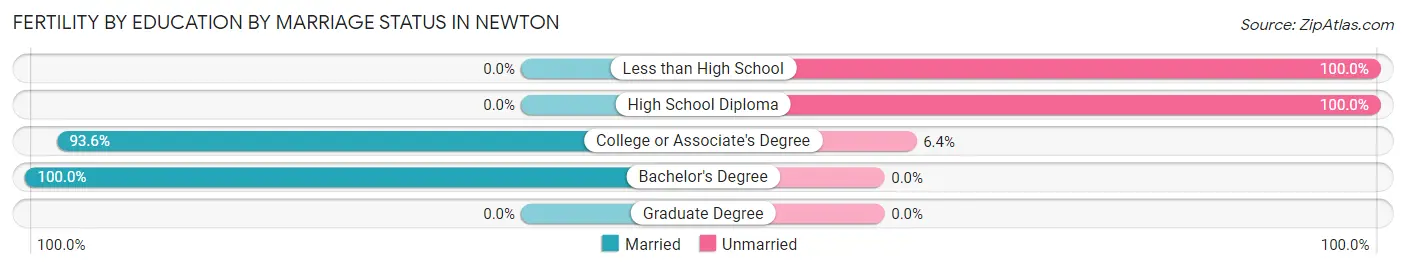
| Educational Attainment | Married | Unmarried |
| Less than High School | 0 (0.0%) | 46 (100.0%) |
| High School Diploma | 0 (0.0%) | 30 (100.0%) |
| College or Associate's Degree | 131 (93.6%) | 9 (6.4%) |
| Bachelor's Degree | 174 (100.0%) | 0 (0.0%) |
| Graduate Degree | 0 (0.0%) | 0 (0.0%) |
| Total | 305 (78.2%) | 85 (21.8%) |
Employment Characteristics in Newton
Employment by Class of Employer in Newton
Among the 9,403 employed individuals in Newton, private company employees (6,252 | 66.5%), not-for-profit organizations (1,234 | 13.1%), and local government employees (589 | 6.3%) make up the most common classes of employment.
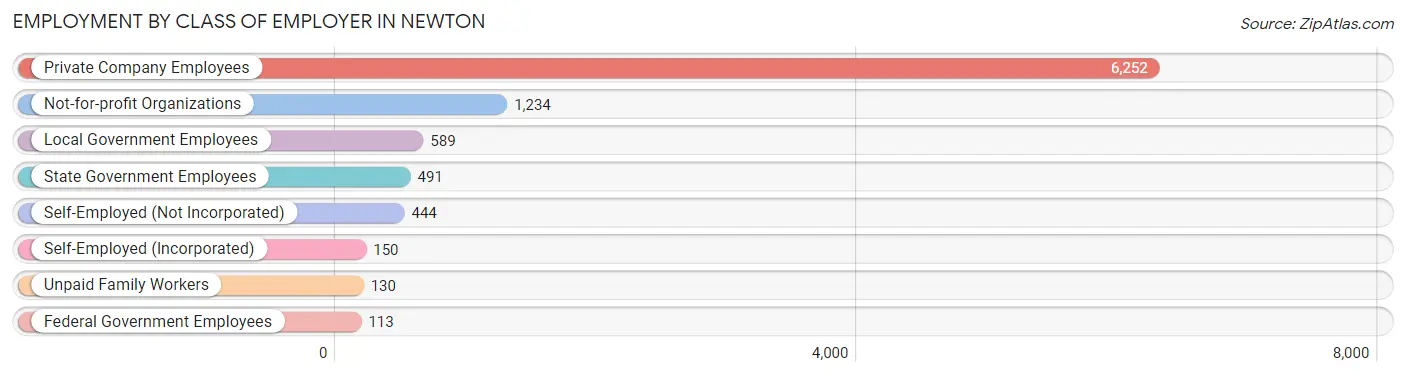
| Employer Class | # Employees | % Employees |
| Private Company Employees | 6,252 | 66.5% |
| Self-Employed (Incorporated) | 150 | 1.6% |
| Self-Employed (Not Incorporated) | 444 | 4.7% |
| Not-for-profit Organizations | 1,234 | 13.1% |
| Local Government Employees | 589 | 6.3% |
| State Government Employees | 491 | 5.2% |
| Federal Government Employees | 113 | 1.2% |
| Unpaid Family Workers | 130 | 1.4% |
| Total | 9,403 | 100.0% |
Employment Status by Age in Newton
According to the labor force statistics for Newton, out of the total population over 16 years of age (14,696), 69.4% or 10,199 individuals are in the labor force, with 5.3% or 541 of them unemployed. The age group with the highest labor force participation rate is 25 to 29 years, with 93.6% or 1,248 individuals in the labor force. Within the labor force, the 30 to 34 years age range has the highest percentage of unemployed individuals, with 18.7% or 202 of them being unemployed.
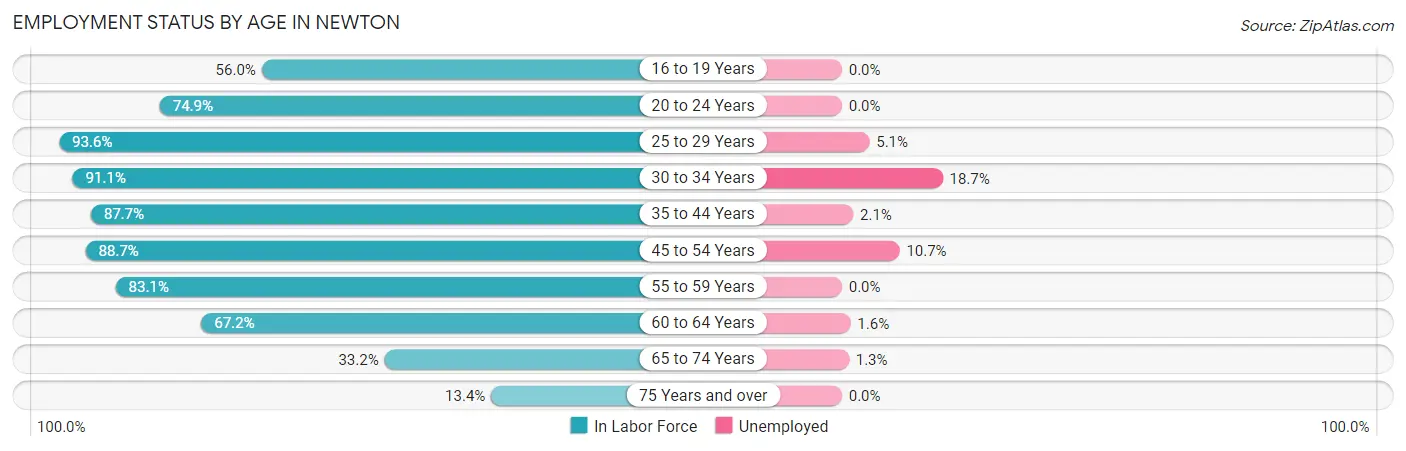
| Age Bracket | In Labor Force | Unemployed |
| 16 to 19 Years | 390 (56.0%) | 0 (0.0%) |
| 20 to 24 Years | 819 (74.9%) | 0 (0.0%) |
| 25 to 29 Years | 1,248 (93.6%) | 64 (5.1%) |
| 30 to 34 Years | 1,080 (91.1%) | 202 (18.7%) |
| 35 to 44 Years | 1,965 (87.7%) | 41 (2.1%) |
| 45 to 54 Years | 2,006 (88.7%) | 215 (10.7%) |
| 55 to 59 Years | 934 (83.1%) | 0 (0.0%) |
| 60 to 64 Years | 931 (67.2%) | 15 (1.6%) |
| 65 to 74 Years | 625 (33.2%) | 8 (1.3%) |
| 75 Years and over | 200 (13.4%) | 0 (0.0%) |
| Total | 10,199 (69.4%) | 541 (5.3%) |
Employment Status by Educational Attainment in Newton
According to labor force statistics for Newton, 85.7% of individuals (8,169) out of the total population between 25 and 64 years of age (9,532) are in the labor force, with 6.6% or 539 of them being unemployed. The group with the highest labor force participation rate are those with the educational attainment of college / associate degree, with 89.5% or 3,142 individuals in the labor force. Within the labor force, individuals with high school diploma education have the highest percentage of unemployment, with 16.3% or 367 of them being unemployed.
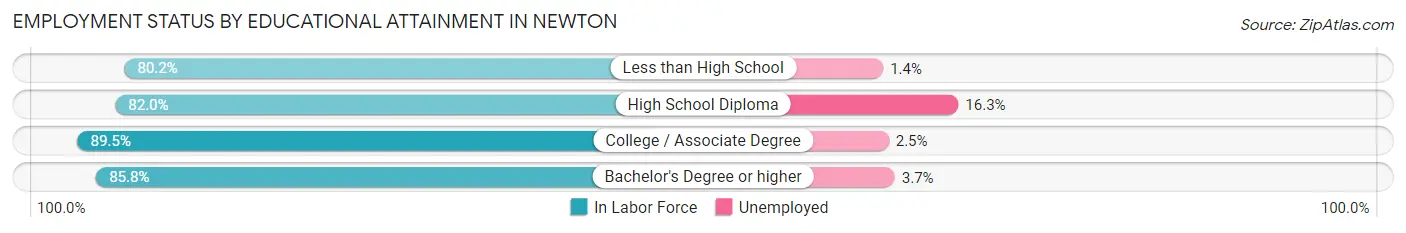
| Educational Attainment | In Labor Force | Unemployed |
| Less than High School | 506 (80.2%) | 9 (1.4%) |
| High School Diploma | 2,250 (82.0%) | 447 (16.3%) |
| College / Associate Degree | 3,142 (89.5%) | 88 (2.5%) |
| Bachelor's Degree or higher | 2,270 (85.8%) | 98 (3.7%) |
| Total | 8,169 (85.7%) | 629 (6.6%) |
Employment Occupations by Sex in Newton
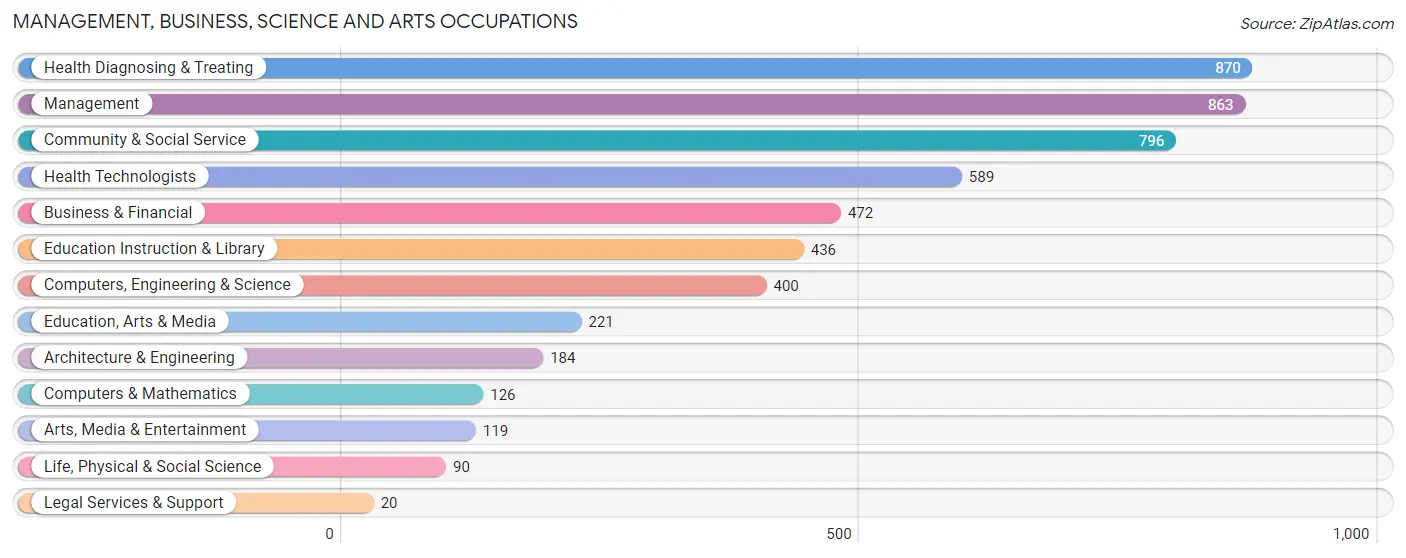
Management, Business, Science and Arts Occupations
The most common Management, Business, Science and Arts occupations in Newton are Health Diagnosing & Treating (870 | 9.0%), Management (863 | 8.9%), Community & Social Service (796 | 8.3%), Health Technologists (589 | 6.1%), and Business & Financial (472 | 4.9%).
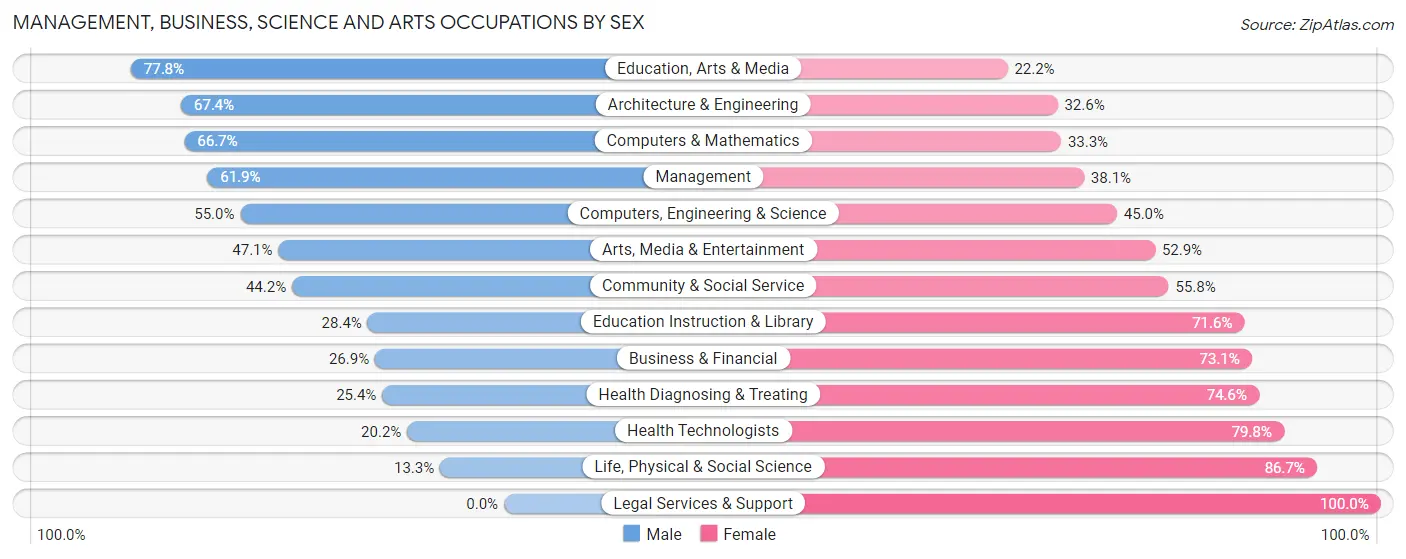
Management, Business, Science and Arts Occupations by Sex
Within the Management, Business, Science and Arts occupations in Newton, the most male-oriented occupations are Education, Arts & Media (77.8%), Architecture & Engineering (67.4%), and Computers & Mathematics (66.7%), while the most female-oriented occupations are Legal Services & Support (100.0%), Life, Physical & Social Science (86.7%), and Health Technologists (79.8%).
| Occupation | Male | Female |
| Management | 534 (61.9%) | 329 (38.1%) |
| Business & Financial | 127 (26.9%) | 345 (73.1%) |
| Computers, Engineering & Science | 220 (55.0%) | 180 (45.0%) |
| Computers & Mathematics | 84 (66.7%) | 42 (33.3%) |
| Architecture & Engineering | 124 (67.4%) | 60 (32.6%) |
| Life, Physical & Social Science | 12 (13.3%) | 78 (86.7%) |
| Community & Social Service | 352 (44.2%) | 444 (55.8%) |
| Education, Arts & Media | 172 (77.8%) | 49 (22.2%) |
| Legal Services & Support | 0 (0.0%) | 20 (100.0%) |
| Education Instruction & Library | 124 (28.4%) | 312 (71.6%) |
| Arts, Media & Entertainment | 56 (47.1%) | 63 (52.9%) |
| Health Diagnosing & Treating | 221 (25.4%) | 649 (74.6%) |
| Health Technologists | 119 (20.2%) | 470 (79.8%) |
| Total (Category) | 1,454 (42.7%) | 1,947 (57.3%) |
| Total (Overall) | 5,150 (53.4%) | 4,495 (46.6%) |
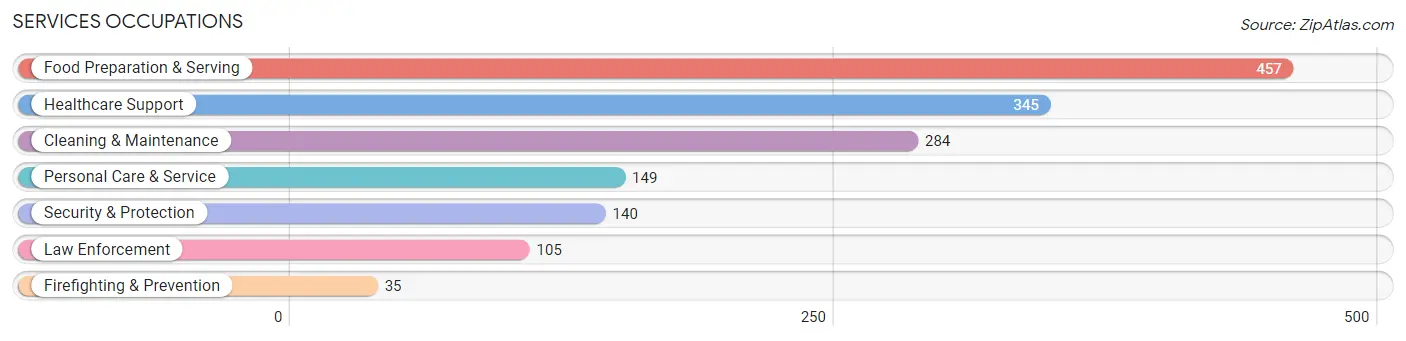
Services Occupations
The most common Services occupations in Newton are Food Preparation & Serving (457 | 4.7%), Healthcare Support (345 | 3.6%), Cleaning & Maintenance (284 | 2.9%), Personal Care & Service (149 | 1.5%), and Security & Protection (140 | 1.5%).
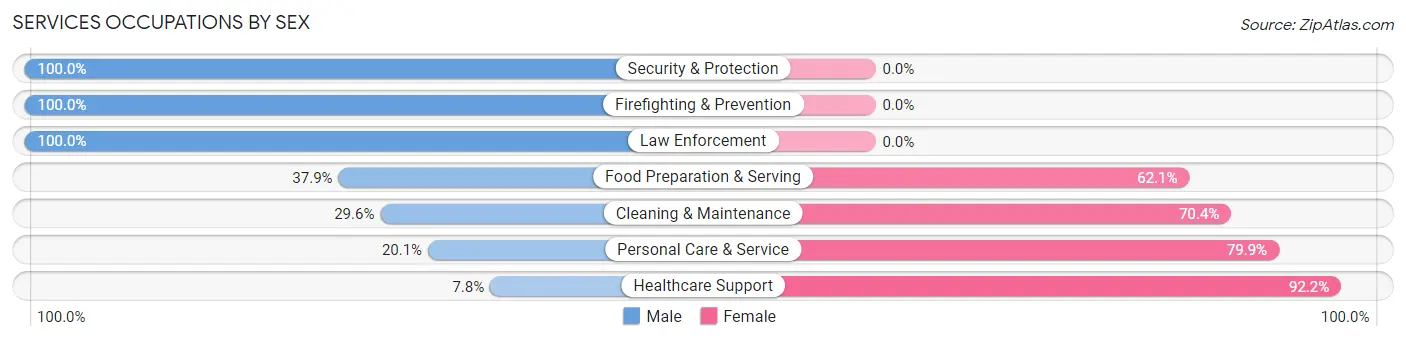
Services Occupations by Sex
Within the Services occupations in Newton, the most male-oriented occupations are Security & Protection (100.0%), Firefighting & Prevention (100.0%), and Law Enforcement (100.0%), while the most female-oriented occupations are Healthcare Support (92.2%), Personal Care & Service (79.9%), and Cleaning & Maintenance (70.4%).
| Occupation | Male | Female |
| Healthcare Support | 27 (7.8%) | 318 (92.2%) |
| Security & Protection | 140 (100.0%) | 0 (0.0%) |
| Firefighting & Prevention | 35 (100.0%) | 0 (0.0%) |
| Law Enforcement | 105 (100.0%) | 0 (0.0%) |
| Food Preparation & Serving | 173 (37.9%) | 284 (62.1%) |
| Cleaning & Maintenance | 84 (29.6%) | 200 (70.4%) |
| Personal Care & Service | 30 (20.1%) | 119 (79.9%) |
| Total (Category) | 454 (33.0%) | 921 (67.0%) |
| Total (Overall) | 5,150 (53.4%) | 4,495 (46.6%) |
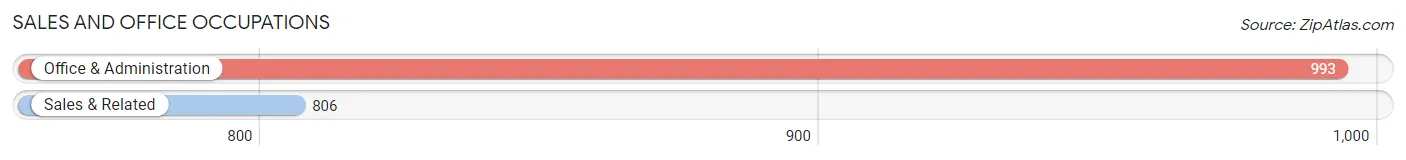
Sales and Office Occupations
The most common Sales and Office occupations in Newton are Office & Administration (993 | 10.3%), and Sales & Related (806 | 8.4%).
Sales and Office Occupations by Sex
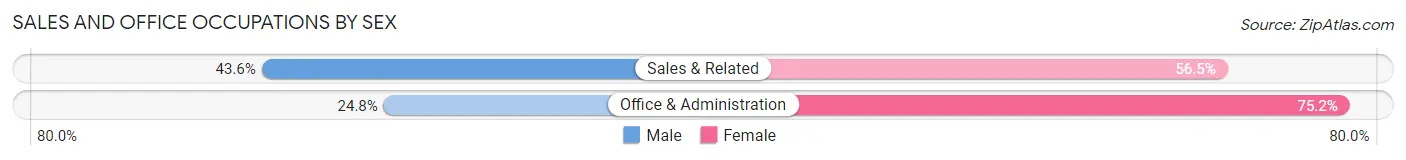
| Occupation | Male | Female |
| Sales & Related | 351 (43.5%) | 455 (56.5%) |
| Office & Administration | 246 (24.8%) | 747 (75.2%) |
| Total (Category) | 597 (33.2%) | 1,202 (66.8%) |
| Total (Overall) | 5,150 (53.4%) | 4,495 (46.6%) |
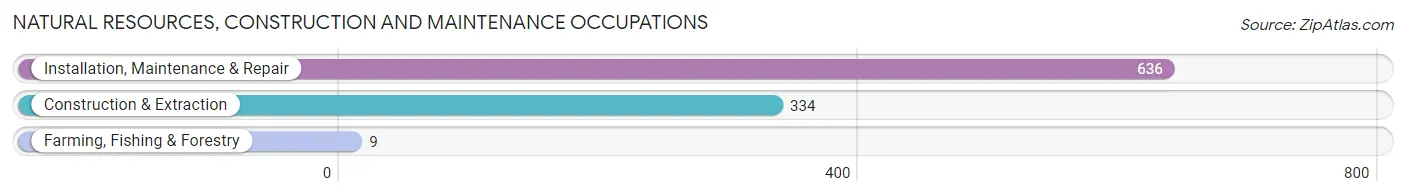
Natural Resources, Construction and Maintenance Occupations
The most common Natural Resources, Construction and Maintenance occupations in Newton are Installation, Maintenance & Repair (636 | 6.6%), Construction & Extraction (334 | 3.5%), and Farming, Fishing & Forestry (9 | 0.1%).
Natural Resources, Construction and Maintenance Occupations by Sex
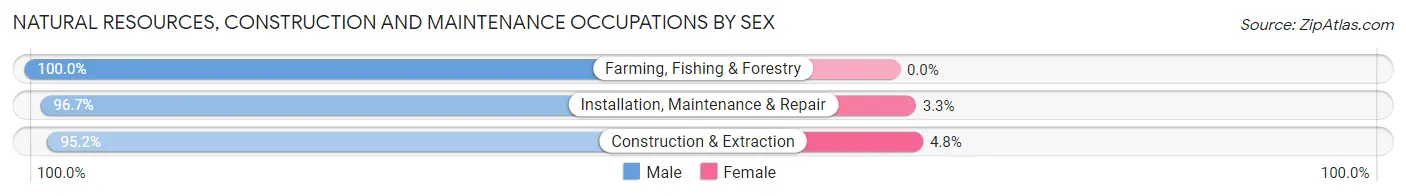
| Occupation | Male | Female |
| Farming, Fishing & Forestry | 9 (100.0%) | 0 (0.0%) |
| Construction & Extraction | 318 (95.2%) | 16 (4.8%) |
| Installation, Maintenance & Repair | 615 (96.7%) | 21 (3.3%) |
| Total (Category) | 942 (96.2%) | 37 (3.8%) |
| Total (Overall) | 5,150 (53.4%) | 4,495 (46.6%) |
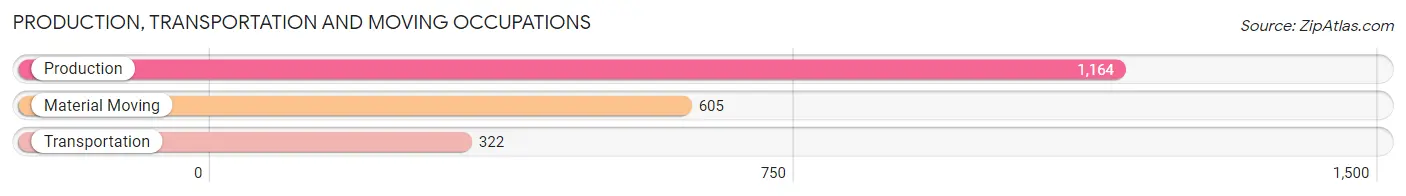
Production, Transportation and Moving Occupations
The most common Production, Transportation and Moving occupations in Newton are Production (1,164 | 12.1%), Material Moving (605 | 6.3%), and Transportation (322 | 3.3%).
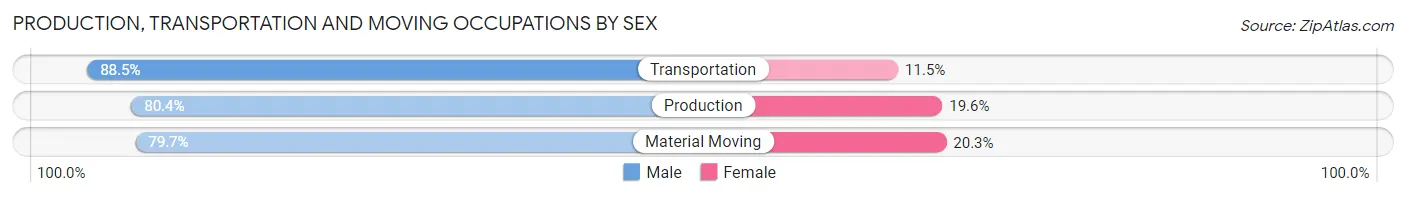
Production, Transportation and Moving Occupations by Sex
| Occupation | Male | Female |
| Production | 936 (80.4%) | 228 (19.6%) |
| Transportation | 285 (88.5%) | 37 (11.5%) |
| Material Moving | 482 (79.7%) | 123 (20.3%) |
| Total (Category) | 1,703 (81.4%) | 388 (18.6%) |
| Total (Overall) | 5,150 (53.4%) | 4,495 (46.6%) |
Employment Industries by Sex in Newton
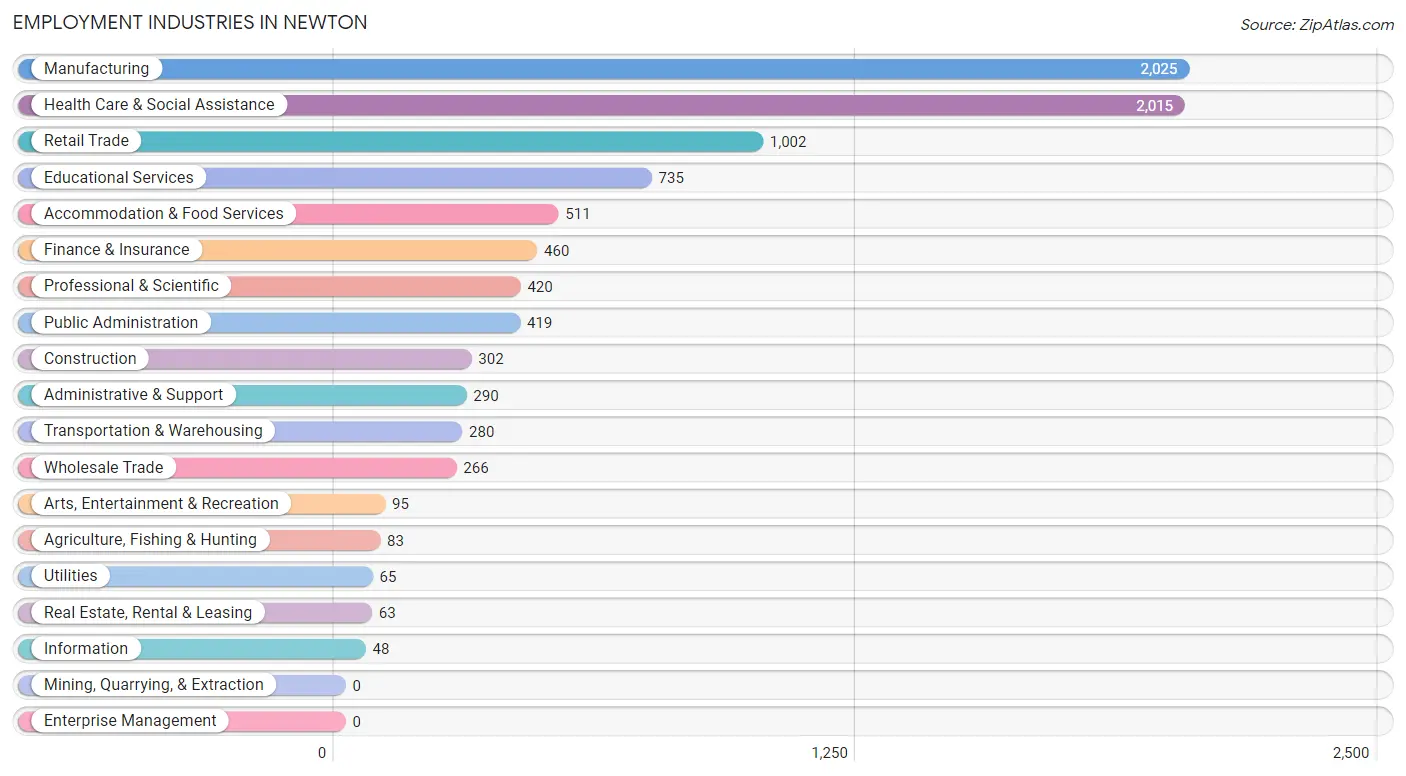
Employment Industries in Newton
The major employment industries in Newton include Manufacturing (2,025 | 21.0%), Health Care & Social Assistance (2,015 | 20.9%), Retail Trade (1,002 | 10.4%), Educational Services (735 | 7.6%), and Accommodation & Food Services (511 | 5.3%).
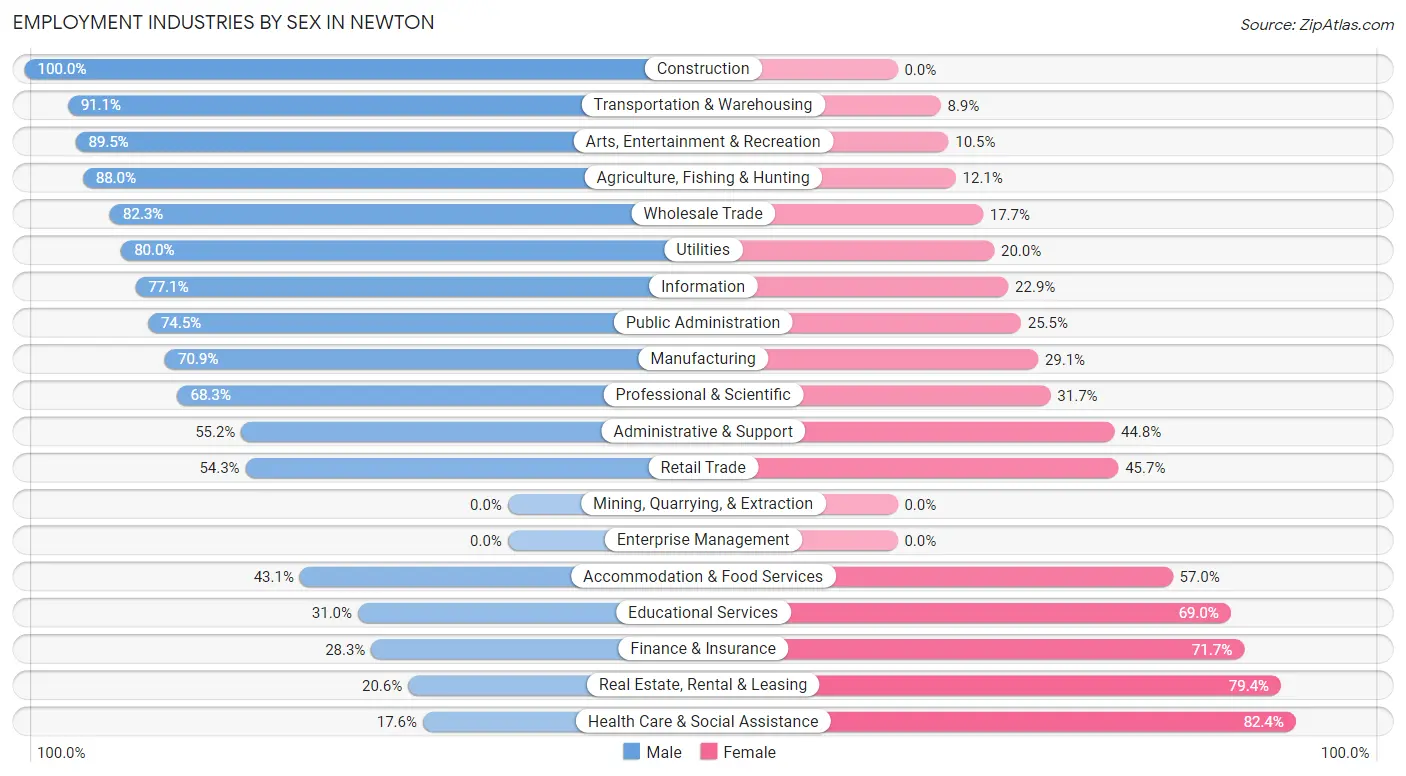
Employment Industries by Sex in Newton
The Newton industries that see more men than women are Construction (100.0%), Transportation & Warehousing (91.1%), and Arts, Entertainment & Recreation (89.5%), whereas the industries that tend to have a higher number of women are Health Care & Social Assistance (82.4%), Real Estate, Rental & Leasing (79.4%), and Finance & Insurance (71.7%).
| Industry | Male | Female |
| Agriculture, Fishing & Hunting | 73 (87.9%) | 10 (12.0%) |
| Mining, Quarrying, & Extraction | 0 (0.0%) | 0 (0.0%) |
| Construction | 302 (100.0%) | 0 (0.0%) |
| Manufacturing | 1,436 (70.9%) | 589 (29.1%) |
| Wholesale Trade | 219 (82.3%) | 47 (17.7%) |
| Retail Trade | 544 (54.3%) | 458 (45.7%) |
| Transportation & Warehousing | 255 (91.1%) | 25 (8.9%) |
| Utilities | 52 (80.0%) | 13 (20.0%) |
| Information | 37 (77.1%) | 11 (22.9%) |
| Finance & Insurance | 130 (28.3%) | 330 (71.7%) |
| Real Estate, Rental & Leasing | 13 (20.6%) | 50 (79.4%) |
| Professional & Scientific | 287 (68.3%) | 133 (31.7%) |
| Enterprise Management | 0 (0.0%) | 0 (0.0%) |
| Administrative & Support | 160 (55.2%) | 130 (44.8%) |
| Educational Services | 228 (31.0%) | 507 (69.0%) |
| Health Care & Social Assistance | 354 (17.6%) | 1,661 (82.4%) |
| Arts, Entertainment & Recreation | 85 (89.5%) | 10 (10.5%) |
| Accommodation & Food Services | 220 (43.0%) | 291 (57.0%) |
| Public Administration | 312 (74.5%) | 107 (25.5%) |
| Total | 5,150 (53.4%) | 4,495 (46.6%) |
Education in Newton
School Enrollment in Newton
The most common levels of schooling among the 4,191 students in Newton are high school (1,077 | 25.7%), middle school (1,037 | 24.7%), and elementary school (931 | 22.2%).
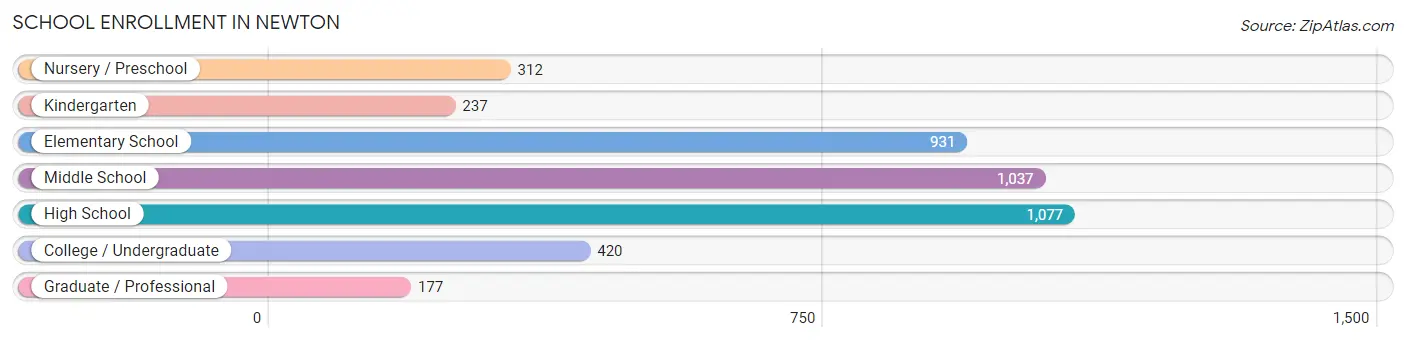
| School Level | # Students | % Students |
| Nursery / Preschool | 312 | 7.4% |
| Kindergarten | 237 | 5.7% |
| Elementary School | 931 | 22.2% |
| Middle School | 1,037 | 24.7% |
| High School | 1,077 | 25.7% |
| College / Undergraduate | 420 | 10.0% |
| Graduate / Professional | 177 | 4.2% |
| Total | 4,191 | 100.0% |
School Enrollment by Age by Funding Source in Newton
Out of a total of 4,191 students who are enrolled in schools in Newton, 633 (15.1%) attend a private institution, while the remaining 3,558 (84.9%) are enrolled in public schools. The age group of 25 to 34 year olds has the highest likelihood of being enrolled in private schools, with 107 (43.3% in the age bracket) enrolled. Conversely, the age group of 18 to 19 year olds has the lowest likelihood of being enrolled in a private school, with 277 (100.0% in the age bracket) attending a public institution.
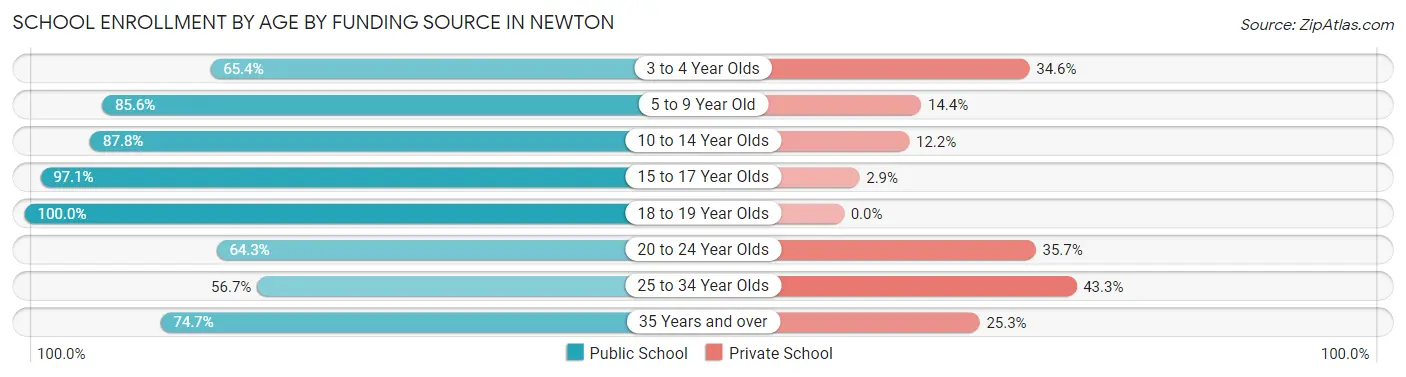
| Age Bracket | Public School | Private School |
| 3 to 4 Year Olds | 157 (65.4%) | 83 (34.6%) |
| 5 to 9 Year Old | 980 (85.6%) | 165 (14.4%) |
| 10 to 14 Year Olds | 924 (87.8%) | 128 (12.2%) |
| 15 to 17 Year Olds | 801 (97.1%) | 24 (2.9%) |
| 18 to 19 Year Olds | 277 (100.0%) | 0 (0.0%) |
| 20 to 24 Year Olds | 151 (64.3%) | 84 (35.7%) |
| 25 to 34 Year Olds | 140 (56.7%) | 107 (43.3%) |
| 35 Years and over | 127 (74.7%) | 43 (25.3%) |
| Total | 3,558 (84.9%) | 633 (15.1%) |
Educational Attainment by Field of Study in Newton
Education (627 | 16.2%), science & technology (580 | 15.0%), business (553 | 14.3%), arts & humanities (544 | 14.1%), and bio, nature & agricultural (323 | 8.4%) are the most common fields of study among 3,862 individuals in Newton who have obtained a bachelor's degree or higher.
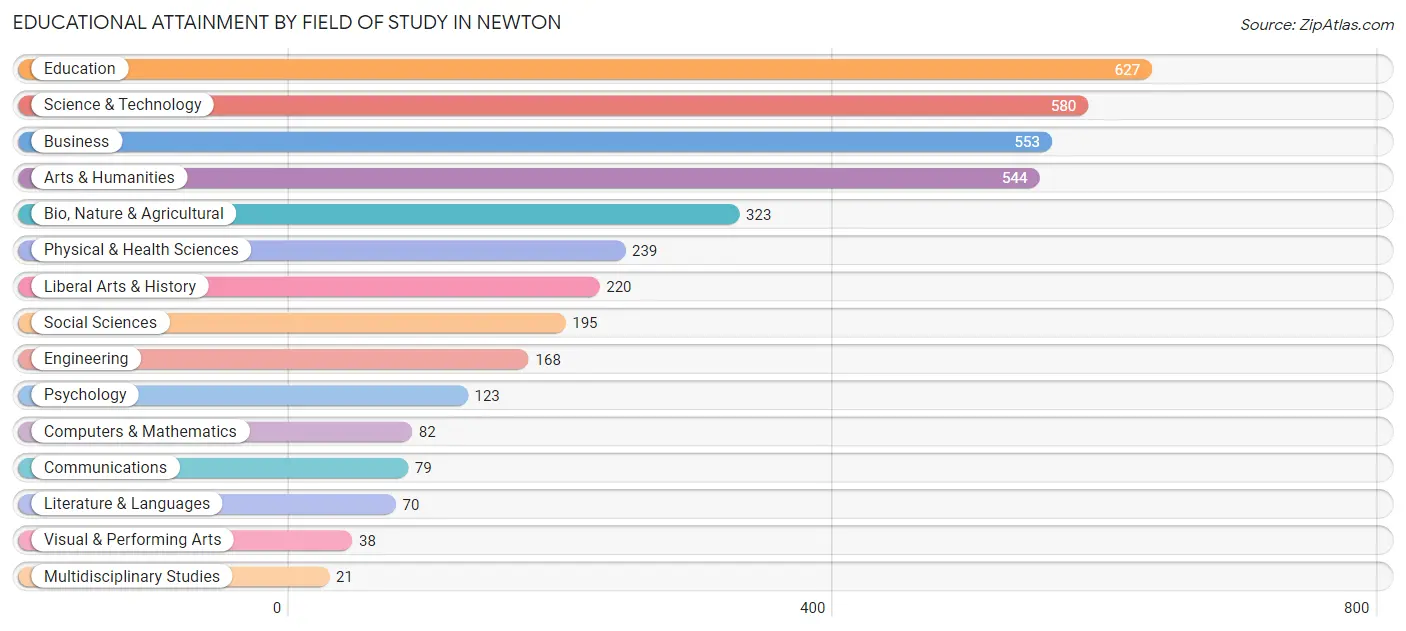
| Field of Study | # Graduates | % Graduates |
| Computers & Mathematics | 82 | 2.1% |
| Bio, Nature & Agricultural | 323 | 8.4% |
| Physical & Health Sciences | 239 | 6.2% |
| Psychology | 123 | 3.2% |
| Social Sciences | 195 | 5.1% |
| Engineering | 168 | 4.3% |
| Multidisciplinary Studies | 21 | 0.5% |
| Science & Technology | 580 | 15.0% |
| Business | 553 | 14.3% |
| Education | 627 | 16.2% |
| Literature & Languages | 70 | 1.8% |
| Liberal Arts & History | 220 | 5.7% |
| Visual & Performing Arts | 38 | 1.0% |
| Communications | 79 | 2.1% |
| Arts & Humanities | 544 | 14.1% |
| Total | 3,862 | 100.0% |
Transportation & Commute in Newton
Vehicle Availability by Sex in Newton
The most prevalent vehicle ownership categories in Newton are males with 2 vehicles (2,265, accounting for 44.9%) and females with 2 vehicles (1,755, making up 52.1%).
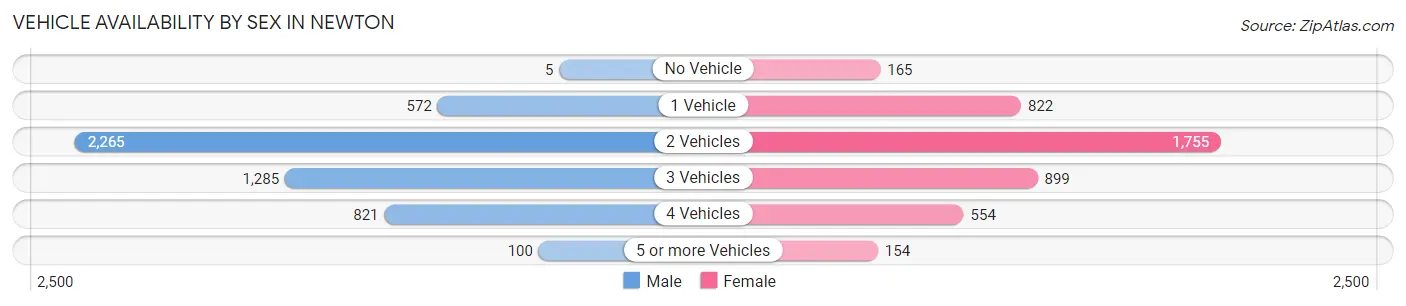
| Vehicles Available | Male | Female |
| No Vehicle | 5 (0.1%) | 165 (3.8%) |
| 1 Vehicle | 572 (11.3%) | 822 (18.9%) |
| 2 Vehicles | 2,265 (44.9%) | 1,755 (40.4%) |
| 3 Vehicles | 1,285 (25.5%) | 899 (20.7%) |
| 4 Vehicles | 821 (16.3%) | 554 (12.7%) |
| 5 or more Vehicles | 100 (2.0%) | 154 (3.5%) |
| Total | 5,048 (100.0%) | 4,349 (100.0%) |
Commute Time in Newton
The most frequently occuring commute durations in Newton are 5 to 9 minutes (1,736 commuters, 19.7%), 10 to 14 minutes (1,650 commuters, 18.7%), and 30 to 34 minutes (1,362 commuters, 15.5%).
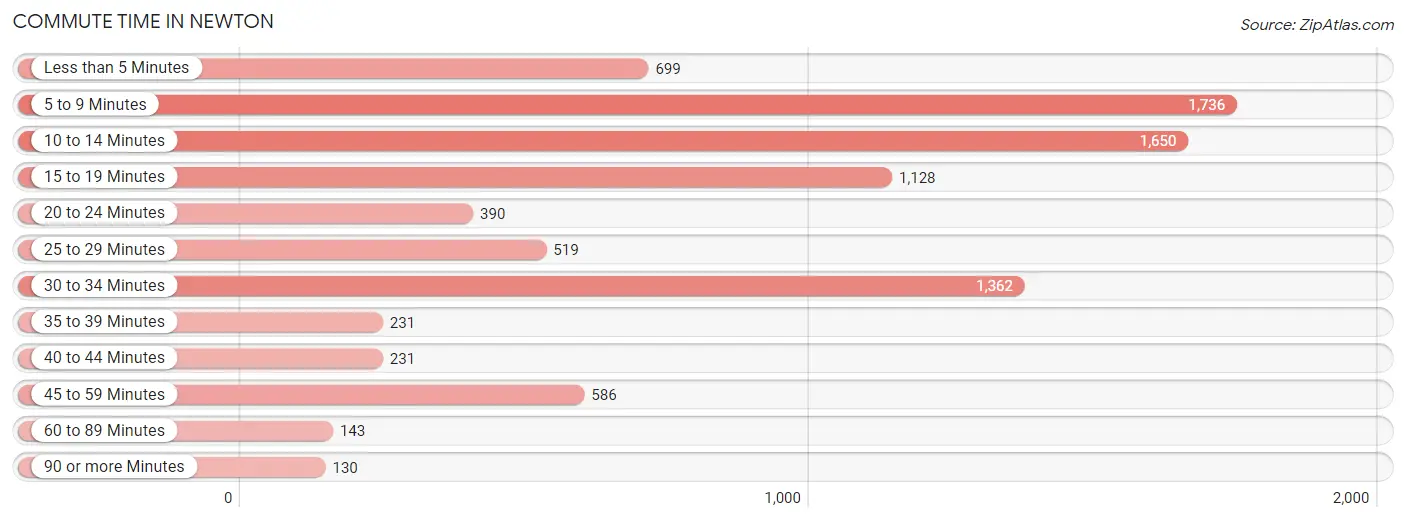
| Commute Time | # Commuters | % Commuters |
| Less than 5 Minutes | 699 | 7.9% |
| 5 to 9 Minutes | 1,736 | 19.7% |
| 10 to 14 Minutes | 1,650 | 18.7% |
| 15 to 19 Minutes | 1,128 | 12.8% |
| 20 to 24 Minutes | 390 | 4.4% |
| 25 to 29 Minutes | 519 | 5.9% |
| 30 to 34 Minutes | 1,362 | 15.5% |
| 35 to 39 Minutes | 231 | 2.6% |
| 40 to 44 Minutes | 231 | 2.6% |
| 45 to 59 Minutes | 586 | 6.7% |
| 60 to 89 Minutes | 143 | 1.6% |
| 90 or more Minutes | 130 | 1.5% |
Commute Time by Sex in Newton
The most common commute times in Newton are 30 to 34 minutes (916 commuters, 19.1%) for males and 10 to 14 minutes (946 commuters, 23.6%) for females.
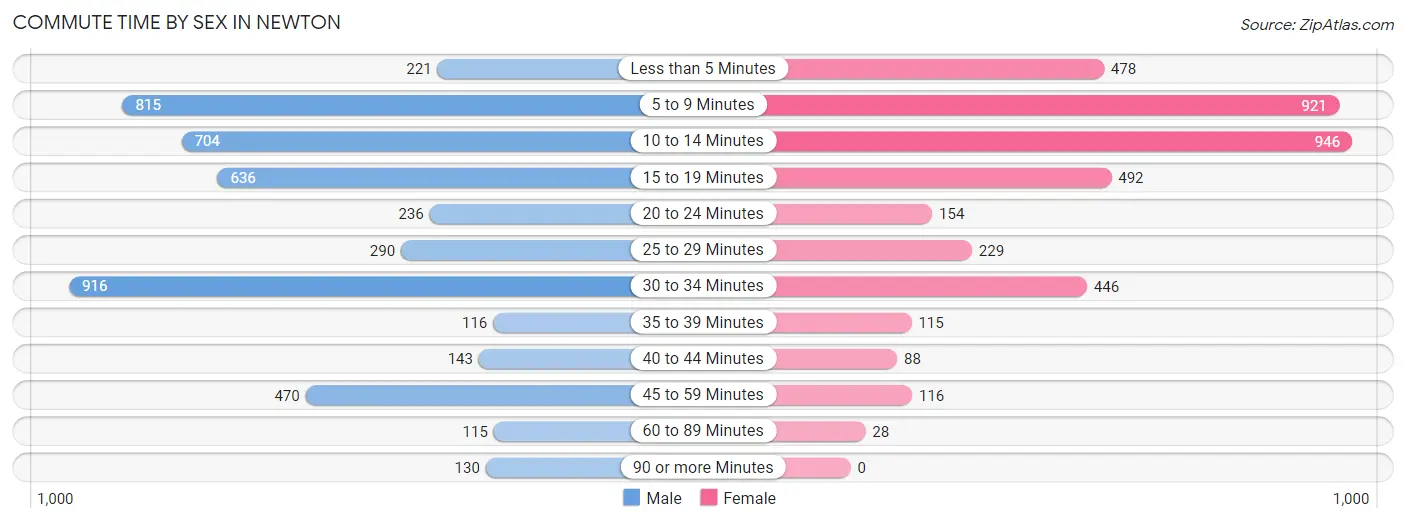
| Commute Time | Male | Female |
| Less than 5 Minutes | 221 (4.6%) | 478 (11.9%) |
| 5 to 9 Minutes | 815 (17.0%) | 921 (23.0%) |
| 10 to 14 Minutes | 704 (14.7%) | 946 (23.6%) |
| 15 to 19 Minutes | 636 (13.3%) | 492 (12.3%) |
| 20 to 24 Minutes | 236 (4.9%) | 154 (3.8%) |
| 25 to 29 Minutes | 290 (6.0%) | 229 (5.7%) |
| 30 to 34 Minutes | 916 (19.1%) | 446 (11.1%) |
| 35 to 39 Minutes | 116 (2.4%) | 115 (2.9%) |
| 40 to 44 Minutes | 143 (3.0%) | 88 (2.2%) |
| 45 to 59 Minutes | 470 (9.8%) | 116 (2.9%) |
| 60 to 89 Minutes | 115 (2.4%) | 28 (0.7%) |
| 90 or more Minutes | 130 (2.7%) | 0 (0.0%) |
Time of Departure to Work by Sex in Newton
The most frequent times of departure to work in Newton are 6:00 AM to 6:29 AM (720, 15.0%) for males and 7:30 AM to 7:59 AM (879, 21.9%) for females.
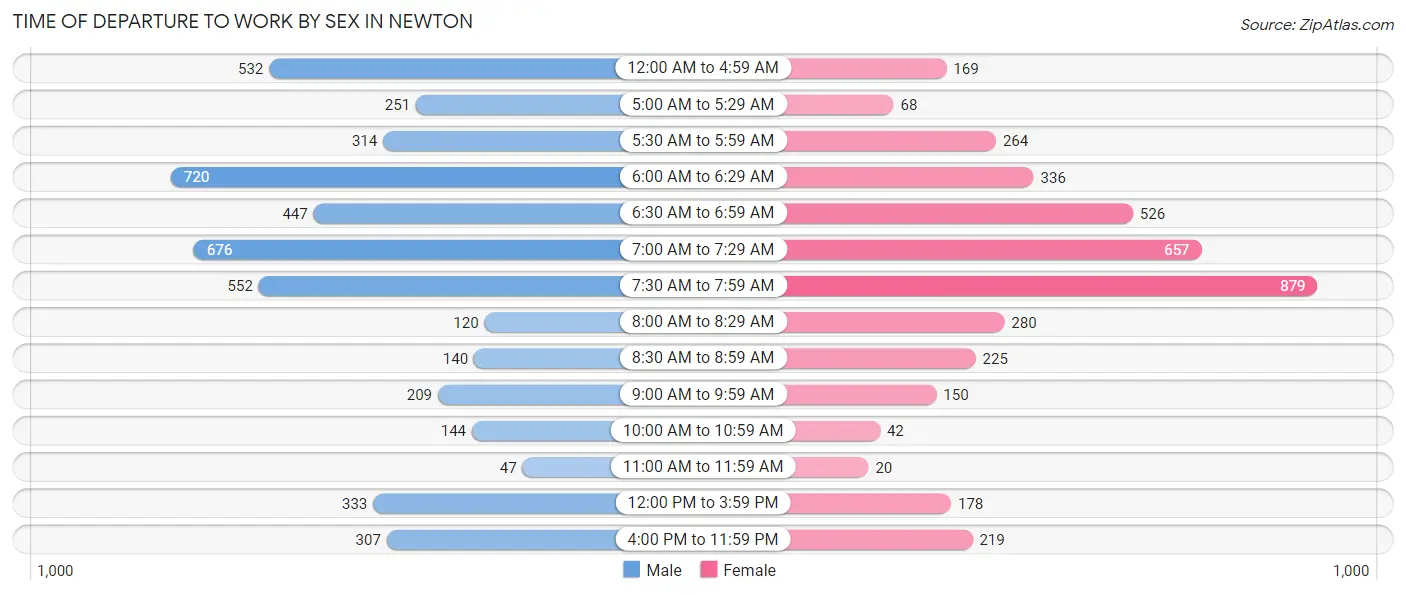
| Time of Departure | Male | Female |
| 12:00 AM to 4:59 AM | 532 (11.1%) | 169 (4.2%) |
| 5:00 AM to 5:29 AM | 251 (5.2%) | 68 (1.7%) |
| 5:30 AM to 5:59 AM | 314 (6.6%) | 264 (6.6%) |
| 6:00 AM to 6:29 AM | 720 (15.0%) | 336 (8.4%) |
| 6:30 AM to 6:59 AM | 447 (9.3%) | 526 (13.1%) |
| 7:00 AM to 7:29 AM | 676 (14.1%) | 657 (16.4%) |
| 7:30 AM to 7:59 AM | 552 (11.5%) | 879 (21.9%) |
| 8:00 AM to 8:29 AM | 120 (2.5%) | 280 (7.0%) |
| 8:30 AM to 8:59 AM | 140 (2.9%) | 225 (5.6%) |
| 9:00 AM to 9:59 AM | 209 (4.4%) | 150 (3.7%) |
| 10:00 AM to 10:59 AM | 144 (3.0%) | 42 (1.1%) |
| 11:00 AM to 11:59 AM | 47 (1.0%) | 20 (0.5%) |
| 12:00 PM to 3:59 PM | 333 (7.0%) | 178 (4.4%) |
| 4:00 PM to 11:59 PM | 307 (6.4%) | 219 (5.5%) |
| Total | 4,792 (100.0%) | 4,013 (100.0%) |
Housing Occupancy in Newton
Occupancy by Ownership in Newton
Of the total 7,291 dwellings in Newton, owner-occupied units account for 5,025 (68.9%), while renter-occupied units make up 2,266 (31.1%).
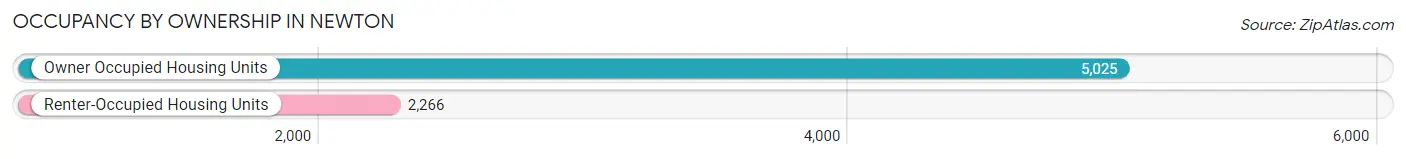
| Occupancy | # Housing Units | % Housing Units |
| Owner Occupied Housing Units | 5,025 | 68.9% |
| Renter-Occupied Housing Units | 2,266 | 31.1% |
| Total Occupied Housing Units | 7,291 | 100.0% |
Occupancy by Household Size in Newton
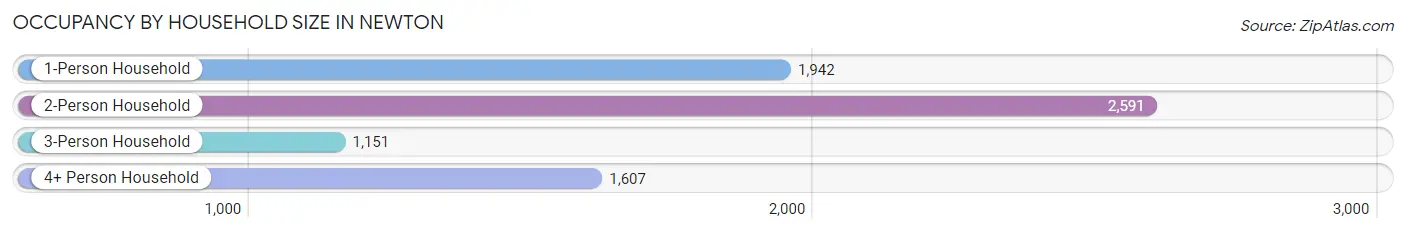
| Household Size | # Housing Units | % Housing Units |
| 1-Person Household | 1,942 | 26.6% |
| 2-Person Household | 2,591 | 35.5% |
| 3-Person Household | 1,151 | 15.8% |
| 4+ Person Household | 1,607 | 22.0% |
| Total Housing Units | 7,291 | 100.0% |
Occupancy by Ownership by Household Size in Newton
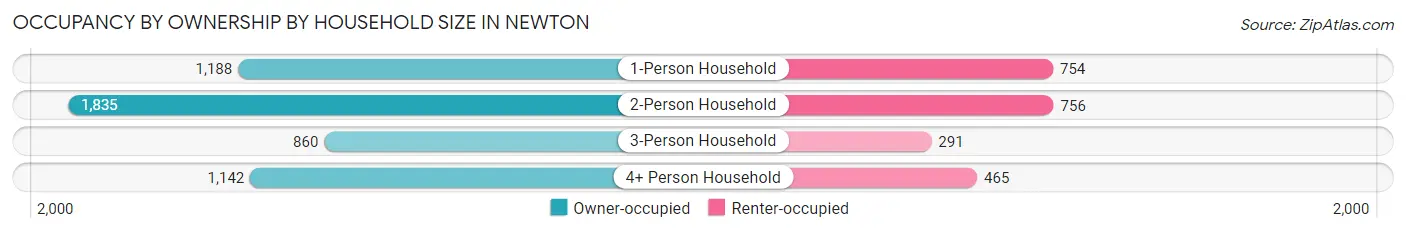
| Household Size | Owner-occupied | Renter-occupied |
| 1-Person Household | 1,188 (61.2%) | 754 (38.8%) |
| 2-Person Household | 1,835 (70.8%) | 756 (29.2%) |
| 3-Person Household | 860 (74.7%) | 291 (25.3%) |
| 4+ Person Household | 1,142 (71.1%) | 465 (28.9%) |
| Total Housing Units | 5,025 (68.9%) | 2,266 (31.1%) |
Occupancy by Educational Attainment in Newton
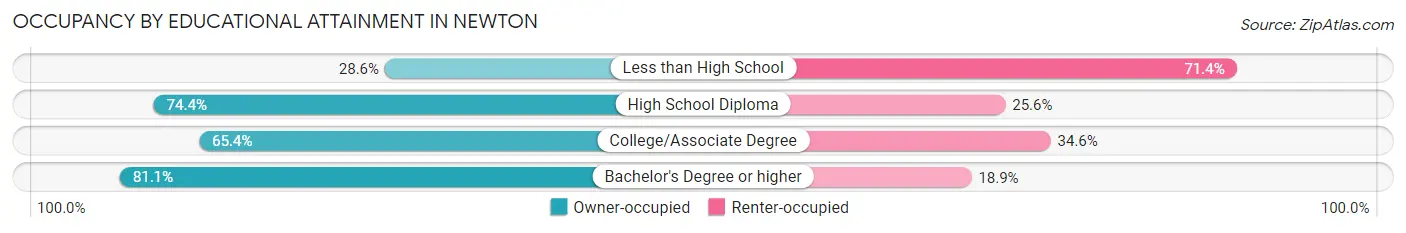
| Household Size | Owner-occupied | Renter-occupied |
| Less than High School | 182 (28.6%) | 455 (71.4%) |
| High School Diploma | 1,398 (74.4%) | 481 (25.6%) |
| College/Associate Degree | 1,783 (65.4%) | 943 (34.6%) |
| Bachelor's Degree or higher | 1,662 (81.1%) | 387 (18.9%) |
Occupancy by Age of Householder in Newton
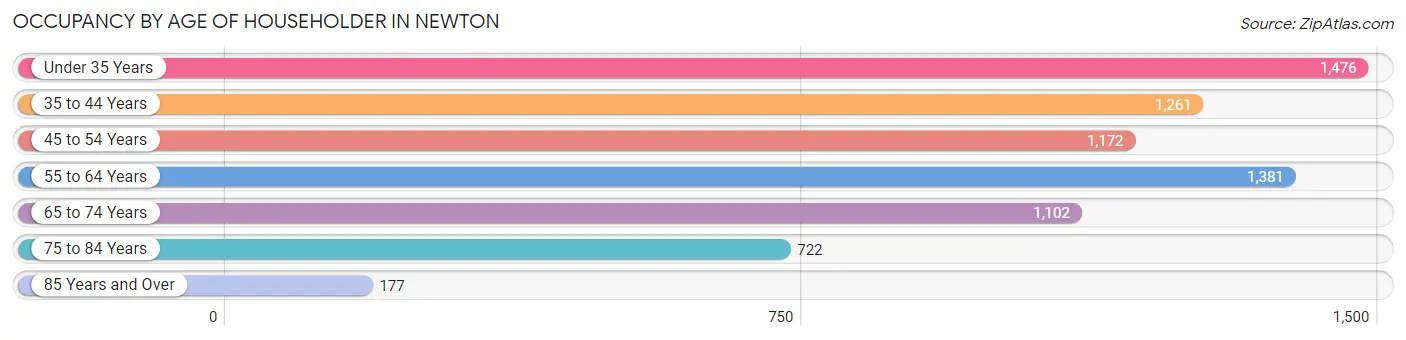
| Age Bracket | # Households | % Households |
| Under 35 Years | 1,476 | 20.2% |
| 35 to 44 Years | 1,261 | 17.3% |
| 45 to 54 Years | 1,172 | 16.1% |
| 55 to 64 Years | 1,381 | 18.9% |
| 65 to 74 Years | 1,102 | 15.1% |
| 75 to 84 Years | 722 | 9.9% |
| 85 Years and Over | 177 | 2.4% |
| Total | 7,291 | 100.0% |
Housing Finances in Newton
Median Income by Occupancy in Newton
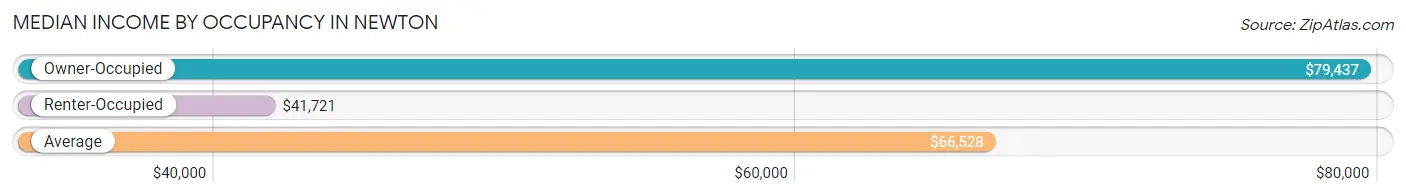
| Occupancy Type | # Households | Median Income |
| Owner-Occupied | 5,025 (68.9%) | $79,437 |
| Renter-Occupied | 2,266 (31.1%) | $41,721 |
| Average | 7,291 (100.0%) | $66,528 |
Occupancy by Householder Income Bracket in Newton
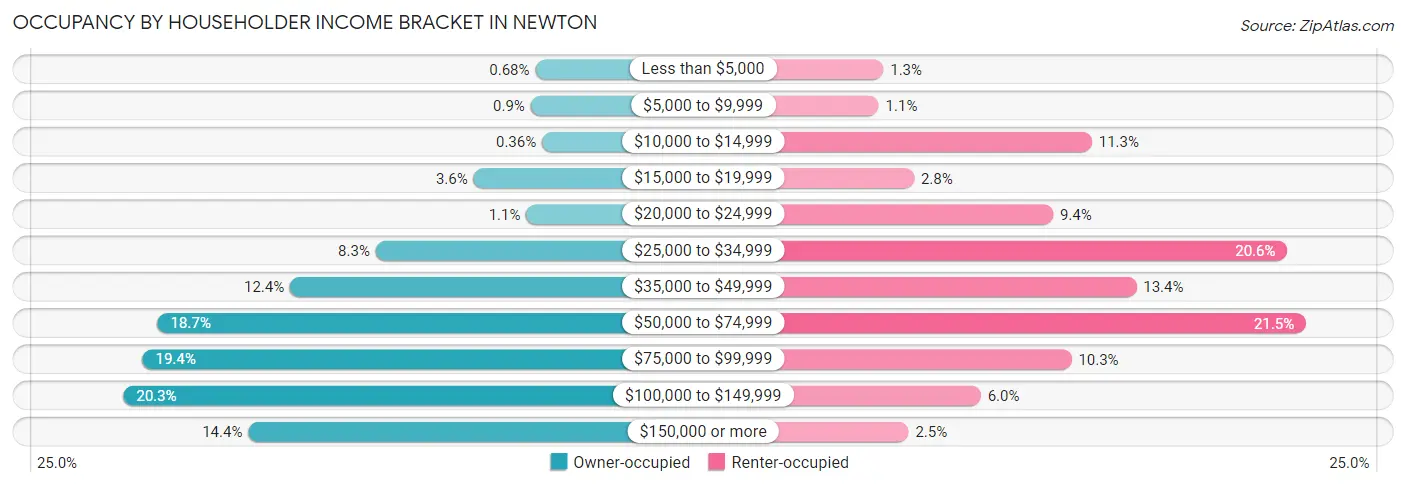
| Income Bracket | Owner-occupied | Renter-occupied |
| Less than $5,000 | 34 (0.7%) | 30 (1.3%) |
| $5,000 to $9,999 | 45 (0.9%) | 25 (1.1%) |
| $10,000 to $14,999 | 18 (0.4%) | 255 (11.3%) |
| $15,000 to $19,999 | 182 (3.6%) | 63 (2.8%) |
| $20,000 to $24,999 | 56 (1.1%) | 213 (9.4%) |
| $25,000 to $34,999 | 416 (8.3%) | 466 (20.6%) |
| $35,000 to $49,999 | 621 (12.4%) | 303 (13.4%) |
| $50,000 to $74,999 | 938 (18.7%) | 486 (21.4%) |
| $75,000 to $99,999 | 974 (19.4%) | 233 (10.3%) |
| $100,000 to $149,999 | 1,020 (20.3%) | 135 (6.0%) |
| $150,000 or more | 721 (14.3%) | 57 (2.5%) |
| Total | 5,025 (100.0%) | 2,266 (100.0%) |
Monthly Housing Cost Tiers in Newton
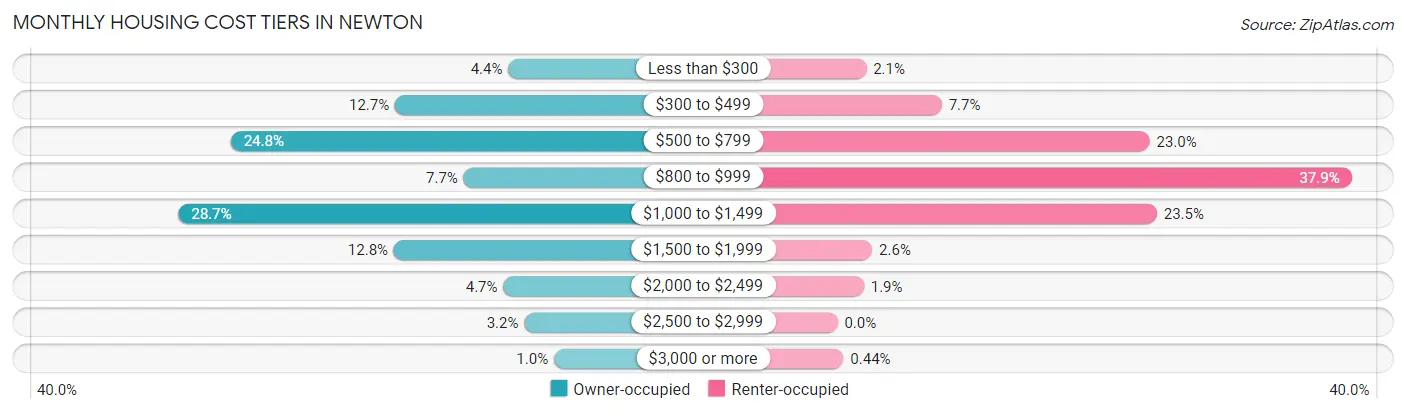
| Monthly Cost | Owner-occupied | Renter-occupied |
| Less than $300 | 220 (4.4%) | 48 (2.1%) |
| $300 to $499 | 639 (12.7%) | 174 (7.7%) |
| $500 to $799 | 1,247 (24.8%) | 521 (23.0%) |
| $800 to $999 | 385 (7.7%) | 858 (37.9%) |
| $1,000 to $1,499 | 1,441 (28.7%) | 533 (23.5%) |
| $1,500 to $1,999 | 643 (12.8%) | 58 (2.6%) |
| $2,000 to $2,499 | 238 (4.7%) | 44 (1.9%) |
| $2,500 to $2,999 | 161 (3.2%) | 0 (0.0%) |
| $3,000 or more | 51 (1.0%) | 10 (0.4%) |
| Total | 5,025 (100.0%) | 2,266 (100.0%) |
Physical Housing Characteristics in Newton
Housing Structures in Newton
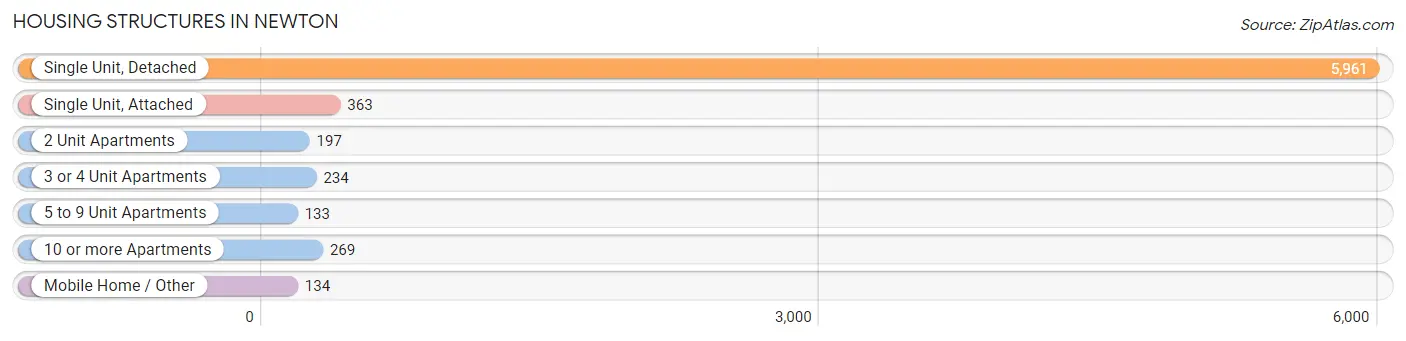
| Structure Type | # Housing Units | % Housing Units |
| Single Unit, Detached | 5,961 | 81.8% |
| Single Unit, Attached | 363 | 5.0% |
| 2 Unit Apartments | 197 | 2.7% |
| 3 or 4 Unit Apartments | 234 | 3.2% |
| 5 to 9 Unit Apartments | 133 | 1.8% |
| 10 or more Apartments | 269 | 3.7% |
| Mobile Home / Other | 134 | 1.8% |
| Total | 7,291 | 100.0% |
Housing Structures by Occupancy in Newton
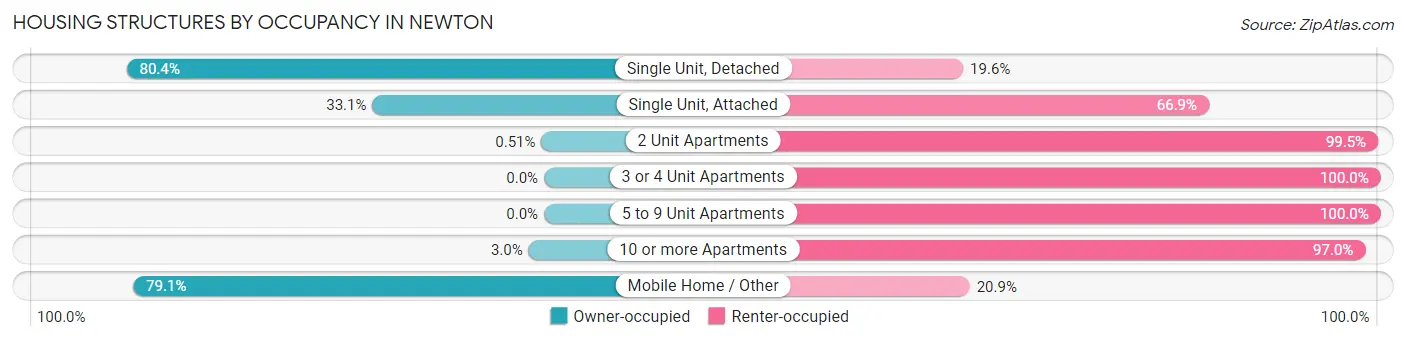
| Structure Type | Owner-occupied | Renter-occupied |
| Single Unit, Detached | 4,790 (80.4%) | 1,171 (19.6%) |
| Single Unit, Attached | 120 (33.1%) | 243 (66.9%) |
| 2 Unit Apartments | 1 (0.5%) | 196 (99.5%) |
| 3 or 4 Unit Apartments | 0 (0.0%) | 234 (100.0%) |
| 5 to 9 Unit Apartments | 0 (0.0%) | 133 (100.0%) |
| 10 or more Apartments | 8 (3.0%) | 261 (97.0%) |
| Mobile Home / Other | 106 (79.1%) | 28 (20.9%) |
| Total | 5,025 (68.9%) | 2,266 (31.1%) |
Housing Structures by Number of Rooms in Newton
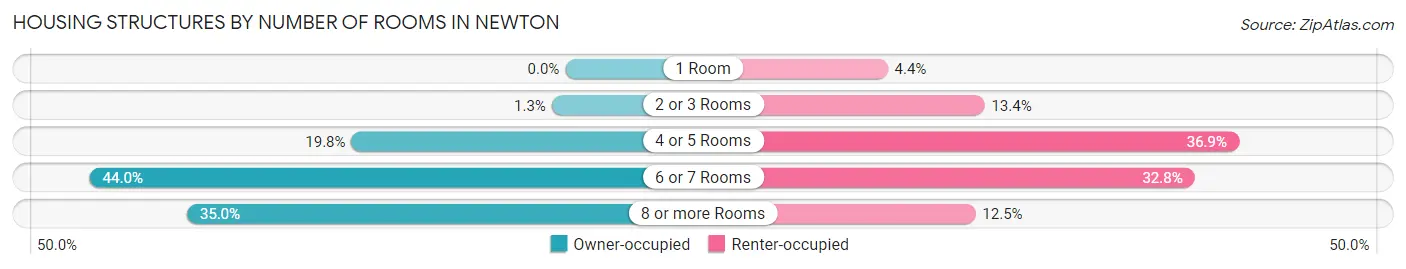
| Number of Rooms | Owner-occupied | Renter-occupied |
| 1 Room | 0 (0.0%) | 100 (4.4%) |
| 2 or 3 Rooms | 63 (1.3%) | 303 (13.4%) |
| 4 or 5 Rooms | 994 (19.8%) | 836 (36.9%) |
| 6 or 7 Rooms | 2,210 (44.0%) | 743 (32.8%) |
| 8 or more Rooms | 1,758 (35.0%) | 284 (12.5%) |
| Total | 5,025 (100.0%) | 2,266 (100.0%) |
Housing Structure by Heating Type in Newton
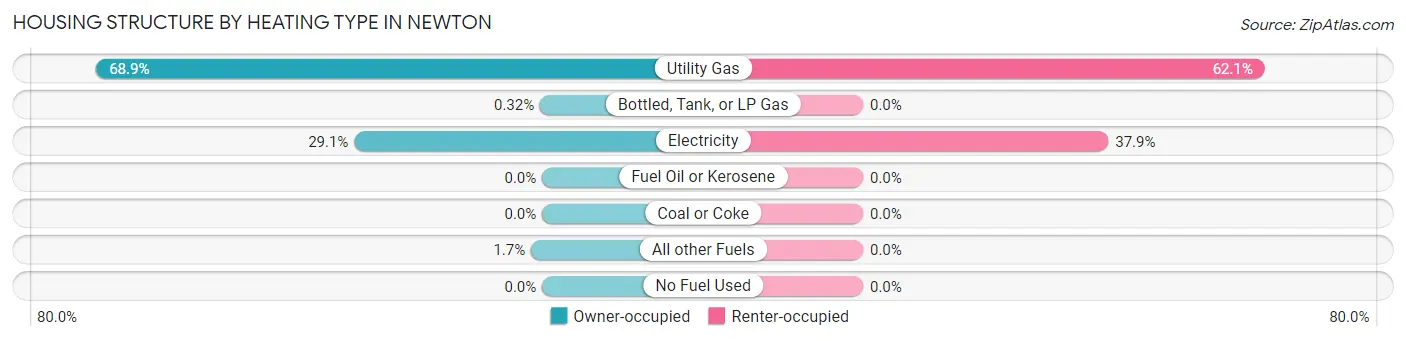
| Heating Type | Owner-occupied | Renter-occupied |
| Utility Gas | 3,463 (68.9%) | 1,407 (62.1%) |
| Bottled, Tank, or LP Gas | 16 (0.3%) | 0 (0.0%) |
| Electricity | 1,460 (29.0%) | 859 (37.9%) |
| Fuel Oil or Kerosene | 0 (0.0%) | 0 (0.0%) |
| Coal or Coke | 0 (0.0%) | 0 (0.0%) |
| All other Fuels | 86 (1.7%) | 0 (0.0%) |
| No Fuel Used | 0 (0.0%) | 0 (0.0%) |
| Total | 5,025 (100.0%) | 2,266 (100.0%) |
Household Vehicle Usage in Newton
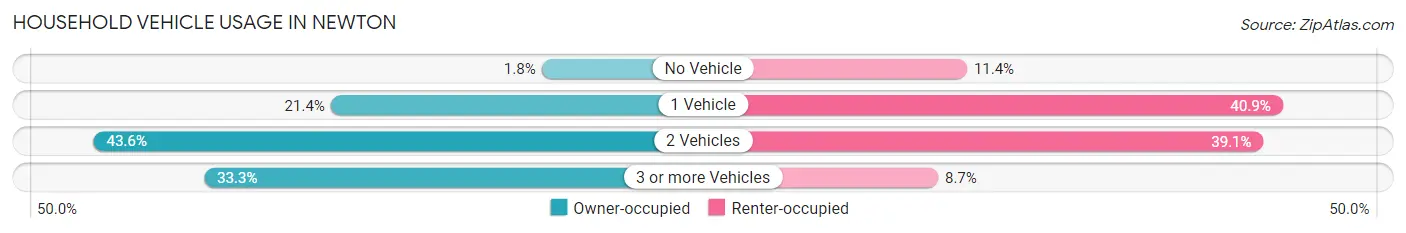
| Vehicles per Household | Owner-occupied | Renter-occupied |
| No Vehicle | 88 (1.8%) | 258 (11.4%) |
| 1 Vehicle | 1,077 (21.4%) | 926 (40.9%) |
| 2 Vehicles | 2,189 (43.6%) | 885 (39.1%) |
| 3 or more Vehicles | 1,671 (33.3%) | 197 (8.7%) |
| Total | 5,025 (100.0%) | 2,266 (100.0%) |
Real Estate & Mortgages in Newton
Real Estate and Mortgage Overview in Newton
| Characteristic | Without Mortgage | With Mortgage |
| Housing Units | 2,200 | 2,825 |
| Median Property Value | $117,600 | $147,900 |
| Median Household Income | $63,893 | $485 |
| Monthly Housing Costs | $577 | $51 |
| Real Estate Taxes | $1,851 | $38 |
Property Value by Mortgage Status in Newton
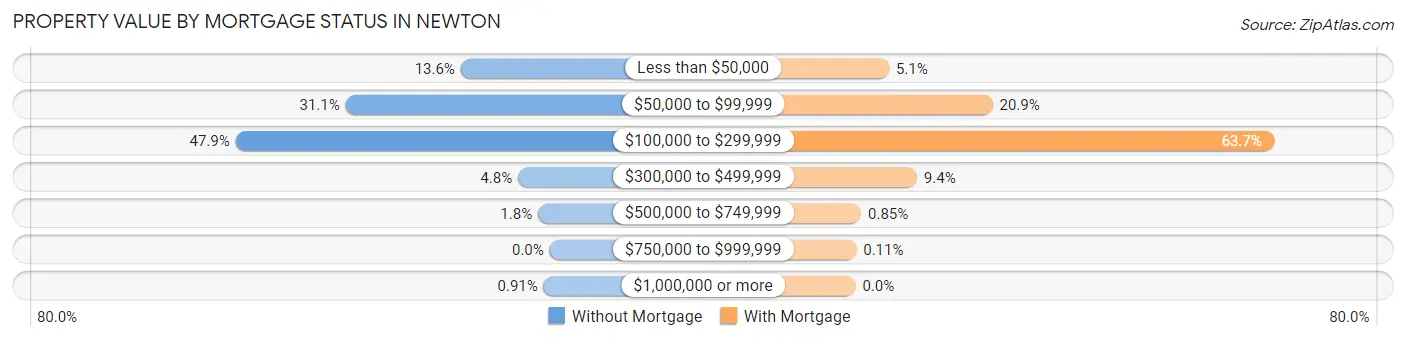
| Property Value | Without Mortgage | With Mortgage |
| Less than $50,000 | 298 (13.6%) | 144 (5.1%) |
| $50,000 to $99,999 | 684 (31.1%) | 590 (20.9%) |
| $100,000 to $299,999 | 1,053 (47.9%) | 1,800 (63.7%) |
| $300,000 to $499,999 | 106 (4.8%) | 264 (9.3%) |
| $500,000 to $749,999 | 39 (1.8%) | 24 (0.9%) |
| $750,000 to $999,999 | 0 (0.0%) | 3 (0.1%) |
| $1,000,000 or more | 20 (0.9%) | 0 (0.0%) |
| Total | 2,200 (100.0%) | 2,825 (100.0%) |
Household Income by Mortgage Status in Newton
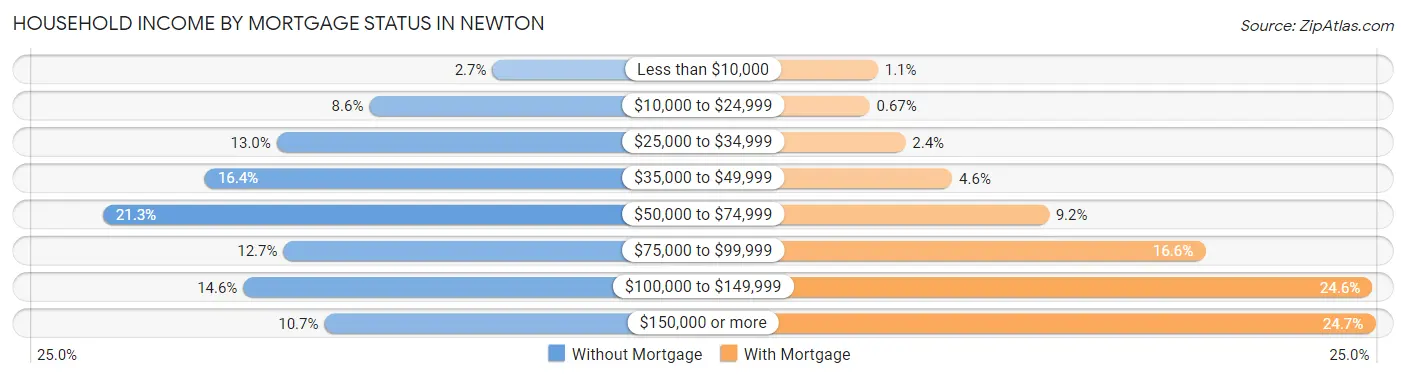
| Household Income | Without Mortgage | With Mortgage |
| Less than $10,000 | 60 (2.7%) | 30 (1.1%) |
| $10,000 to $24,999 | 189 (8.6%) | 19 (0.7%) |
| $25,000 to $34,999 | 286 (13.0%) | 67 (2.4%) |
| $35,000 to $49,999 | 361 (16.4%) | 130 (4.6%) |
| $50,000 to $74,999 | 468 (21.3%) | 260 (9.2%) |
| $75,000 to $99,999 | 279 (12.7%) | 470 (16.6%) |
| $100,000 to $149,999 | 321 (14.6%) | 695 (24.6%) |
| $150,000 or more | 236 (10.7%) | 699 (24.7%) |
| Total | 2,200 (100.0%) | 2,825 (100.0%) |
Property Value to Household Income Ratio in Newton
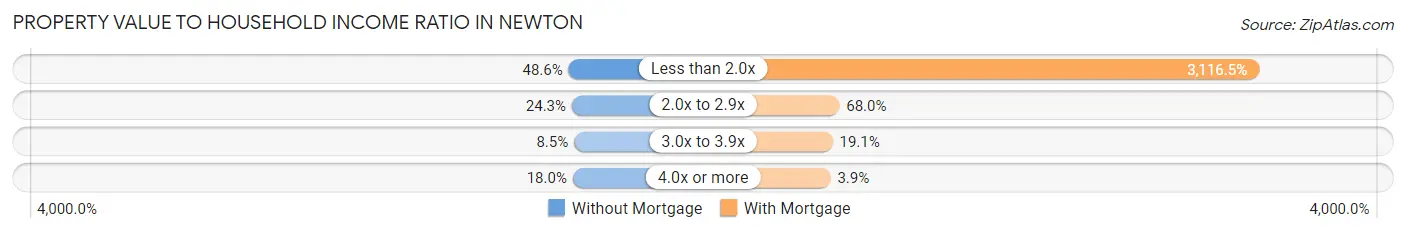
| Value-to-Income Ratio | Without Mortgage | With Mortgage |
| Less than 2.0x | 1,068 (48.5%) | 88,042 (3,116.5%) |
| 2.0x to 2.9x | 535 (24.3%) | 1,921 (68.0%) |
| 3.0x to 3.9x | 186 (8.5%) | 539 (19.1%) |
| 4.0x or more | 396 (18.0%) | 111 (3.9%) |
| Total | 2,200 (100.0%) | 2,825 (100.0%) |
Real Estate Taxes by Mortgage Status in Newton
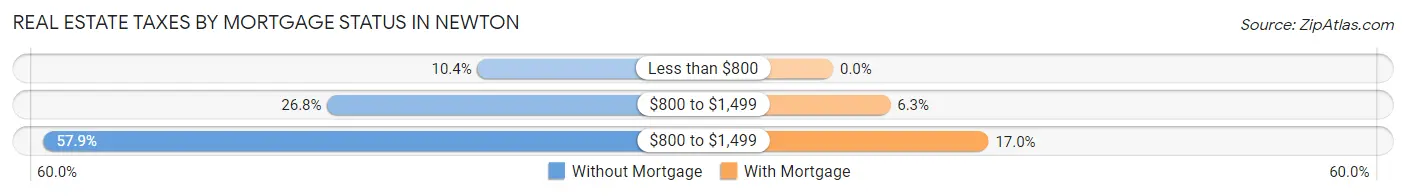
| Property Taxes | Without Mortgage | With Mortgage |
| Less than $800 | 228 (10.4%) | 0 (0.0%) |
| $800 to $1,499 | 590 (26.8%) | 177 (6.3%) |
| $800 to $1,499 | 1,274 (57.9%) | 481 (17.0%) |
| Total | 2,200 (100.0%) | 2,825 (100.0%) |
Health & Disability in Newton
Health Insurance Coverage by Age in Newton
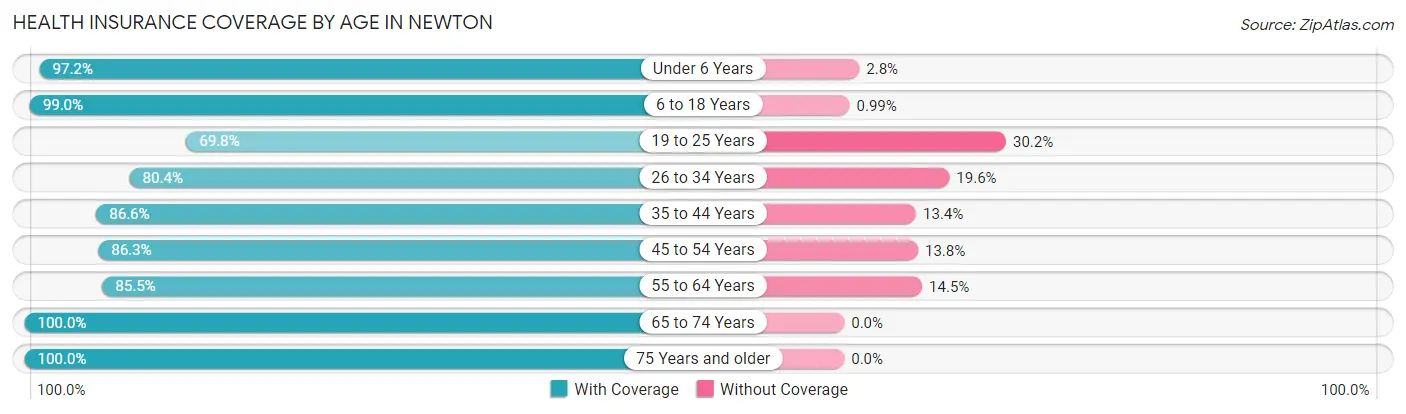
| Age Bracket | With Coverage | Without Coverage |
| Under 6 Years | 1,243 (97.2%) | 36 (2.8%) |
| 6 to 18 Years | 2,987 (99.0%) | 30 (1.0%) |
| 19 to 25 Years | 993 (69.8%) | 429 (30.2%) |
| 26 to 34 Years | 1,891 (80.4%) | 461 (19.6%) |
| 35 to 44 Years | 1,915 (86.6%) | 296 (13.4%) |
| 45 to 54 Years | 1,945 (86.3%) | 310 (13.8%) |
| 55 to 64 Years | 2,137 (85.5%) | 363 (14.5%) |
| 65 to 74 Years | 1,836 (100.0%) | 0 (0.0%) |
| 75 Years and older | 1,318 (100.0%) | 0 (0.0%) |
| Total | 16,265 (89.4%) | 1,925 (10.6%) |
Health Insurance Coverage by Citizenship Status in Newton
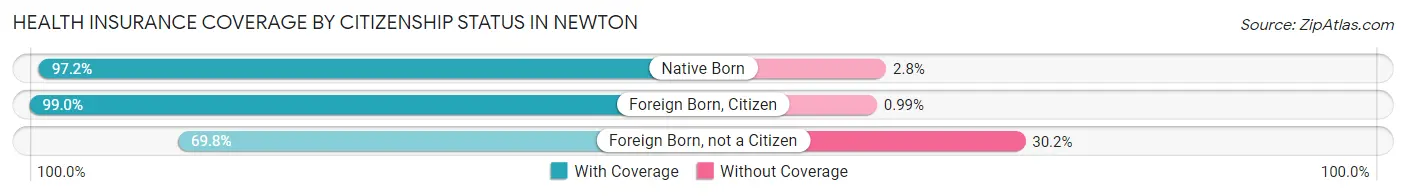
| Citizenship Status | With Coverage | Without Coverage |
| Native Born | 1,243 (97.2%) | 36 (2.8%) |
| Foreign Born, Citizen | 2,987 (99.0%) | 30 (1.0%) |
| Foreign Born, not a Citizen | 993 (69.8%) | 429 (30.2%) |
Health Insurance Coverage by Household Income in Newton
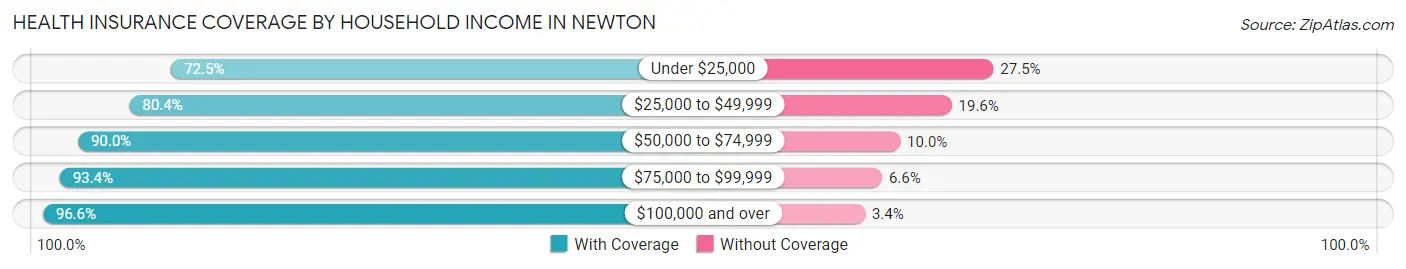
| Household Income | With Coverage | Without Coverage |
| Under $25,000 | 1,006 (72.5%) | 381 (27.5%) |
| $25,000 to $49,999 | 2,955 (80.4%) | 722 (19.6%) |
| $50,000 to $74,999 | 3,250 (90.0%) | 361 (10.0%) |
| $75,000 to $99,999 | 3,559 (93.4%) | 251 (6.6%) |
| $100,000 and over | 5,411 (96.6%) | 191 (3.4%) |
Public vs Private Health Insurance Coverage by Age in Newton
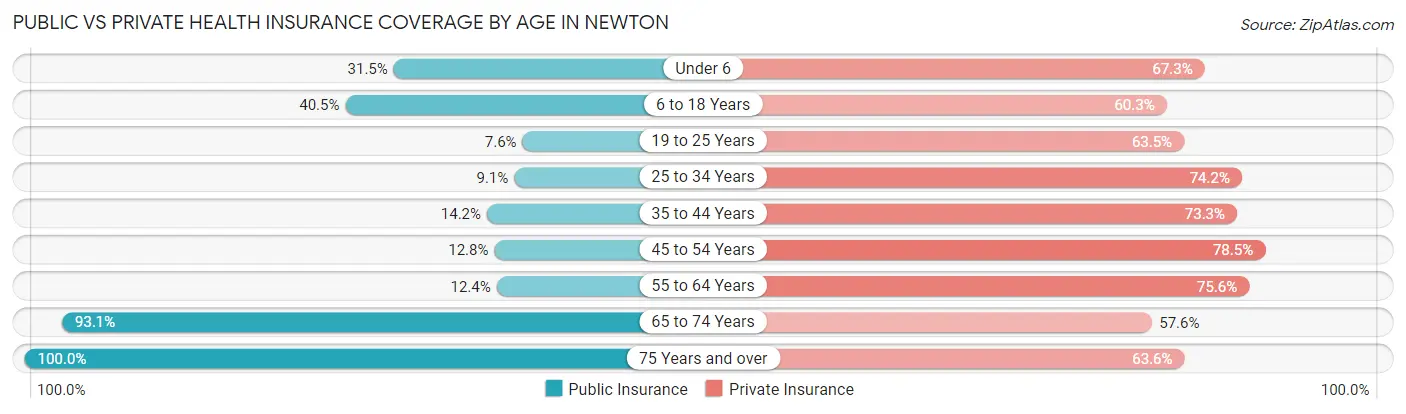
| Age Bracket | Public Insurance | Private Insurance |
| Under 6 | 403 (31.5%) | 861 (67.3%) |
| 6 to 18 Years | 1,221 (40.5%) | 1,818 (60.3%) |
| 19 to 25 Years | 108 (7.6%) | 903 (63.5%) |
| 25 to 34 Years | 215 (9.1%) | 1,746 (74.2%) |
| 35 to 44 Years | 314 (14.2%) | 1,621 (73.3%) |
| 45 to 54 Years | 289 (12.8%) | 1,771 (78.5%) |
| 55 to 64 Years | 310 (12.4%) | 1,890 (75.6%) |
| 65 to 74 Years | 1,709 (93.1%) | 1,058 (57.6%) |
| 75 Years and over | 1,318 (100.0%) | 838 (63.6%) |
| Total | 5,887 (32.4%) | 12,506 (68.8%) |
Disability Status by Sex by Age in Newton
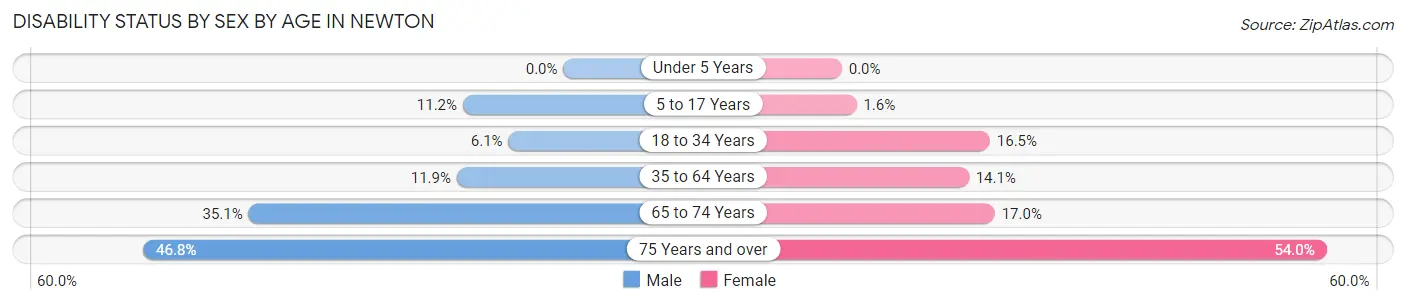
| Age Bracket | Male | Female |
| Under 5 Years | 0 (0.0%) | 0 (0.0%) |
| 5 to 17 Years | 183 (11.2%) | 23 (1.6%) |
| 18 to 34 Years | 134 (6.1%) | 292 (16.5%) |
| 35 to 64 Years | 402 (11.9%) | 506 (14.1%) |
| 65 to 74 Years | 271 (35.1%) | 181 (17.0%) |
| 75 Years and over | 329 (46.8%) | 332 (54.0%) |
Disability Class by Sex by Age in Newton
Disability Class: Hearing Difficulty
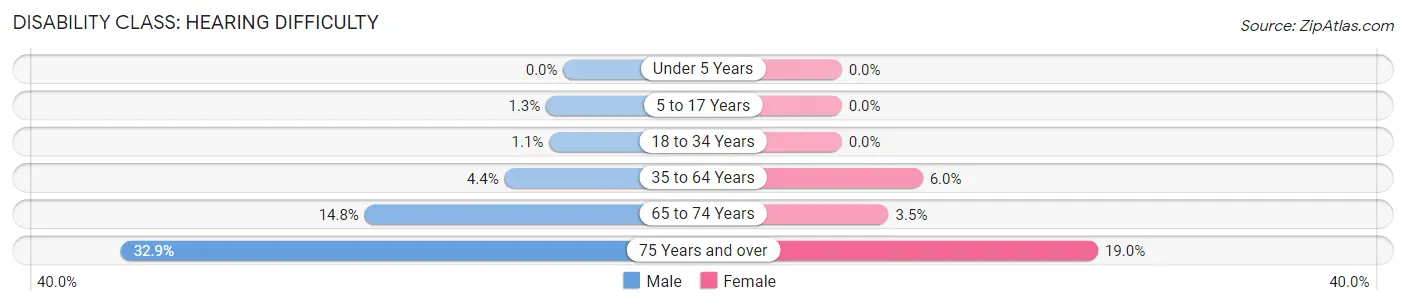
| Age Bracket | Male | Female |
| Under 5 Years | 0 (0.0%) | 0 (0.0%) |
| 5 to 17 Years | 21 (1.3%) | 0 (0.0%) |
| 18 to 34 Years | 23 (1.1%) | 0 (0.0%) |
| 35 to 64 Years | 148 (4.4%) | 215 (6.0%) |
| 65 to 74 Years | 114 (14.7%) | 37 (3.5%) |
| 75 Years and over | 231 (32.9%) | 117 (19.0%) |
Disability Class: Vision Difficulty
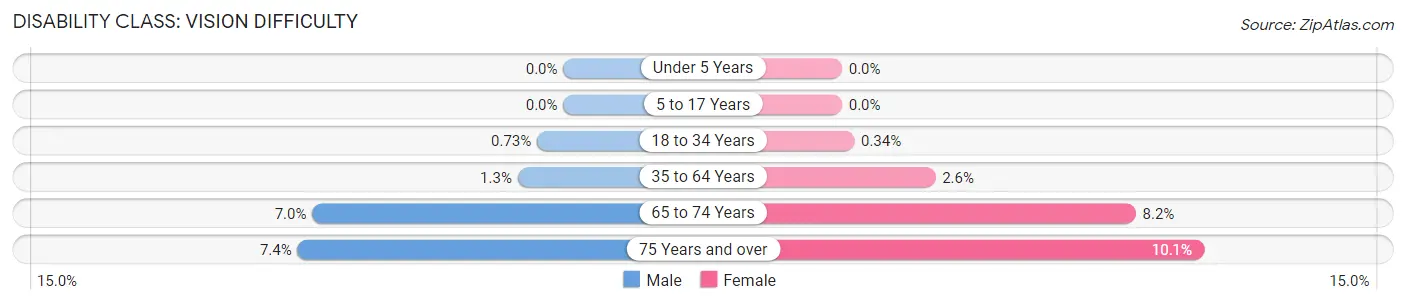
| Age Bracket | Male | Female |
| Under 5 Years | 0 (0.0%) | 0 (0.0%) |
| 5 to 17 Years | 0 (0.0%) | 0 (0.0%) |
| 18 to 34 Years | 16 (0.7%) | 6 (0.3%) |
| 35 to 64 Years | 43 (1.3%) | 93 (2.6%) |
| 65 to 74 Years | 54 (7.0%) | 87 (8.2%) |
| 75 Years and over | 52 (7.4%) | 62 (10.1%) |
Disability Class: Cognitive Difficulty
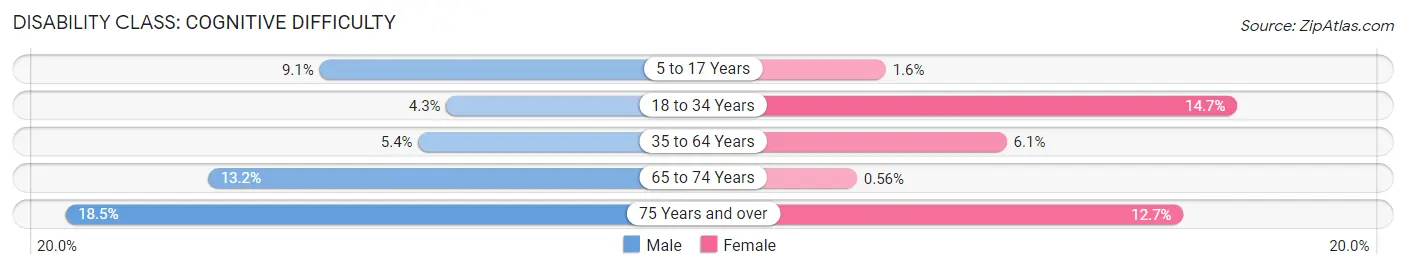
| Age Bracket | Male | Female |
| 5 to 17 Years | 148 (9.0%) | 23 (1.6%) |
| 18 to 34 Years | 95 (4.3%) | 260 (14.7%) |
| 35 to 64 Years | 182 (5.4%) | 219 (6.1%) |
| 65 to 74 Years | 102 (13.2%) | 6 (0.6%) |
| 75 Years and over | 130 (18.5%) | 78 (12.7%) |
Disability Class: Ambulatory Difficulty
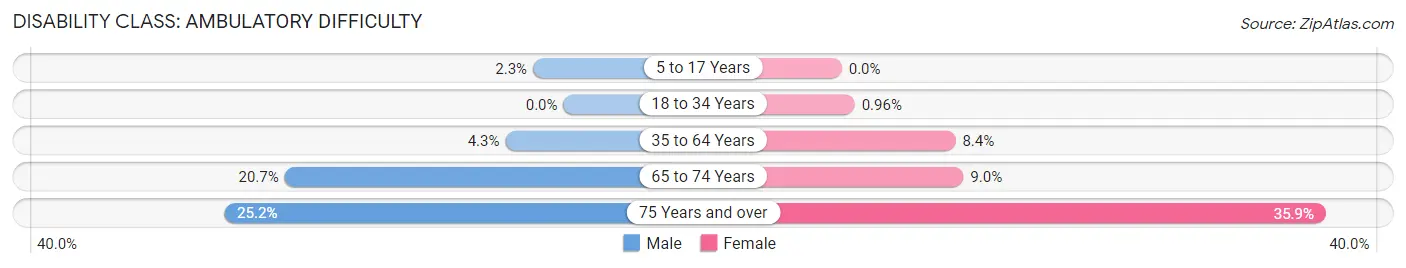
| Age Bracket | Male | Female |
| 5 to 17 Years | 37 (2.3%) | 0 (0.0%) |
| 18 to 34 Years | 0 (0.0%) | 17 (1.0%) |
| 35 to 64 Years | 146 (4.3%) | 302 (8.4%) |
| 65 to 74 Years | 160 (20.7%) | 96 (9.0%) |
| 75 Years and over | 177 (25.2%) | 221 (35.9%) |
Disability Class: Self-Care Difficulty
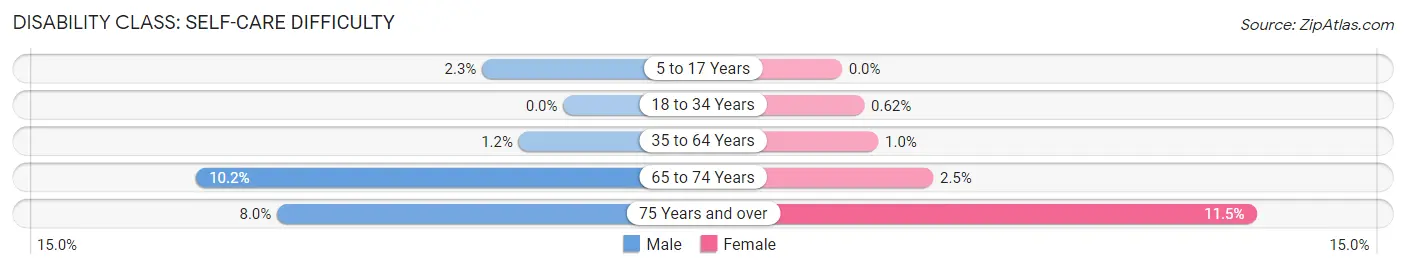
| Age Bracket | Male | Female |
| 5 to 17 Years | 37 (2.3%) | 0 (0.0%) |
| 18 to 34 Years | 0 (0.0%) | 11 (0.6%) |
| 35 to 64 Years | 42 (1.2%) | 36 (1.0%) |
| 65 to 74 Years | 79 (10.2%) | 27 (2.5%) |
| 75 Years and over | 56 (8.0%) | 71 (11.5%) |
Technology Access in Newton
Computing Device Access in Newton
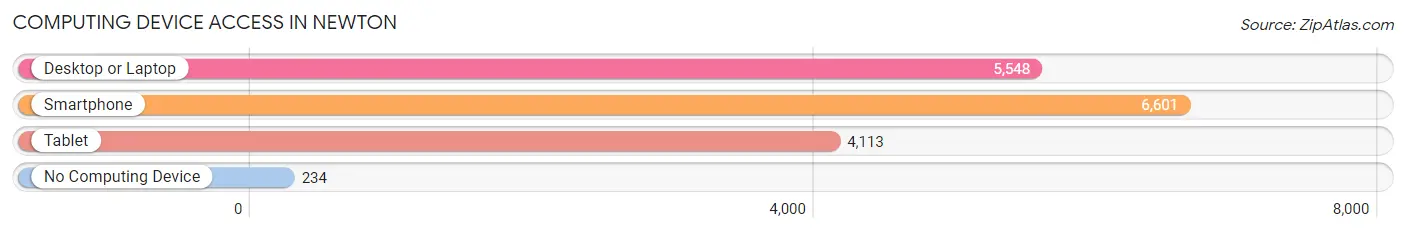
| Device Type | # Households | % Households |
| Desktop or Laptop | 5,548 | 76.1% |
| Smartphone | 6,601 | 90.5% |
| Tablet | 4,113 | 56.4% |
| No Computing Device | 234 | 3.2% |
| Total | 7,291 | 100.0% |
Internet Access in Newton
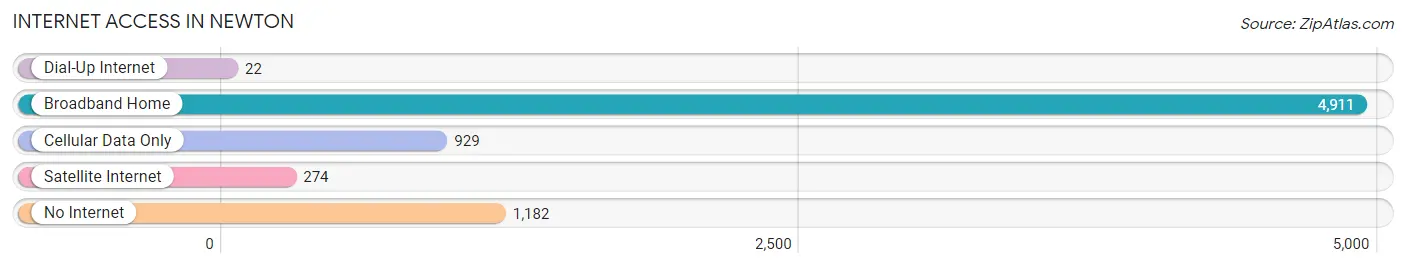
| Internet Type | # Households | % Households |
| Dial-Up Internet | 22 | 0.3% |
| Broadband Home | 4,911 | 67.4% |
| Cellular Data Only | 929 | 12.7% |
| Satellite Internet | 274 | 3.8% |
| No Internet | 1,182 | 16.2% |
| Total | 7,291 | 100.0% |
Newton Summary
Newton, Kansas is a city located in Harvey County, Kansas, United States. It is the county seat of Harvey County and is located 25 miles north of Wichita. The population was 19,132 at the 2010 census.
History
Newton was founded in 1871 by two brothers, J.B. and J.W. Newton, who were looking for a place to build a railroad station. The brothers chose the site because of its proximity to the Arkansas River and the Santa Fe Trail. The city was named after the brothers and incorporated in 1872.
In 1887, the Atchison, Topeka and Santa Fe Railway built a line through the city, connecting it to Wichita and other cities in the region. This helped to spur the growth of the city and the surrounding area.
In the early 1900s, Newton was a major center for the cattle industry. The city was also home to several large flour mills, which helped to make it an important agricultural center.
Geography
Newton is located at 37°37'25" North, 97°20'45" West (37.623, -97.346). According to the United States Census Bureau, the city has a total area of 11.2 square miles (29.0 km2), of which 11.1 square miles (28.7 km2) is land and 0.1 square miles (0.3 km2) is water.
Economy
Newton is a major economic center for the region. The city is home to several large employers, including Koch Industries, Cargill, and Tyson Foods. The city is also home to several smaller businesses, including several restaurants, retail stores, and service providers.
The city is also home to several educational institutions, including Bethel College, Hesston College, and Kansas State University-Salina.
Demographics
As of the 2010 census, there were 19,132 people, 7,717 households, and 4,845 families residing in the city. The population density was 1,717.2 people per square mile (663.3/km2). There were 8,541 housing units at an average density of 767.2 per square mile (296.3/km2). The racial makeup of the city was 87.2% White, 5.3% African American, 0.7% Native American, 0.7% Asian, 0.1% Pacific Islander, 4.2% from other races, and 2.0% from two or more races. Hispanic or Latino of any race were 8.7% of the population.
There were 7,717 households, out of which 28.7% had children under the age of 18 living with them, 46.2% were married couples living together, 11.7% had a female householder with no husband present, and 37.3% were non-families. 32.2% of all households were made up of individuals, and 14.2% had someone living alone who was 65 years of age or older. The average household size was 2.37 and the average family size was 2.97.
In the city, the population was spread out, with 24.2% under the age of 18, 9.2% from 18 to 24, 25.7% from 25 to 44, 22.3% from 45 to 64, and 18.6% who were 65 years of age or older. The median age was 38 years. For every 100 females, there were 91.2 males. For every 100 females age 18 and over, there were 87.3 males.
The median income for a household in the city was $37,845, and the median income for a family was $45,945. Males had a median income of $32,917 versus $25,945 for females. The per capita income for the city was $19,945. About 8.2% of families and 11.2% of the population were below the poverty line, including 15.2% of those under age 18 and 8.2% of those age 65 or over.
Common Questions
What is Per Capita Income in Newton?
Per Capita income in Newton is $32,192.
What is the Median Family Income in Newton?
Median Family Income in Newton is $77,538.
What is the Median Household income in Newton?
Median Household Income in Newton is $66,528.
What is Income or Wage Gap in Newton?
Income or Wage Gap in Newton is 26.4%.
Women in Newton earn 73.6 cents for every dollar earned by a man.
What is Family Income Deficit in Newton?
Family Income Deficit in Newton is $6,638.
Families that are below poverty line in Newton earn $6,638 less on average than the poverty threshold level.
What is Inequality or Gini Index in Newton?
Inequality or Gini Index in Newton is 0.38.
What is the Total Population of Newton?
Total Population of Newton is 18,527.
What is the Total Male Population of Newton?
Total Male Population of Newton is 9,352.
What is the Total Female Population of Newton?
Total Female Population of Newton is 9,175.
What is the Ratio of Males per 100 Females in Newton?
There are 101.93 Males per 100 Females in Newton.
What is the Ratio of Females per 100 Males in Newton?
There are 98.11 Females per 100 Males in Newton.
What is the Median Population Age in Newton?
Median Population Age in Newton is 40.1 Years.
What is the Average Family Size in Newton
Average Family Size in Newton is 3.0 People.
What is the Average Household Size in Newton
Average Household Size in Newton is 2.5 People.
How Large is the Labor Force in Newton?
There are 10,199 People in the Labor Forcein in Newton.
What is the Percentage of People in the Labor Force in Newton?
69.4% of People are in the Labor Force in Newton.
What is the Unemployment Rate in Newton?
Unemployment Rate in Newton is 5.3%.