Marion, KS Map & Demographics
Marion Map
Marion Overview
$31,465
PER CAPITA INCOME
$78,750
AVG FAMILY INCOME
$55,542
AVG HOUSEHOLD INCOME
52.3%
WAGE / INCOME GAP [ % ]
47.7¢/ $1
WAGE / INCOME GAP [ $ ]
0.38
INEQUALITY / GINI INDEX
1,837
TOTAL POPULATION
856
MALE POPULATION
981
FEMALE POPULATION
87.26
MALES / 100 FEMALES
114.60
FEMALES / 100 MALES
47.0
MEDIAN AGE
2.8
AVG FAMILY SIZE
2.1
AVG HOUSEHOLD SIZE
840
LABOR FORCE [ PEOPLE ]
57.8%
PERCENT IN LABOR FORCE
Marion Zip Codes
Marion Area Codes
Income in Marion
Income Overview in Marion
Per Capita Income in Marion is $31,465, while median incomes of families and households are $78,750 and $55,542 respectively.
| Characteristic | Number | Measure |
| Per Capita Income | 1,837 | $31,465 |
| Median Family Income | 496 | $78,750 |
| Mean Family Income | 496 | $87,800 |
| Median Household Income | 839 | $55,542 |
| Mean Household Income | 839 | $68,707 |
| Income Deficit | 496 | $0 |
| Wage / Income Gap (%) | 1,837 | 52.29% |
| Wage / Income Gap ($) | 1,837 | 47.71¢ per $1 |
| Gini / Inequality Index | 1,837 | 0.38 |
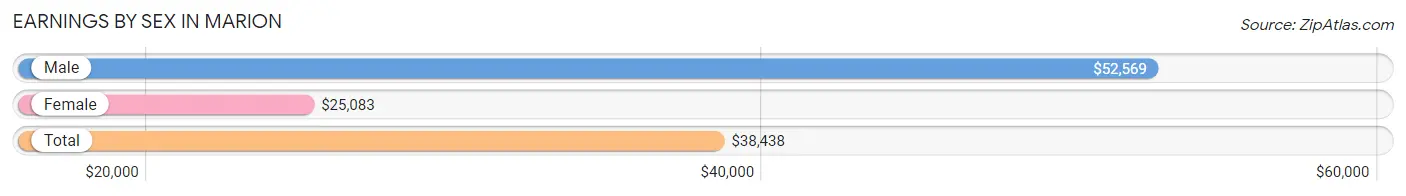
Earnings by Sex in Marion
Average Earnings in Marion are $38,438, $52,569 for men and $25,083 for women, a difference of 52.3%.
| Sex | Number | Average Earnings |
| Male | 460 (52.4%) | $52,569 |
| Female | 417 (47.5%) | $25,083 |
| Total | 877 (100.0%) | $38,438 |
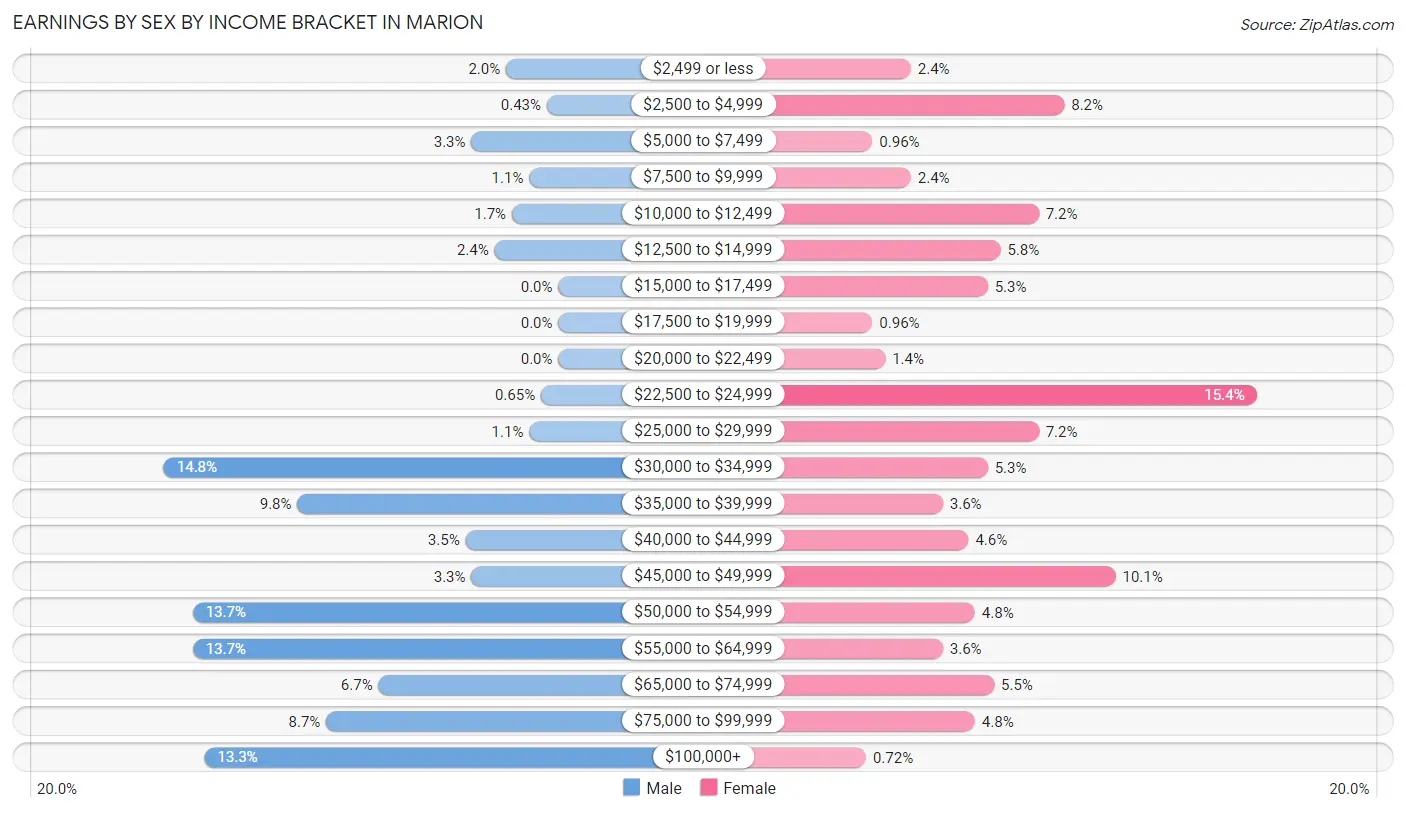
Earnings by Sex by Income Bracket in Marion
The most common earnings brackets in Marion are $30,000 to $34,999 for men (68 | 14.8%) and $22,500 to $24,999 for women (64 | 15.3%).
| Income | Male | Female |
| $2,499 or less | 9 (2.0%) | 10 (2.4%) |
| $2,500 to $4,999 | 2 (0.4%) | 34 (8.2%) |
| $5,000 to $7,499 | 15 (3.3%) | 4 (1.0%) |
| $7,500 to $9,999 | 5 (1.1%) | 10 (2.4%) |
| $10,000 to $12,499 | 8 (1.7%) | 30 (7.2%) |
| $12,500 to $14,999 | 11 (2.4%) | 24 (5.8%) |
| $15,000 to $17,499 | 0 (0.0%) | 22 (5.3%) |
| $17,500 to $19,999 | 0 (0.0%) | 4 (1.0%) |
| $20,000 to $22,499 | 0 (0.0%) | 6 (1.4%) |
| $22,500 to $24,999 | 3 (0.6%) | 64 (15.3%) |
| $25,000 to $29,999 | 5 (1.1%) | 30 (7.2%) |
| $30,000 to $34,999 | 68 (14.8%) | 22 (5.3%) |
| $35,000 to $39,999 | 45 (9.8%) | 15 (3.6%) |
| $40,000 to $44,999 | 16 (3.5%) | 19 (4.6%) |
| $45,000 to $49,999 | 15 (3.3%) | 42 (10.1%) |
| $50,000 to $54,999 | 63 (13.7%) | 20 (4.8%) |
| $55,000 to $64,999 | 63 (13.7%) | 15 (3.6%) |
| $65,000 to $74,999 | 31 (6.7%) | 23 (5.5%) |
| $75,000 to $99,999 | 40 (8.7%) | 20 (4.8%) |
| $100,000+ | 61 (13.3%) | 3 (0.7%) |
| Total | 460 (100.0%) | 417 (100.0%) |
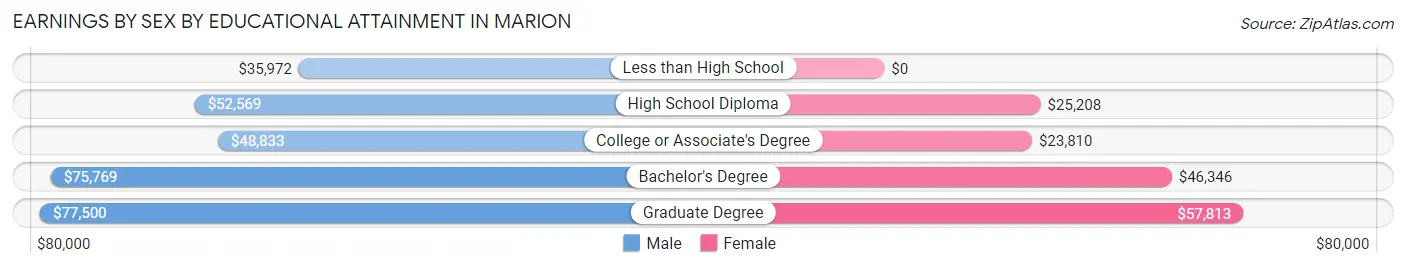
Earnings by Sex by Educational Attainment in Marion
Average earnings in Marion are $53,854 for men and $27,250 for women, a difference of 49.4%. Men with an educational attainment of graduate degree enjoy the highest average annual earnings of $77,500, while those with less than high school education earn the least with $35,972. Women with an educational attainment of graduate degree earn the most with the average annual earnings of $57,813, while those with college or associate's degree education have the smallest earnings of $23,810.
| Educational Attainment | Male Income | Female Income |
| Less than High School | $35,972 | $0 |
| High School Diploma | $52,569 | $25,208 |
| College or Associate's Degree | $48,833 | $23,810 |
| Bachelor's Degree | $75,769 | $46,346 |
| Graduate Degree | $77,500 | $57,813 |
| Total | $53,854 | $27,250 |
Family Income in Marion
Family Income Brackets in Marion
According to the Marion family income data, there are 139 families falling into the $75,000 to $99,999 income range, which is the most common income bracket and makes up 28.0% of all families.
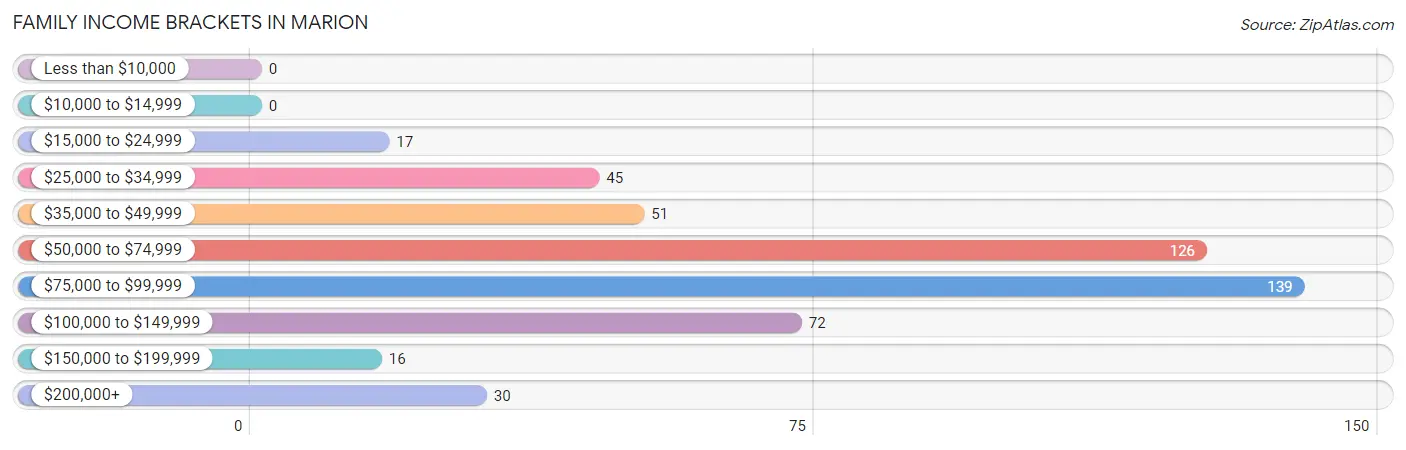
| Income Bracket | # Families | % Families |
| Less than $10,000 | 0 | 0.0% |
| $10,000 to $14,999 | 0 | 0.0% |
| $15,000 to $24,999 | 17 | 3.4% |
| $25,000 to $34,999 | 45 | 9.1% |
| $35,000 to $49,999 | 51 | 10.3% |
| $50,000 to $74,999 | 126 | 25.4% |
| $75,000 to $99,999 | 139 | 28.0% |
| $100,000 to $149,999 | 72 | 14.5% |
| $150,000 to $199,999 | 16 | 3.2% |
| $200,000+ | 30 | 6.0% |
Family Income by Famaliy Size in Marion
4-person families (62 | 12.5%) account for the highest median family income in Marion with $87,833 per family, while 2-person families (272 | 54.8%) have the highest median income of $42,768 per family member.
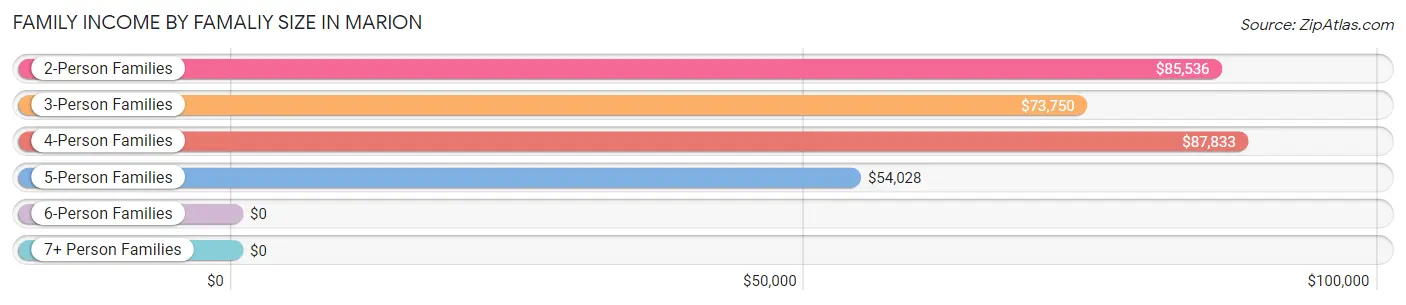
| Income Bracket | # Families | Median Income |
| 2-Person Families | 272 (54.8%) | $85,536 |
| 3-Person Families | 121 (24.4%) | $73,750 |
| 4-Person Families | 62 (12.5%) | $87,833 |
| 5-Person Families | 19 (3.8%) | $54,028 |
| 6-Person Families | 7 (1.4%) | $0 |
| 7+ Person Families | 15 (3.0%) | $0 |
| Total | 496 (100.0%) | $78,750 |
Family Income by Number of Earners in Marion
The median family income in Marion is $78,750, with families comprising 3+ earners (24) having the highest median family income of $131,250, while families with no earners (69) have the lowest median family income of $45,417, accounting for 4.8% and 13.9% of families, respectively.
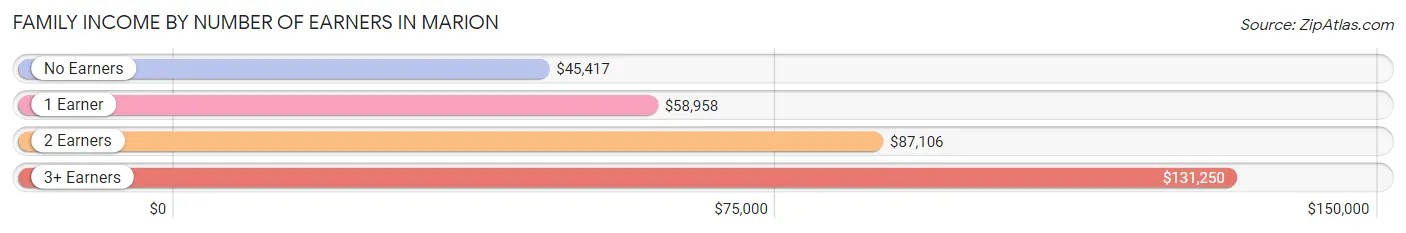
| Number of Earners | # Families | Median Income |
| No Earners | 69 (13.9%) | $45,417 |
| 1 Earner | 180 (36.3%) | $58,958 |
| 2 Earners | 223 (45.0%) | $87,106 |
| 3+ Earners | 24 (4.8%) | $131,250 |
| Total | 496 (100.0%) | $78,750 |
Household Income in Marion
Household Income Brackets in Marion
With 199 households falling in the category, the $50,000 to $74,999 income range is the most frequent in Marion, accounting for 23.7% of all households. In contrast, only 16 households (1.9%) fall into the $150,000 to $199,999 income bracket, making it the least populous group.
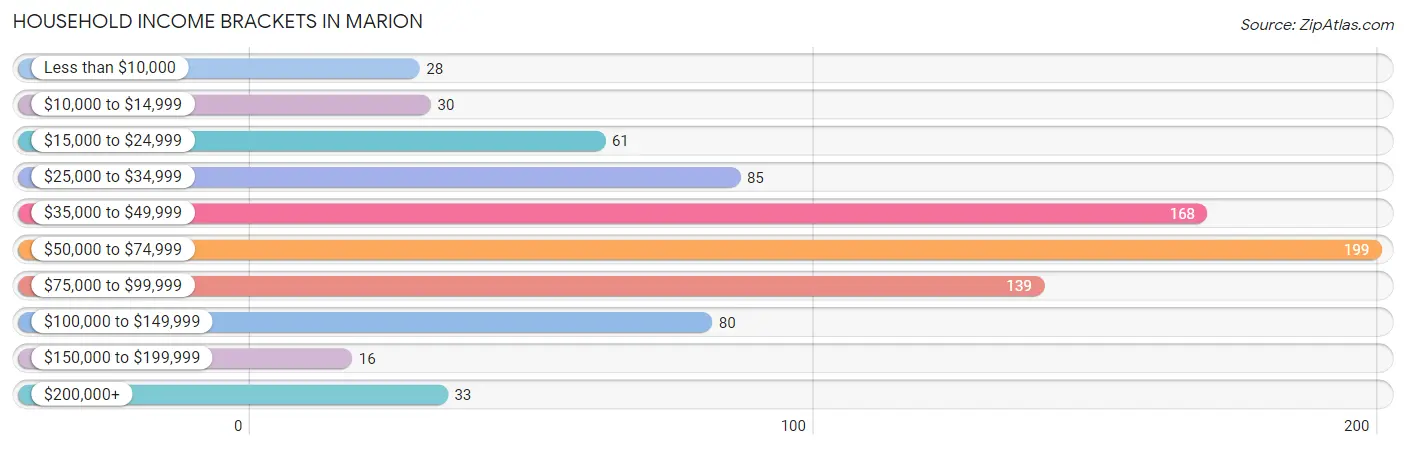
| Income Bracket | # Households | % Households |
| Less than $10,000 | 28 | 3.3% |
| $10,000 to $14,999 | 30 | 3.6% |
| $15,000 to $24,999 | 61 | 7.3% |
| $25,000 to $34,999 | 85 | 10.1% |
| $35,000 to $49,999 | 168 | 20.0% |
| $50,000 to $74,999 | 199 | 23.7% |
| $75,000 to $99,999 | 139 | 16.6% |
| $100,000 to $149,999 | 80 | 9.5% |
| $150,000 to $199,999 | 16 | 1.9% |
| $200,000+ | 33 | 3.9% |
Household Income by Householder Age in Marion
The median household income in Marion is $55,542, with the highest median household income of $64,048 found in the 45 to 64 years age bracket for the primary householder. A total of 236 households (28.1%) fall into this category. Meanwhile, the 15 to 24 years age bracket for the primary householder has the lowest median household income of $0, with 19 households (2.3%) in this group.
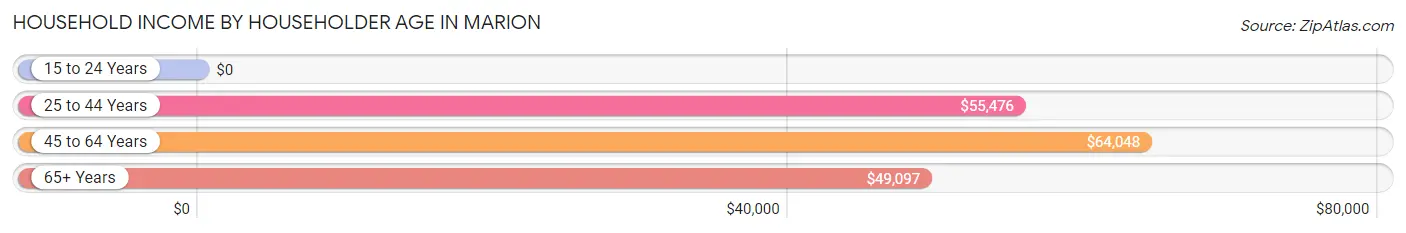
| Income Bracket | # Households | Median Income |
| 15 to 24 Years | 19 (2.3%) | $0 |
| 25 to 44 Years | 250 (29.8%) | $55,476 |
| 45 to 64 Years | 236 (28.1%) | $64,048 |
| 65+ Years | 334 (39.8%) | $49,097 |
| Total | 839 (100.0%) | $55,542 |
Poverty in Marion
Income Below Poverty by Sex and Age in Marion
With 5.3% poverty level for males and 10.4% for females among the residents of Marion, under 5 year old males and 25 to 34 year old females are the most vulnerable to poverty, with 13 males (19.1%) and 31 females (26.3%) in their respective age groups living below the poverty level.
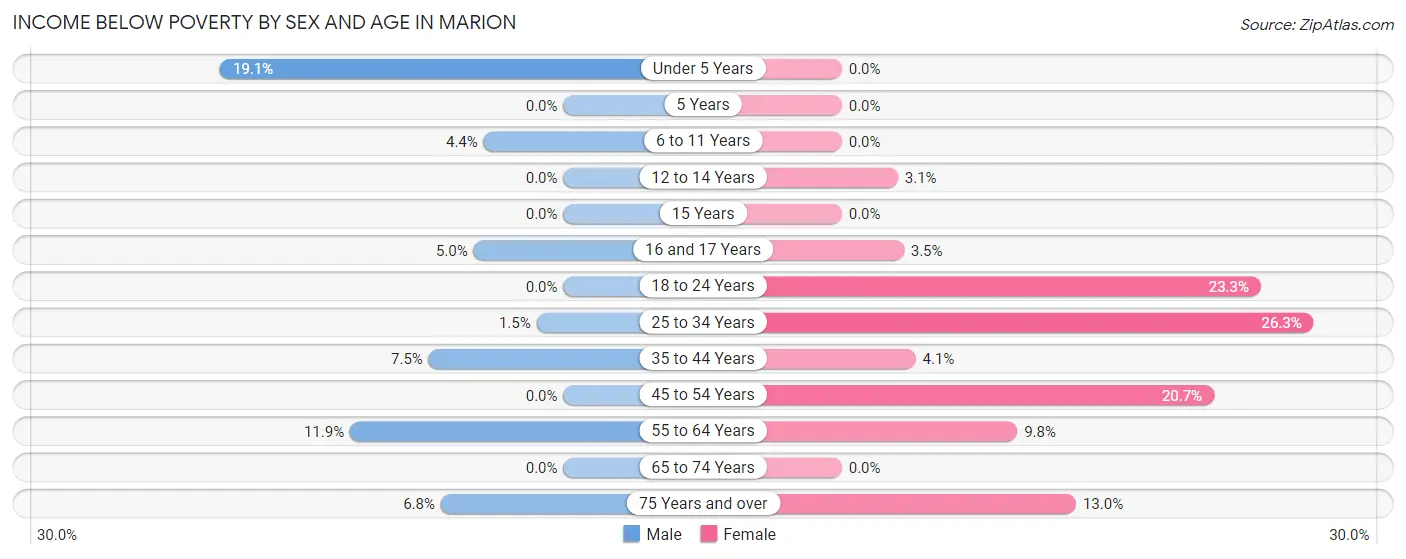
| Age Bracket | Male | Female |
| Under 5 Years | 13 (19.1%) | 0 (0.0%) |
| 5 Years | 0 (0.0%) | 0 (0.0%) |
| 6 to 11 Years | 4 (4.4%) | 0 (0.0%) |
| 12 to 14 Years | 0 (0.0%) | 1 (3.1%) |
| 15 Years | 0 (0.0%) | 0 (0.0%) |
| 16 and 17 Years | 1 (5.0%) | 1 (3.5%) |
| 18 to 24 Years | 0 (0.0%) | 7 (23.3%) |
| 25 to 34 Years | 2 (1.5%) | 31 (26.3%) |
| 35 to 44 Years | 6 (7.5%) | 3 (4.1%) |
| 45 to 54 Years | 0 (0.0%) | 23 (20.7%) |
| 55 to 64 Years | 12 (11.9%) | 13 (9.8%) |
| 65 to 74 Years | 0 (0.0%) | 0 (0.0%) |
| 75 Years and over | 6 (6.8%) | 21 (13.0%) |
| Total | 44 (5.3%) | 100 (10.4%) |
Income Above Poverty by Sex and Age in Marion
According to the poverty statistics in Marion, males aged 5 years and females aged under 5 years are the age groups that are most secure financially, with 100.0% of males and 100.0% of females in these age groups living above the poverty line.
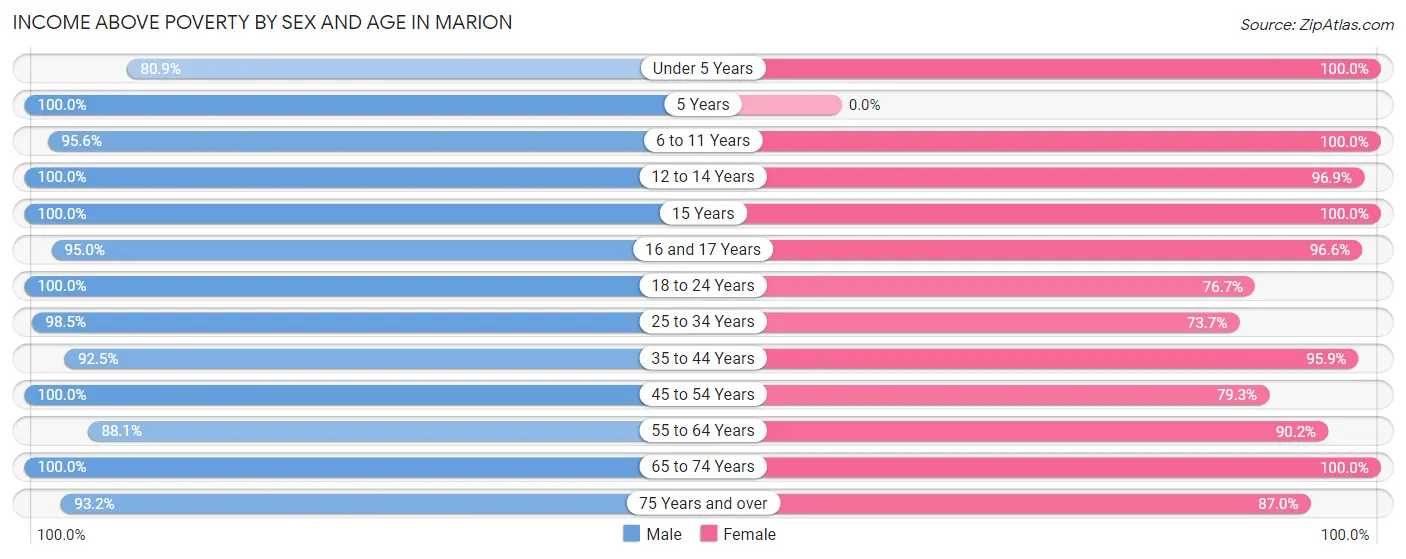
| Age Bracket | Male | Female |
| Under 5 Years | 55 (80.9%) | 69 (100.0%) |
| 5 Years | 38 (100.0%) | 0 (0.0%) |
| 6 to 11 Years | 86 (95.6%) | 33 (100.0%) |
| 12 to 14 Years | 22 (100.0%) | 31 (96.9%) |
| 15 Years | 11 (100.0%) | 16 (100.0%) |
| 16 and 17 Years | 19 (95.0%) | 28 (96.6%) |
| 18 to 24 Years | 16 (100.0%) | 23 (76.7%) |
| 25 to 34 Years | 132 (98.5%) | 87 (73.7%) |
| 35 to 44 Years | 74 (92.5%) | 70 (95.9%) |
| 45 to 54 Years | 87 (100.0%) | 88 (79.3%) |
| 55 to 64 Years | 89 (88.1%) | 120 (90.2%) |
| 65 to 74 Years | 79 (100.0%) | 154 (100.0%) |
| 75 Years and over | 82 (93.2%) | 140 (87.0%) |
| Total | 790 (94.7%) | 859 (89.6%) |
Income Below Poverty Among Married-Couple Families in Marion
The poverty statistics for married-couple families in Marion show that 0.7% or 3 of the total 402 families live below the poverty line. Families with 5 or more children have the highest poverty rate of 20.0%, comprising of 3 families. On the other hand, families with no children have the lowest poverty rate of 0.0%, which includes 0 families.
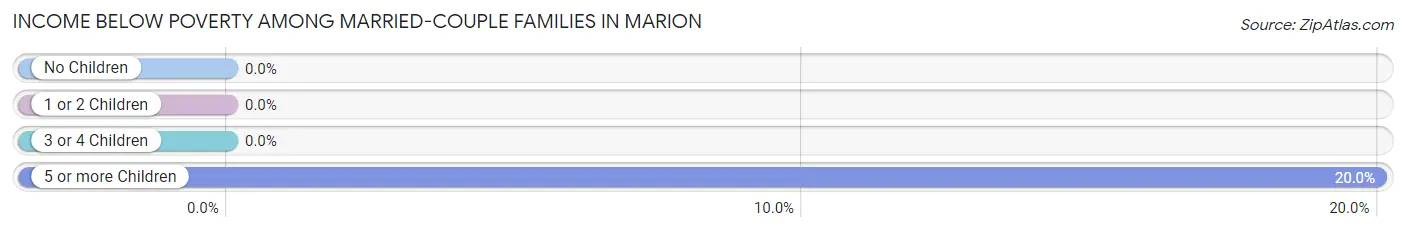
| Children | Above Poverty | Below Poverty |
| No Children | 275 (100.0%) | 0 (0.0%) |
| 1 or 2 Children | 95 (100.0%) | 0 (0.0%) |
| 3 or 4 Children | 17 (100.0%) | 0 (0.0%) |
| 5 or more Children | 12 (80.0%) | 3 (20.0%) |
| Total | 399 (99.3%) | 3 (0.7%) |
Income Below Poverty Among Single-Parent Households in Marion
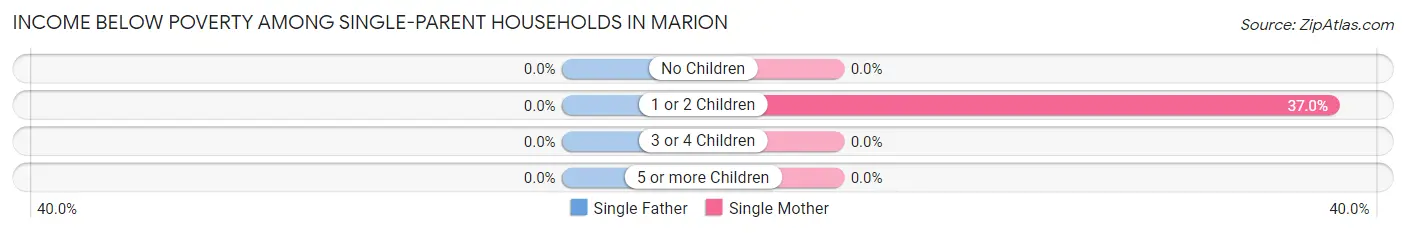
| Children | Single Father | Single Mother |
| No Children | 0 (0.0%) | 0 (0.0%) |
| 1 or 2 Children | 0 (0.0%) | 17 (37.0%) |
| 3 or 4 Children | 0 (0.0%) | 0 (0.0%) |
| 5 or more Children | 0 (0.0%) | 0 (0.0%) |
| Total | 0 (0.0%) | 17 (37.0%) |
Income Below Poverty Among Married-Couple vs Single-Parent Households in Marion
The poverty data for Marion shows that 3 of the married-couple family households (0.7%) and 17 of the single-parent households (18.1%) are living below the poverty level. Within the married-couple family households, those with 5 or more children have the highest poverty rate, with 3 households (20.0%) falling below the poverty line. Among the single-parent households, those with 1 or 2 children have the highest poverty rate, with 17 household (20.0%) living below poverty.
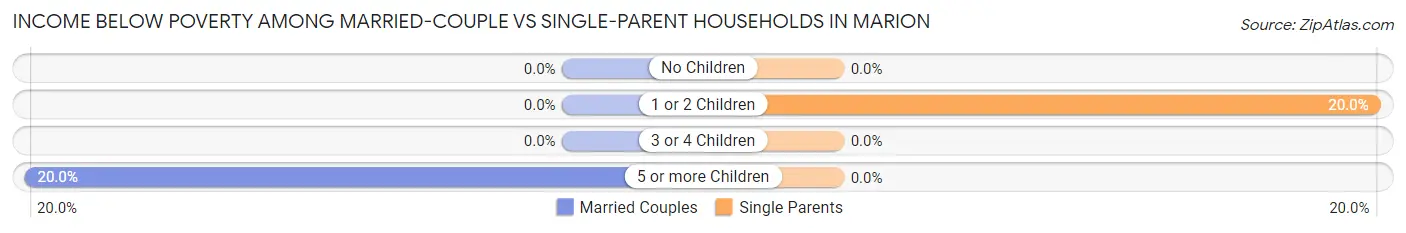
| Children | Married-Couple Families | Single-Parent Households |
| No Children | 0 (0.0%) | 0 (0.0%) |
| 1 or 2 Children | 0 (0.0%) | 17 (20.0%) |
| 3 or 4 Children | 0 (0.0%) | 0 (0.0%) |
| 5 or more Children | 3 (20.0%) | 0 (0.0%) |
| Total | 3 (0.7%) | 17 (18.1%) |
Race in Marion
The most populous races in Marion are White / Caucasian (1,736 | 94.5%), Hispanic or Latino (60 | 3.3%), and Two or more Races (54 | 2.9%).
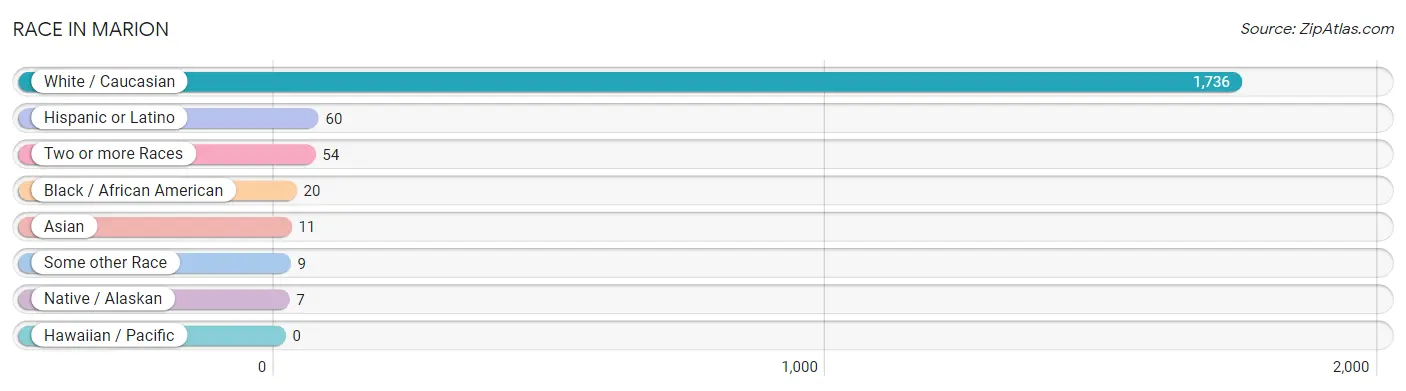
| Race | # Population | % Population |
| Asian | 11 | 0.6% |
| Black / African American | 20 | 1.1% |
| Hawaiian / Pacific | 0 | 0.0% |
| Hispanic or Latino | 60 | 3.3% |
| Native / Alaskan | 7 | 0.4% |
| White / Caucasian | 1,736 | 94.5% |
| Two or more Races | 54 | 2.9% |
| Some other Race | 9 | 0.5% |
| Total | 1,837 | 100.0% |
Ancestry in Marion
The most populous ancestries reported in Marion are German (574 | 31.2%), English (298 | 16.2%), Irish (179 | 9.7%), American (143 | 7.8%), and Swedish (76 | 4.1%), together accounting for 69.1% of all Marion residents.
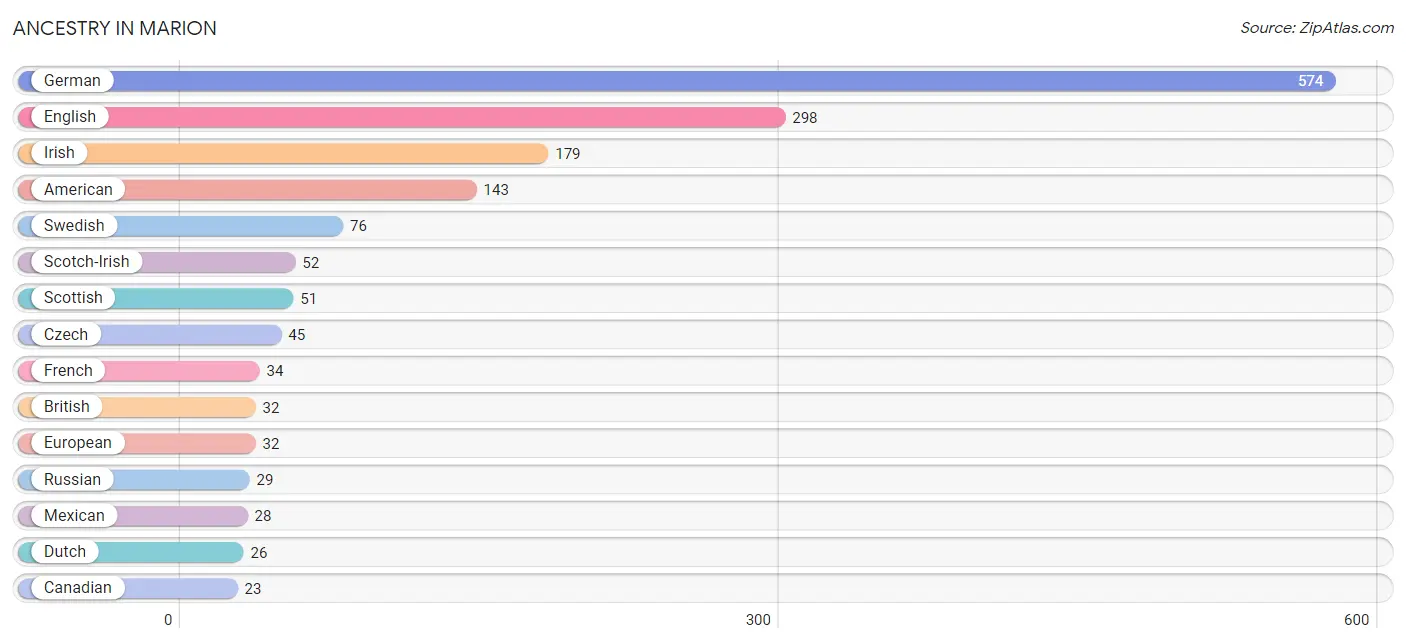
| Ancestry | # Population | % Population |
| American | 143 | 7.8% |
| British | 32 | 1.7% |
| Canadian | 23 | 1.3% |
| Cherokee | 1 | 0.1% |
| Cuban | 18 | 1.0% |
| Czech | 45 | 2.5% |
| Danish | 21 | 1.1% |
| Dutch | 26 | 1.4% |
| English | 298 | 16.2% |
| European | 32 | 1.7% |
| French | 34 | 1.8% |
| German | 574 | 31.2% |
| Greek | 6 | 0.3% |
| Guamanian / Chamorro | 14 | 0.8% |
| Irish | 179 | 9.7% |
| Italian | 10 | 0.5% |
| Korean | 15 | 0.8% |
| Mexican | 28 | 1.5% |
| Norwegian | 9 | 0.5% |
| Polish | 8 | 0.4% |
| Russian | 29 | 1.6% |
| Scotch-Irish | 52 | 2.8% |
| Scottish | 51 | 2.8% |
| Swedish | 76 | 4.1% |
| Thai | 11 | 0.6% | View All 25 Rows |
Immigrants in Marion
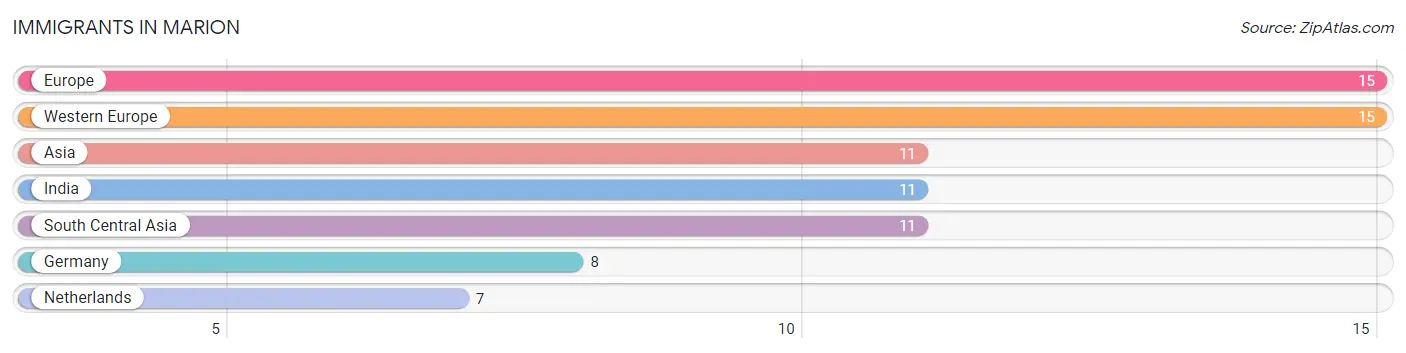
The most numerous immigrant groups reported in Marion came from Europe (15 | 0.8%), Western Europe (15 | 0.8%), Asia (11 | 0.6%), India (11 | 0.6%), and South Central Asia (11 | 0.6%), together accounting for 3.4% of all Marion residents.
| Immigration Origin | # Population | % Population |
| Asia | 11 | 0.6% |
| Europe | 15 | 0.8% |
| Germany | 8 | 0.4% |
| India | 11 | 0.6% |
| Netherlands | 7 | 0.4% |
| South Central Asia | 11 | 0.6% |
| Western Europe | 15 | 0.8% | View All 7 Rows |
Sex and Age in Marion
Sex and Age in Marion
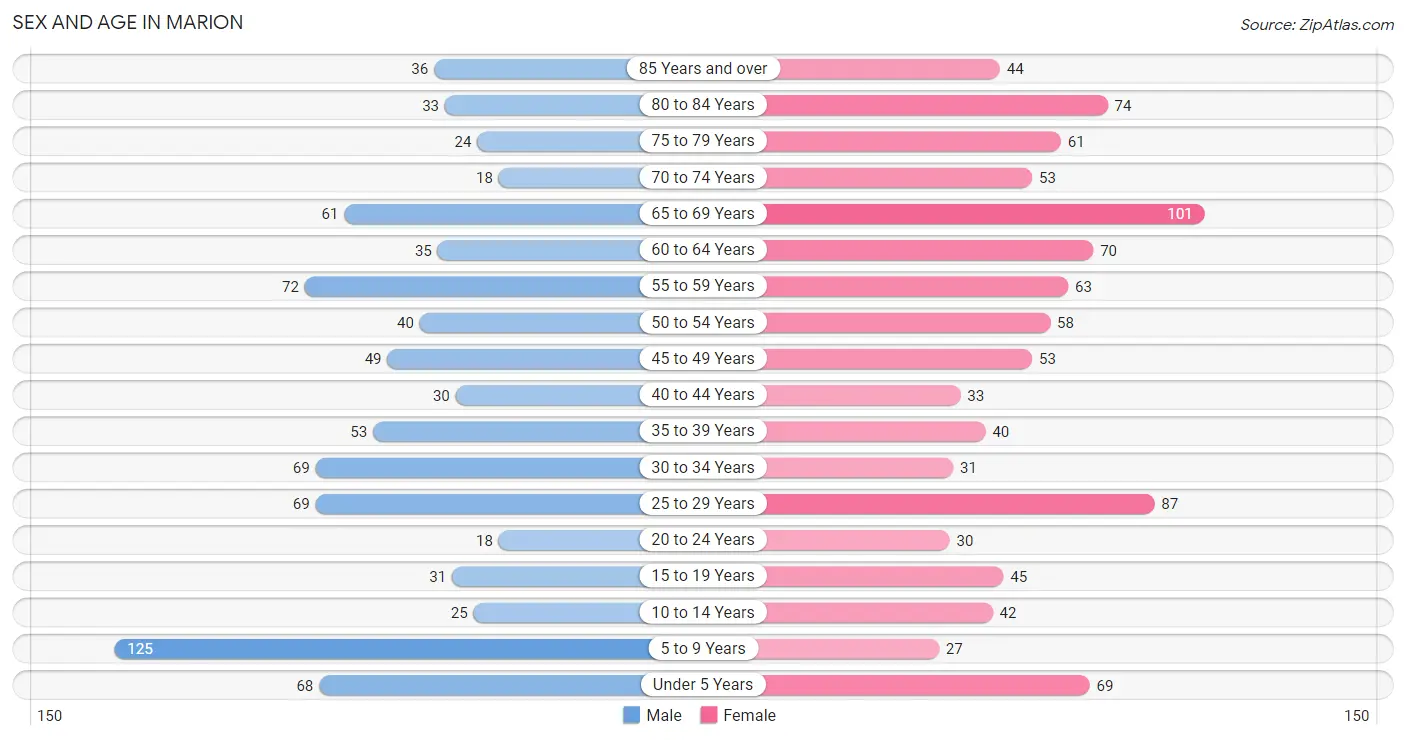
The most populous age groups in Marion are 5 to 9 Years (125 | 14.6%) for men and 65 to 69 Years (101 | 10.3%) for women.
| Age Bracket | Male | Female |
| Under 5 Years | 68 (7.9%) | 69 (7.0%) |
| 5 to 9 Years | 125 (14.6%) | 27 (2.8%) |
| 10 to 14 Years | 25 (2.9%) | 42 (4.3%) |
| 15 to 19 Years | 31 (3.6%) | 45 (4.6%) |
| 20 to 24 Years | 18 (2.1%) | 30 (3.1%) |
| 25 to 29 Years | 69 (8.1%) | 87 (8.9%) |
| 30 to 34 Years | 69 (8.1%) | 31 (3.2%) |
| 35 to 39 Years | 53 (6.2%) | 40 (4.1%) |
| 40 to 44 Years | 30 (3.5%) | 33 (3.4%) |
| 45 to 49 Years | 49 (5.7%) | 53 (5.4%) |
| 50 to 54 Years | 40 (4.7%) | 58 (5.9%) |
| 55 to 59 Years | 72 (8.4%) | 63 (6.4%) |
| 60 to 64 Years | 35 (4.1%) | 70 (7.1%) |
| 65 to 69 Years | 61 (7.1%) | 101 (10.3%) |
| 70 to 74 Years | 18 (2.1%) | 53 (5.4%) |
| 75 to 79 Years | 24 (2.8%) | 61 (6.2%) |
| 80 to 84 Years | 33 (3.9%) | 74 (7.5%) |
| 85 Years and over | 36 (4.2%) | 44 (4.5%) |
| Total | 856 (100.0%) | 981 (100.0%) |
Families and Households in Marion
Median Family Size in Marion
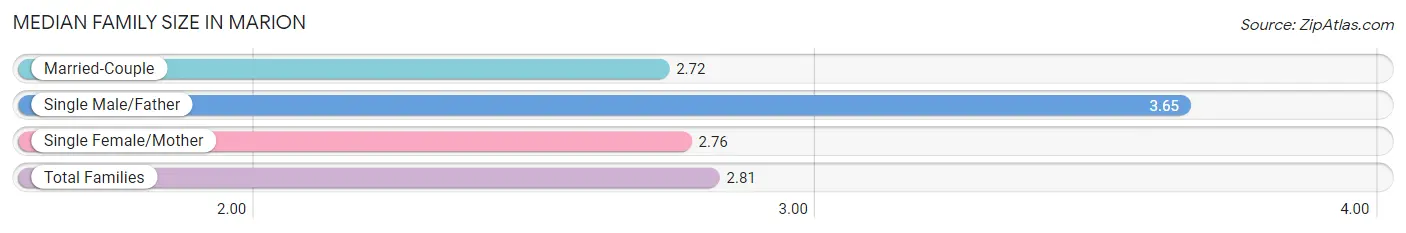
The median family size in Marion is 2.81 persons per family, with single male/father families (48 | 9.7%) accounting for the largest median family size of 3.65 persons per family. On the other hand, married-couple families (402 | 81.0%) represent the smallest median family size with 2.72 persons per family.
| Family Type | # Families | Family Size |
| Married-Couple | 402 (81.0%) | 2.72 |
| Single Male/Father | 48 (9.7%) | 3.65 |
| Single Female/Mother | 46 (9.3%) | 2.76 |
| Total Families | 496 (100.0%) | 2.81 |
Median Household Size in Marion
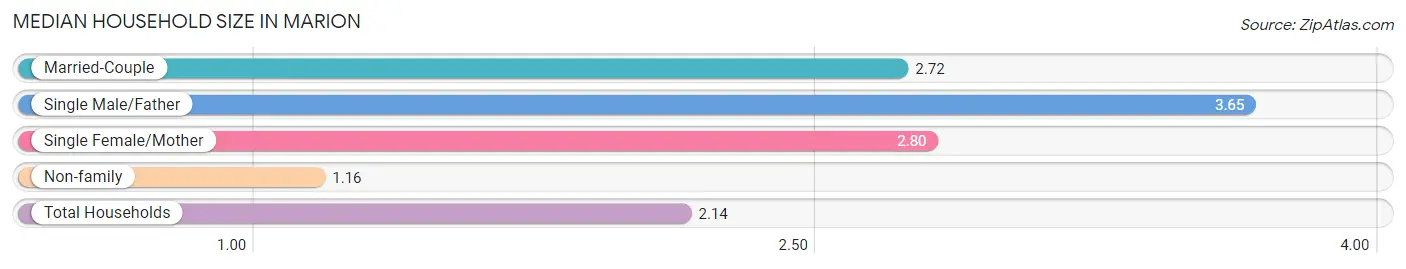
The median household size in Marion is 2.14 persons per household, with single male/father households (48 | 5.7%) accounting for the largest median household size of 3.65 persons per household. non-family households (343 | 40.9%) represent the smallest median household size with 1.16 persons per household.
| Household Type | # Households | Household Size |
| Married-Couple | 402 (47.9%) | 2.72 |
| Single Male/Father | 48 (5.7%) | 3.65 |
| Single Female/Mother | 46 (5.5%) | 2.80 |
| Non-family | 343 (40.9%) | 1.16 |
| Total Households | 839 (100.0%) | 2.14 |
Household Size by Marriage Status in Marion
Out of a total of 839 households in Marion, 496 (59.1%) are family households, while 343 (40.9%) are nonfamily households. The most numerous type of family households are 2-person households, comprising 272, and the most common type of nonfamily households are 1-person households, comprising 293.
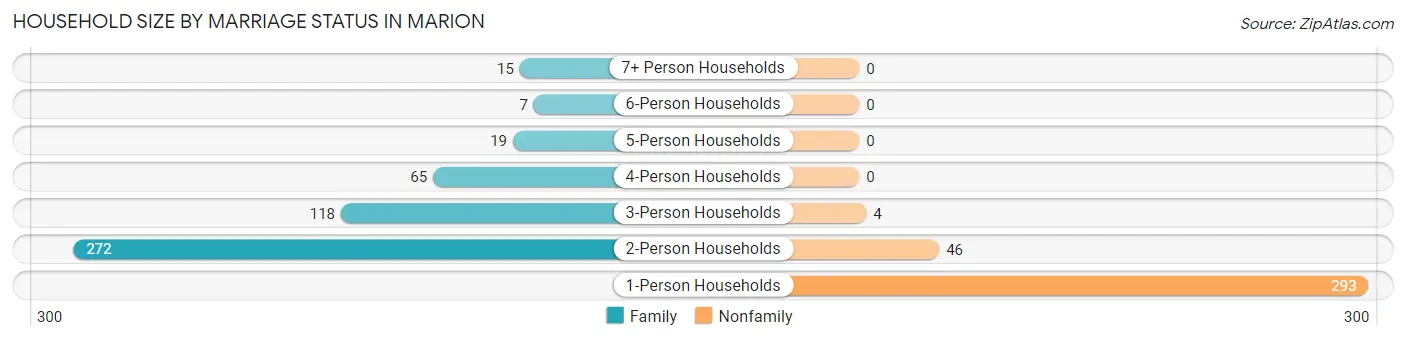
| Household Size | Family Households | Nonfamily Households |
| 1-Person Households | - | 293 (34.9%) |
| 2-Person Households | 272 (32.4%) | 46 (5.5%) |
| 3-Person Households | 118 (14.1%) | 4 (0.5%) |
| 4-Person Households | 65 (7.7%) | 0 (0.0%) |
| 5-Person Households | 19 (2.3%) | 0 (0.0%) |
| 6-Person Households | 7 (0.8%) | 0 (0.0%) |
| 7+ Person Households | 15 (1.8%) | 0 (0.0%) |
| Total | 496 (59.1%) | 343 (40.9%) |
Female Fertility in Marion
Fertility by Age in Marion
Average fertility rate in Marion is 134.0 births per 1,000 women. Women in the age bracket of 20 to 34 years have the highest fertility rate with 277.0 births per 1,000 women. Women in the age bracket of 20 to 34 years acount for 91.1% of all women with births.
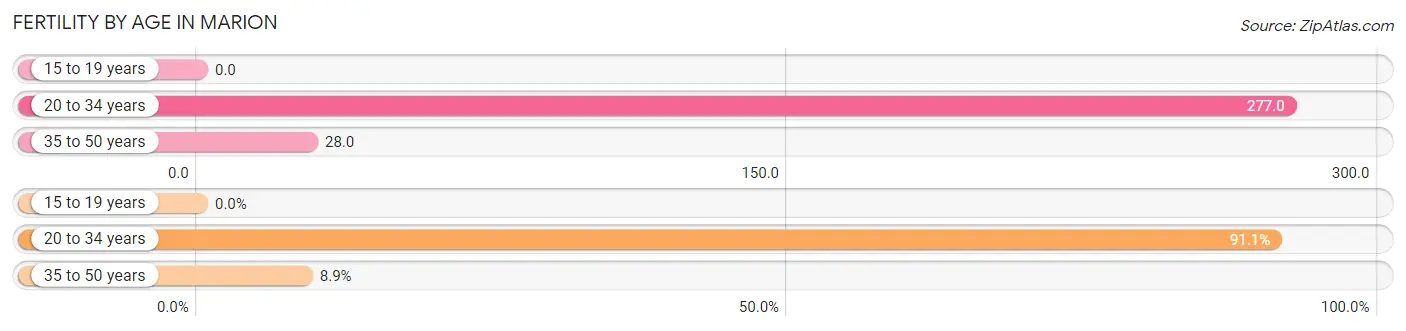
| Age Bracket | Women with Births | Births / 1,000 Women |
| 15 to 19 years | 0 (0.0%) | 0.0 |
| 20 to 34 years | 41 (91.1%) | 277.0 |
| 35 to 50 years | 4 (8.9%) | 28.0 |
| Total | 45 (100.0%) | 134.0 |
Fertility by Age by Marriage Status in Marion
93.3% of women with births (45) in Marion are married. The highest percentage of unmarried women with births falls into 20 to 34 years age bracket with 7.3% of them unmarried at the time of birth, while the lowest percentage of unmarried women with births belong to 35 to 50 years age bracket with 0.0% of them unmarried.
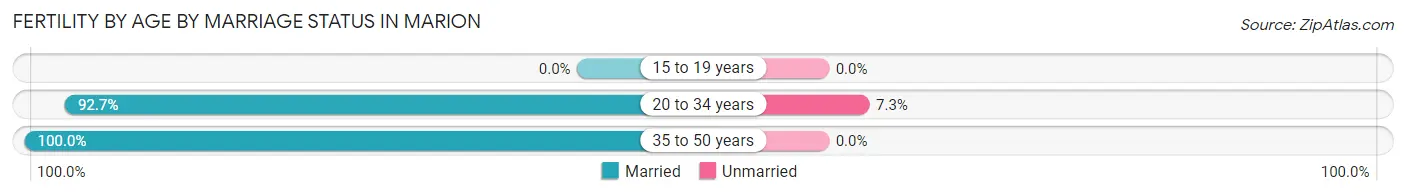
| Age Bracket | Married | Unmarried |
| 15 to 19 years | 0 (0.0%) | 0 (0.0%) |
| 20 to 34 years | 38 (92.7%) | 3 (7.3%) |
| 35 to 50 years | 4 (100.0%) | 0 (0.0%) |
| Total | 42 (93.3%) | 3 (6.7%) |
Fertility by Education in Marion
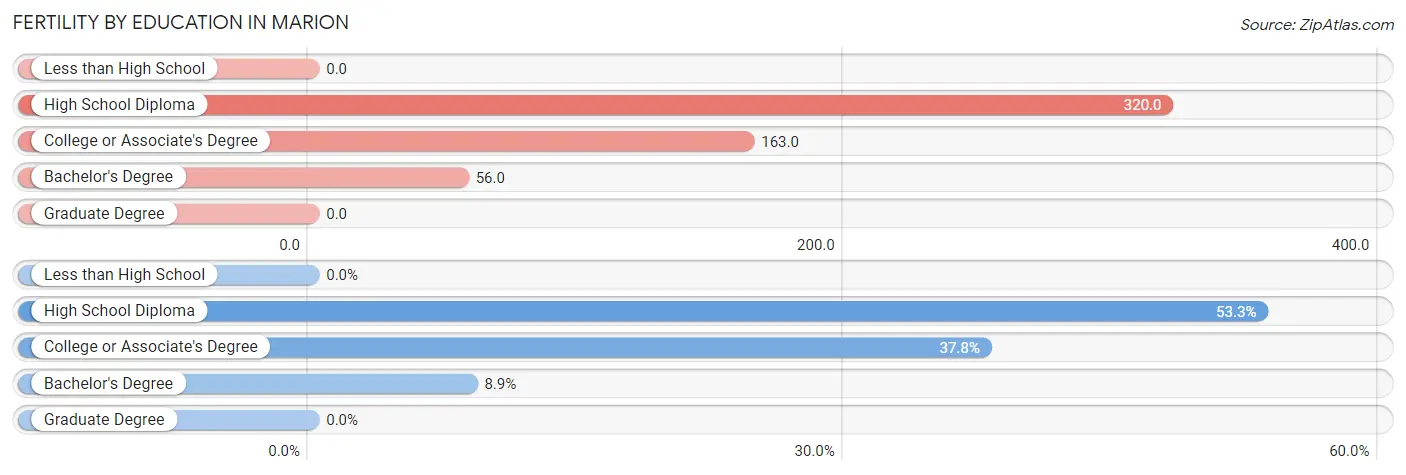
| Educational Attainment | Women with Births | Births / 1,000 Women |
| Less than High School | 0 (0.0%) | 0.0 |
| High School Diploma | 24 (53.3%) | 320.0 |
| College or Associate's Degree | 17 (37.8%) | 163.0 |
| Bachelor's Degree | 4 (8.9%) | 56.0 |
| Graduate Degree | 0 (0.0%) | 0.0 |
| Total | 45 (100.0%) | 134.0 |
Fertility by Education by Marriage Status in Marion
6.7% of women with births in Marion are unmarried. Women with the educational attainment of college or associate's degree are most likely to be married with 100.0% of them married at childbirth, while women with the educational attainment of high school diploma are least likely to be married with 12.5% of them unmarried at childbirth.
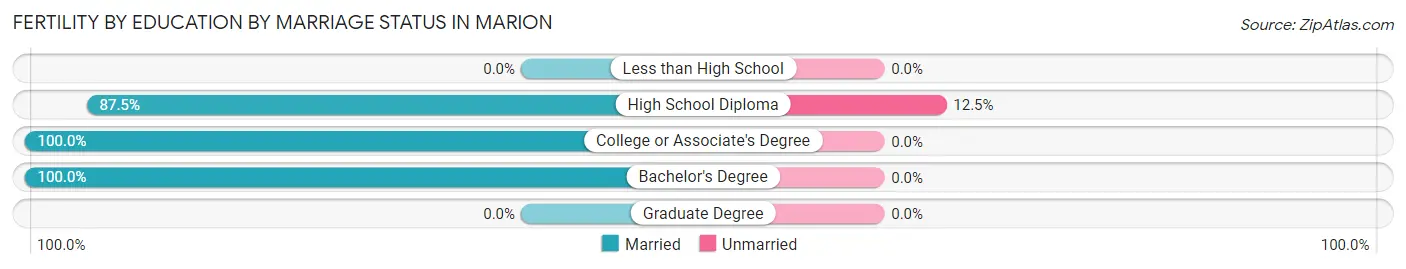
| Educational Attainment | Married | Unmarried |
| Less than High School | 0 (0.0%) | 0 (0.0%) |
| High School Diploma | 21 (87.5%) | 3 (12.5%) |
| College or Associate's Degree | 17 (100.0%) | 0 (0.0%) |
| Bachelor's Degree | 4 (100.0%) | 0 (0.0%) |
| Graduate Degree | 0 (0.0%) | 0 (0.0%) |
| Total | 42 (93.3%) | 3 (6.7%) |
Employment Characteristics in Marion
Employment by Class of Employer in Marion
Among the 836 employed individuals in Marion, private company employees (443 | 53.0%), local government employees (160 | 19.1%), and not-for-profit organizations (90 | 10.8%) make up the most common classes of employment.
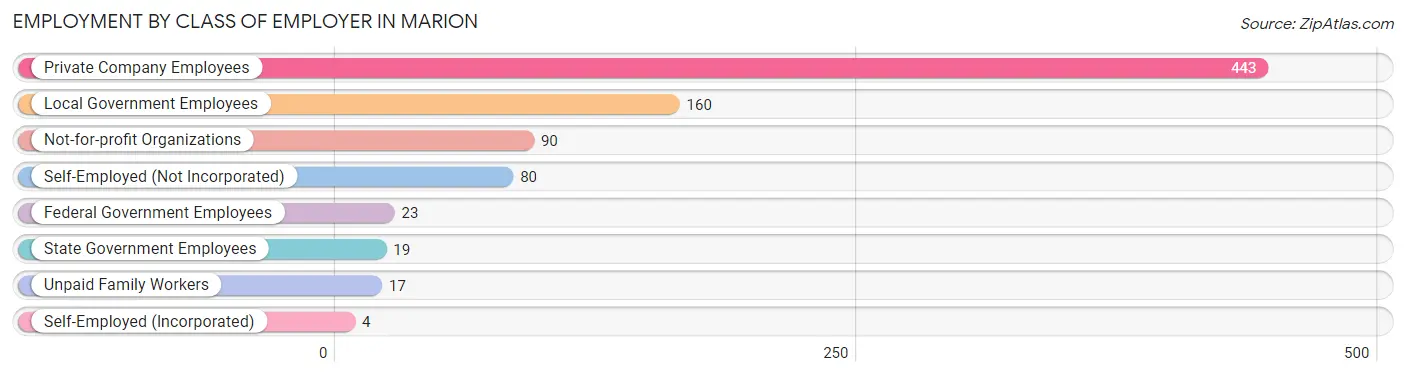
| Employer Class | # Employees | % Employees |
| Private Company Employees | 443 | 53.0% |
| Self-Employed (Incorporated) | 4 | 0.5% |
| Self-Employed (Not Incorporated) | 80 | 9.6% |
| Not-for-profit Organizations | 90 | 10.8% |
| Local Government Employees | 160 | 19.1% |
| State Government Employees | 19 | 2.3% |
| Federal Government Employees | 23 | 2.8% |
| Unpaid Family Workers | 17 | 2.0% |
| Total | 836 | 100.0% |
Employment Status by Age in Marion
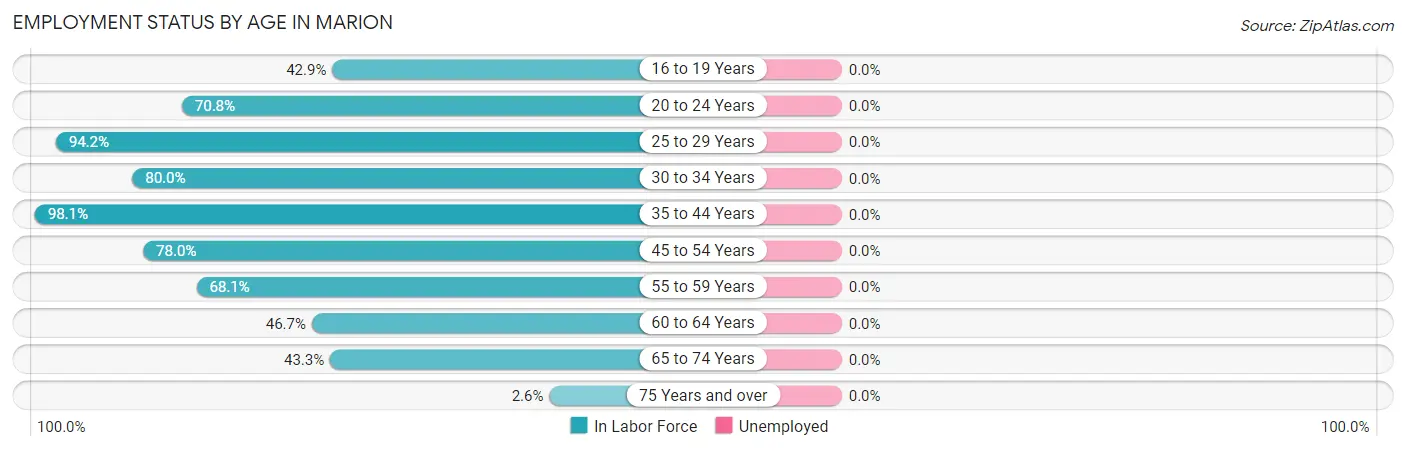
| Age Bracket | In Labor Force | Unemployed |
| 16 to 19 Years | 21 (42.9%) | 0 (0.0%) |
| 20 to 24 Years | 34 (70.8%) | 0 (0.0%) |
| 25 to 29 Years | 147 (94.2%) | 0 (0.0%) |
| 30 to 34 Years | 80 (80.0%) | 0 (0.0%) |
| 35 to 44 Years | 153 (98.1%) | 0 (0.0%) |
| 45 to 54 Years | 156 (78.0%) | 0 (0.0%) |
| 55 to 59 Years | 92 (68.1%) | 0 (0.0%) |
| 60 to 64 Years | 49 (46.7%) | 0 (0.0%) |
| 65 to 74 Years | 101 (43.3%) | 0 (0.0%) |
| 75 Years and over | 7 (2.6%) | 0 (0.0%) |
| Total | 840 (57.8%) | 0 (0.0%) |
Employment Status by Educational Attainment in Marion
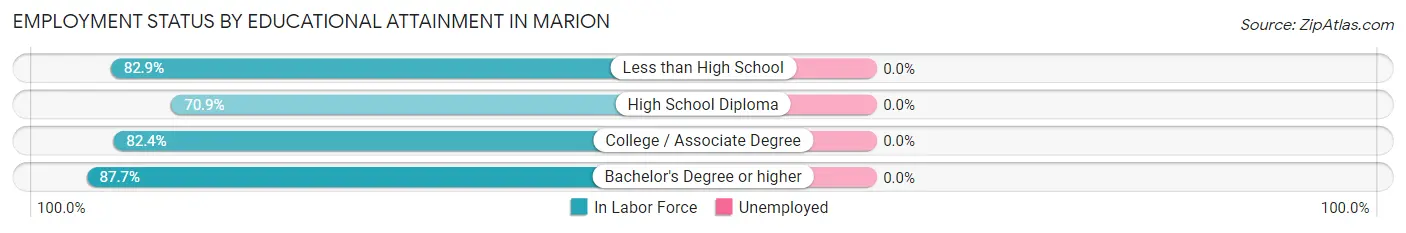
| Educational Attainment | In Labor Force | Unemployed |
| Less than High School | 34 (82.9%) | 0 (0.0%) |
| High School Diploma | 232 (70.9%) | 0 (0.0%) |
| College / Associate Degree | 211 (82.4%) | 0 (0.0%) |
| Bachelor's Degree or higher | 200 (87.7%) | 0 (0.0%) |
| Total | 677 (79.5%) | 0 (0.0%) |
Employment Occupations by Sex in Marion
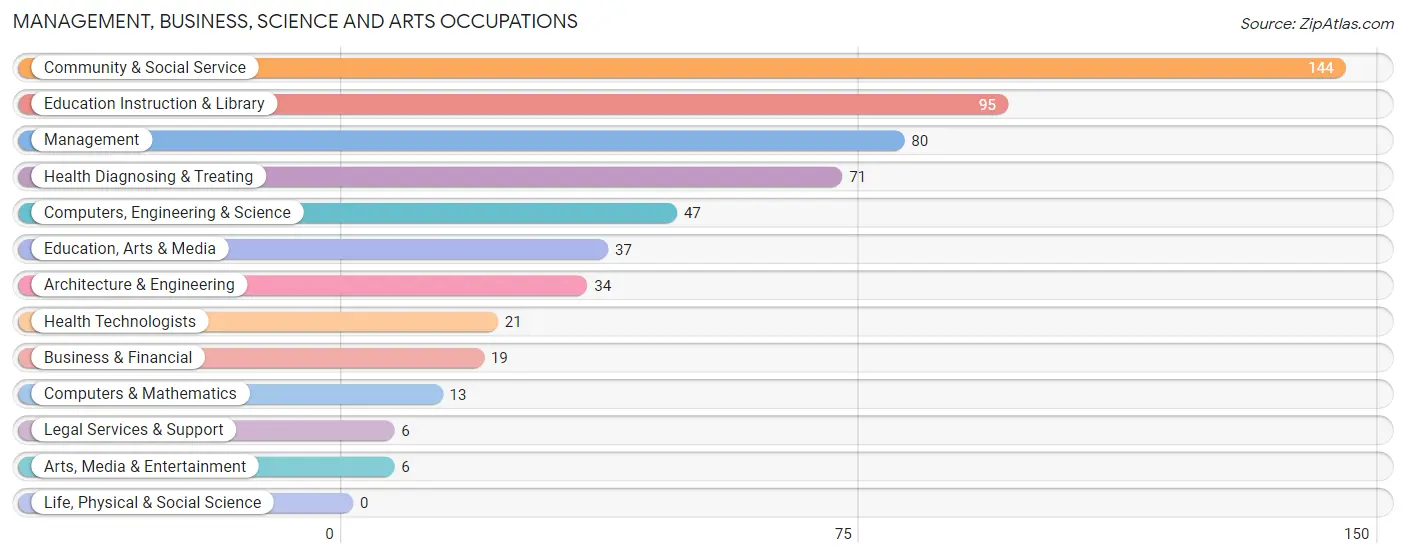
Management, Business, Science and Arts Occupations
The most common Management, Business, Science and Arts occupations in Marion are Community & Social Service (144 | 17.1%), Education Instruction & Library (95 | 11.3%), Management (80 | 9.5%), Health Diagnosing & Treating (71 | 8.5%), and Computers, Engineering & Science (47 | 5.6%).
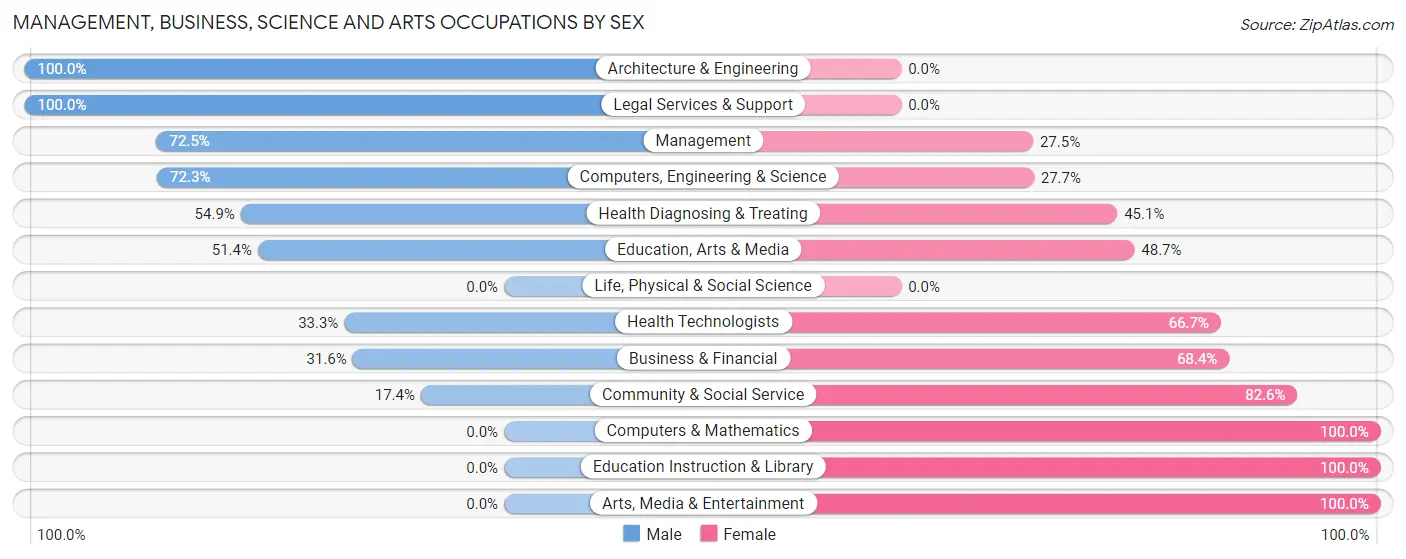
Management, Business, Science and Arts Occupations by Sex
Within the Management, Business, Science and Arts occupations in Marion, the most male-oriented occupations are Architecture & Engineering (100.0%), Legal Services & Support (100.0%), and Management (72.5%), while the most female-oriented occupations are Computers & Mathematics (100.0%), Education Instruction & Library (100.0%), and Arts, Media & Entertainment (100.0%).
| Occupation | Male | Female |
| Management | 58 (72.5%) | 22 (27.5%) |
| Business & Financial | 6 (31.6%) | 13 (68.4%) |
| Computers, Engineering & Science | 34 (72.3%) | 13 (27.7%) |
| Computers & Mathematics | 0 (0.0%) | 13 (100.0%) |
| Architecture & Engineering | 34 (100.0%) | 0 (0.0%) |
| Life, Physical & Social Science | 0 (0.0%) | 0 (0.0%) |
| Community & Social Service | 25 (17.4%) | 119 (82.6%) |
| Education, Arts & Media | 19 (51.3%) | 18 (48.6%) |
| Legal Services & Support | 6 (100.0%) | 0 (0.0%) |
| Education Instruction & Library | 0 (0.0%) | 95 (100.0%) |
| Arts, Media & Entertainment | 0 (0.0%) | 6 (100.0%) |
| Health Diagnosing & Treating | 39 (54.9%) | 32 (45.1%) |
| Health Technologists | 7 (33.3%) | 14 (66.7%) |
| Total (Category) | 162 (44.9%) | 199 (55.1%) |
| Total (Overall) | 437 (52.0%) | 403 (48.0%) |
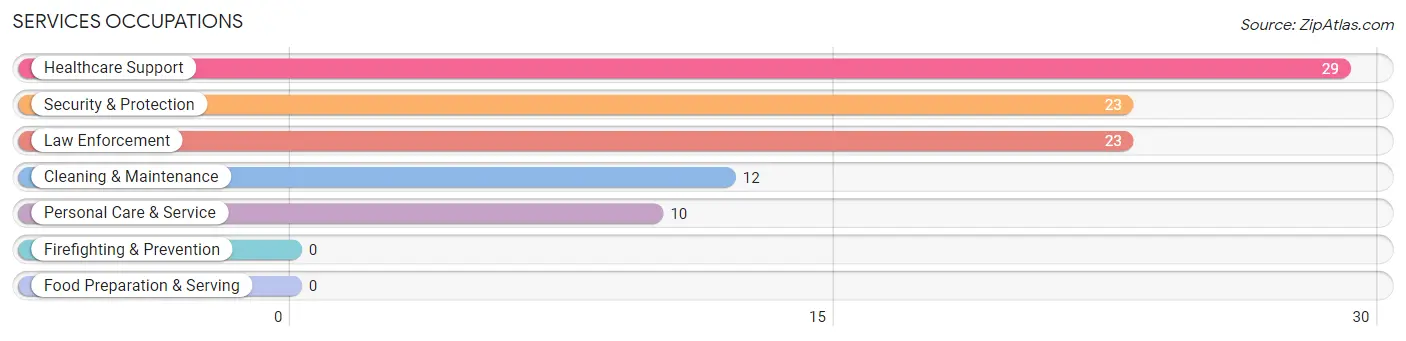
Services Occupations
The most common Services occupations in Marion are Healthcare Support (29 | 3.5%), Security & Protection (23 | 2.7%), Law Enforcement (23 | 2.7%), Cleaning & Maintenance (12 | 1.4%), and Personal Care & Service (10 | 1.2%).
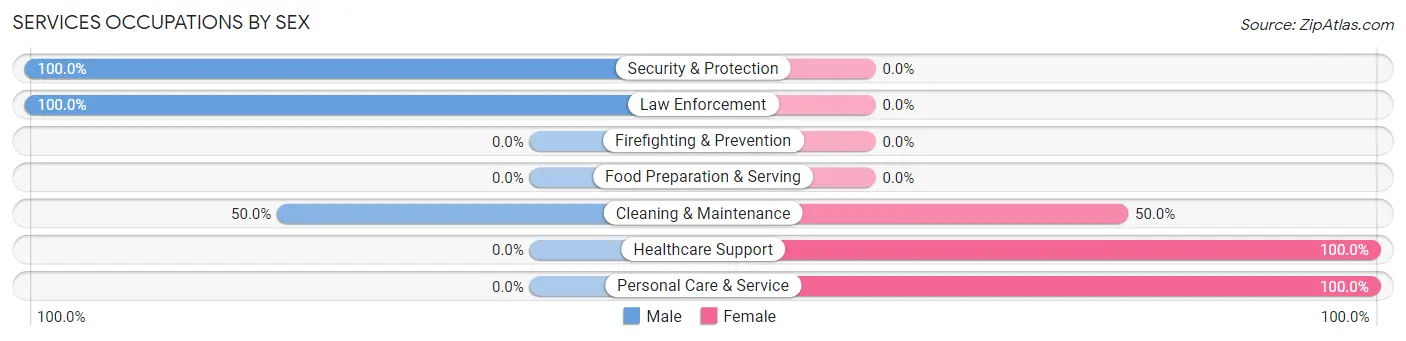
Services Occupations by Sex
Within the Services occupations in Marion, the most male-oriented occupations are Security & Protection (100.0%), Law Enforcement (100.0%), and Cleaning & Maintenance (50.0%), while the most female-oriented occupations are Healthcare Support (100.0%), Personal Care & Service (100.0%), and Cleaning & Maintenance (50.0%).
| Occupation | Male | Female |
| Healthcare Support | 0 (0.0%) | 29 (100.0%) |
| Security & Protection | 23 (100.0%) | 0 (0.0%) |
| Firefighting & Prevention | 0 (0.0%) | 0 (0.0%) |
| Law Enforcement | 23 (100.0%) | 0 (0.0%) |
| Food Preparation & Serving | 0 (0.0%) | 0 (0.0%) |
| Cleaning & Maintenance | 6 (50.0%) | 6 (50.0%) |
| Personal Care & Service | 0 (0.0%) | 10 (100.0%) |
| Total (Category) | 29 (39.2%) | 45 (60.8%) |
| Total (Overall) | 437 (52.0%) | 403 (48.0%) |
Sales and Office Occupations
The most common Sales and Office occupations in Marion are Sales & Related (84 | 10.0%), and Office & Administration (58 | 6.9%).
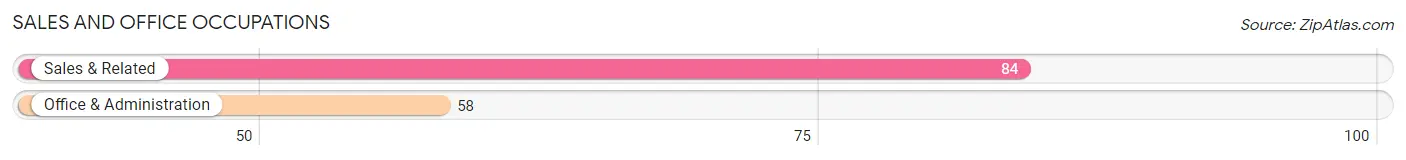
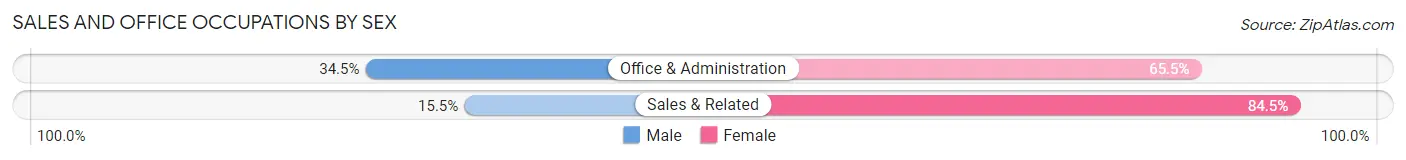
Sales and Office Occupations by Sex
| Occupation | Male | Female |
| Sales & Related | 13 (15.5%) | 71 (84.5%) |
| Office & Administration | 20 (34.5%) | 38 (65.5%) |
| Total (Category) | 33 (23.2%) | 109 (76.8%) |
| Total (Overall) | 437 (52.0%) | 403 (48.0%) |
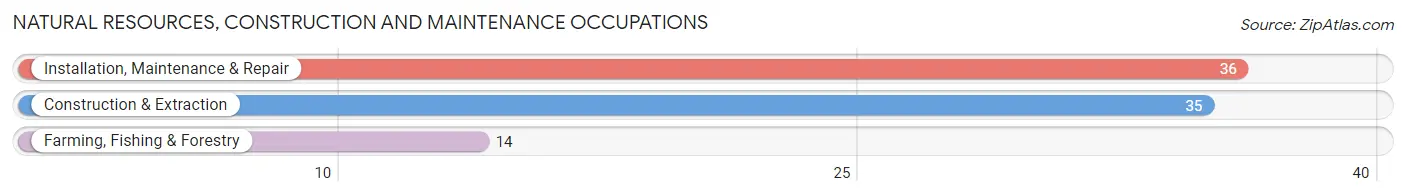
Natural Resources, Construction and Maintenance Occupations
The most common Natural Resources, Construction and Maintenance occupations in Marion are Installation, Maintenance & Repair (36 | 4.3%), Construction & Extraction (35 | 4.2%), and Farming, Fishing & Forestry (14 | 1.7%).
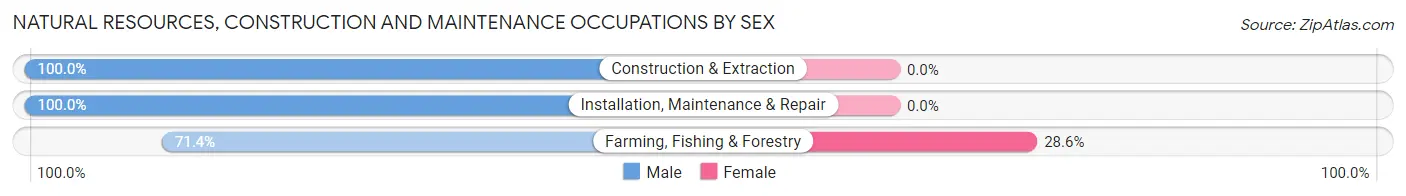
Natural Resources, Construction and Maintenance Occupations by Sex
| Occupation | Male | Female |
| Farming, Fishing & Forestry | 10 (71.4%) | 4 (28.6%) |
| Construction & Extraction | 35 (100.0%) | 0 (0.0%) |
| Installation, Maintenance & Repair | 36 (100.0%) | 0 (0.0%) |
| Total (Category) | 81 (95.3%) | 4 (4.7%) |
| Total (Overall) | 437 (52.0%) | 403 (48.0%) |
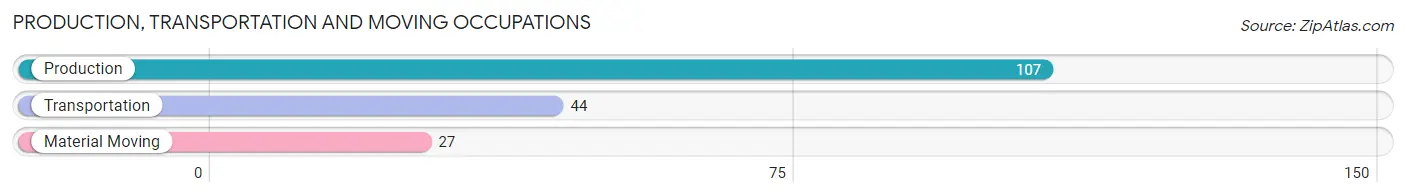
Production, Transportation and Moving Occupations
The most common Production, Transportation and Moving occupations in Marion are Production (107 | 12.7%), Transportation (44 | 5.2%), and Material Moving (27 | 3.2%).
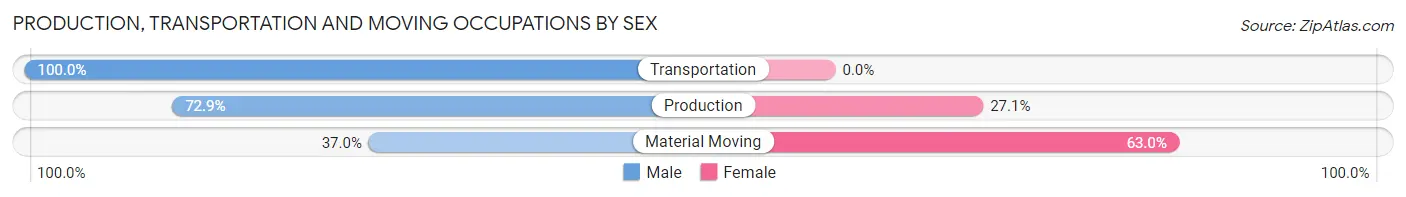
Production, Transportation and Moving Occupations by Sex
| Occupation | Male | Female |
| Production | 78 (72.9%) | 29 (27.1%) |
| Transportation | 44 (100.0%) | 0 (0.0%) |
| Material Moving | 10 (37.0%) | 17 (63.0%) |
| Total (Category) | 132 (74.2%) | 46 (25.8%) |
| Total (Overall) | 437 (52.0%) | 403 (48.0%) |
Employment Industries by Sex in Marion
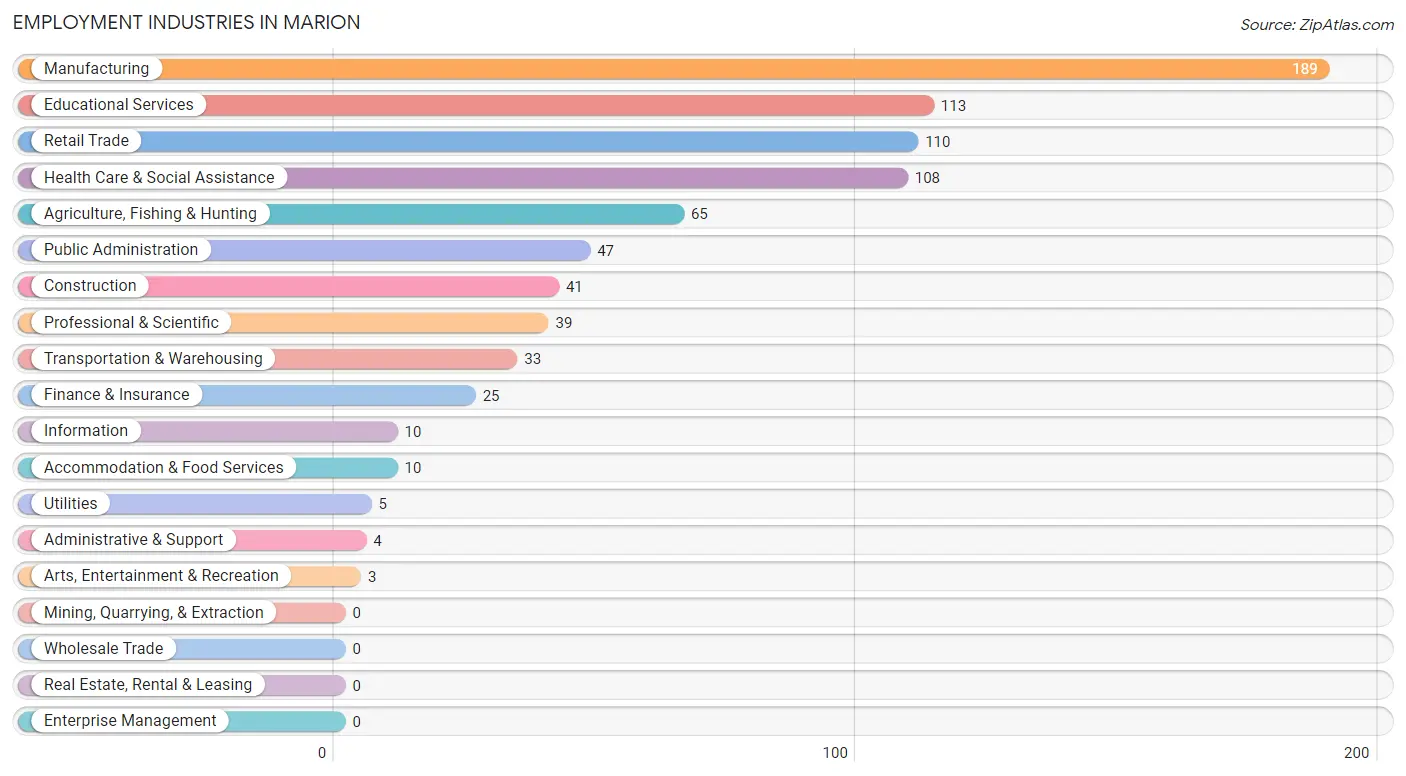
Employment Industries in Marion
The major employment industries in Marion include Manufacturing (189 | 22.5%), Educational Services (113 | 13.5%), Retail Trade (110 | 13.1%), Health Care & Social Assistance (108 | 12.9%), and Agriculture, Fishing & Hunting (65 | 7.7%).
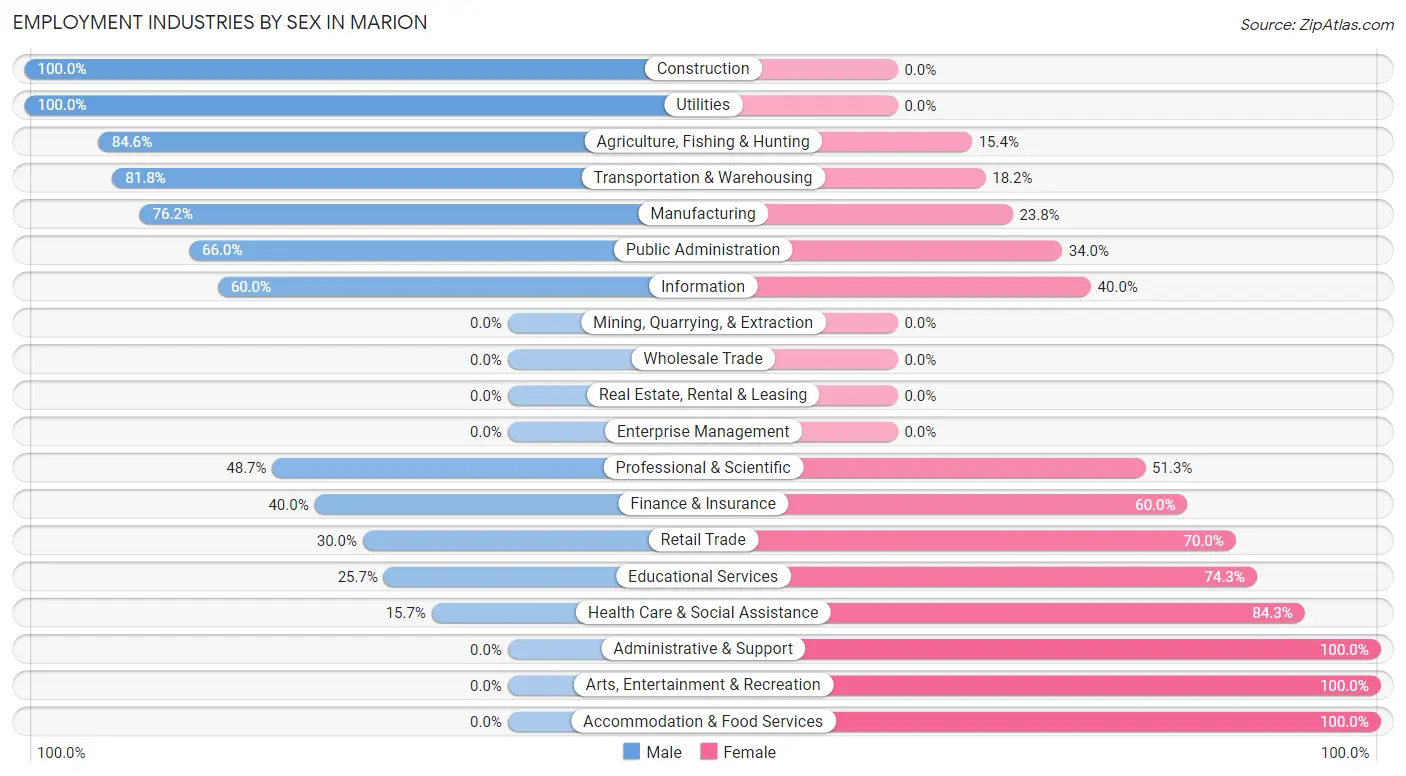
Employment Industries by Sex in Marion
The Marion industries that see more men than women are Construction (100.0%), Utilities (100.0%), and Agriculture, Fishing & Hunting (84.6%), whereas the industries that tend to have a higher number of women are Administrative & Support (100.0%), Arts, Entertainment & Recreation (100.0%), and Accommodation & Food Services (100.0%).
| Industry | Male | Female |
| Agriculture, Fishing & Hunting | 55 (84.6%) | 10 (15.4%) |
| Mining, Quarrying, & Extraction | 0 (0.0%) | 0 (0.0%) |
| Construction | 41 (100.0%) | 0 (0.0%) |
| Manufacturing | 144 (76.2%) | 45 (23.8%) |
| Wholesale Trade | 0 (0.0%) | 0 (0.0%) |
| Retail Trade | 33 (30.0%) | 77 (70.0%) |
| Transportation & Warehousing | 27 (81.8%) | 6 (18.2%) |
| Utilities | 5 (100.0%) | 0 (0.0%) |
| Information | 6 (60.0%) | 4 (40.0%) |
| Finance & Insurance | 10 (40.0%) | 15 (60.0%) |
| Real Estate, Rental & Leasing | 0 (0.0%) | 0 (0.0%) |
| Professional & Scientific | 19 (48.7%) | 20 (51.3%) |
| Enterprise Management | 0 (0.0%) | 0 (0.0%) |
| Administrative & Support | 0 (0.0%) | 4 (100.0%) |
| Educational Services | 29 (25.7%) | 84 (74.3%) |
| Health Care & Social Assistance | 17 (15.7%) | 91 (84.3%) |
| Arts, Entertainment & Recreation | 0 (0.0%) | 3 (100.0%) |
| Accommodation & Food Services | 0 (0.0%) | 10 (100.0%) |
| Public Administration | 31 (66.0%) | 16 (34.0%) |
| Total | 437 (52.0%) | 403 (48.0%) |
Education in Marion
School Enrollment in Marion
The most common levels of schooling among the 354 students in Marion are elementary school (106 | 29.9%), high school (91 | 25.7%), and middle school (49 | 13.8%).
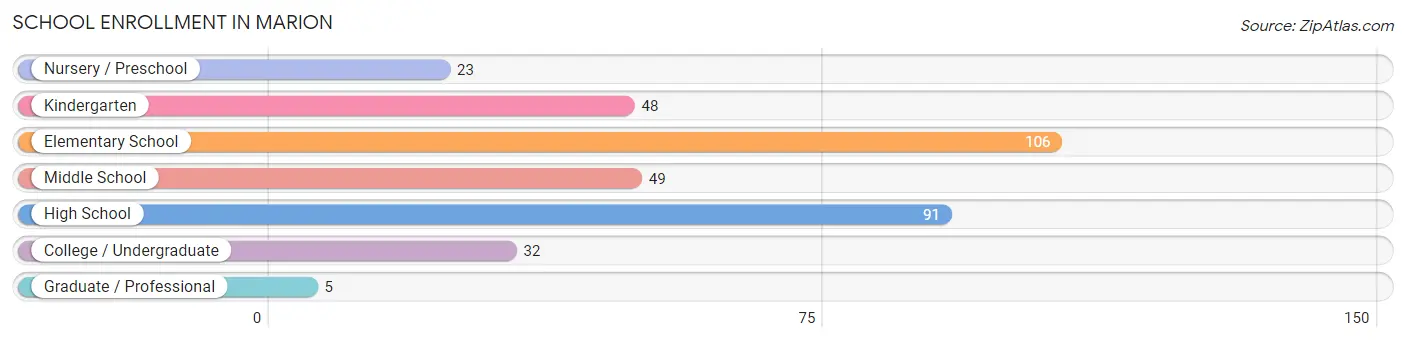
| School Level | # Students | % Students |
| Nursery / Preschool | 23 | 6.5% |
| Kindergarten | 48 | 13.6% |
| Elementary School | 106 | 29.9% |
| Middle School | 49 | 13.8% |
| High School | 91 | 25.7% |
| College / Undergraduate | 32 | 9.0% |
| Graduate / Professional | 5 | 1.4% |
| Total | 354 | 100.0% |
School Enrollment by Age by Funding Source in Marion
Out of a total of 354 students who are enrolled in schools in Marion, 14 (4.0%) attend a private institution, while the remaining 340 (96.0%) are enrolled in public schools. The age group of 35 years and over has the highest likelihood of being enrolled in private schools, with 8 (61.5% in the age bracket) enrolled. Conversely, the age group of 5 to 9 year old has the lowest likelihood of being enrolled in a private school, with 152 (100.0% in the age bracket) attending a public institution.
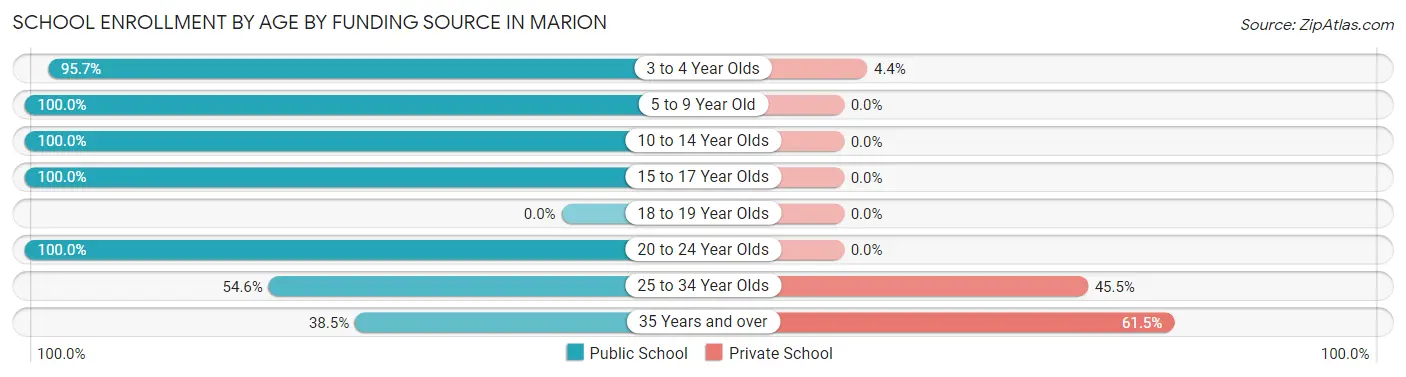
| Age Bracket | Public School | Private School |
| 3 to 4 Year Olds | 22 (95.7%) | 1 (4.3%) |
| 5 to 9 Year Old | 152 (100.0%) | 0 (0.0%) |
| 10 to 14 Year Olds | 66 (100.0%) | 0 (0.0%) |
| 15 to 17 Year Olds | 76 (100.0%) | 0 (0.0%) |
| 18 to 19 Year Olds | 0 (0.0%) | 0 (0.0%) |
| 20 to 24 Year Olds | 13 (100.0%) | 0 (0.0%) |
| 25 to 34 Year Olds | 6 (54.5%) | 5 (45.5%) |
| 35 Years and over | 5 (38.5%) | 8 (61.5%) |
| Total | 340 (96.0%) | 14 (4.0%) |
Educational Attainment by Field of Study in Marion
Education (108 | 28.4%), business (77 | 20.3%), science & technology (46 | 12.1%), liberal arts & history (29 | 7.6%), and bio, nature & agricultural (24 | 6.3%) are the most common fields of study among 380 individuals in Marion who have obtained a bachelor's degree or higher.
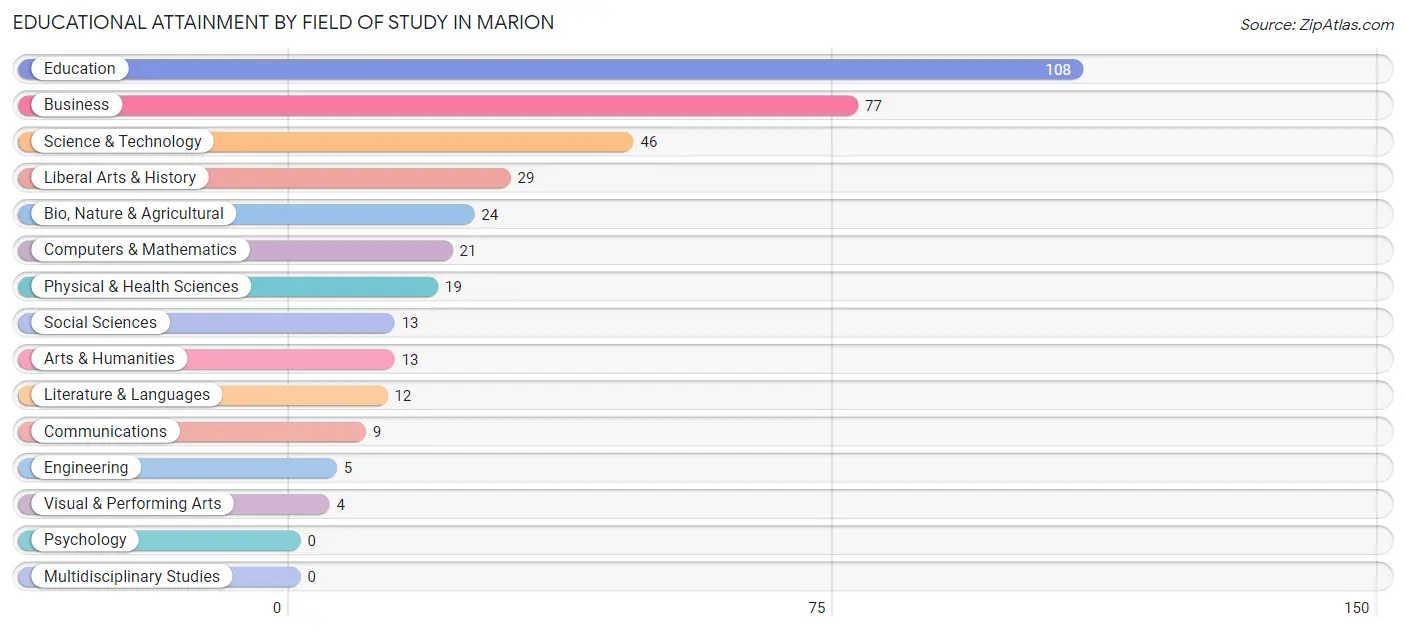
| Field of Study | # Graduates | % Graduates |
| Computers & Mathematics | 21 | 5.5% |
| Bio, Nature & Agricultural | 24 | 6.3% |
| Physical & Health Sciences | 19 | 5.0% |
| Psychology | 0 | 0.0% |
| Social Sciences | 13 | 3.4% |
| Engineering | 5 | 1.3% |
| Multidisciplinary Studies | 0 | 0.0% |
| Science & Technology | 46 | 12.1% |
| Business | 77 | 20.3% |
| Education | 108 | 28.4% |
| Literature & Languages | 12 | 3.2% |
| Liberal Arts & History | 29 | 7.6% |
| Visual & Performing Arts | 4 | 1.1% |
| Communications | 9 | 2.4% |
| Arts & Humanities | 13 | 3.4% |
| Total | 380 | 100.0% |
Transportation & Commute in Marion
Vehicle Availability by Sex in Marion
The most prevalent vehicle ownership categories in Marion are males with 2 vehicles (157, accounting for 35.9%) and females with 2 vehicles (95, making up 39.4%).
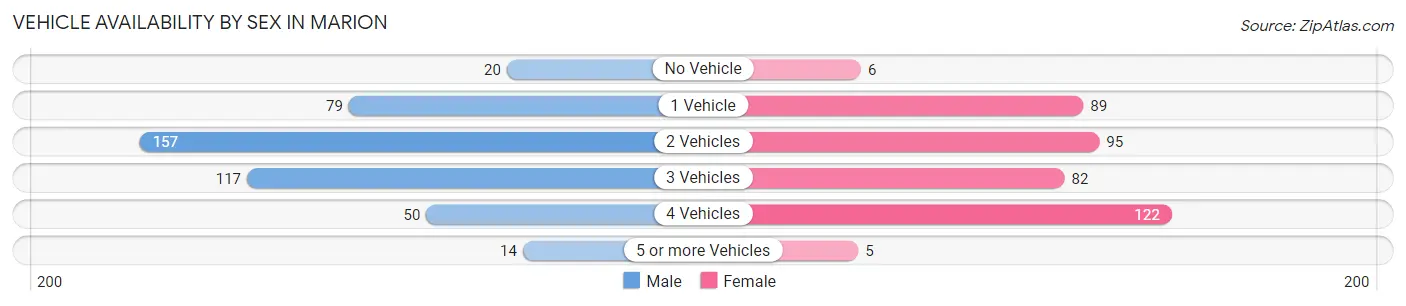
| Vehicles Available | Male | Female |
| No Vehicle | 20 (4.6%) | 6 (1.5%) |
| 1 Vehicle | 79 (18.1%) | 89 (22.3%) |
| 2 Vehicles | 157 (35.9%) | 95 (23.8%) |
| 3 Vehicles | 117 (26.8%) | 82 (20.5%) |
| 4 Vehicles | 50 (11.4%) | 122 (30.6%) |
| 5 or more Vehicles | 14 (3.2%) | 5 (1.3%) |
| Total | 437 (100.0%) | 399 (100.0%) |
Commute Time in Marion
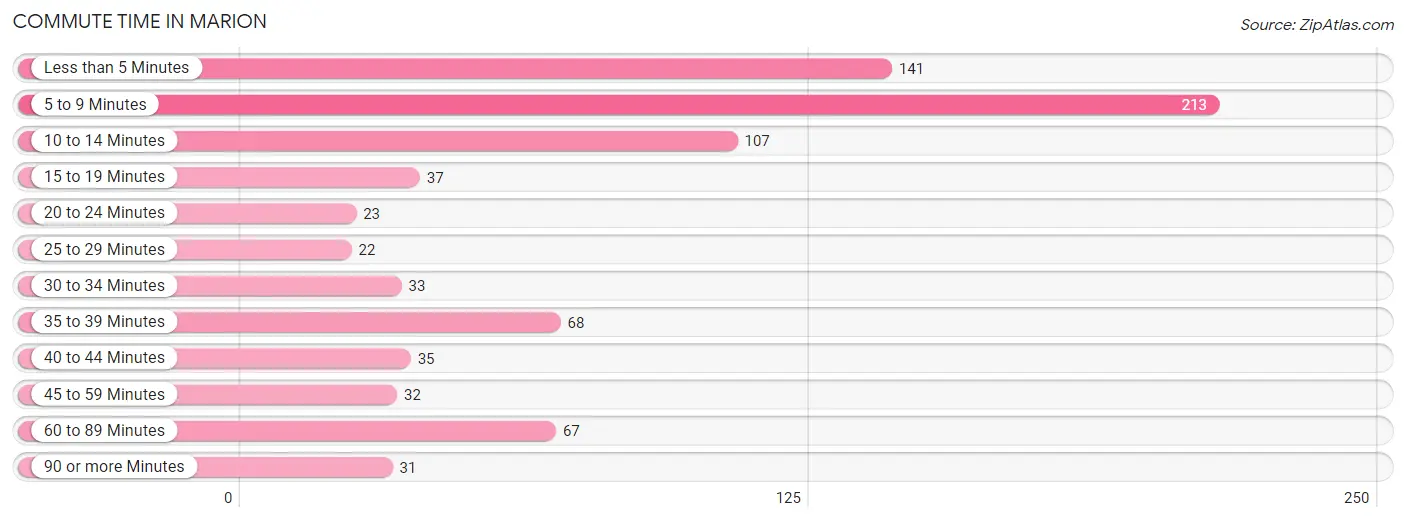
The most frequently occuring commute durations in Marion are 5 to 9 minutes (213 commuters, 26.3%), less than 5 minutes (141 commuters, 17.4%), and 10 to 14 minutes (107 commuters, 13.2%).
| Commute Time | # Commuters | % Commuters |
| Less than 5 Minutes | 141 | 17.4% |
| 5 to 9 Minutes | 213 | 26.3% |
| 10 to 14 Minutes | 107 | 13.2% |
| 15 to 19 Minutes | 37 | 4.6% |
| 20 to 24 Minutes | 23 | 2.8% |
| 25 to 29 Minutes | 22 | 2.7% |
| 30 to 34 Minutes | 33 | 4.1% |
| 35 to 39 Minutes | 68 | 8.4% |
| 40 to 44 Minutes | 35 | 4.3% |
| 45 to 59 Minutes | 32 | 4.0% |
| 60 to 89 Minutes | 67 | 8.3% |
| 90 or more Minutes | 31 | 3.8% |
Commute Time by Sex in Marion
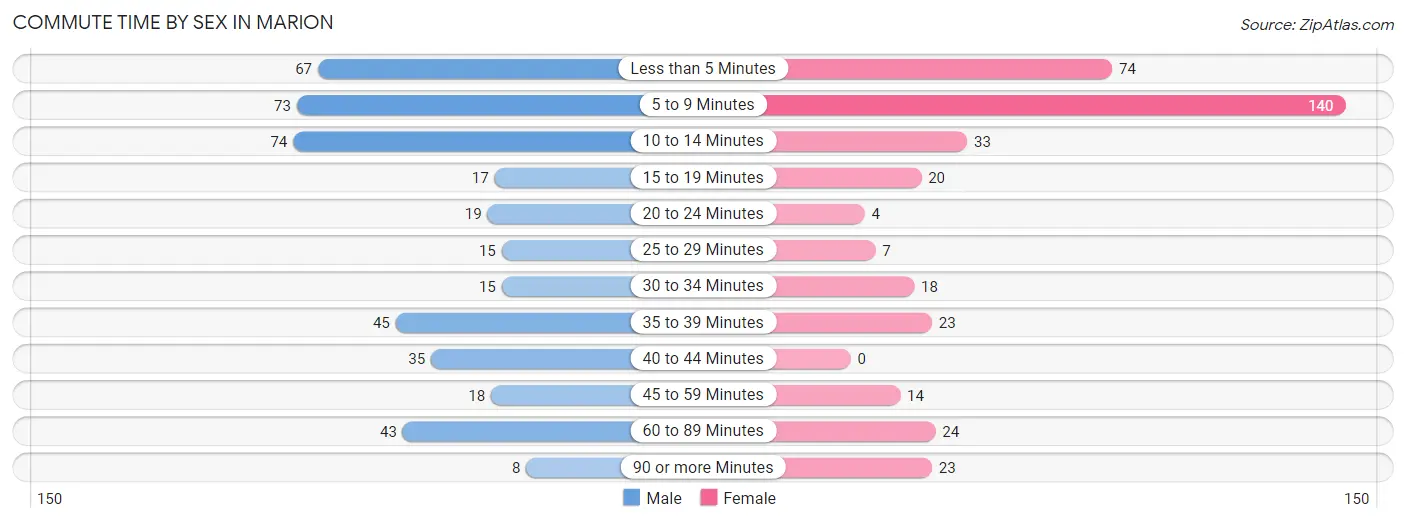
The most common commute times in Marion are 10 to 14 minutes (74 commuters, 17.2%) for males and 5 to 9 minutes (140 commuters, 36.8%) for females.
| Commute Time | Male | Female |
| Less than 5 Minutes | 67 (15.6%) | 74 (19.5%) |
| 5 to 9 Minutes | 73 (17.0%) | 140 (36.8%) |
| 10 to 14 Minutes | 74 (17.2%) | 33 (8.7%) |
| 15 to 19 Minutes | 17 (4.0%) | 20 (5.3%) |
| 20 to 24 Minutes | 19 (4.4%) | 4 (1.1%) |
| 25 to 29 Minutes | 15 (3.5%) | 7 (1.8%) |
| 30 to 34 Minutes | 15 (3.5%) | 18 (4.7%) |
| 35 to 39 Minutes | 45 (10.5%) | 23 (6.0%) |
| 40 to 44 Minutes | 35 (8.2%) | 0 (0.0%) |
| 45 to 59 Minutes | 18 (4.2%) | 14 (3.7%) |
| 60 to 89 Minutes | 43 (10.0%) | 24 (6.3%) |
| 90 or more Minutes | 8 (1.9%) | 23 (6.0%) |
Time of Departure to Work by Sex in Marion
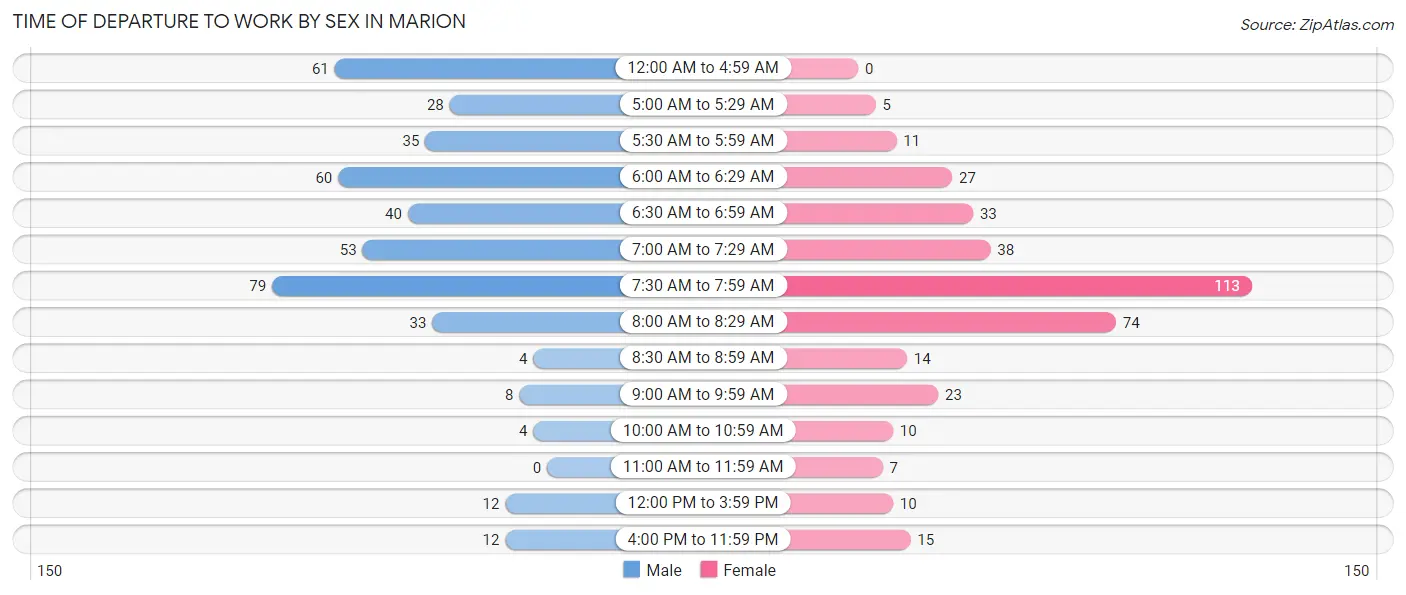
The most frequent times of departure to work in Marion are 7:30 AM to 7:59 AM (79, 18.4%) for males and 7:30 AM to 7:59 AM (113, 29.7%) for females.
| Time of Departure | Male | Female |
| 12:00 AM to 4:59 AM | 61 (14.2%) | 0 (0.0%) |
| 5:00 AM to 5:29 AM | 28 (6.5%) | 5 (1.3%) |
| 5:30 AM to 5:59 AM | 35 (8.2%) | 11 (2.9%) |
| 6:00 AM to 6:29 AM | 60 (14.0%) | 27 (7.1%) |
| 6:30 AM to 6:59 AM | 40 (9.3%) | 33 (8.7%) |
| 7:00 AM to 7:29 AM | 53 (12.3%) | 38 (10.0%) |
| 7:30 AM to 7:59 AM | 79 (18.4%) | 113 (29.7%) |
| 8:00 AM to 8:29 AM | 33 (7.7%) | 74 (19.5%) |
| 8:30 AM to 8:59 AM | 4 (0.9%) | 14 (3.7%) |
| 9:00 AM to 9:59 AM | 8 (1.9%) | 23 (6.0%) |
| 10:00 AM to 10:59 AM | 4 (0.9%) | 10 (2.6%) |
| 11:00 AM to 11:59 AM | 0 (0.0%) | 7 (1.8%) |
| 12:00 PM to 3:59 PM | 12 (2.8%) | 10 (2.6%) |
| 4:00 PM to 11:59 PM | 12 (2.8%) | 15 (4.0%) |
| Total | 429 (100.0%) | 380 (100.0%) |
Housing Occupancy in Marion
Occupancy by Ownership in Marion
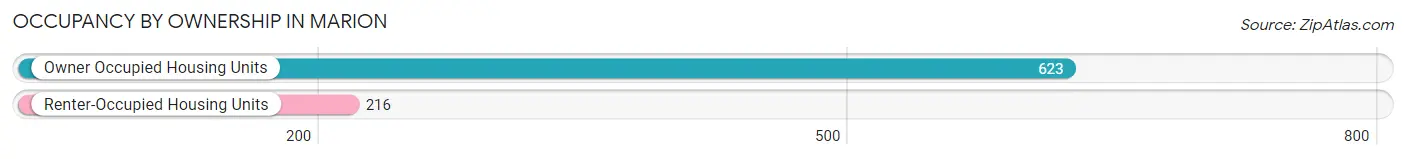
Of the total 839 dwellings in Marion, owner-occupied units account for 623 (74.3%), while renter-occupied units make up 216 (25.7%).
| Occupancy | # Housing Units | % Housing Units |
| Owner Occupied Housing Units | 623 | 74.3% |
| Renter-Occupied Housing Units | 216 | 25.7% |
| Total Occupied Housing Units | 839 | 100.0% |
Occupancy by Household Size in Marion
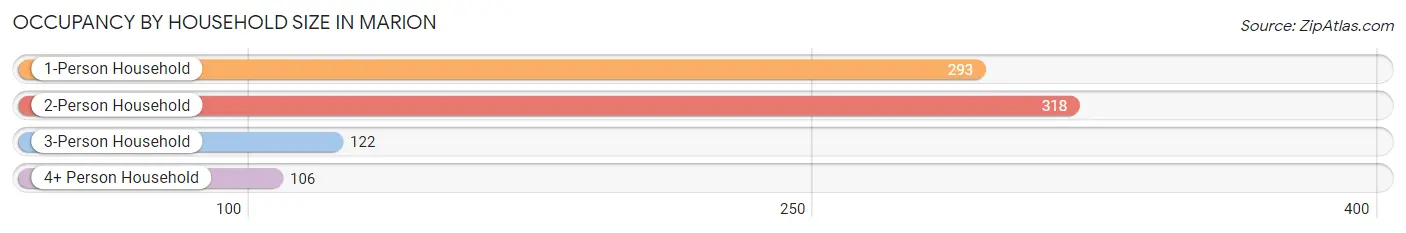
| Household Size | # Housing Units | % Housing Units |
| 1-Person Household | 293 | 34.9% |
| 2-Person Household | 318 | 37.9% |
| 3-Person Household | 122 | 14.5% |
| 4+ Person Household | 106 | 12.6% |
| Total Housing Units | 839 | 100.0% |
Occupancy by Ownership by Household Size in Marion
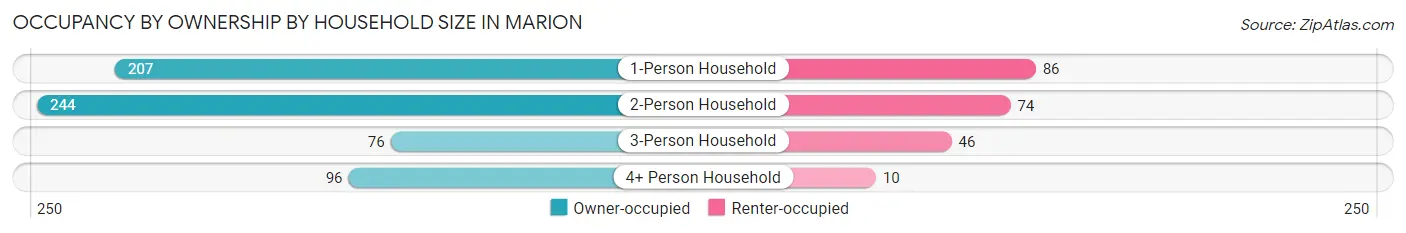
| Household Size | Owner-occupied | Renter-occupied |
| 1-Person Household | 207 (70.7%) | 86 (29.3%) |
| 2-Person Household | 244 (76.7%) | 74 (23.3%) |
| 3-Person Household | 76 (62.3%) | 46 (37.7%) |
| 4+ Person Household | 96 (90.6%) | 10 (9.4%) |
| Total Housing Units | 623 (74.3%) | 216 (25.7%) |
Occupancy by Educational Attainment in Marion
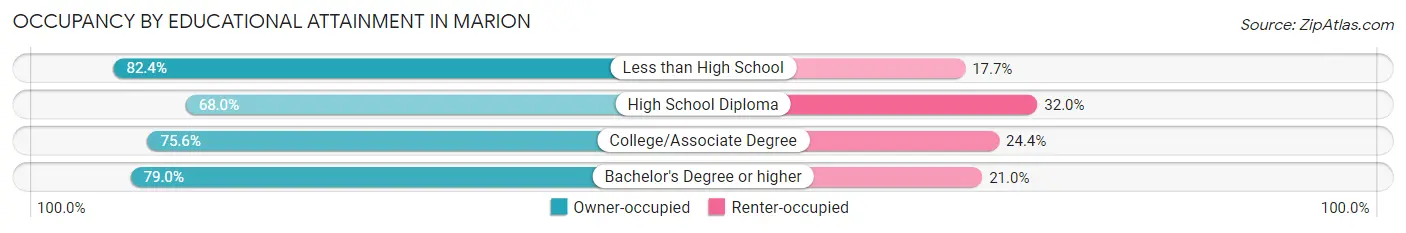
| Household Size | Owner-occupied | Renter-occupied |
| Less than High School | 42 (82.4%) | 9 (17.6%) |
| High School Diploma | 198 (68.0%) | 93 (32.0%) |
| College/Associate Degree | 214 (75.6%) | 69 (24.4%) |
| Bachelor's Degree or higher | 169 (79.0%) | 45 (21.0%) |
Occupancy by Age of Householder in Marion
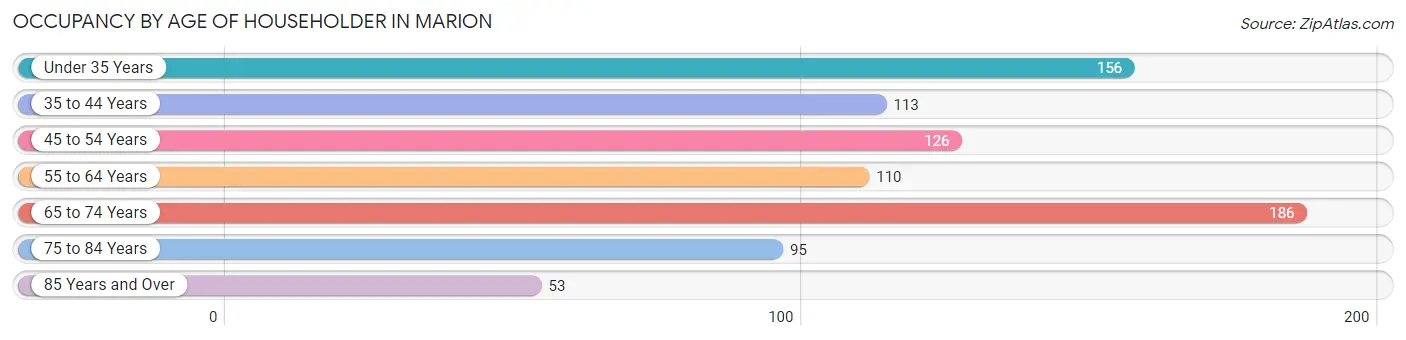
| Age Bracket | # Households | % Households |
| Under 35 Years | 156 | 18.6% |
| 35 to 44 Years | 113 | 13.5% |
| 45 to 54 Years | 126 | 15.0% |
| 55 to 64 Years | 110 | 13.1% |
| 65 to 74 Years | 186 | 22.2% |
| 75 to 84 Years | 95 | 11.3% |
| 85 Years and Over | 53 | 6.3% |
| Total | 839 | 100.0% |
Housing Finances in Marion
Median Income by Occupancy in Marion
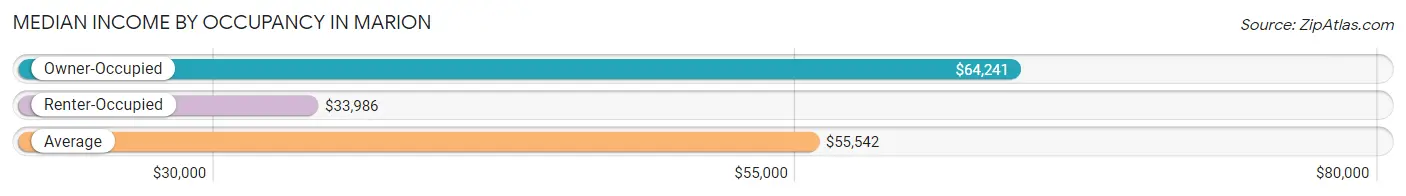
| Occupancy Type | # Households | Median Income |
| Owner-Occupied | 623 (74.3%) | $64,241 |
| Renter-Occupied | 216 (25.7%) | $33,986 |
| Average | 839 (100.0%) | $55,542 |
Occupancy by Householder Income Bracket in Marion
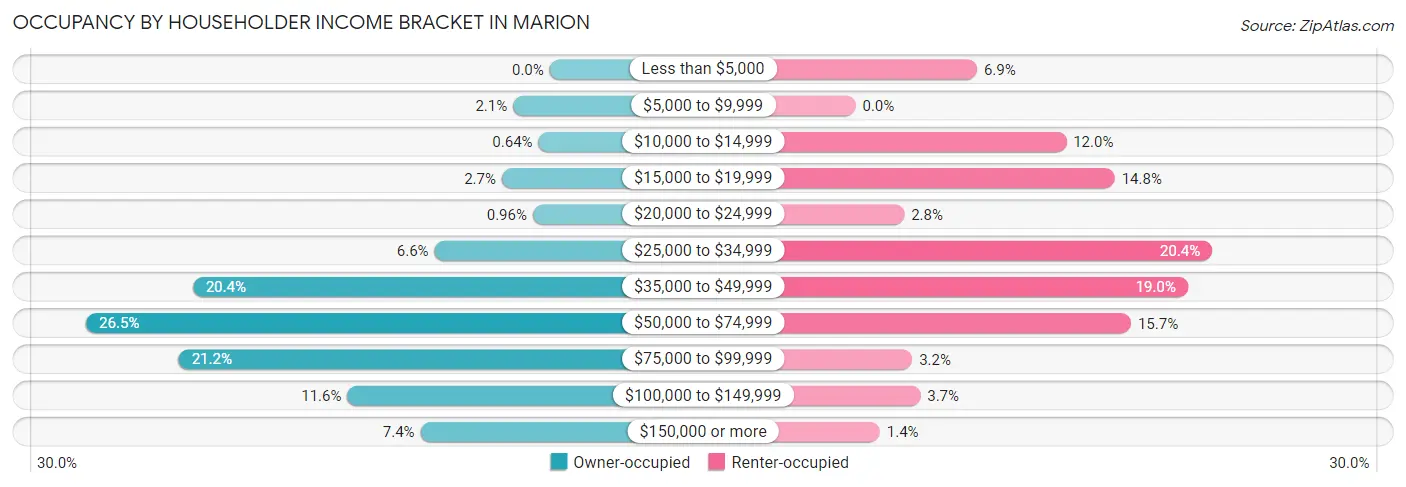
| Income Bracket | Owner-occupied | Renter-occupied |
| Less than $5,000 | 0 (0.0%) | 15 (6.9%) |
| $5,000 to $9,999 | 13 (2.1%) | 0 (0.0%) |
| $10,000 to $14,999 | 4 (0.6%) | 26 (12.0%) |
| $15,000 to $19,999 | 17 (2.7%) | 32 (14.8%) |
| $20,000 to $24,999 | 6 (1.0%) | 6 (2.8%) |
| $25,000 to $34,999 | 41 (6.6%) | 44 (20.4%) |
| $35,000 to $49,999 | 127 (20.4%) | 41 (19.0%) |
| $50,000 to $74,999 | 165 (26.5%) | 34 (15.7%) |
| $75,000 to $99,999 | 132 (21.2%) | 7 (3.2%) |
| $100,000 to $149,999 | 72 (11.6%) | 8 (3.7%) |
| $150,000 or more | 46 (7.4%) | 3 (1.4%) |
| Total | 623 (100.0%) | 216 (100.0%) |
Monthly Housing Cost Tiers in Marion
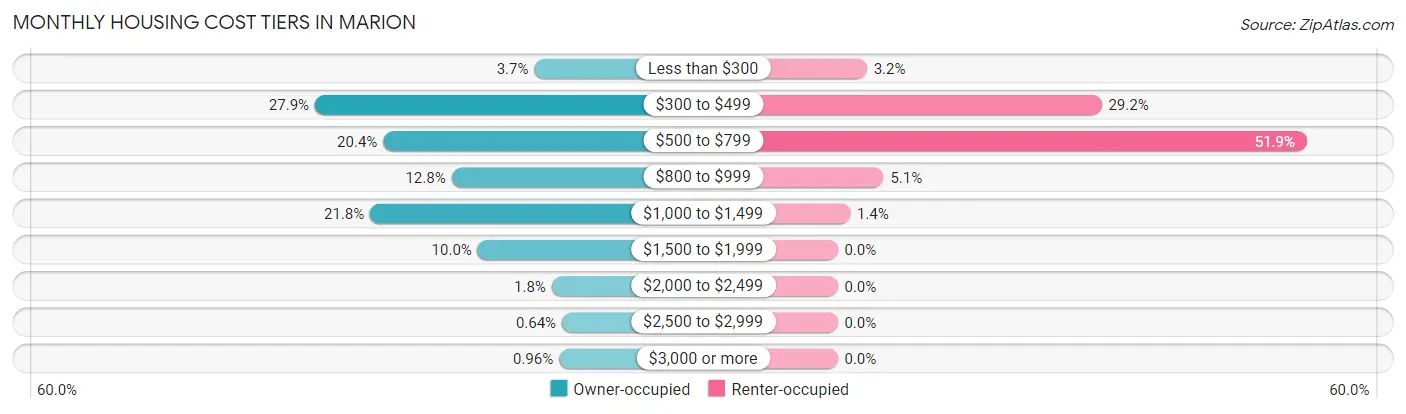
| Monthly Cost | Owner-occupied | Renter-occupied |
| Less than $300 | 23 (3.7%) | 7 (3.2%) |
| $300 to $499 | 174 (27.9%) | 63 (29.2%) |
| $500 to $799 | 127 (20.4%) | 112 (51.8%) |
| $800 to $999 | 80 (12.8%) | 11 (5.1%) |
| $1,000 to $1,499 | 136 (21.8%) | 3 (1.4%) |
| $1,500 to $1,999 | 62 (10.0%) | 0 (0.0%) |
| $2,000 to $2,499 | 11 (1.8%) | 0 (0.0%) |
| $2,500 to $2,999 | 4 (0.6%) | 0 (0.0%) |
| $3,000 or more | 6 (1.0%) | 0 (0.0%) |
| Total | 623 (100.0%) | 216 (100.0%) |
Physical Housing Characteristics in Marion
Housing Structures in Marion
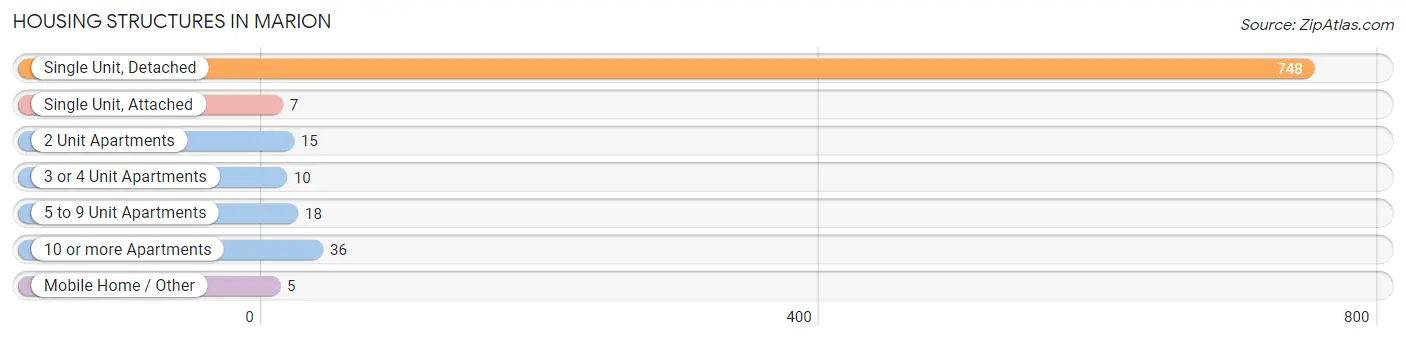
| Structure Type | # Housing Units | % Housing Units |
| Single Unit, Detached | 748 | 89.1% |
| Single Unit, Attached | 7 | 0.8% |
| 2 Unit Apartments | 15 | 1.8% |
| 3 or 4 Unit Apartments | 10 | 1.2% |
| 5 to 9 Unit Apartments | 18 | 2.1% |
| 10 or more Apartments | 36 | 4.3% |
| Mobile Home / Other | 5 | 0.6% |
| Total | 839 | 100.0% |
Housing Structures by Occupancy in Marion
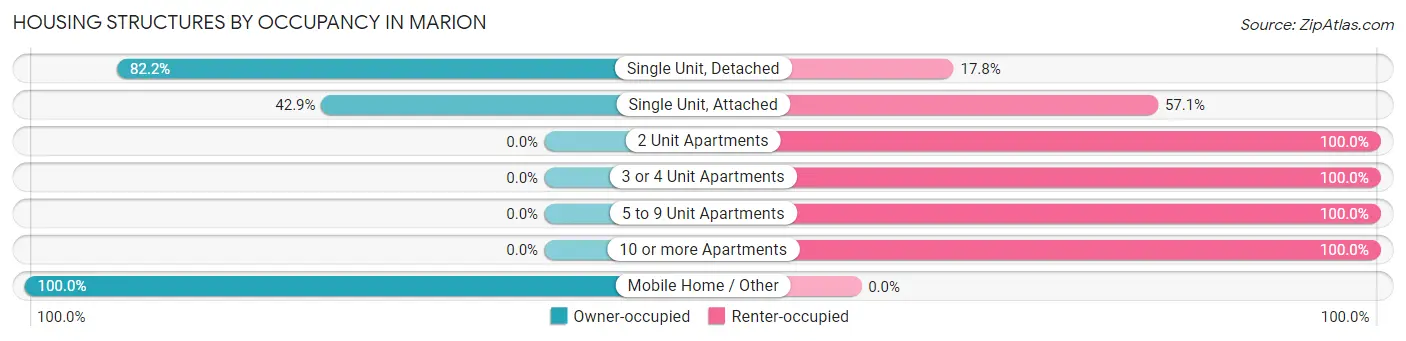
| Structure Type | Owner-occupied | Renter-occupied |
| Single Unit, Detached | 615 (82.2%) | 133 (17.8%) |
| Single Unit, Attached | 3 (42.9%) | 4 (57.1%) |
| 2 Unit Apartments | 0 (0.0%) | 15 (100.0%) |
| 3 or 4 Unit Apartments | 0 (0.0%) | 10 (100.0%) |
| 5 to 9 Unit Apartments | 0 (0.0%) | 18 (100.0%) |
| 10 or more Apartments | 0 (0.0%) | 36 (100.0%) |
| Mobile Home / Other | 5 (100.0%) | 0 (0.0%) |
| Total | 623 (74.3%) | 216 (25.7%) |
Housing Structures by Number of Rooms in Marion
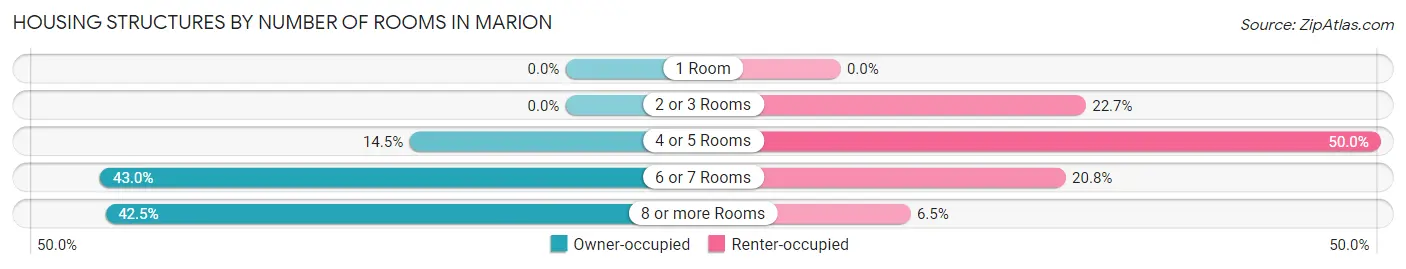
| Number of Rooms | Owner-occupied | Renter-occupied |
| 1 Room | 0 (0.0%) | 0 (0.0%) |
| 2 or 3 Rooms | 0 (0.0%) | 49 (22.7%) |
| 4 or 5 Rooms | 90 (14.4%) | 108 (50.0%) |
| 6 or 7 Rooms | 268 (43.0%) | 45 (20.8%) |
| 8 or more Rooms | 265 (42.5%) | 14 (6.5%) |
| Total | 623 (100.0%) | 216 (100.0%) |
Housing Structure by Heating Type in Marion
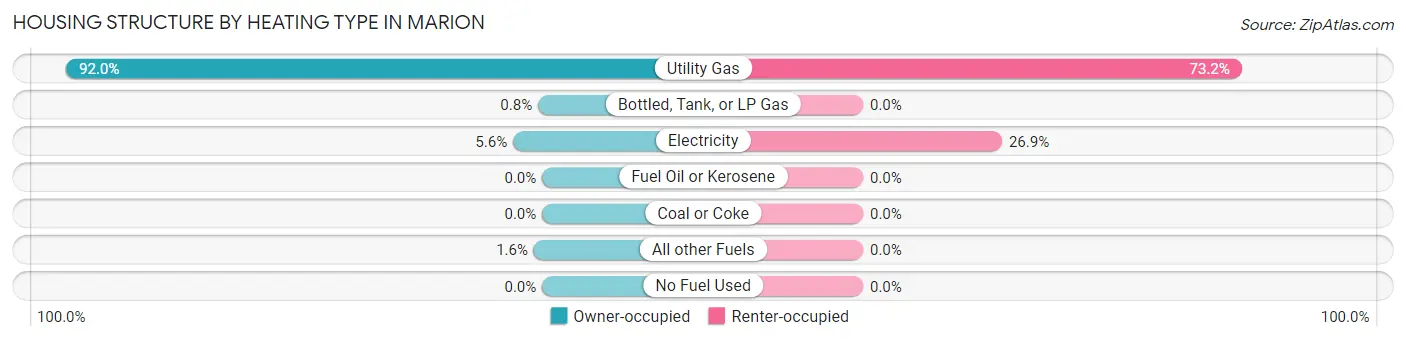
| Heating Type | Owner-occupied | Renter-occupied |
| Utility Gas | 573 (92.0%) | 158 (73.2%) |
| Bottled, Tank, or LP Gas | 5 (0.8%) | 0 (0.0%) |
| Electricity | 35 (5.6%) | 58 (26.9%) |
| Fuel Oil or Kerosene | 0 (0.0%) | 0 (0.0%) |
| Coal or Coke | 0 (0.0%) | 0 (0.0%) |
| All other Fuels | 10 (1.6%) | 0 (0.0%) |
| No Fuel Used | 0 (0.0%) | 0 (0.0%) |
| Total | 623 (100.0%) | 216 (100.0%) |
Household Vehicle Usage in Marion
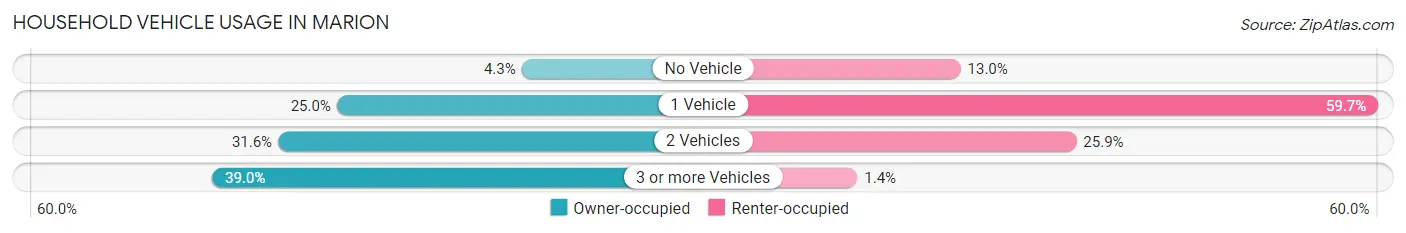
| Vehicles per Household | Owner-occupied | Renter-occupied |
| No Vehicle | 27 (4.3%) | 28 (13.0%) |
| 1 Vehicle | 156 (25.0%) | 129 (59.7%) |
| 2 Vehicles | 197 (31.6%) | 56 (25.9%) |
| 3 or more Vehicles | 243 (39.0%) | 3 (1.4%) |
| Total | 623 (100.0%) | 216 (100.0%) |
Real Estate & Mortgages in Marion
Real Estate and Mortgage Overview in Marion
| Characteristic | Without Mortgage | With Mortgage |
| Housing Units | 284 | 339 |
| Median Property Value | $89,000 | $87,900 |
| Median Household Income | $54,167 | $43 |
| Monthly Housing Costs | $461 | $6 |
| Real Estate Taxes | $2,263 | $0 |
Property Value by Mortgage Status in Marion
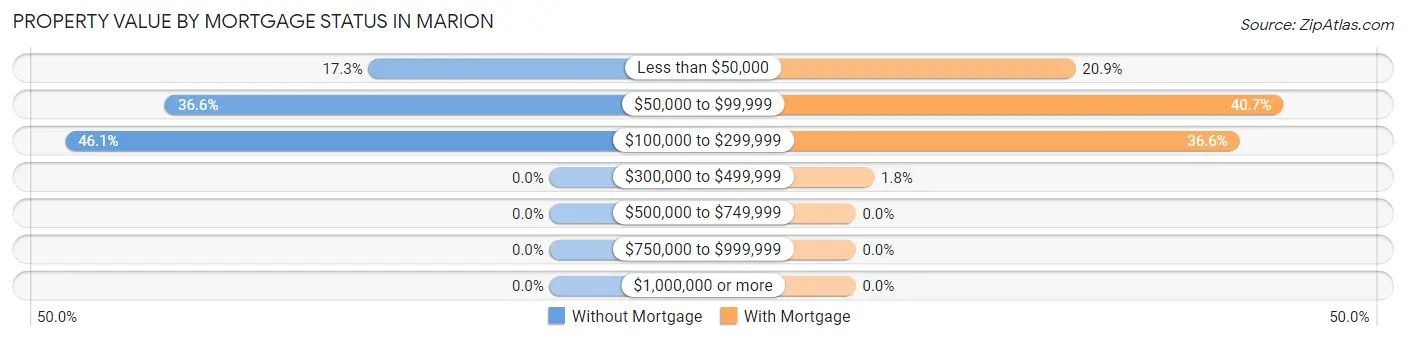
| Property Value | Without Mortgage | With Mortgage |
| Less than $50,000 | 49 (17.2%) | 71 (20.9%) |
| $50,000 to $99,999 | 104 (36.6%) | 138 (40.7%) |
| $100,000 to $299,999 | 131 (46.1%) | 124 (36.6%) |
| $300,000 to $499,999 | 0 (0.0%) | 6 (1.8%) |
| $500,000 to $749,999 | 0 (0.0%) | 0 (0.0%) |
| $750,000 to $999,999 | 0 (0.0%) | 0 (0.0%) |
| $1,000,000 or more | 0 (0.0%) | 0 (0.0%) |
| Total | 284 (100.0%) | 339 (100.0%) |
Household Income by Mortgage Status in Marion
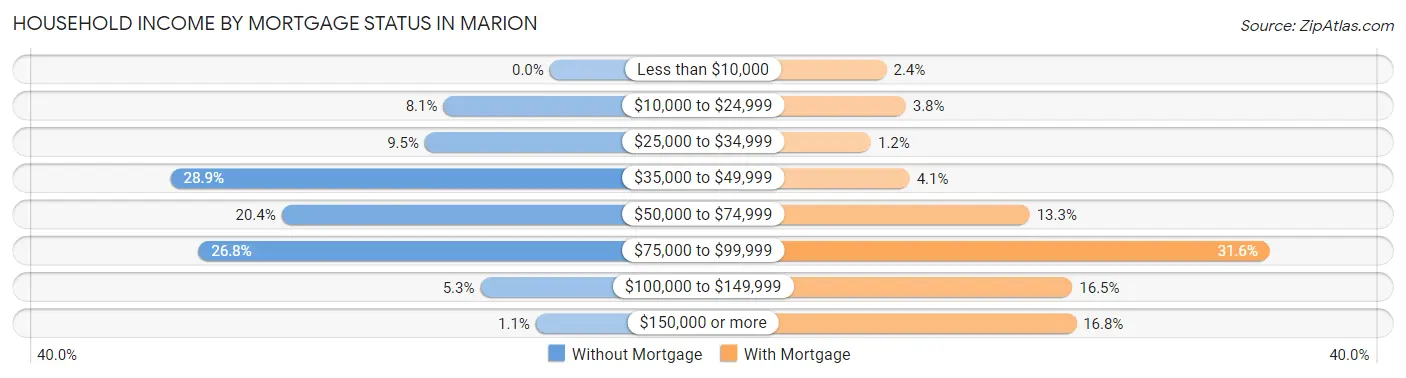
| Household Income | Without Mortgage | With Mortgage |
| Less than $10,000 | 0 (0.0%) | 8 (2.4%) |
| $10,000 to $24,999 | 23 (8.1%) | 13 (3.8%) |
| $25,000 to $34,999 | 27 (9.5%) | 4 (1.2%) |
| $35,000 to $49,999 | 82 (28.9%) | 14 (4.1%) |
| $50,000 to $74,999 | 58 (20.4%) | 45 (13.3%) |
| $75,000 to $99,999 | 76 (26.8%) | 107 (31.6%) |
| $100,000 to $149,999 | 15 (5.3%) | 56 (16.5%) |
| $150,000 or more | 3 (1.1%) | 57 (16.8%) |
| Total | 284 (100.0%) | 339 (100.0%) |
Property Value to Household Income Ratio in Marion
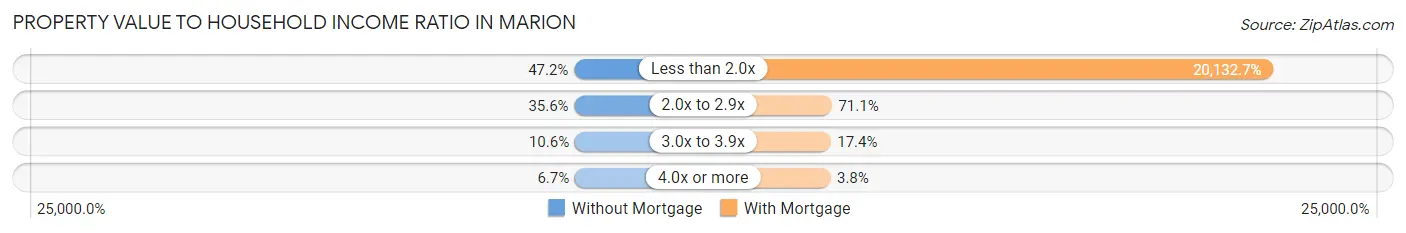
| Value-to-Income Ratio | Without Mortgage | With Mortgage |
| Less than 2.0x | 134 (47.2%) | 68,250 (20,132.7%) |
| 2.0x to 2.9x | 101 (35.6%) | 241 (71.1%) |
| 3.0x to 3.9x | 30 (10.6%) | 59 (17.4%) |
| 4.0x or more | 19 (6.7%) | 13 (3.8%) |
| Total | 284 (100.0%) | 339 (100.0%) |
Real Estate Taxes by Mortgage Status in Marion
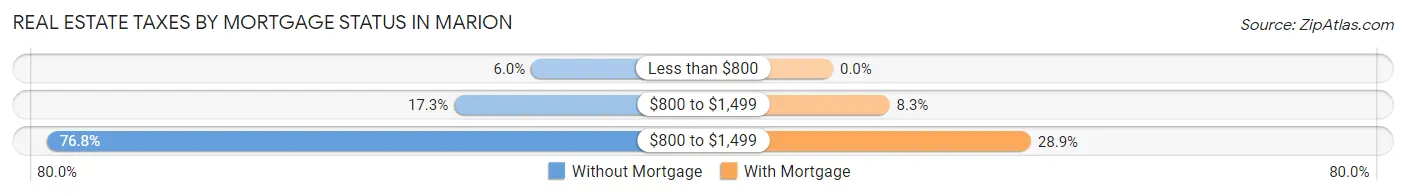
| Property Taxes | Without Mortgage | With Mortgage |
| Less than $800 | 17 (6.0%) | 0 (0.0%) |
| $800 to $1,499 | 49 (17.2%) | 28 (8.3%) |
| $800 to $1,499 | 218 (76.8%) | 98 (28.9%) |
| Total | 284 (100.0%) | 339 (100.0%) |
Health & Disability in Marion
Health Insurance Coverage by Age in Marion
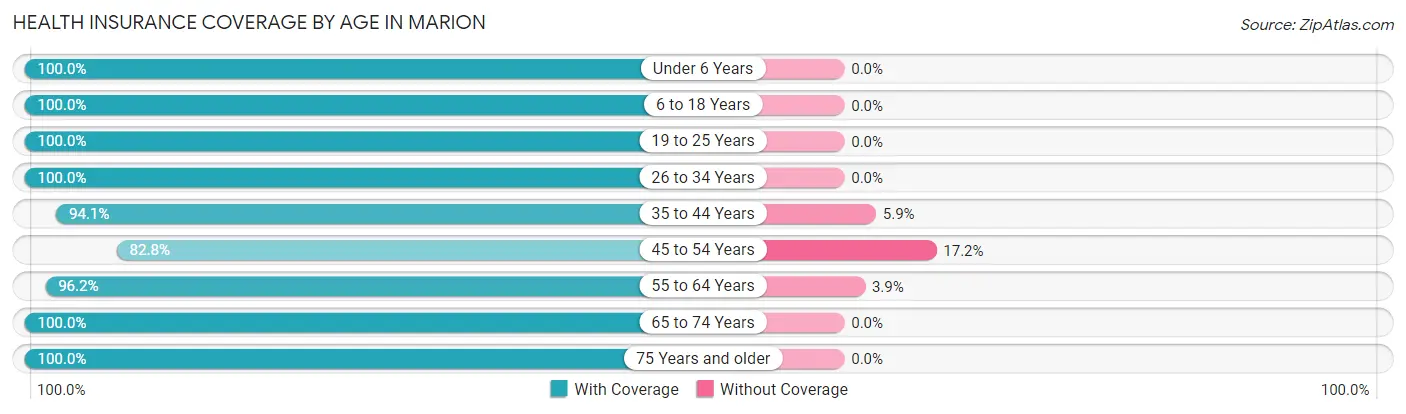
| Age Bracket | With Coverage | Without Coverage |
| Under 6 Years | 175 (100.0%) | 0 (0.0%) |
| 6 to 18 Years | 257 (100.0%) | 0 (0.0%) |
| 19 to 25 Years | 50 (100.0%) | 0 (0.0%) |
| 26 to 34 Years | 248 (100.0%) | 0 (0.0%) |
| 35 to 44 Years | 144 (94.1%) | 9 (5.9%) |
| 45 to 54 Years | 164 (82.8%) | 34 (17.2%) |
| 55 to 64 Years | 225 (96.2%) | 9 (3.8%) |
| 65 to 74 Years | 233 (100.0%) | 0 (0.0%) |
| 75 Years and older | 249 (100.0%) | 0 (0.0%) |
| Total | 1,745 (97.1%) | 52 (2.9%) |
Health Insurance Coverage by Citizenship Status in Marion
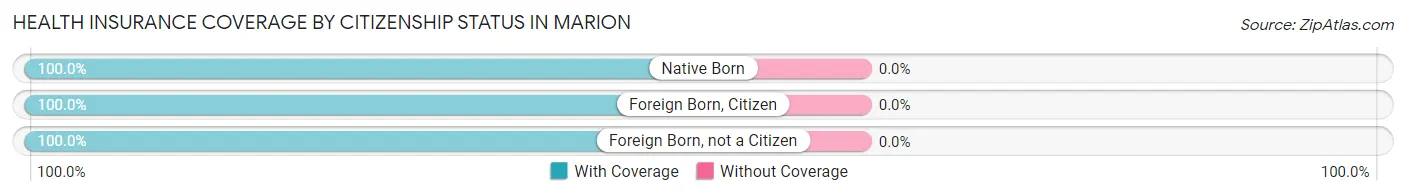
| Citizenship Status | With Coverage | Without Coverage |
| Native Born | 175 (100.0%) | 0 (0.0%) |
| Foreign Born, Citizen | 257 (100.0%) | 0 (0.0%) |
| Foreign Born, not a Citizen | 50 (100.0%) | 0 (0.0%) |
Health Insurance Coverage by Household Income in Marion
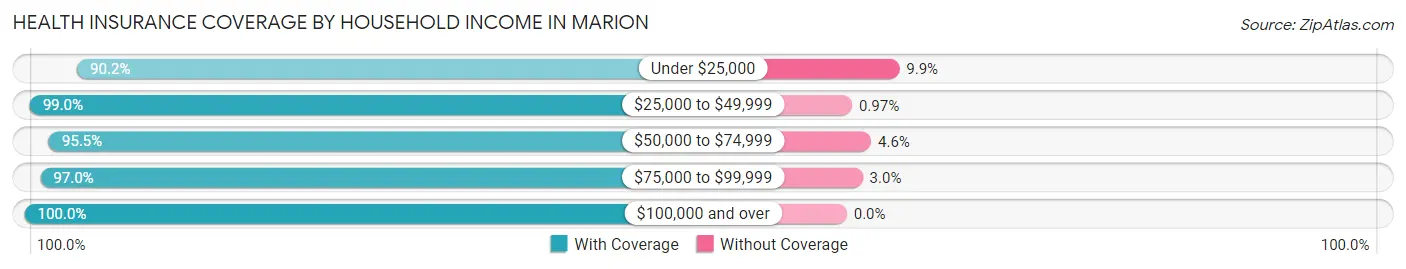
| Household Income | With Coverage | Without Coverage |
| Under $25,000 | 119 (90.1%) | 13 (9.9%) |
| $25,000 to $49,999 | 408 (99.0%) | 4 (1.0%) |
| $50,000 to $74,999 | 524 (95.5%) | 25 (4.5%) |
| $75,000 to $99,999 | 327 (97.0%) | 10 (3.0%) |
| $100,000 and over | 367 (100.0%) | 0 (0.0%) |
Public vs Private Health Insurance Coverage by Age in Marion
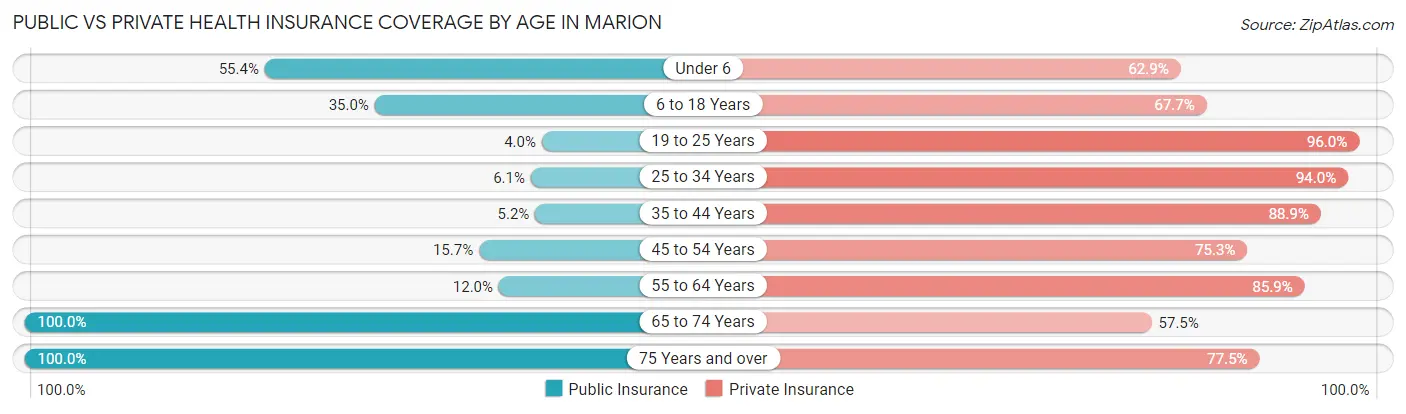
| Age Bracket | Public Insurance | Private Insurance |
| Under 6 | 97 (55.4%) | 110 (62.9%) |
| 6 to 18 Years | 90 (35.0%) | 174 (67.7%) |
| 19 to 25 Years | 2 (4.0%) | 48 (96.0%) |
| 25 to 34 Years | 15 (6.0%) | 233 (94.0%) |
| 35 to 44 Years | 8 (5.2%) | 136 (88.9%) |
| 45 to 54 Years | 31 (15.7%) | 149 (75.2%) |
| 55 to 64 Years | 28 (12.0%) | 201 (85.9%) |
| 65 to 74 Years | 233 (100.0%) | 134 (57.5%) |
| 75 Years and over | 249 (100.0%) | 193 (77.5%) |
| Total | 753 (41.9%) | 1,378 (76.7%) |
Disability Status by Sex by Age in Marion
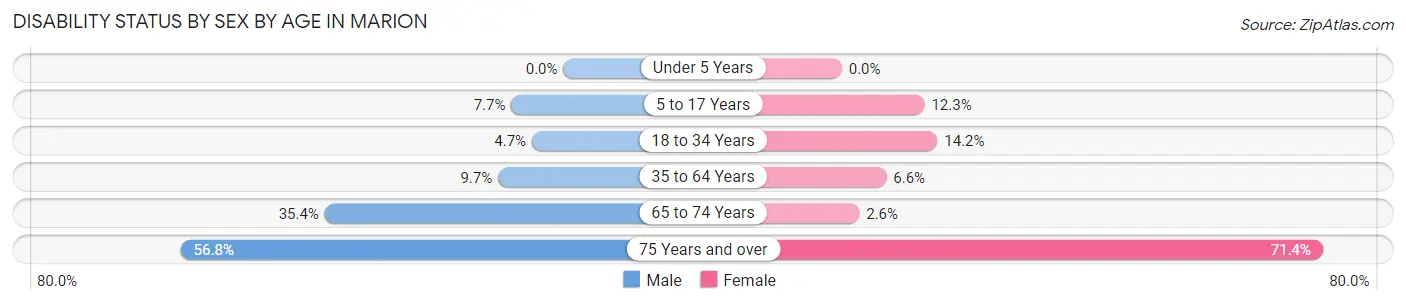
| Age Bracket | Male | Female |
| Under 5 Years | 0 (0.0%) | 0 (0.0%) |
| 5 to 17 Years | 14 (7.7%) | 14 (12.3%) |
| 18 to 34 Years | 7 (4.7%) | 21 (14.2%) |
| 35 to 64 Years | 26 (9.7%) | 21 (6.6%) |
| 65 to 74 Years | 28 (35.4%) | 4 (2.6%) |
| 75 Years and over | 50 (56.8%) | 115 (71.4%) |
Disability Class by Sex by Age in Marion
Disability Class: Hearing Difficulty
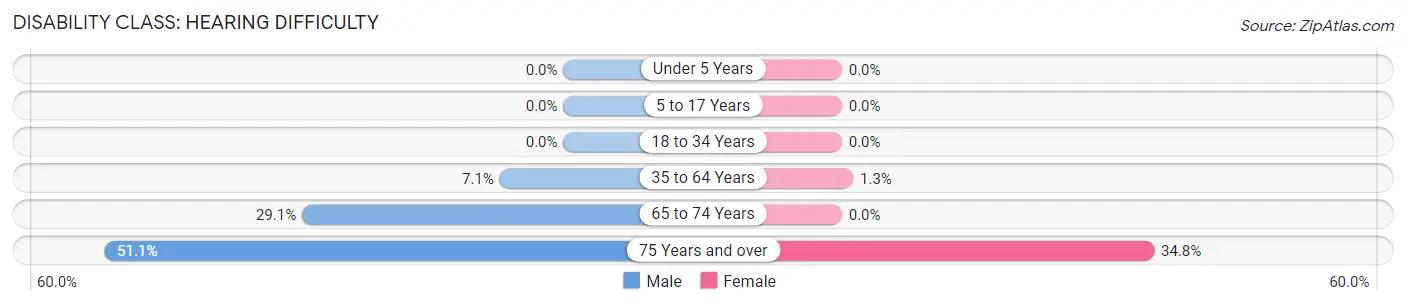
| Age Bracket | Male | Female |
| Under 5 Years | 0 (0.0%) | 0 (0.0%) |
| 5 to 17 Years | 0 (0.0%) | 0 (0.0%) |
| 18 to 34 Years | 0 (0.0%) | 0 (0.0%) |
| 35 to 64 Years | 19 (7.1%) | 4 (1.3%) |
| 65 to 74 Years | 23 (29.1%) | 0 (0.0%) |
| 75 Years and over | 45 (51.1%) | 56 (34.8%) |
Disability Class: Vision Difficulty
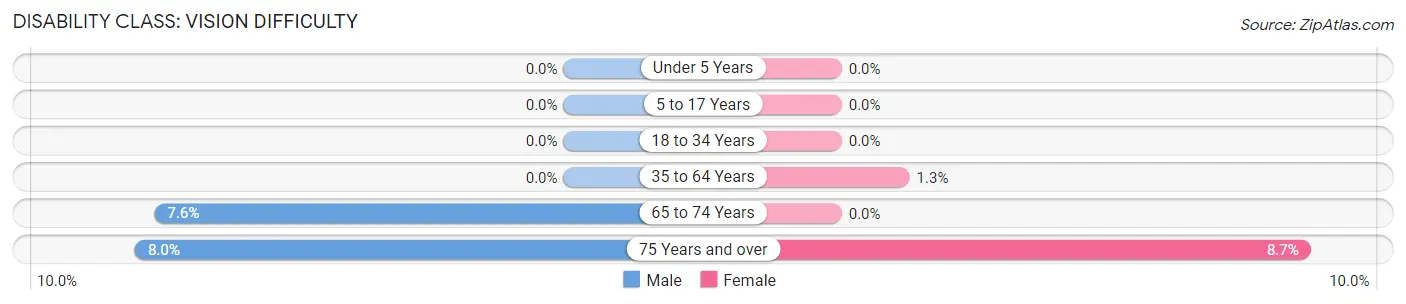
| Age Bracket | Male | Female |
| Under 5 Years | 0 (0.0%) | 0 (0.0%) |
| 5 to 17 Years | 0 (0.0%) | 0 (0.0%) |
| 18 to 34 Years | 0 (0.0%) | 0 (0.0%) |
| 35 to 64 Years | 0 (0.0%) | 4 (1.3%) |
| 65 to 74 Years | 6 (7.6%) | 0 (0.0%) |
| 75 Years and over | 7 (8.0%) | 14 (8.7%) |
Disability Class: Cognitive Difficulty
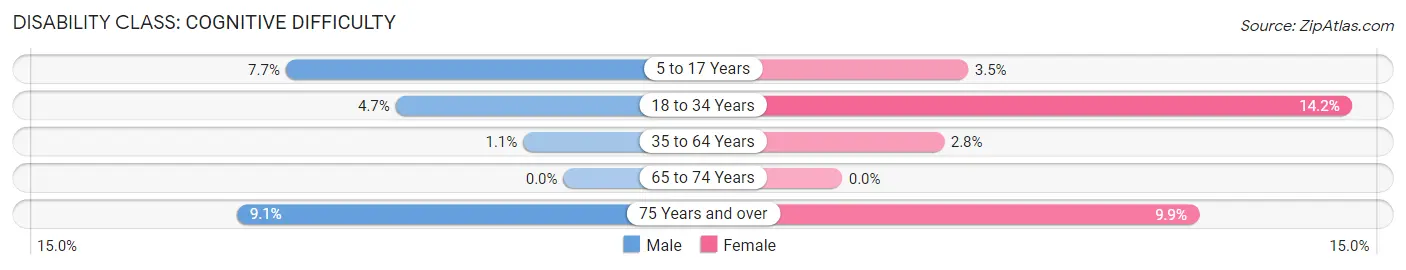
| Age Bracket | Male | Female |
| 5 to 17 Years | 14 (7.7%) | 4 (3.5%) |
| 18 to 34 Years | 7 (4.7%) | 21 (14.2%) |
| 35 to 64 Years | 3 (1.1%) | 9 (2.8%) |
| 65 to 74 Years | 0 (0.0%) | 0 (0.0%) |
| 75 Years and over | 8 (9.1%) | 16 (9.9%) |
Disability Class: Ambulatory Difficulty
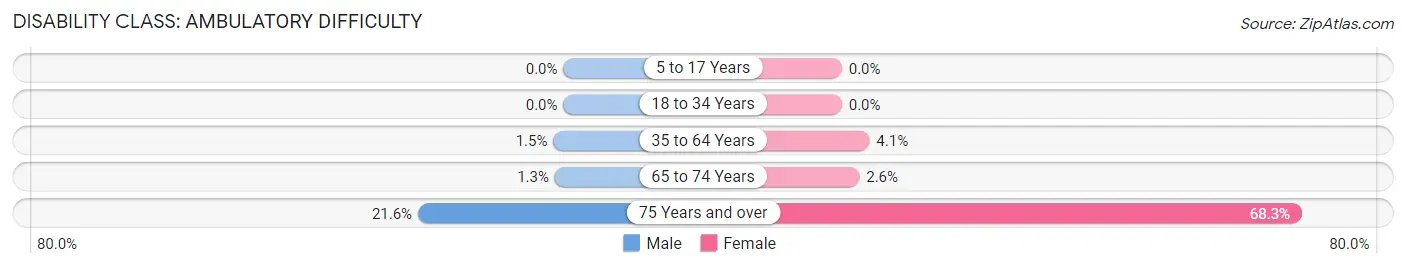
| Age Bracket | Male | Female |
| 5 to 17 Years | 0 (0.0%) | 0 (0.0%) |
| 18 to 34 Years | 0 (0.0%) | 0 (0.0%) |
| 35 to 64 Years | 4 (1.5%) | 13 (4.1%) |
| 65 to 74 Years | 1 (1.3%) | 4 (2.6%) |
| 75 Years and over | 19 (21.6%) | 110 (68.3%) |
Disability Class: Self-Care Difficulty
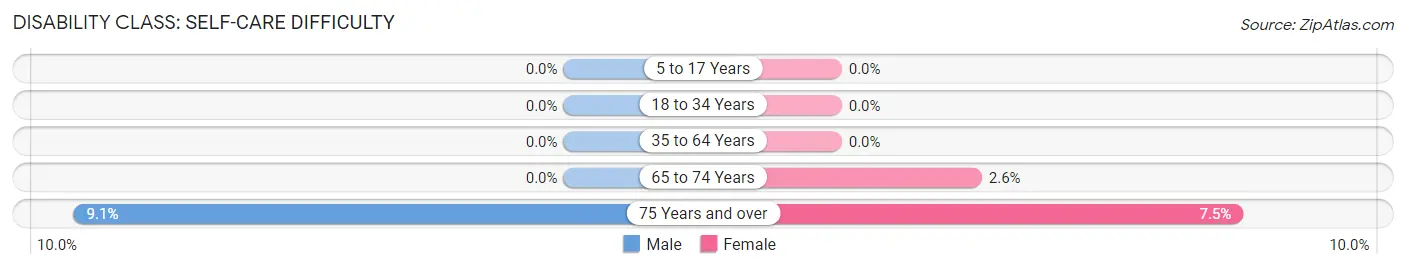
| Age Bracket | Male | Female |
| 5 to 17 Years | 0 (0.0%) | 0 (0.0%) |
| 18 to 34 Years | 0 (0.0%) | 0 (0.0%) |
| 35 to 64 Years | 0 (0.0%) | 0 (0.0%) |
| 65 to 74 Years | 0 (0.0%) | 4 (2.6%) |
| 75 Years and over | 8 (9.1%) | 12 (7.4%) |
Technology Access in Marion
Computing Device Access in Marion
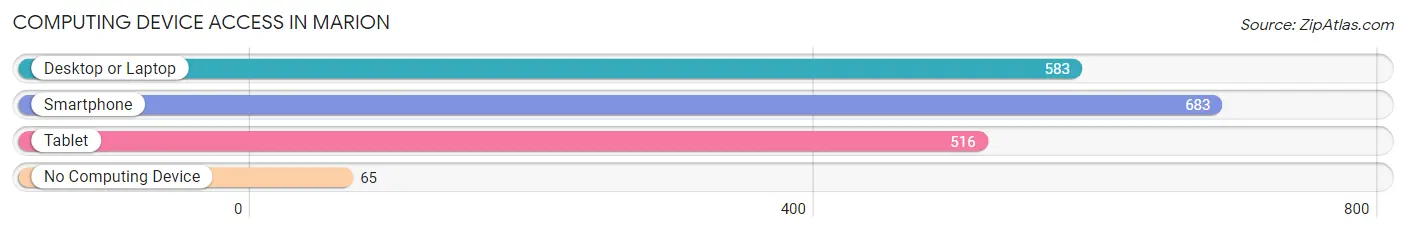
| Device Type | # Households | % Households |
| Desktop or Laptop | 583 | 69.5% |
| Smartphone | 683 | 81.4% |
| Tablet | 516 | 61.5% |
| No Computing Device | 65 | 7.7% |
| Total | 839 | 100.0% |
Internet Access in Marion
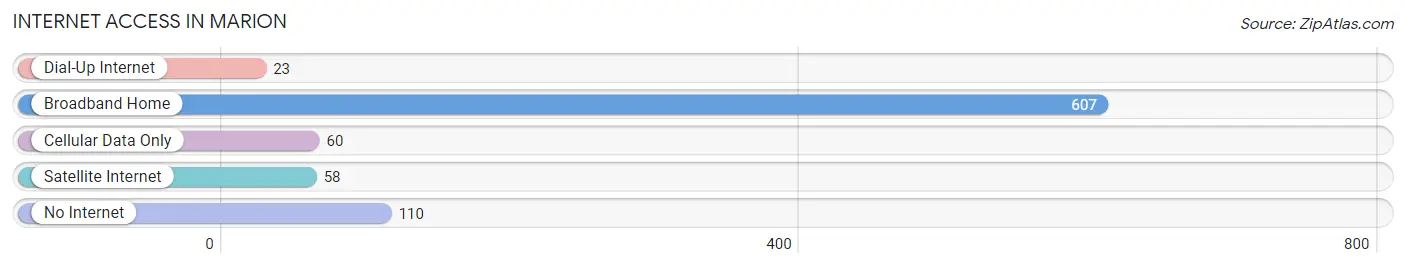
| Internet Type | # Households | % Households |
| Dial-Up Internet | 23 | 2.7% |
| Broadband Home | 607 | 72.4% |
| Cellular Data Only | 60 | 7.1% |
| Satellite Internet | 58 | 6.9% |
| No Internet | 110 | 13.1% |
| Total | 839 | 100.0% |
Marion Summary
Marion, Kansas is a small city located in the heart of the state, in Marion County. It is situated in the Flint Hills region of the state, and is known for its rolling hills and prairie landscape. The city is home to a population of just over 2,000 people, and is the county seat of Marion County.
History
Marion was founded in 1857, when the first settlers arrived in the area. The city was named after Francis Marion, a Revolutionary War hero. The city was incorporated in 1872, and the first post office was established in 1873.
In the late 19th century, Marion was a bustling agricultural center, with a variety of crops being grown in the area. The city was also home to a number of businesses, including a flour mill, a brickyard, and a furniture factory.
In the early 20th century, Marion experienced a period of growth and development. The city was home to a number of businesses, including a bank, a newspaper, a hotel, and a movie theater. The city also had a number of churches, schools, and other civic organizations.
Geography
Marion is located in the Flint Hills region of Kansas, in the central part of the state. The city is situated in Marion County, and is bordered by the cities of Hillsboro, Peabody, and Florence. The city is located at an elevation of 1,072 feet above sea level.
The city is located in a region of rolling hills and prairie landscape. The area is known for its abundance of wildlife, including deer, wild turkeys, and quail. The city is also home to a number of parks and recreational areas, including Marion County Park and the Marion County Fairgrounds.
Economy
Marion’s economy is largely based on agriculture. The city is home to a number of farms, which produce a variety of crops, including wheat, corn, soybeans, and sorghum. The city is also home to a number of businesses, including a bank, a newspaper, a hotel, and a movie theater.
The city is also home to a number of manufacturing businesses, including a furniture factory and a brickyard. The city is also home to a number of retail stores, including a grocery store, a hardware store, and a variety of other shops.
Demographics
As of the 2010 census, Marion had a population of 2,039 people. The racial makeup of the city was 95.3% White, 0.7% African American, 0.3% Native American, 0.2% Asian, 0.1% Pacific Islander, 1.2% from other races, and 2.4% from two or more races. Hispanic or Latino of any race were 3.2% of the population.
The median household income in Marion was $37,917, and the median family income was $45,938. The per capita income in the city was $19,945. About 11.2% of families and 14.2% of the population were below the poverty line, including 19.2% of those under age 18 and 8.2% of those age 65 or over.
Common Questions
What is Per Capita Income in Marion?
Per Capita income in Marion is $31,465.
What is the Median Family Income in Marion?
Median Family Income in Marion is $78,750.
What is the Median Household income in Marion?
Median Household Income in Marion is $55,542.
What is Income or Wage Gap in Marion?
Income or Wage Gap in Marion is 52.3%.
Women in Marion earn 47.7 cents for every dollar earned by a man.
What is Inequality or Gini Index in Marion?
Inequality or Gini Index in Marion is 0.38.
What is the Total Population of Marion?
Total Population of Marion is 1,837.
What is the Total Male Population of Marion?
Total Male Population of Marion is 856.
What is the Total Female Population of Marion?
Total Female Population of Marion is 981.
What is the Ratio of Males per 100 Females in Marion?
There are 87.26 Males per 100 Females in Marion.
What is the Ratio of Females per 100 Males in Marion?
There are 114.60 Females per 100 Males in Marion.
What is the Median Population Age in Marion?
Median Population Age in Marion is 47.0 Years.
What is the Average Family Size in Marion
Average Family Size in Marion is 2.8 People.
What is the Average Household Size in Marion
Average Household Size in Marion is 2.1 People.
How Large is the Labor Force in Marion?
There are 840 People in the Labor Forcein in Marion.
What is the Percentage of People in the Labor Force in Marion?
57.8% of People are in the Labor Force in Marion.