Lindsborg, KS Map & Demographics
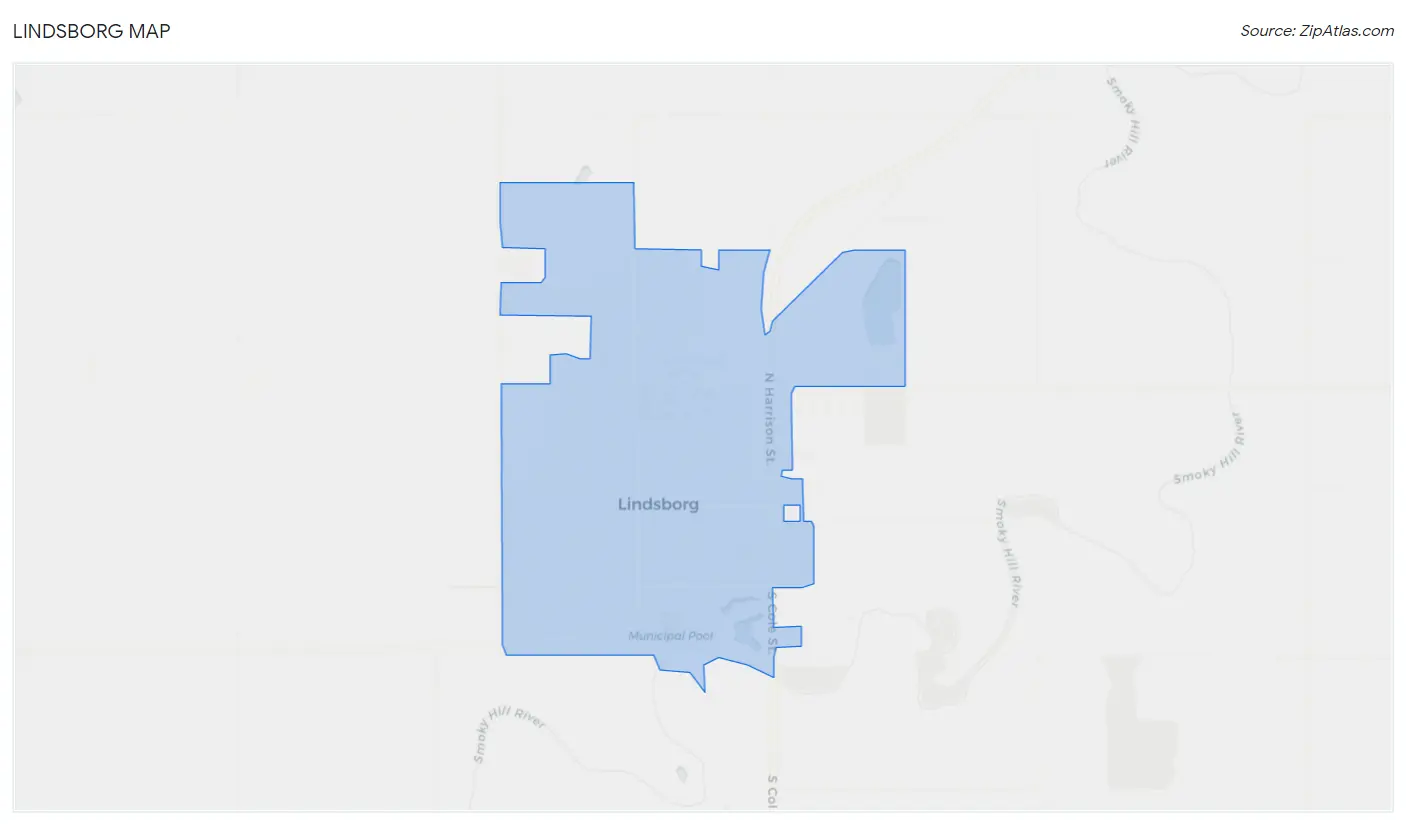
Lindsborg Map
Lindsborg Overview
$29,518
PER CAPITA INCOME
$86,833
AVG FAMILY INCOME
$67,059
AVG HOUSEHOLD INCOME
32.5%
WAGE / INCOME GAP [ % ]
67.5¢/ $1
WAGE / INCOME GAP [ $ ]
0.37
INEQUALITY / GINI INDEX
3,762
TOTAL POPULATION
1,840
MALE POPULATION
1,922
FEMALE POPULATION
95.73
MALES / 100 FEMALES
104.46
FEMALES / 100 MALES
31.6
MEDIAN AGE
3.1
AVG FAMILY SIZE
2.4
AVG HOUSEHOLD SIZE
1,928
LABOR FORCE [ PEOPLE ]
62.4%
PERCENT IN LABOR FORCE
2.0%
UNEMPLOYMENT RATE
Lindsborg Zip Codes
Lindsborg Area Codes
Income in Lindsborg
Income Overview in Lindsborg
Per Capita Income in Lindsborg is $29,518, while median incomes of families and households are $86,833 and $67,059 respectively.
| Characteristic | Number | Measure |
| Per Capita Income | 3,762 | $29,518 |
| Median Family Income | 834 | $86,833 |
| Mean Family Income | 834 | $90,671 |
| Median Household Income | 1,322 | $67,059 |
| Mean Household Income | 1,322 | $76,399 |
| Income Deficit | 834 | $0 |
| Wage / Income Gap (%) | 3,762 | 32.51% |
| Wage / Income Gap ($) | 3,762 | 67.49¢ per $1 |
| Gini / Inequality Index | 3,762 | 0.37 |
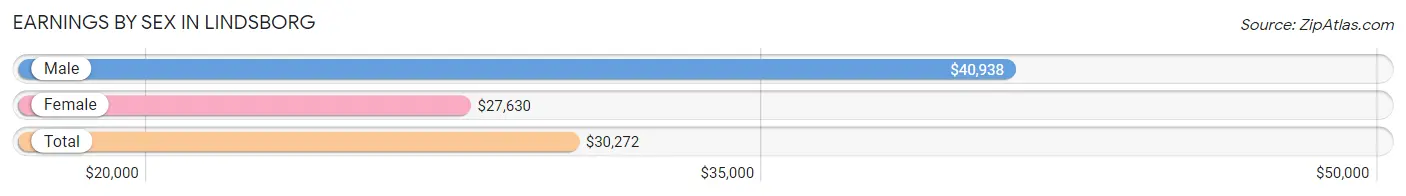
Earnings by Sex in Lindsborg
Average Earnings in Lindsborg are $30,272, $40,938 for men and $27,630 for women, a difference of 32.5%.
| Sex | Number | Average Earnings |
| Male | 1,219 (56.8%) | $40,938 |
| Female | 928 (43.2%) | $27,630 |
| Total | 2,147 (100.0%) | $30,272 |
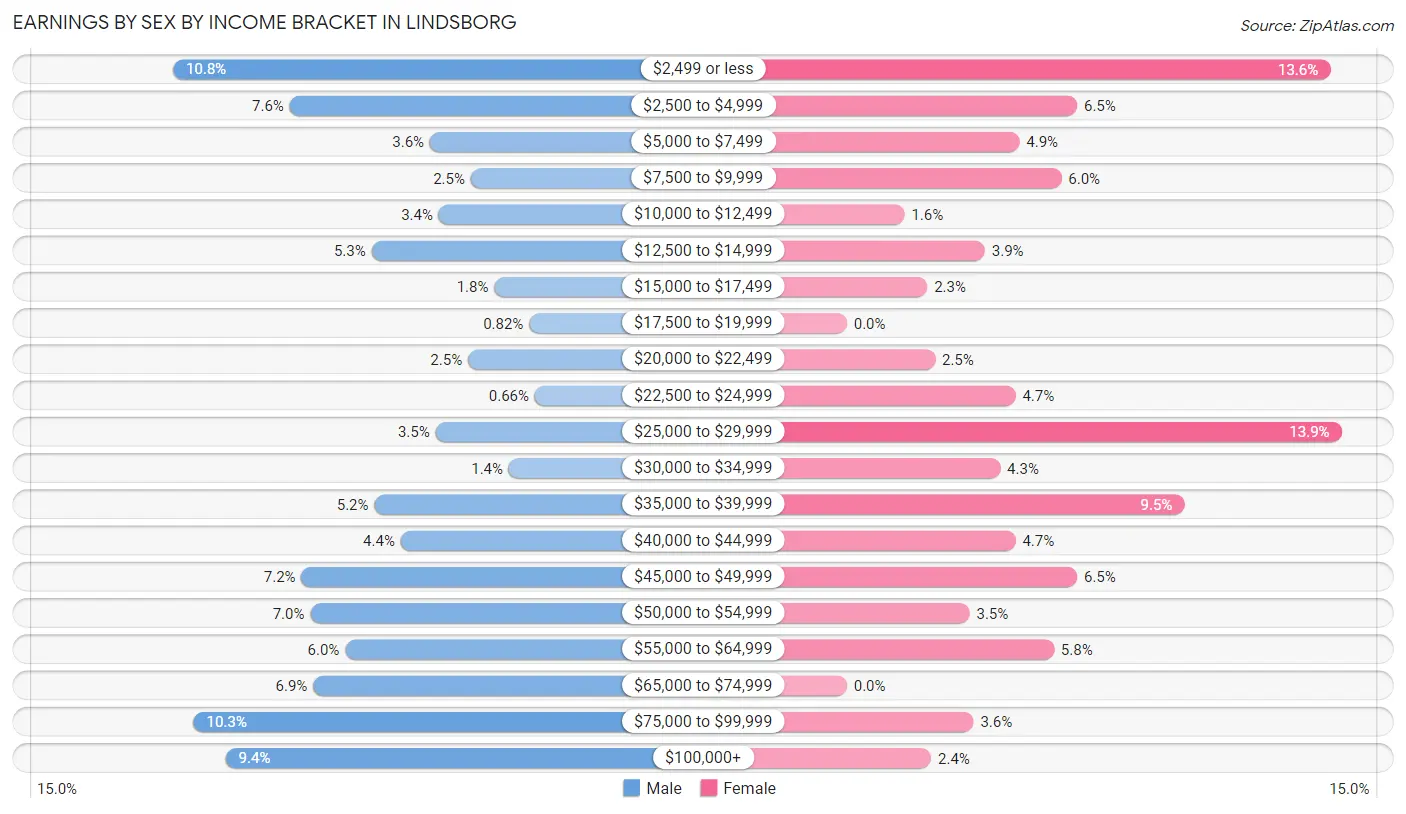
Earnings by Sex by Income Bracket in Lindsborg
The most common earnings brackets in Lindsborg are $2,499 or less for men (132 | 10.8%) and $25,000 to $29,999 for women (129 | 13.9%).
| Income | Male | Female |
| $2,499 or less | 132 (10.8%) | 126 (13.6%) |
| $2,500 to $4,999 | 92 (7.5%) | 60 (6.5%) |
| $5,000 to $7,499 | 44 (3.6%) | 45 (4.9%) |
| $7,500 to $9,999 | 30 (2.5%) | 56 (6.0%) |
| $10,000 to $12,499 | 41 (3.4%) | 15 (1.6%) |
| $12,500 to $14,999 | 64 (5.2%) | 36 (3.9%) |
| $15,000 to $17,499 | 22 (1.8%) | 21 (2.3%) |
| $17,500 to $19,999 | 10 (0.8%) | 0 (0.0%) |
| $20,000 to $22,499 | 31 (2.5%) | 23 (2.5%) |
| $22,500 to $24,999 | 8 (0.7%) | 44 (4.7%) |
| $25,000 to $29,999 | 42 (3.5%) | 129 (13.9%) |
| $30,000 to $34,999 | 17 (1.4%) | 40 (4.3%) |
| $35,000 to $39,999 | 63 (5.2%) | 88 (9.5%) |
| $40,000 to $44,999 | 54 (4.4%) | 44 (4.7%) |
| $45,000 to $49,999 | 88 (7.2%) | 60 (6.5%) |
| $50,000 to $54,999 | 85 (7.0%) | 32 (3.5%) |
| $55,000 to $64,999 | 73 (6.0%) | 54 (5.8%) |
| $65,000 to $74,999 | 84 (6.9%) | 0 (0.0%) |
| $75,000 to $99,999 | 125 (10.2%) | 33 (3.6%) |
| $100,000+ | 114 (9.3%) | 22 (2.4%) |
| Total | 1,219 (100.0%) | 928 (100.0%) |
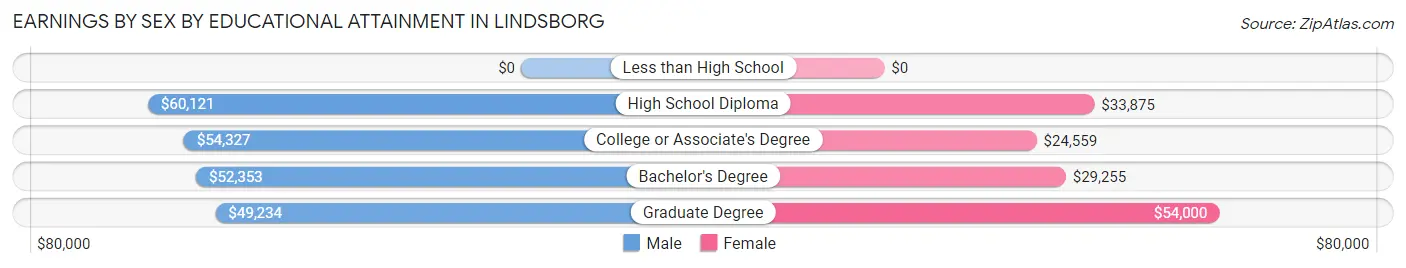
Earnings by Sex by Educational Attainment in Lindsborg
Average earnings in Lindsborg are $53,706 for men and $29,736 for women, a difference of 44.6%. Men with an educational attainment of high school diploma enjoy the highest average annual earnings of $60,121, while those with graduate degree education earn the least with $49,234. Women with an educational attainment of graduate degree earn the most with the average annual earnings of $54,000, while those with college or associate's degree education have the smallest earnings of $24,559.
| Educational Attainment | Male Income | Female Income |
| Less than High School | - | - |
| High School Diploma | $60,121 | $33,875 |
| College or Associate's Degree | $54,327 | $24,559 |
| Bachelor's Degree | $52,353 | $29,255 |
| Graduate Degree | $49,234 | $54,000 |
| Total | $53,706 | $29,736 |
Family Income in Lindsborg
Family Income Brackets in Lindsborg
According to the Lindsborg family income data, there are 217 families falling into the $75,000 to $99,999 income range, which is the most common income bracket and makes up 26.0% of all families. Conversely, the less than $10,000 income bracket is the least frequent group with only 12 families (1.4%) belonging to this category.
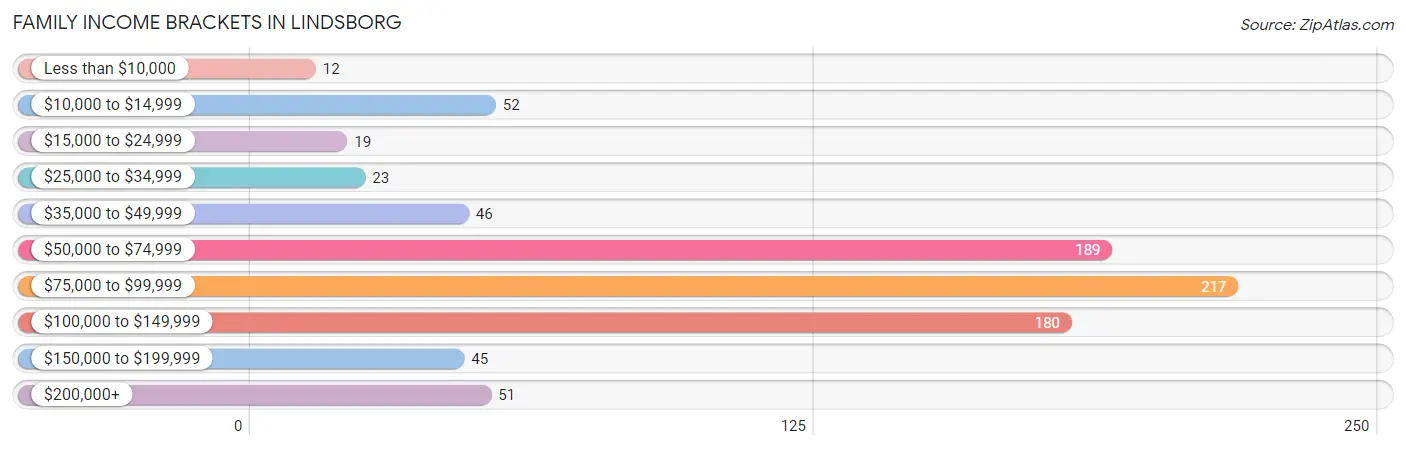
| Income Bracket | # Families | % Families |
| Less than $10,000 | 12 | 1.4% |
| $10,000 to $14,999 | 52 | 6.2% |
| $15,000 to $24,999 | 19 | 2.3% |
| $25,000 to $34,999 | 23 | 2.8% |
| $35,000 to $49,999 | 46 | 5.5% |
| $50,000 to $74,999 | 189 | 22.7% |
| $75,000 to $99,999 | 217 | 26.0% |
| $100,000 to $149,999 | 180 | 21.6% |
| $150,000 to $199,999 | 45 | 5.4% |
| $200,000+ | 51 | 6.1% |
Family Income by Famaliy Size in Lindsborg
4-person families (126 | 15.1%) account for the highest median family income in Lindsborg with $96,935 per family, while 2-person families (343 | 41.1%) have the highest median income of $38,125 per family member.
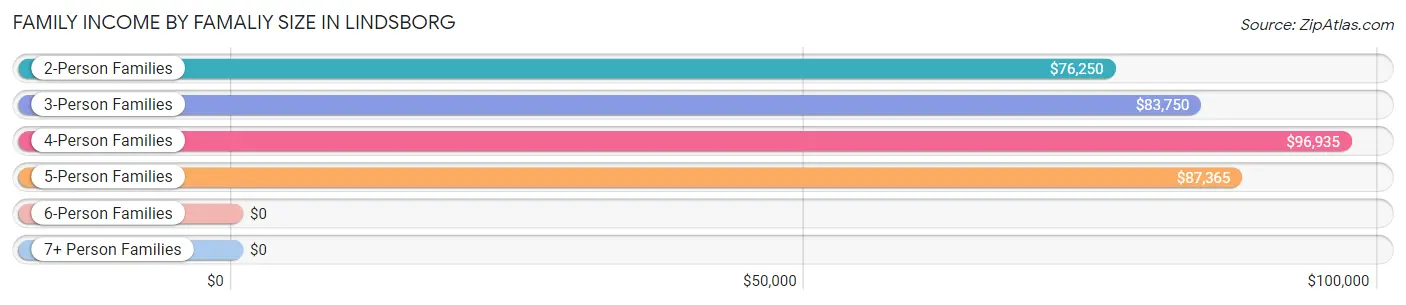
| Income Bracket | # Families | Median Income |
| 2-Person Families | 343 (41.1%) | $76,250 |
| 3-Person Families | 270 (32.4%) | $83,750 |
| 4-Person Families | 126 (15.1%) | $96,935 |
| 5-Person Families | 70 (8.4%) | $87,365 |
| 6-Person Families | 0 (0.0%) | $0 |
| 7+ Person Families | 25 (3.0%) | $0 |
| Total | 834 (100.0%) | $86,833 |
Family Income by Number of Earners in Lindsborg
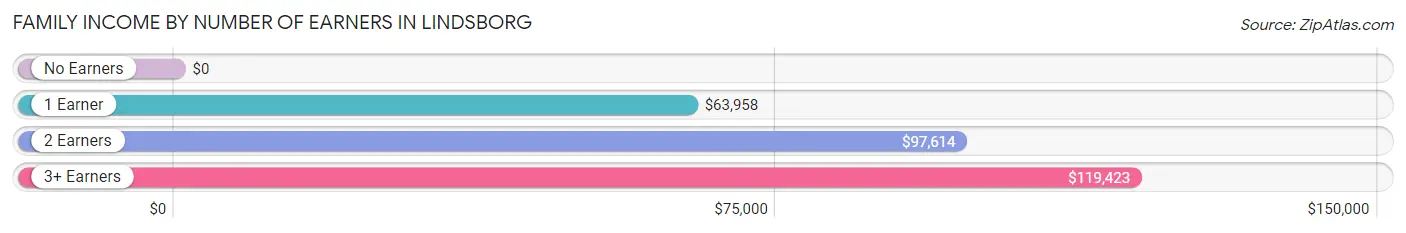
| Number of Earners | # Families | Median Income |
| No Earners | 128 (15.3%) | $0 |
| 1 Earner | 247 (29.6%) | $63,958 |
| 2 Earners | 357 (42.8%) | $97,614 |
| 3+ Earners | 102 (12.2%) | $119,423 |
| Total | 834 (100.0%) | $86,833 |
Household Income in Lindsborg
Household Income Brackets in Lindsborg
With 286 households falling in the category, the $50,000 to $74,999 income range is the most frequent in Lindsborg, accounting for 21.6% of all households. In contrast, only 52 households (3.9%) fall into the $10,000 to $14,999 income bracket, making it the least populous group.
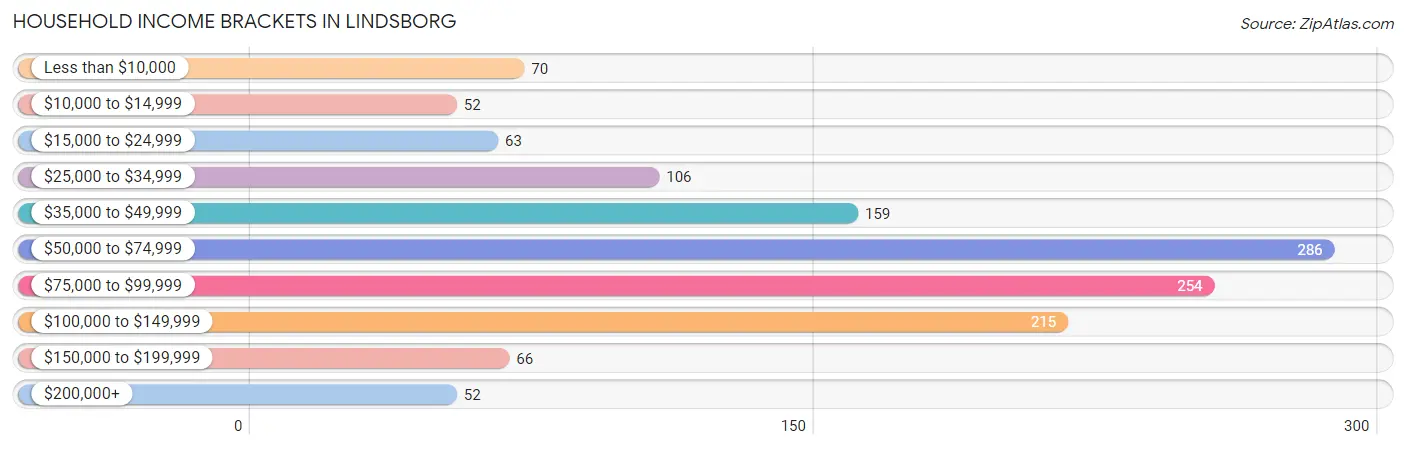
| Income Bracket | # Households | % Households |
| Less than $10,000 | 70 | 5.3% |
| $10,000 to $14,999 | 52 | 3.9% |
| $15,000 to $24,999 | 63 | 4.8% |
| $25,000 to $34,999 | 106 | 8.0% |
| $35,000 to $49,999 | 159 | 12.0% |
| $50,000 to $74,999 | 286 | 21.6% |
| $75,000 to $99,999 | 254 | 19.2% |
| $100,000 to $149,999 | 215 | 16.3% |
| $150,000 to $199,999 | 66 | 5.0% |
| $200,000+ | 52 | 3.9% |
Household Income by Householder Age in Lindsborg
The median household income in Lindsborg is $67,059, with the highest median household income of $86,318 found in the 25 to 44 years age bracket for the primary householder. A total of 443 households (33.5%) fall into this category. Meanwhile, the 15 to 24 years age bracket for the primary householder has the lowest median household income of $0, with 72 households (5.4%) in this group.
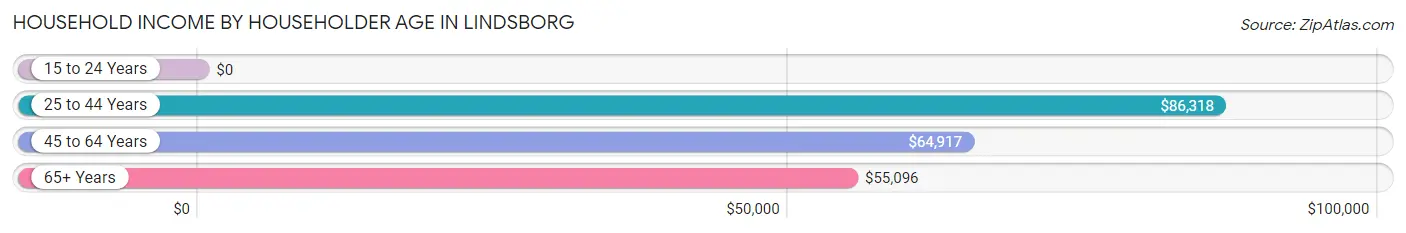
| Income Bracket | # Households | Median Income |
| 15 to 24 Years | 72 (5.4%) | $0 |
| 25 to 44 Years | 443 (33.5%) | $86,318 |
| 45 to 64 Years | 365 (27.6%) | $64,917 |
| 65+ Years | 442 (33.4%) | $55,096 |
| Total | 1,322 (100.0%) | $67,059 |
Poverty in Lindsborg
Income Below Poverty by Sex and Age in Lindsborg
With 5.3% poverty level for males and 10.7% for females among the residents of Lindsborg, under 5 year old males and 12 to 14 year old females are the most vulnerable to poverty, with 25 males (31.2%) and 6 females (28.6%) in their respective age groups living below the poverty level.
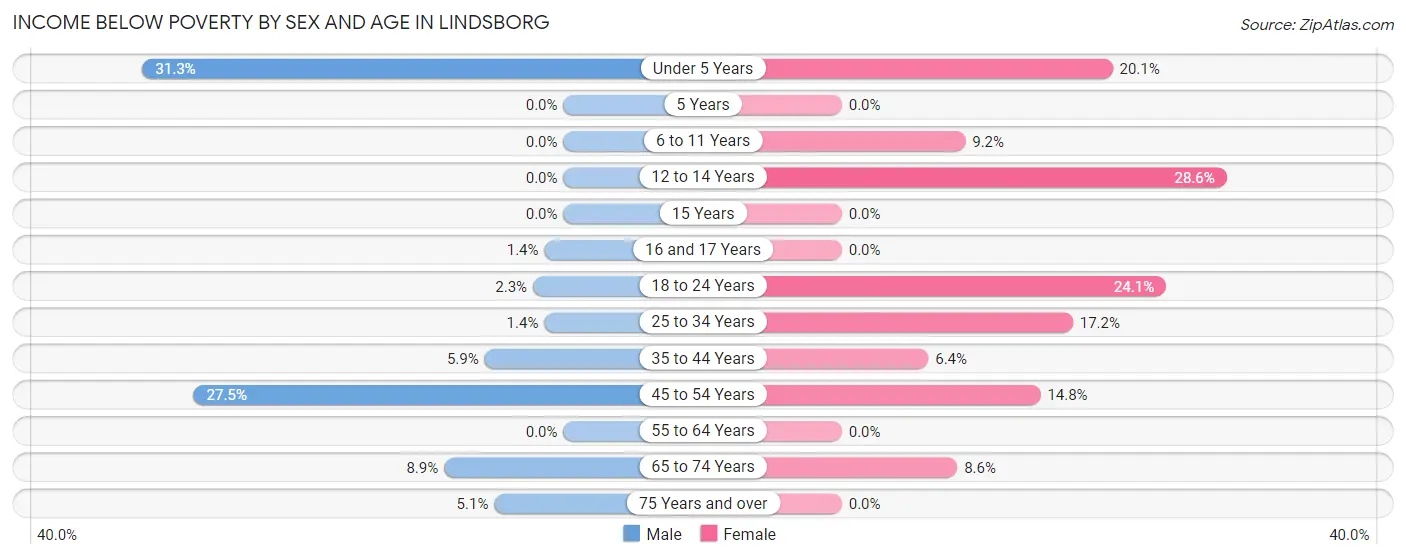
| Age Bracket | Male | Female |
| Under 5 Years | 25 (31.2%) | 39 (20.1%) |
| 5 Years | 0 (0.0%) | 0 (0.0%) |
| 6 to 11 Years | 0 (0.0%) | 11 (9.2%) |
| 12 to 14 Years | 0 (0.0%) | 6 (28.6%) |
| 15 Years | 0 (0.0%) | 0 (0.0%) |
| 16 and 17 Years | 1 (1.4%) | 0 (0.0%) |
| 18 to 24 Years | 3 (2.3%) | 39 (24.1%) |
| 25 to 34 Years | 4 (1.4%) | 41 (17.2%) |
| 35 to 44 Years | 12 (5.9%) | 7 (6.4%) |
| 45 to 54 Years | 14 (27.5%) | 18 (14.7%) |
| 55 to 64 Years | 0 (0.0%) | 0 (0.0%) |
| 65 to 74 Years | 14 (8.9%) | 21 (8.6%) |
| 75 Years and over | 6 (5.1%) | 0 (0.0%) |
| Total | 79 (5.3%) | 182 (10.7%) |
Income Above Poverty by Sex and Age in Lindsborg
According to the poverty statistics in Lindsborg, males aged 5 years and females aged 15 years are the age groups that are most secure financially, with 100.0% of males and 100.0% of females in these age groups living above the poverty line.
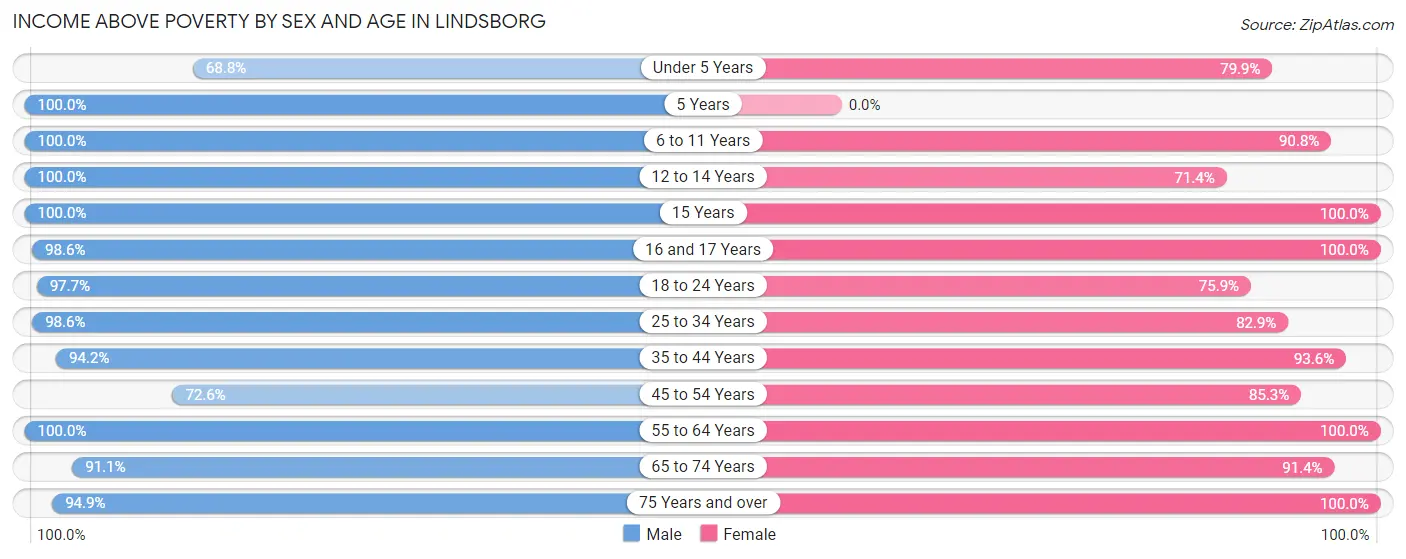
| Age Bracket | Male | Female |
| Under 5 Years | 55 (68.8%) | 155 (79.9%) |
| 5 Years | 19 (100.0%) | 0 (0.0%) |
| 6 to 11 Years | 111 (100.0%) | 109 (90.8%) |
| 12 to 14 Years | 40 (100.0%) | 15 (71.4%) |
| 15 Years | 21 (100.0%) | 67 (100.0%) |
| 16 and 17 Years | 70 (98.6%) | 38 (100.0%) |
| 18 to 24 Years | 130 (97.7%) | 123 (75.9%) |
| 25 to 34 Years | 278 (98.6%) | 198 (82.9%) |
| 35 to 44 Years | 193 (94.2%) | 102 (93.6%) |
| 45 to 54 Years | 37 (72.6%) | 104 (85.3%) |
| 55 to 64 Years | 212 (100.0%) | 249 (100.0%) |
| 65 to 74 Years | 144 (91.1%) | 224 (91.4%) |
| 75 Years and over | 111 (94.9%) | 133 (100.0%) |
| Total | 1,421 (94.7%) | 1,517 (89.3%) |
Income Below Poverty Among Married-Couple Families in Lindsborg
The poverty statistics for married-couple families in Lindsborg show that 0.9% or 6 of the total 709 families live below the poverty line. Families with no children have the highest poverty rate of 1.5%, comprising of 6 families. On the other hand, families with 1 or 2 children have the lowest poverty rate of 0.0%, which includes 0 families.
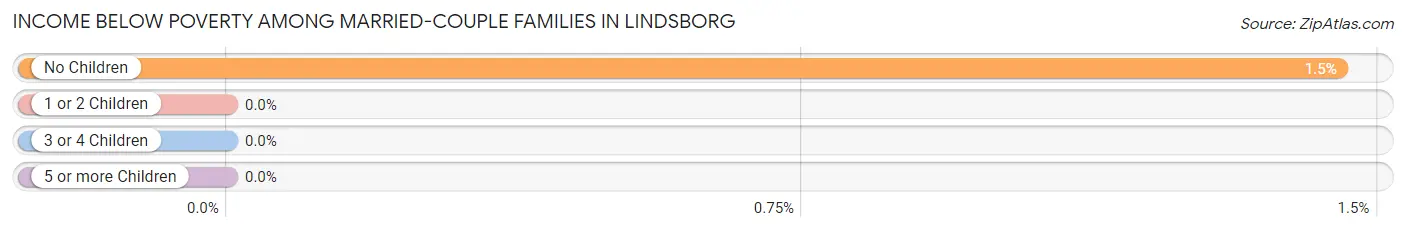
| Children | Above Poverty | Below Poverty |
| No Children | 407 (98.6%) | 6 (1.5%) |
| 1 or 2 Children | 215 (100.0%) | 0 (0.0%) |
| 3 or 4 Children | 72 (100.0%) | 0 (0.0%) |
| 5 or more Children | 9 (100.0%) | 0 (0.0%) |
| Total | 703 (99.2%) | 6 (0.9%) |
Income Below Poverty Among Single-Parent Households in Lindsborg
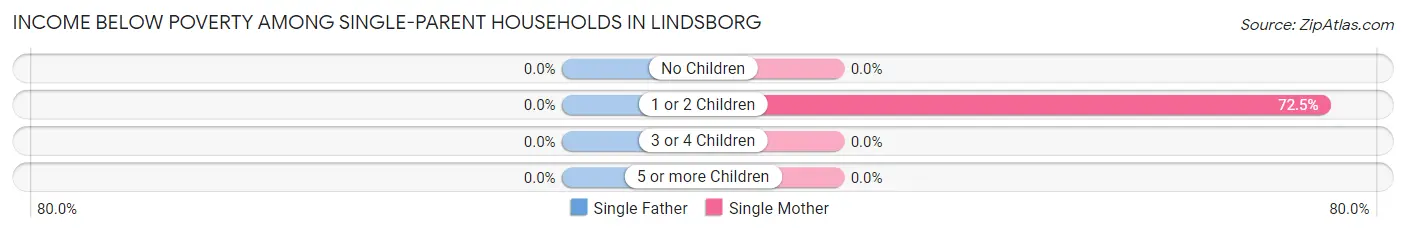
| Children | Single Father | Single Mother |
| No Children | 0 (0.0%) | 0 (0.0%) |
| 1 or 2 Children | 0 (0.0%) | 58 (72.5%) |
| 3 or 4 Children | 0 (0.0%) | 0 (0.0%) |
| 5 or more Children | 0 (0.0%) | 0 (0.0%) |
| Total | 0 (0.0%) | 58 (71.6%) |
Income Below Poverty Among Married-Couple vs Single-Parent Households in Lindsborg
The poverty data for Lindsborg shows that 6 of the married-couple family households (0.9%) and 58 of the single-parent households (46.4%) are living below the poverty level. Within the married-couple family households, those with no children have the highest poverty rate, with 6 households (1.5%) falling below the poverty line. Among the single-parent households, those with 1 or 2 children have the highest poverty rate, with 58 household (47.5%) living below poverty.
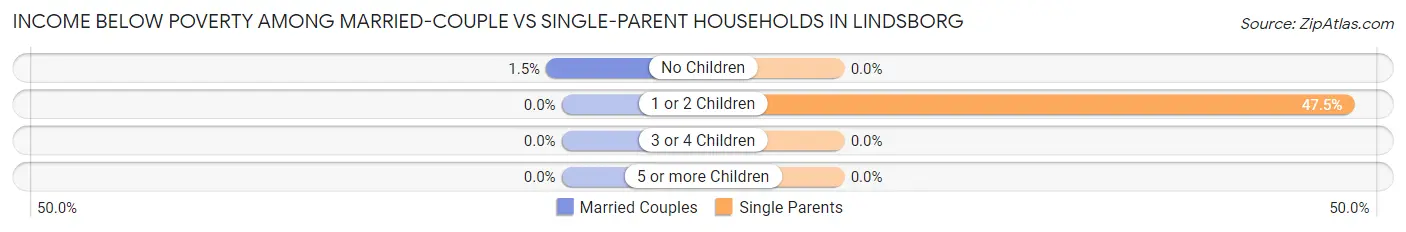
| Children | Married-Couple Families | Single-Parent Households |
| No Children | 6 (1.5%) | 0 (0.0%) |
| 1 or 2 Children | 0 (0.0%) | 58 (47.5%) |
| 3 or 4 Children | 0 (0.0%) | 0 (0.0%) |
| 5 or more Children | 0 (0.0%) | 0 (0.0%) |
| Total | 6 (0.9%) | 58 (46.4%) |
Race in Lindsborg
The most populous races in Lindsborg are White / Caucasian (3,438 | 91.4%), Hispanic or Latino (279 | 7.4%), and Black / African American (142 | 3.8%).
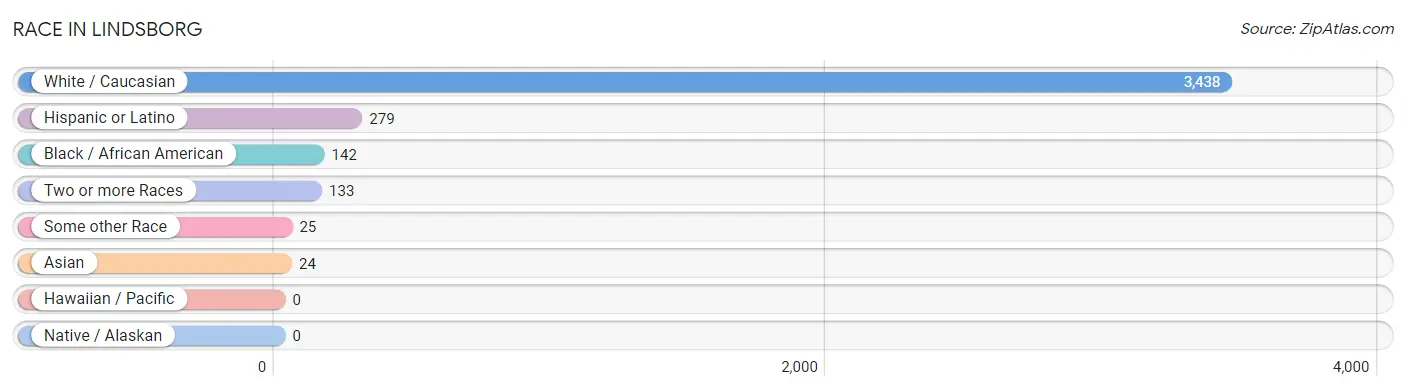
| Race | # Population | % Population |
| Asian | 24 | 0.6% |
| Black / African American | 142 | 3.8% |
| Hawaiian / Pacific | 0 | 0.0% |
| Hispanic or Latino | 279 | 7.4% |
| Native / Alaskan | 0 | 0.0% |
| White / Caucasian | 3,438 | 91.4% |
| Two or more Races | 133 | 3.5% |
| Some other Race | 25 | 0.7% |
| Total | 3,762 | 100.0% |
Ancestry in Lindsborg
The most populous ancestries reported in Lindsborg are German (924 | 24.6%), Swedish (580 | 15.4%), Irish (504 | 13.4%), English (410 | 10.9%), and Mexican (226 | 6.0%), together accounting for 70.3% of all Lindsborg residents.
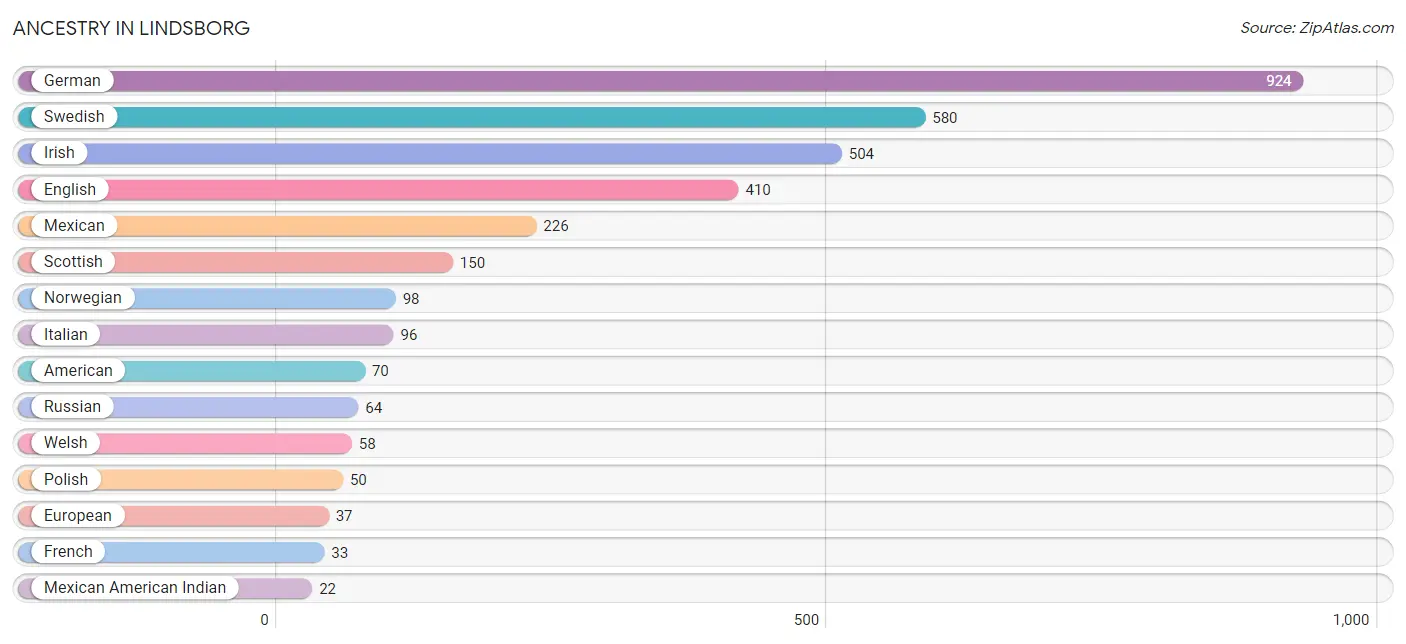
| Ancestry | # Population | % Population |
| American | 70 | 1.9% |
| Austrian | 9 | 0.2% |
| Bhutanese | 4 | 0.1% |
| Burmese | 4 | 0.1% |
| Canadian | 9 | 0.2% |
| Czech | 16 | 0.4% |
| Danish | 21 | 0.6% |
| Dutch | 13 | 0.4% |
| English | 410 | 10.9% |
| European | 37 | 1.0% |
| French | 33 | 0.9% |
| German | 924 | 24.6% |
| Irish | 504 | 13.4% |
| Italian | 96 | 2.5% |
| Malaysian | 9 | 0.2% |
| Mexican | 226 | 6.0% |
| Mexican American Indian | 22 | 0.6% |
| Navajo | 2 | 0.1% |
| Northern European | 12 | 0.3% |
| Norwegian | 98 | 2.6% |
| Polish | 50 | 1.3% |
| Portuguese | 13 | 0.4% |
| Puerto Rican | 13 | 0.4% |
| Russian | 64 | 1.7% |
| Scandinavian | 12 | 0.3% |
| Scottish | 150 | 4.0% |
| Slavic | 12 | 0.3% |
| Slovene | 6 | 0.2% |
| Spaniard | 19 | 0.5% |
| Spanish | 11 | 0.3% |
| Sri Lankan | 11 | 0.3% |
| Swedish | 580 | 15.4% |
| Swiss | 16 | 0.4% |
| Welsh | 58 | 1.5% | View All 34 Rows |
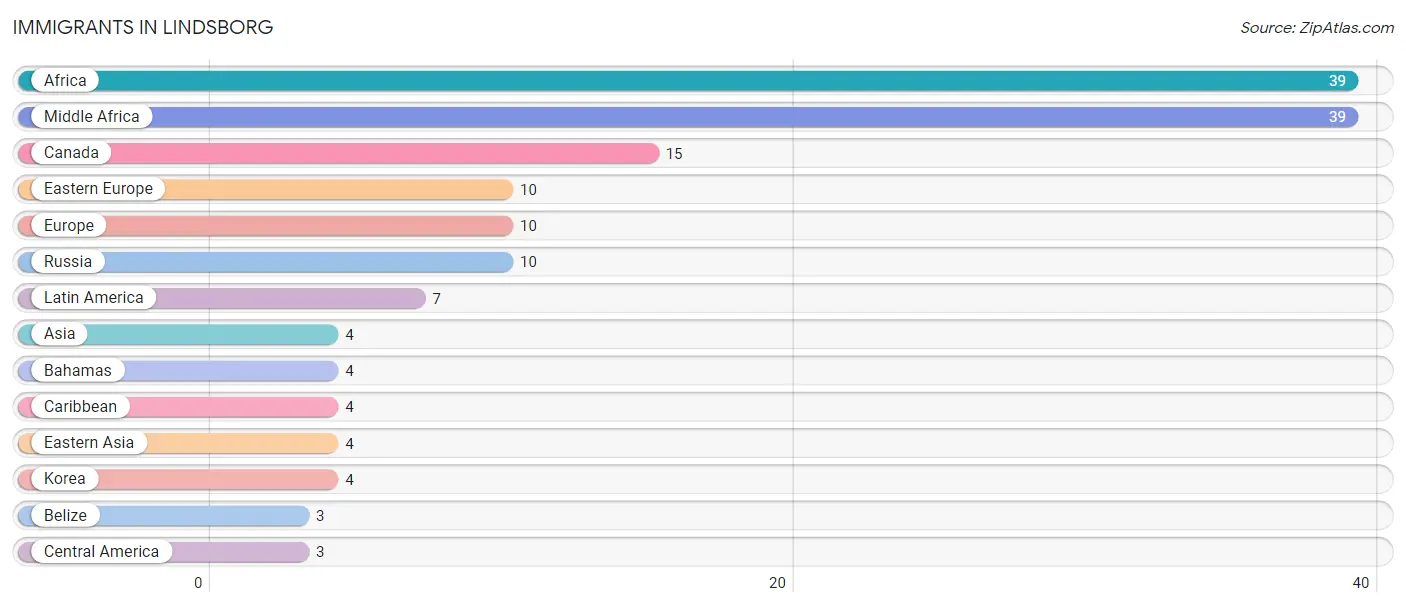
Immigrants in Lindsborg
The most numerous immigrant groups reported in Lindsborg came from Africa (39 | 1.0%), Middle Africa (39 | 1.0%), Canada (15 | 0.4%), Eastern Europe (10 | 0.3%), and Europe (10 | 0.3%), together accounting for 3.0% of all Lindsborg residents.
| Immigration Origin | # Population | % Population |
| Africa | 39 | 1.0% |
| Asia | 4 | 0.1% |
| Bahamas | 4 | 0.1% |
| Belize | 3 | 0.1% |
| Canada | 15 | 0.4% |
| Caribbean | 4 | 0.1% |
| Central America | 3 | 0.1% |
| Eastern Asia | 4 | 0.1% |
| Eastern Europe | 10 | 0.3% |
| Europe | 10 | 0.3% |
| Korea | 4 | 0.1% |
| Latin America | 7 | 0.2% |
| Middle Africa | 39 | 1.0% |
| Russia | 10 | 0.3% | View All 14 Rows |
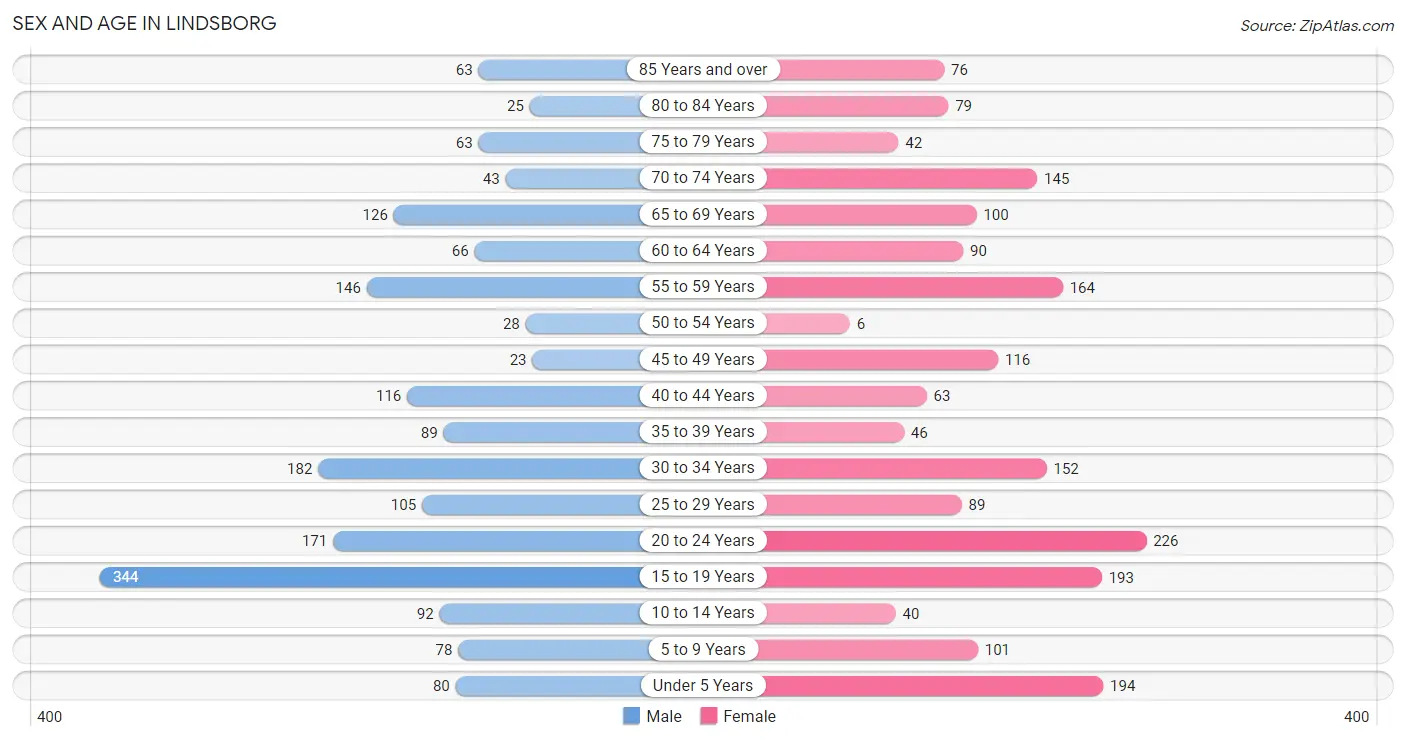
Sex and Age in Lindsborg
Sex and Age in Lindsborg
The most populous age groups in Lindsborg are 15 to 19 Years (344 | 18.7%) for men and 20 to 24 Years (226 | 11.8%) for women.
| Age Bracket | Male | Female |
| Under 5 Years | 80 (4.3%) | 194 (10.1%) |
| 5 to 9 Years | 78 (4.2%) | 101 (5.2%) |
| 10 to 14 Years | 92 (5.0%) | 40 (2.1%) |
| 15 to 19 Years | 344 (18.7%) | 193 (10.0%) |
| 20 to 24 Years | 171 (9.3%) | 226 (11.8%) |
| 25 to 29 Years | 105 (5.7%) | 89 (4.6%) |
| 30 to 34 Years | 182 (9.9%) | 152 (7.9%) |
| 35 to 39 Years | 89 (4.8%) | 46 (2.4%) |
| 40 to 44 Years | 116 (6.3%) | 63 (3.3%) |
| 45 to 49 Years | 23 (1.3%) | 116 (6.0%) |
| 50 to 54 Years | 28 (1.5%) | 6 (0.3%) |
| 55 to 59 Years | 146 (7.9%) | 164 (8.5%) |
| 60 to 64 Years | 66 (3.6%) | 90 (4.7%) |
| 65 to 69 Years | 126 (6.9%) | 100 (5.2%) |
| 70 to 74 Years | 43 (2.3%) | 145 (7.5%) |
| 75 to 79 Years | 63 (3.4%) | 42 (2.2%) |
| 80 to 84 Years | 25 (1.4%) | 79 (4.1%) |
| 85 Years and over | 63 (3.4%) | 76 (4.0%) |
| Total | 1,840 (100.0%) | 1,922 (100.0%) |
Families and Households in Lindsborg
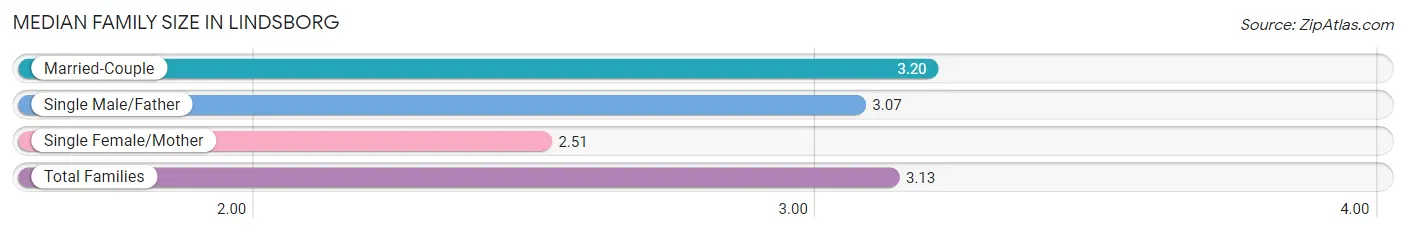
Median Family Size in Lindsborg
The median family size in Lindsborg is 3.13 persons per family, with married-couple families (709 | 85.0%) accounting for the largest median family size of 3.2 persons per family. On the other hand, single female/mother families (81 | 9.7%) represent the smallest median family size with 2.51 persons per family.
| Family Type | # Families | Family Size |
| Married-Couple | 709 (85.0%) | 3.20 |
| Single Male/Father | 44 (5.3%) | 3.07 |
| Single Female/Mother | 81 (9.7%) | 2.51 |
| Total Families | 834 (100.0%) | 3.13 |
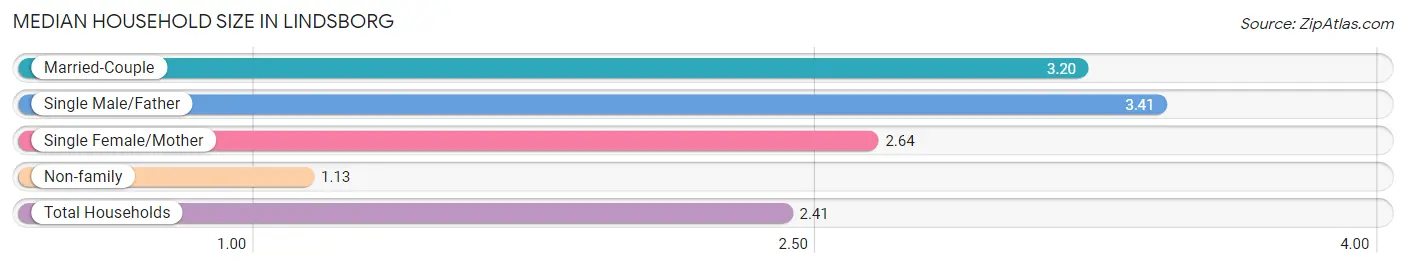
Median Household Size in Lindsborg
The median household size in Lindsborg is 2.41 persons per household, with single male/father households (44 | 3.3%) accounting for the largest median household size of 3.41 persons per household. non-family households (488 | 36.9%) represent the smallest median household size with 1.13 persons per household.
| Household Type | # Households | Household Size |
| Married-Couple | 709 (53.6%) | 3.20 |
| Single Male/Father | 44 (3.3%) | 3.41 |
| Single Female/Mother | 81 (6.1%) | 2.64 |
| Non-family | 488 (36.9%) | 1.13 |
| Total Households | 1,322 (100.0%) | 2.41 |
Household Size by Marriage Status in Lindsborg
Out of a total of 1,322 households in Lindsborg, 834 (63.1%) are family households, while 488 (36.9%) are nonfamily households. The most numerous type of family households are 2-person households, comprising 320, and the most common type of nonfamily households are 1-person households, comprising 412.
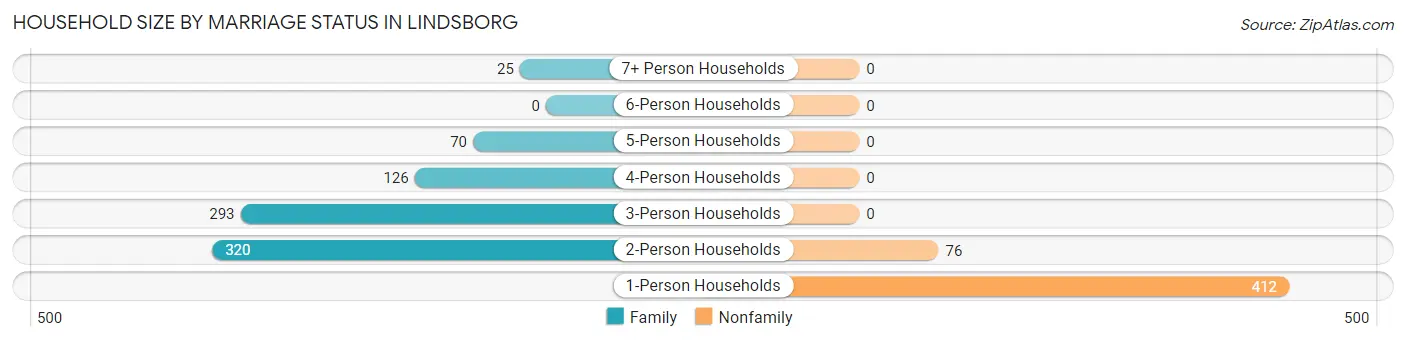
| Household Size | Family Households | Nonfamily Households |
| 1-Person Households | - | 412 (31.2%) |
| 2-Person Households | 320 (24.2%) | 76 (5.8%) |
| 3-Person Households | 293 (22.2%) | 0 (0.0%) |
| 4-Person Households | 126 (9.5%) | 0 (0.0%) |
| 5-Person Households | 70 (5.3%) | 0 (0.0%) |
| 6-Person Households | 0 (0.0%) | 0 (0.0%) |
| 7+ Person Households | 25 (1.9%) | 0 (0.0%) |
| Total | 834 (63.1%) | 488 (36.9%) |
Female Fertility in Lindsborg
Fertility by Age in Lindsborg
Average fertility rate in Lindsborg is 42.0 births per 1,000 women. Women in the age bracket of 20 to 34 years have the highest fertility rate with 60.0 births per 1,000 women. Women in the age bracket of 20 to 34 years acount for 75.7% of all women with births.
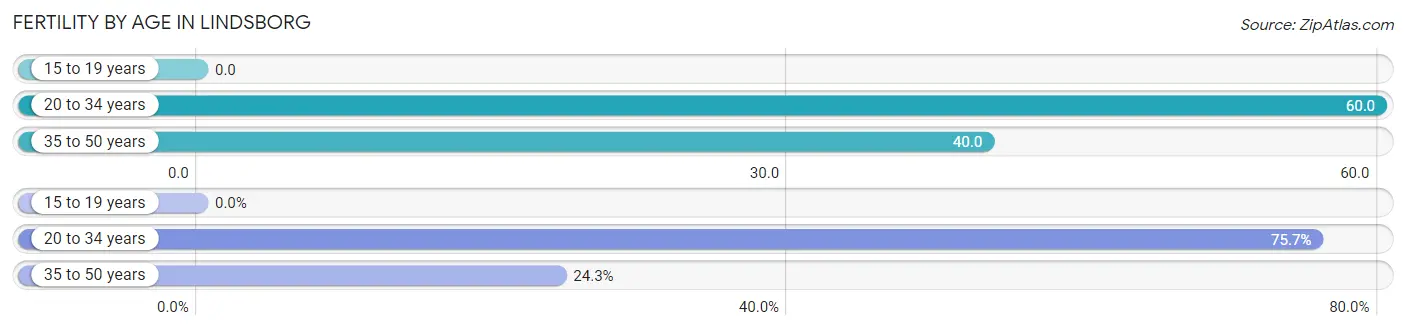
| Age Bracket | Women with Births | Births / 1,000 Women |
| 15 to 19 years | 0 (0.0%) | 0.0 |
| 20 to 34 years | 28 (75.7%) | 60.0 |
| 35 to 50 years | 9 (24.3%) | 40.0 |
| Total | 37 (100.0%) | 42.0 |
Fertility by Age by Marriage Status in Lindsborg
67.6% of women with births (37) in Lindsborg are married. The highest percentage of unmarried women with births falls into 20 to 34 years age bracket with 42.9% of them unmarried at the time of birth, while the lowest percentage of unmarried women with births belong to 35 to 50 years age bracket with 0.0% of them unmarried.
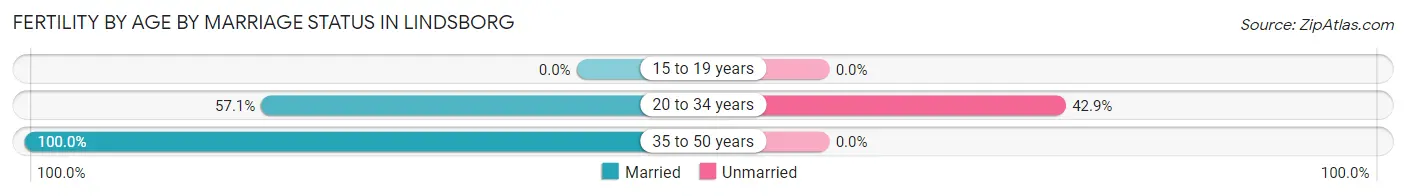
| Age Bracket | Married | Unmarried |
| 15 to 19 years | 0 (0.0%) | 0 (0.0%) |
| 20 to 34 years | 16 (57.1%) | 12 (42.9%) |
| 35 to 50 years | 9 (100.0%) | 0 (0.0%) |
| Total | 25 (67.6%) | 12 (32.4%) |
Fertility by Education in Lindsborg
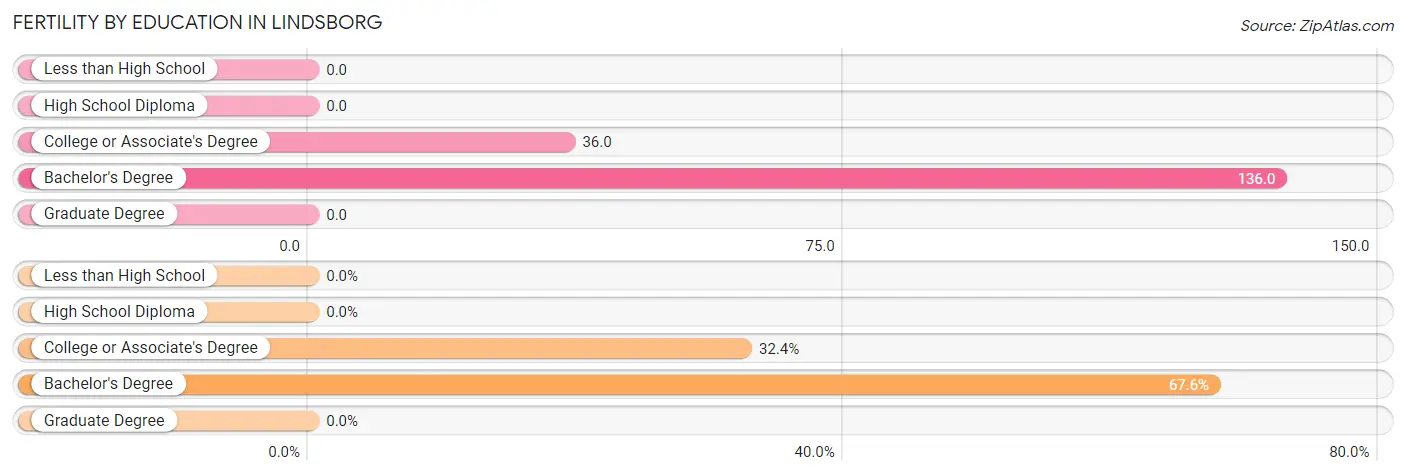
| Educational Attainment | Women with Births | Births / 1,000 Women |
| Less than High School | 0 (0.0%) | 0.0 |
| High School Diploma | 0 (0.0%) | 0.0 |
| College or Associate's Degree | 12 (32.4%) | 36.0 |
| Bachelor's Degree | 25 (67.6%) | 136.0 |
| Graduate Degree | 0 (0.0%) | 0.0 |
| Total | 37 (100.0%) | 42.0 |
Fertility by Education by Marriage Status in Lindsborg
32.4% of women with births in Lindsborg are unmarried. Women with the educational attainment of bachelor's degree are most likely to be married with 100.0% of them married at childbirth, while women with the educational attainment of college or associate's degree are least likely to be married with 100.0% of them unmarried at childbirth.
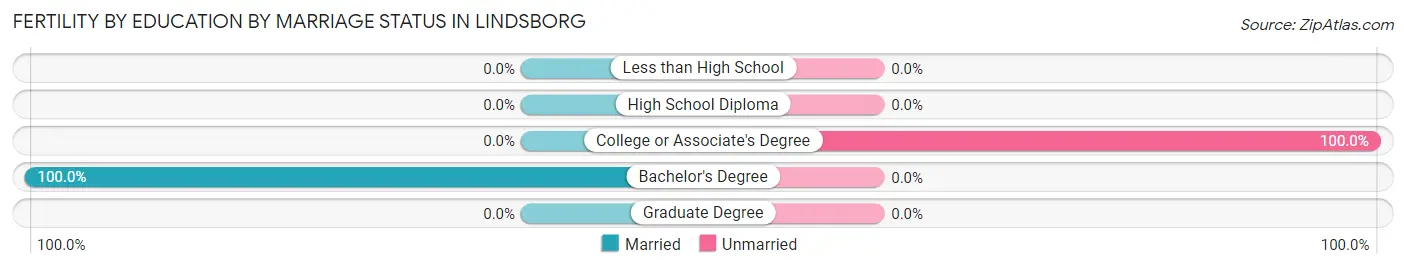
| Educational Attainment | Married | Unmarried |
| Less than High School | 0 (0.0%) | 0 (0.0%) |
| High School Diploma | 0 (0.0%) | 0 (0.0%) |
| College or Associate's Degree | 0 (0.0%) | 12 (100.0%) |
| Bachelor's Degree | 25 (100.0%) | 0 (0.0%) |
| Graduate Degree | 0 (0.0%) | 0 (0.0%) |
| Total | 25 (67.6%) | 12 (32.4%) |
Employment Characteristics in Lindsborg
Employment by Class of Employer in Lindsborg
Among the 1,785 employed individuals in Lindsborg, private company employees (945 | 52.9%), not-for-profit organizations (288 | 16.1%), and local government employees (285 | 16.0%) make up the most common classes of employment.
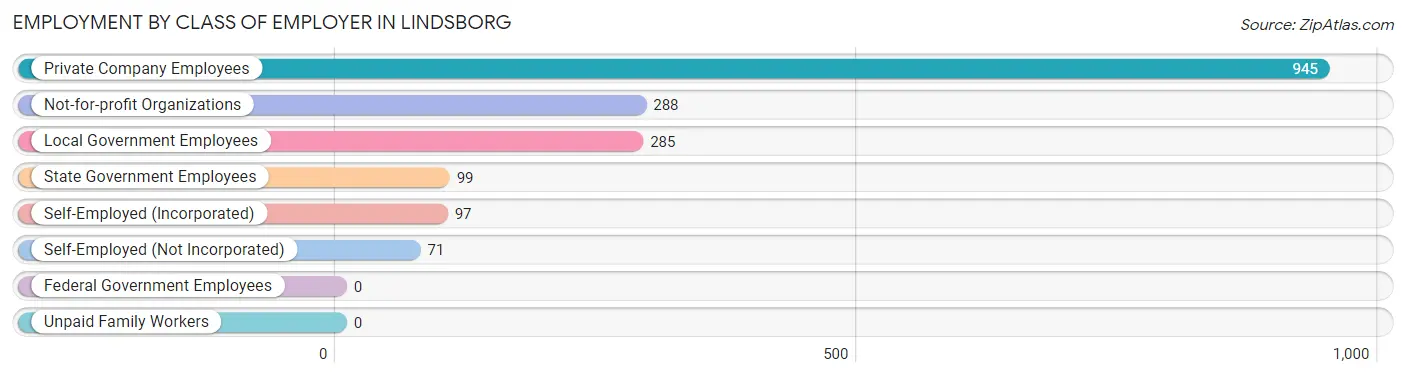
| Employer Class | # Employees | % Employees |
| Private Company Employees | 945 | 52.9% |
| Self-Employed (Incorporated) | 97 | 5.4% |
| Self-Employed (Not Incorporated) | 71 | 4.0% |
| Not-for-profit Organizations | 288 | 16.1% |
| Local Government Employees | 285 | 16.0% |
| State Government Employees | 99 | 5.6% |
| Federal Government Employees | 0 | 0.0% |
| Unpaid Family Workers | 0 | 0.0% |
| Total | 1,785 | 100.0% |
Employment Status by Age in Lindsborg
According to the labor force statistics for Lindsborg, out of the total population over 16 years of age (3,089), 62.4% or 1,928 individuals are in the labor force, with 2.0% or 39 of them unemployed. The age group with the highest labor force participation rate is 35 to 44 years, with 88.5% or 278 individuals in the labor force. Within the labor force, the 16 to 19 years age range has the highest percentage of unemployed individuals, with 8.5% or 21 of them being unemployed.
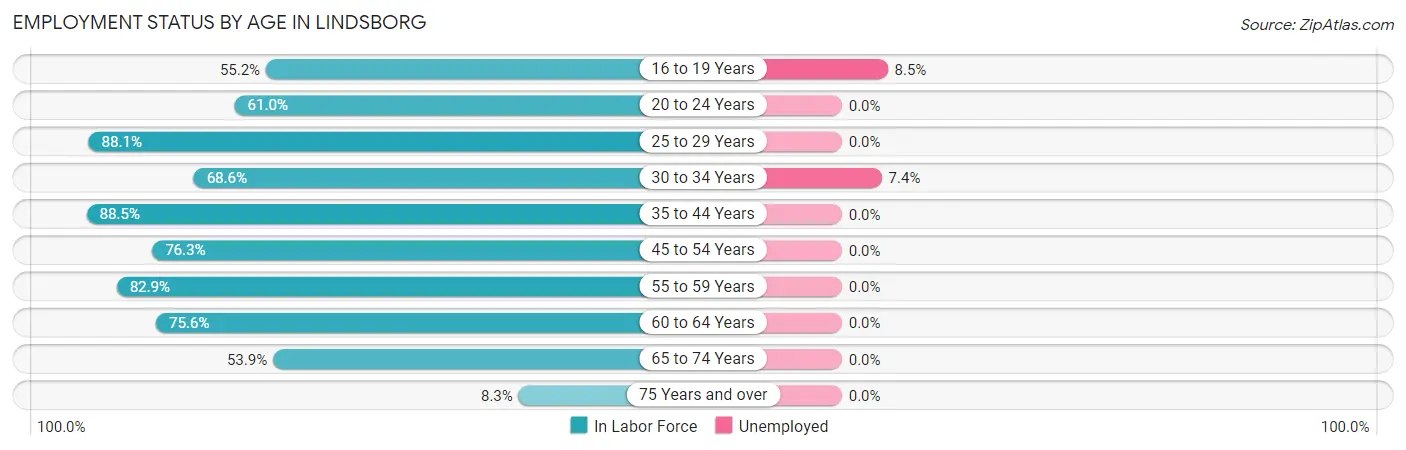
| Age Bracket | In Labor Force | Unemployed |
| 16 to 19 Years | 248 (55.2%) | 21 (8.5%) |
| 20 to 24 Years | 242 (61.0%) | 0 (0.0%) |
| 25 to 29 Years | 171 (88.1%) | 0 (0.0%) |
| 30 to 34 Years | 229 (68.6%) | 17 (7.4%) |
| 35 to 44 Years | 278 (88.5%) | 0 (0.0%) |
| 45 to 54 Years | 132 (76.3%) | 0 (0.0%) |
| 55 to 59 Years | 257 (82.9%) | 0 (0.0%) |
| 60 to 64 Years | 118 (75.6%) | 0 (0.0%) |
| 65 to 74 Years | 223 (53.9%) | 0 (0.0%) |
| 75 Years and over | 29 (8.3%) | 0 (0.0%) |
| Total | 1,928 (62.4%) | 39 (2.0%) |
Employment Status by Educational Attainment in Lindsborg
According to labor force statistics for Lindsborg, 80.0% of individuals (1,185) out of the total population between 25 and 64 years of age (1,481) are in the labor force, with 1.4% or 17 of them being unemployed. The group with the highest labor force participation rate are those with the educational attainment of bachelor's degree or higher, with 84.5% or 558 individuals in the labor force. Within the labor force, individuals with bachelor's degree or higher education have the highest percentage of unemployment, with 3.0% or 17 of them being unemployed.
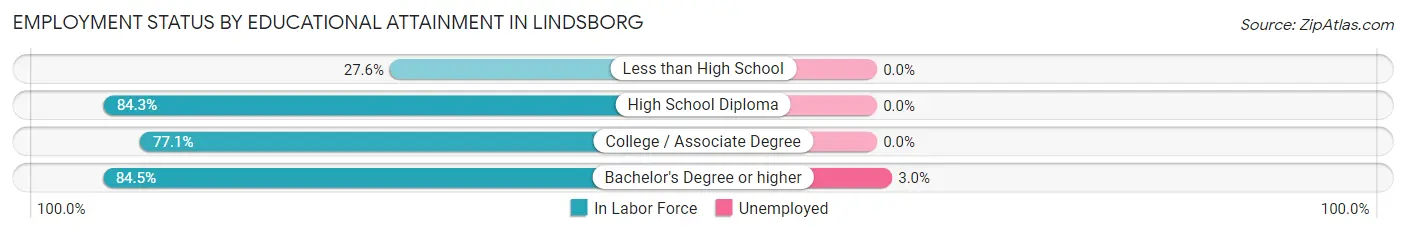
| Educational Attainment | In Labor Force | Unemployed |
| Less than High School | 16 (27.6%) | 0 (0.0%) |
| High School Diploma | 268 (84.3%) | 0 (0.0%) |
| College / Associate Degree | 343 (77.1%) | 0 (0.0%) |
| Bachelor's Degree or higher | 558 (84.5%) | 20 (3.0%) |
| Total | 1,185 (80.0%) | 21 (1.4%) |
Employment Occupations by Sex in Lindsborg
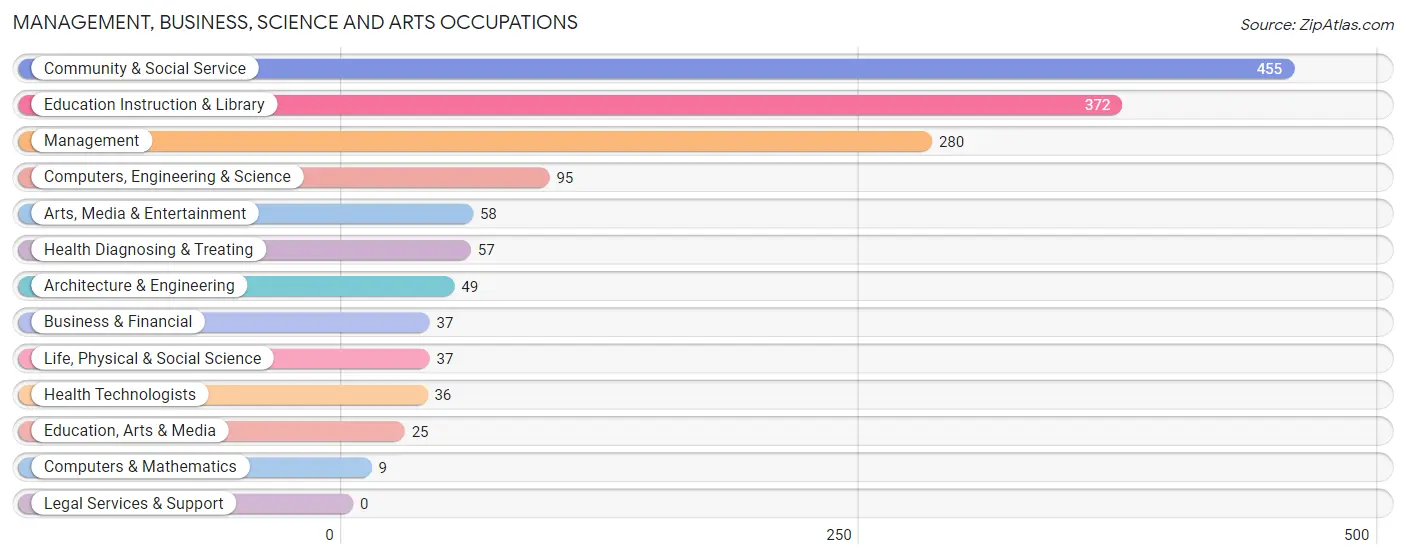
Management, Business, Science and Arts Occupations
The most common Management, Business, Science and Arts occupations in Lindsborg are Community & Social Service (455 | 24.1%), Education Instruction & Library (372 | 19.7%), Management (280 | 14.8%), Computers, Engineering & Science (95 | 5.0%), and Arts, Media & Entertainment (58 | 3.1%).
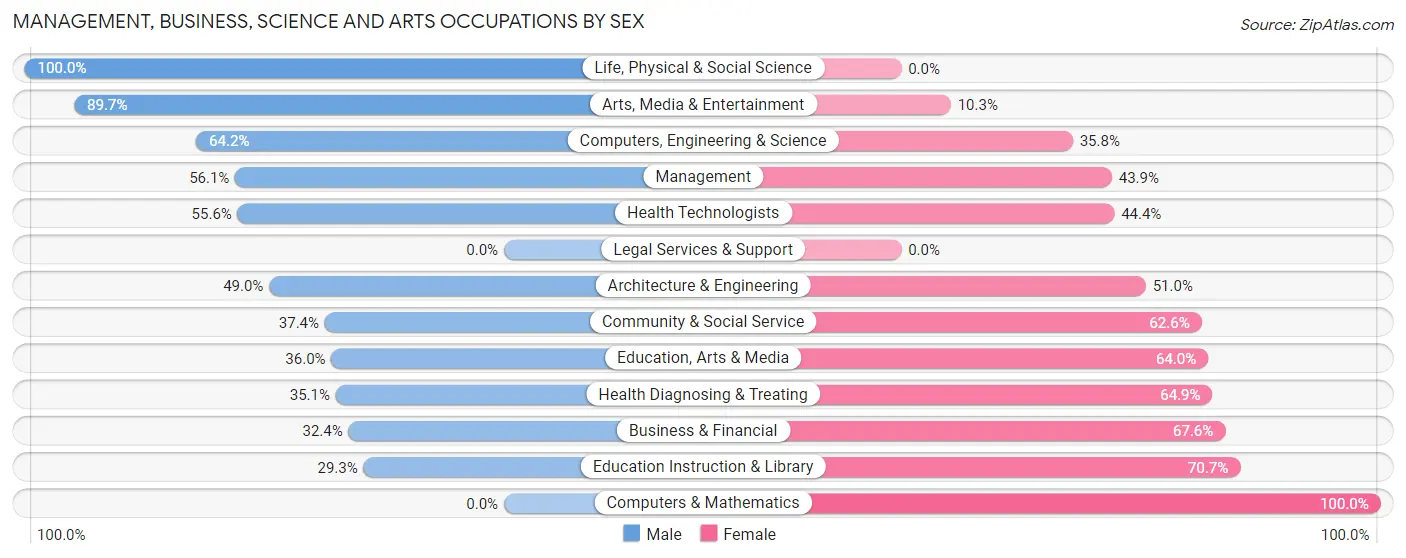
Management, Business, Science and Arts Occupations by Sex
Within the Management, Business, Science and Arts occupations in Lindsborg, the most male-oriented occupations are Life, Physical & Social Science (100.0%), Arts, Media & Entertainment (89.7%), and Computers, Engineering & Science (64.2%), while the most female-oriented occupations are Computers & Mathematics (100.0%), Education Instruction & Library (70.7%), and Business & Financial (67.6%).
| Occupation | Male | Female |
| Management | 157 (56.1%) | 123 (43.9%) |
| Business & Financial | 12 (32.4%) | 25 (67.6%) |
| Computers, Engineering & Science | 61 (64.2%) | 34 (35.8%) |
| Computers & Mathematics | 0 (0.0%) | 9 (100.0%) |
| Architecture & Engineering | 24 (49.0%) | 25 (51.0%) |
| Life, Physical & Social Science | 37 (100.0%) | 0 (0.0%) |
| Community & Social Service | 170 (37.4%) | 285 (62.6%) |
| Education, Arts & Media | 9 (36.0%) | 16 (64.0%) |
| Legal Services & Support | 0 (0.0%) | 0 (0.0%) |
| Education Instruction & Library | 109 (29.3%) | 263 (70.7%) |
| Arts, Media & Entertainment | 52 (89.7%) | 6 (10.3%) |
| Health Diagnosing & Treating | 20 (35.1%) | 37 (64.9%) |
| Health Technologists | 20 (55.6%) | 16 (44.4%) |
| Total (Category) | 420 (45.5%) | 504 (54.5%) |
| Total (Overall) | 1,072 (56.8%) | 817 (43.2%) |
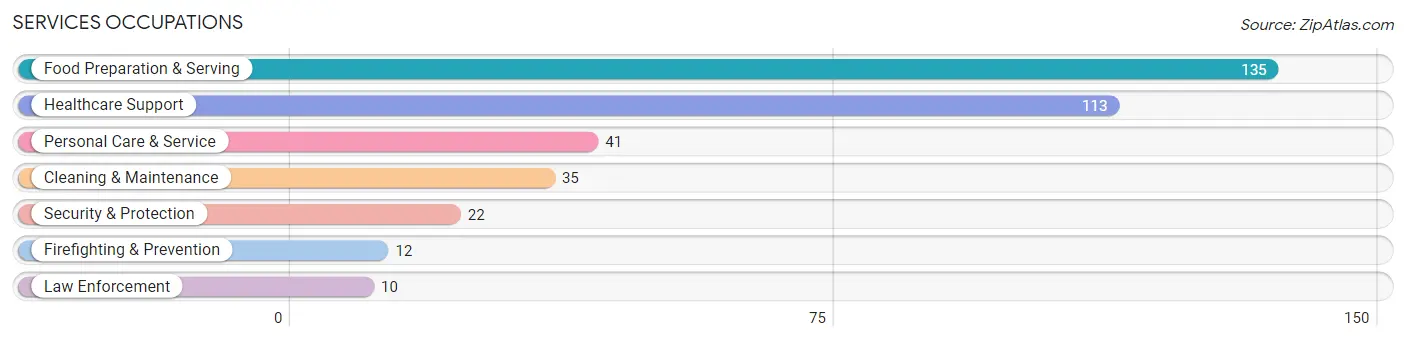
Services Occupations
The most common Services occupations in Lindsborg are Food Preparation & Serving (135 | 7.1%), Healthcare Support (113 | 6.0%), Personal Care & Service (41 | 2.2%), Cleaning & Maintenance (35 | 1.8%), and Security & Protection (22 | 1.2%).
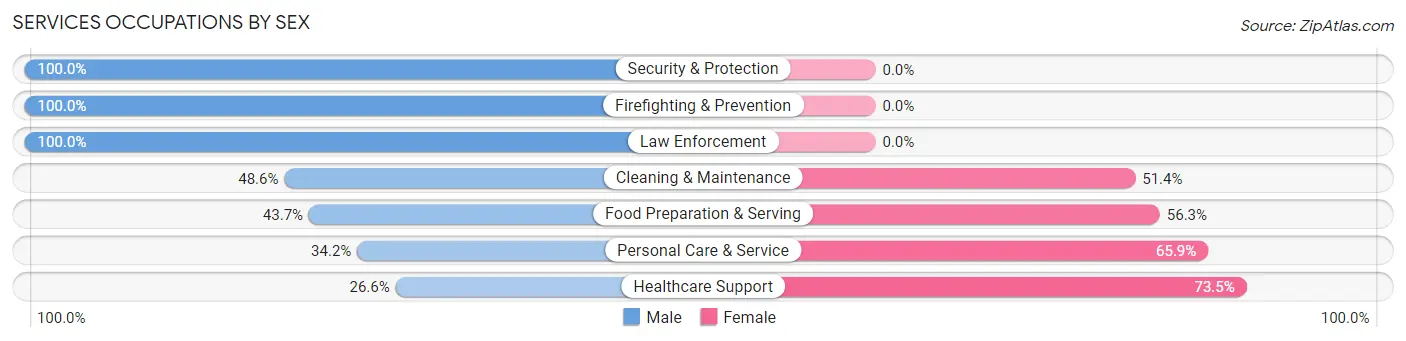
Services Occupations by Sex
Within the Services occupations in Lindsborg, the most male-oriented occupations are Security & Protection (100.0%), Firefighting & Prevention (100.0%), and Law Enforcement (100.0%), while the most female-oriented occupations are Healthcare Support (73.5%), Personal Care & Service (65.8%), and Food Preparation & Serving (56.3%).
| Occupation | Male | Female |
| Healthcare Support | 30 (26.6%) | 83 (73.5%) |
| Security & Protection | 22 (100.0%) | 0 (0.0%) |
| Firefighting & Prevention | 12 (100.0%) | 0 (0.0%) |
| Law Enforcement | 10 (100.0%) | 0 (0.0%) |
| Food Preparation & Serving | 59 (43.7%) | 76 (56.3%) |
| Cleaning & Maintenance | 17 (48.6%) | 18 (51.4%) |
| Personal Care & Service | 14 (34.2%) | 27 (65.8%) |
| Total (Category) | 142 (41.0%) | 204 (59.0%) |
| Total (Overall) | 1,072 (56.8%) | 817 (43.2%) |
Sales and Office Occupations
The most common Sales and Office occupations in Lindsborg are Office & Administration (119 | 6.3%), and Sales & Related (60 | 3.2%).
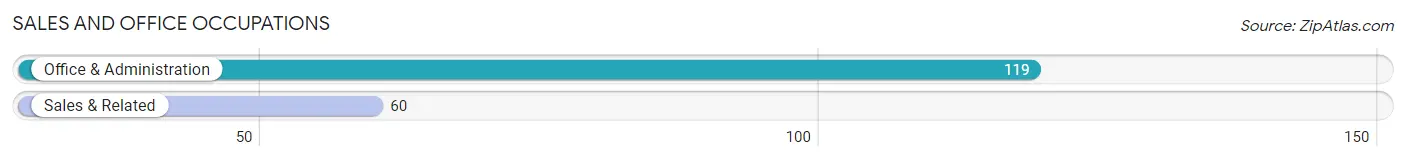
Sales and Office Occupations by Sex
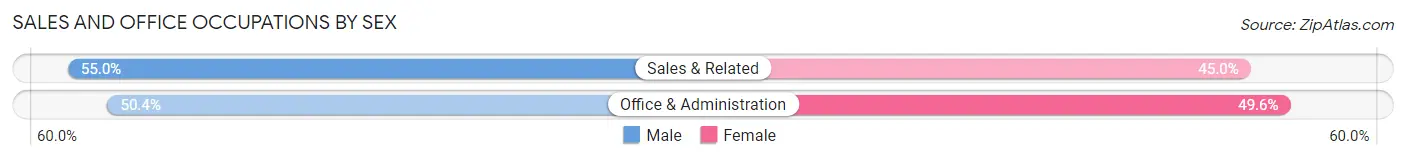
| Occupation | Male | Female |
| Sales & Related | 33 (55.0%) | 27 (45.0%) |
| Office & Administration | 60 (50.4%) | 59 (49.6%) |
| Total (Category) | 93 (52.0%) | 86 (48.0%) |
| Total (Overall) | 1,072 (56.8%) | 817 (43.2%) |
Natural Resources, Construction and Maintenance Occupations
The most common Natural Resources, Construction and Maintenance occupations in Lindsborg are Installation, Maintenance & Repair (132 | 7.0%), Construction & Extraction (59 | 3.1%), and Farming, Fishing & Forestry (5 | 0.3%).
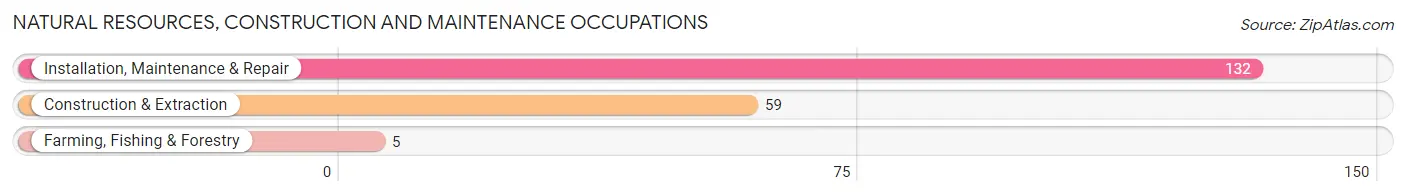
Natural Resources, Construction and Maintenance Occupations by Sex
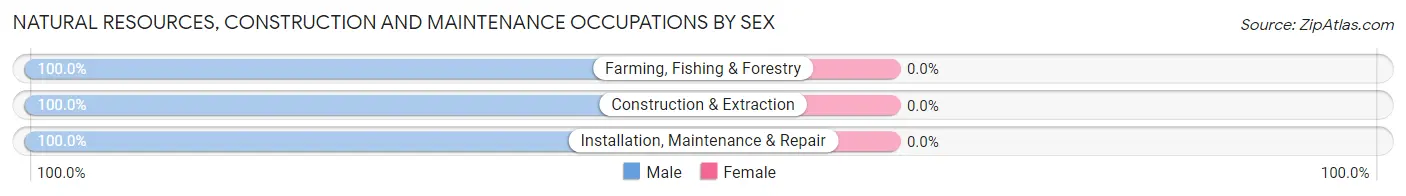
| Occupation | Male | Female |
| Farming, Fishing & Forestry | 5 (100.0%) | 0 (0.0%) |
| Construction & Extraction | 59 (100.0%) | 0 (0.0%) |
| Installation, Maintenance & Repair | 132 (100.0%) | 0 (0.0%) |
| Total (Category) | 196 (100.0%) | 0 (0.0%) |
| Total (Overall) | 1,072 (56.8%) | 817 (43.2%) |
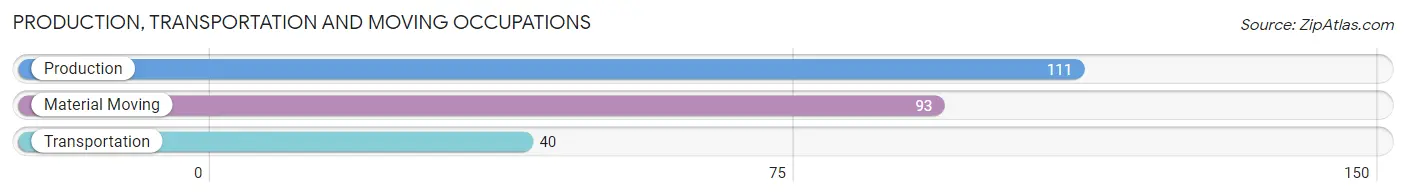
Production, Transportation and Moving Occupations
The most common Production, Transportation and Moving occupations in Lindsborg are Production (111 | 5.9%), Material Moving (93 | 4.9%), and Transportation (40 | 2.1%).
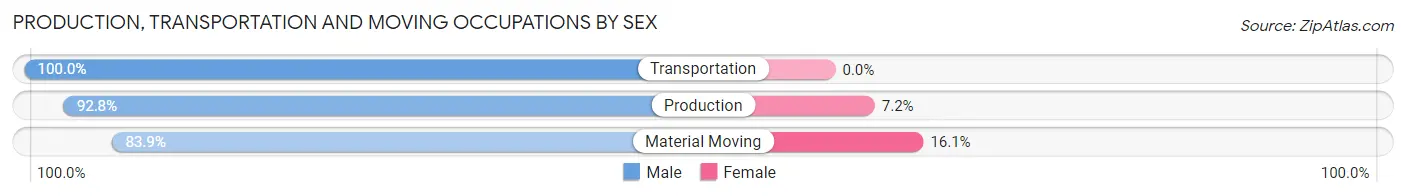
Production, Transportation and Moving Occupations by Sex
| Occupation | Male | Female |
| Production | 103 (92.8%) | 8 (7.2%) |
| Transportation | 40 (100.0%) | 0 (0.0%) |
| Material Moving | 78 (83.9%) | 15 (16.1%) |
| Total (Category) | 221 (90.6%) | 23 (9.4%) |
| Total (Overall) | 1,072 (56.8%) | 817 (43.2%) |
Employment Industries by Sex in Lindsborg
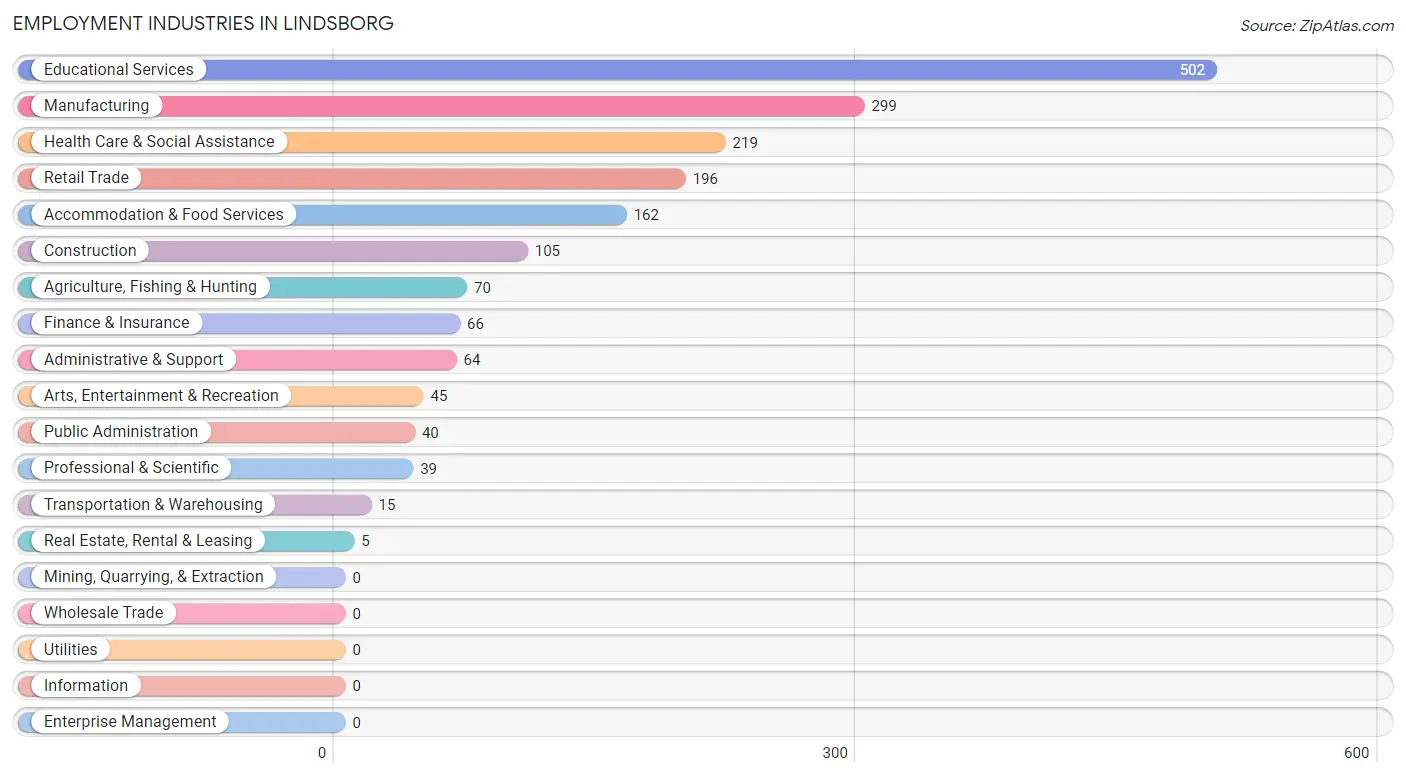
Employment Industries in Lindsborg
The major employment industries in Lindsborg include Educational Services (502 | 26.6%), Manufacturing (299 | 15.8%), Health Care & Social Assistance (219 | 11.6%), Retail Trade (196 | 10.4%), and Accommodation & Food Services (162 | 8.6%).
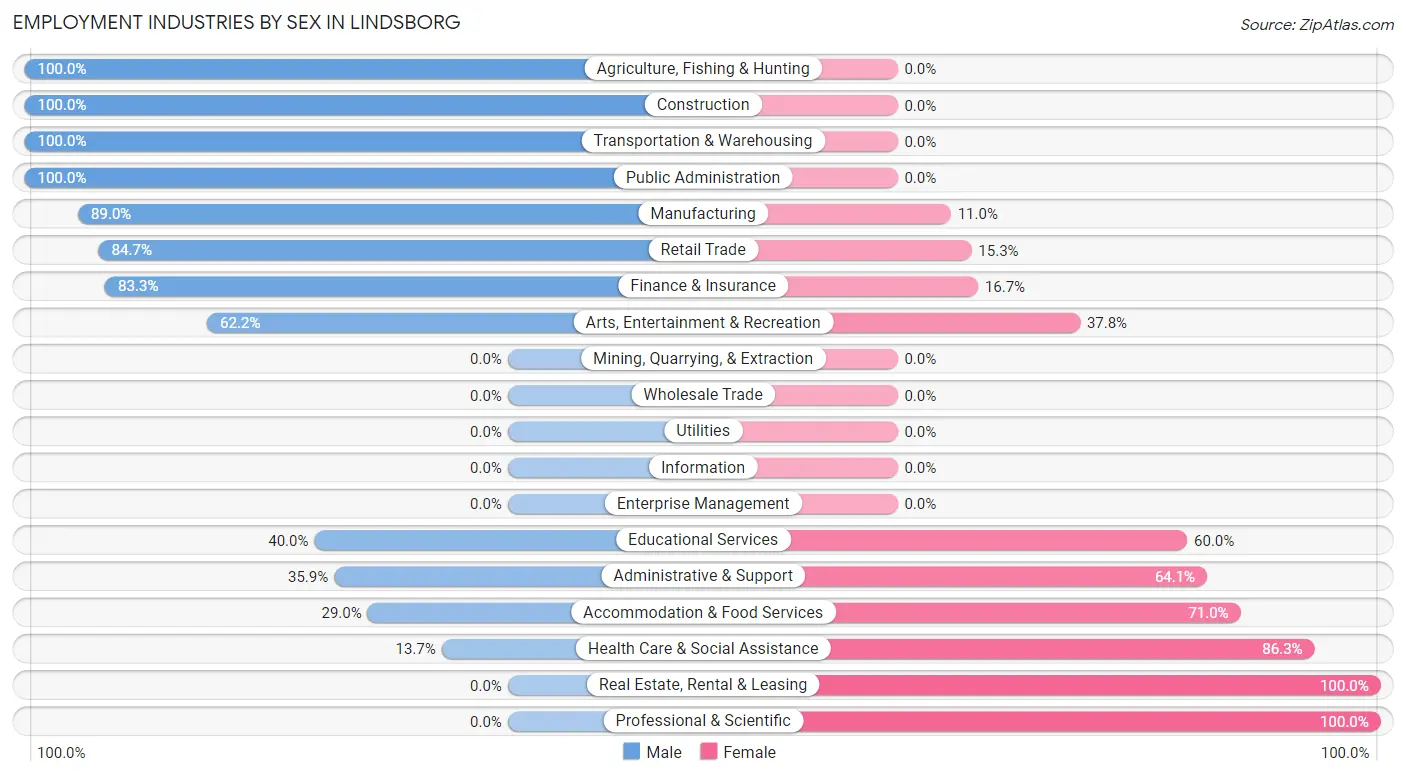
Employment Industries by Sex in Lindsborg
The Lindsborg industries that see more men than women are Agriculture, Fishing & Hunting (100.0%), Construction (100.0%), and Transportation & Warehousing (100.0%), whereas the industries that tend to have a higher number of women are Real Estate, Rental & Leasing (100.0%), Professional & Scientific (100.0%), and Health Care & Social Assistance (86.3%).
| Industry | Male | Female |
| Agriculture, Fishing & Hunting | 70 (100.0%) | 0 (0.0%) |
| Mining, Quarrying, & Extraction | 0 (0.0%) | 0 (0.0%) |
| Construction | 105 (100.0%) | 0 (0.0%) |
| Manufacturing | 266 (89.0%) | 33 (11.0%) |
| Wholesale Trade | 0 (0.0%) | 0 (0.0%) |
| Retail Trade | 166 (84.7%) | 30 (15.3%) |
| Transportation & Warehousing | 15 (100.0%) | 0 (0.0%) |
| Utilities | 0 (0.0%) | 0 (0.0%) |
| Information | 0 (0.0%) | 0 (0.0%) |
| Finance & Insurance | 55 (83.3%) | 11 (16.7%) |
| Real Estate, Rental & Leasing | 0 (0.0%) | 5 (100.0%) |
| Professional & Scientific | 0 (0.0%) | 39 (100.0%) |
| Enterprise Management | 0 (0.0%) | 0 (0.0%) |
| Administrative & Support | 23 (35.9%) | 41 (64.1%) |
| Educational Services | 201 (40.0%) | 301 (60.0%) |
| Health Care & Social Assistance | 30 (13.7%) | 189 (86.3%) |
| Arts, Entertainment & Recreation | 28 (62.2%) | 17 (37.8%) |
| Accommodation & Food Services | 47 (29.0%) | 115 (71.0%) |
| Public Administration | 40 (100.0%) | 0 (0.0%) |
| Total | 1,072 (56.8%) | 817 (43.2%) |
Education in Lindsborg
School Enrollment in Lindsborg
The most common levels of schooling among the 1,052 students in Lindsborg are college / undergraduate (526 | 50.0%), high school (207 | 19.7%), and elementary school (110 | 10.5%).
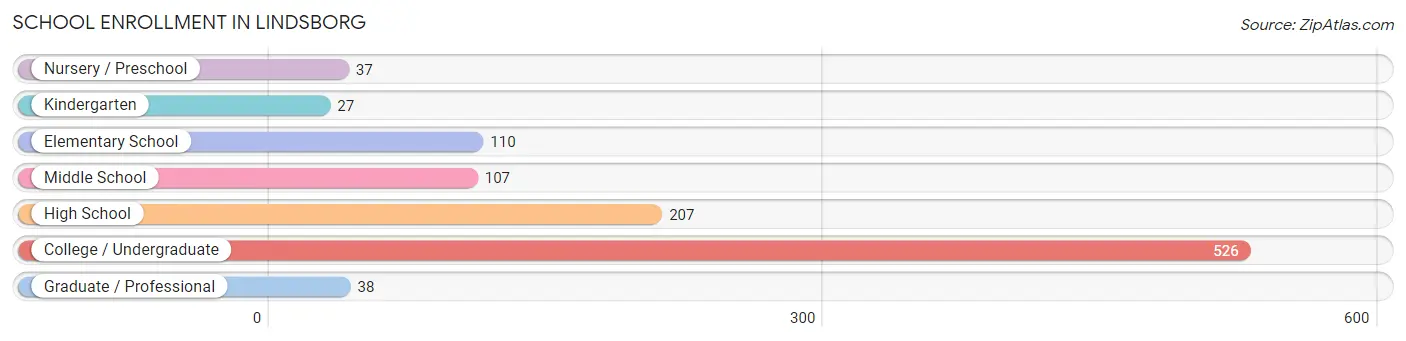
| School Level | # Students | % Students |
| Nursery / Preschool | 37 | 3.5% |
| Kindergarten | 27 | 2.6% |
| Elementary School | 110 | 10.5% |
| Middle School | 107 | 10.2% |
| High School | 207 | 19.7% |
| College / Undergraduate | 526 | 50.0% |
| Graduate / Professional | 38 | 3.6% |
| Total | 1,052 | 100.0% |
School Enrollment by Age by Funding Source in Lindsborg
Out of a total of 1,052 students who are enrolled in schools in Lindsborg, 476 (45.2%) attend a private institution, while the remaining 576 (54.8%) are enrolled in public schools. The age group of 25 to 34 year olds has the highest likelihood of being enrolled in private schools, with 41 (87.2% in the age bracket) enrolled. Conversely, the age group of 3 to 4 year olds has the lowest likelihood of being enrolled in a private school, with 18 (100.0% in the age bracket) attending a public institution.
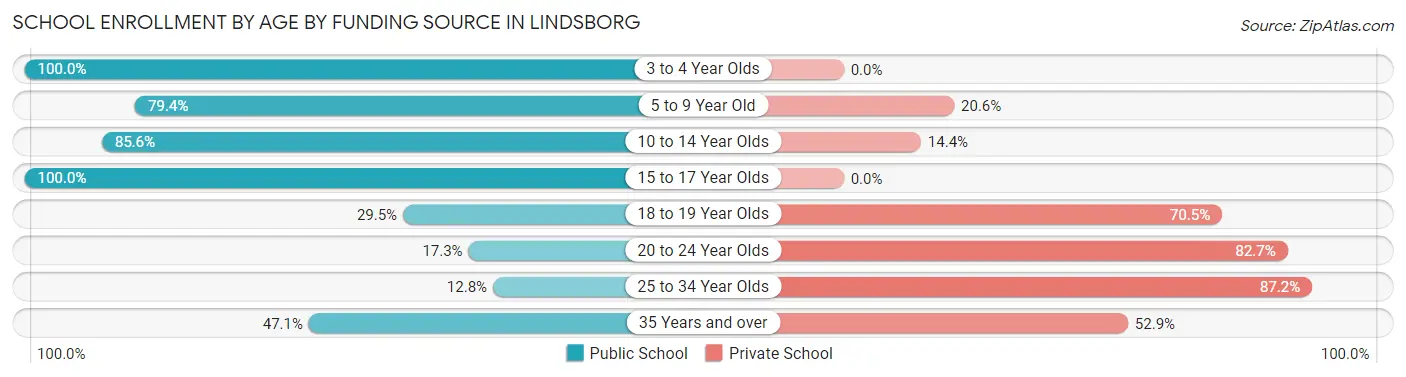
| Age Bracket | Public School | Private School |
| 3 to 4 Year Olds | 18 (100.0%) | 0 (0.0%) |
| 5 to 9 Year Old | 112 (79.4%) | 29 (20.6%) |
| 10 to 14 Year Olds | 113 (85.6%) | 19 (14.4%) |
| 15 to 17 Year Olds | 197 (100.0%) | 0 (0.0%) |
| 18 to 19 Year Olds | 88 (29.5%) | 210 (70.5%) |
| 20 to 24 Year Olds | 35 (17.3%) | 167 (82.7%) |
| 25 to 34 Year Olds | 6 (12.8%) | 41 (87.2%) |
| 35 Years and over | 8 (47.1%) | 9 (52.9%) |
| Total | 576 (54.8%) | 476 (45.2%) |
Educational Attainment by Field of Study in Lindsborg
Education (244 | 21.6%), business (187 | 16.6%), science & technology (120 | 10.6%), arts & humanities (98 | 8.7%), and bio, nature & agricultural (94 | 8.3%) are the most common fields of study among 1,127 individuals in Lindsborg who have obtained a bachelor's degree or higher.
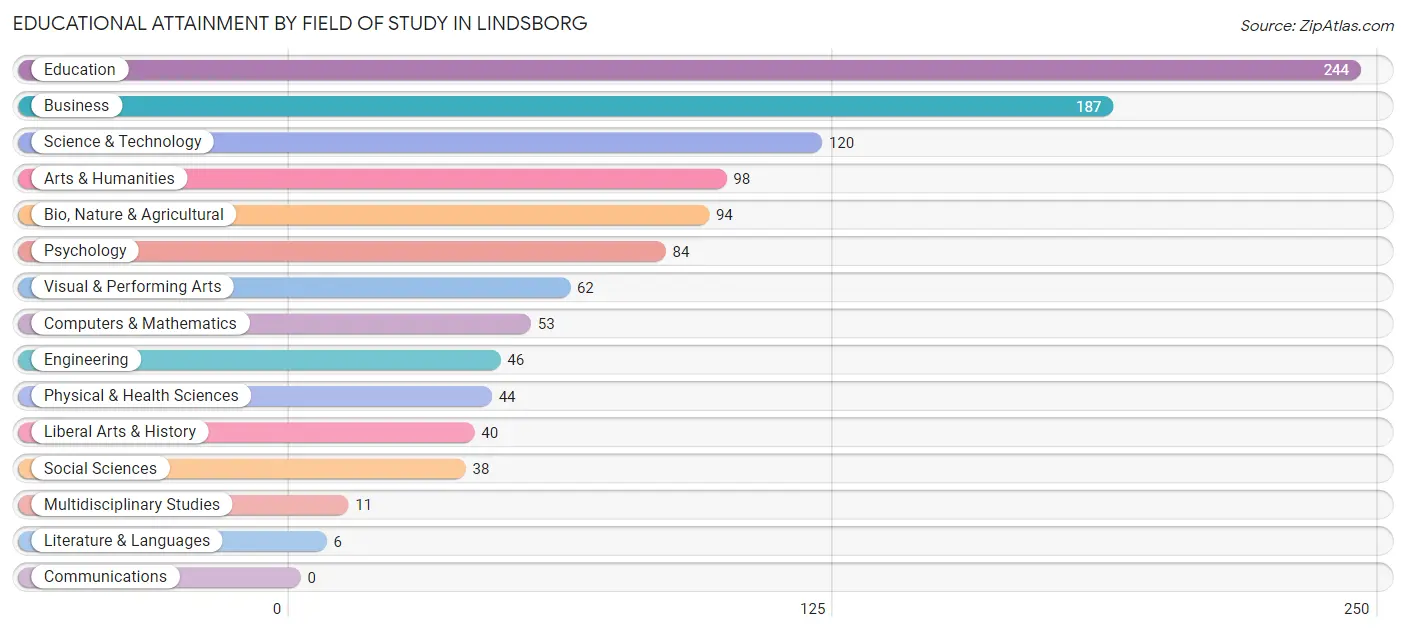
| Field of Study | # Graduates | % Graduates |
| Computers & Mathematics | 53 | 4.7% |
| Bio, Nature & Agricultural | 94 | 8.3% |
| Physical & Health Sciences | 44 | 3.9% |
| Psychology | 84 | 7.4% |
| Social Sciences | 38 | 3.4% |
| Engineering | 46 | 4.1% |
| Multidisciplinary Studies | 11 | 1.0% |
| Science & Technology | 120 | 10.6% |
| Business | 187 | 16.6% |
| Education | 244 | 21.6% |
| Literature & Languages | 6 | 0.5% |
| Liberal Arts & History | 40 | 3.5% |
| Visual & Performing Arts | 62 | 5.5% |
| Communications | 0 | 0.0% |
| Arts & Humanities | 98 | 8.7% |
| Total | 1,127 | 100.0% |
Transportation & Commute in Lindsborg
Vehicle Availability by Sex in Lindsborg
The most prevalent vehicle ownership categories in Lindsborg are males with 2 vehicles (332, accounting for 36.7%) and females with 2 vehicles (209, making up 49.2%).
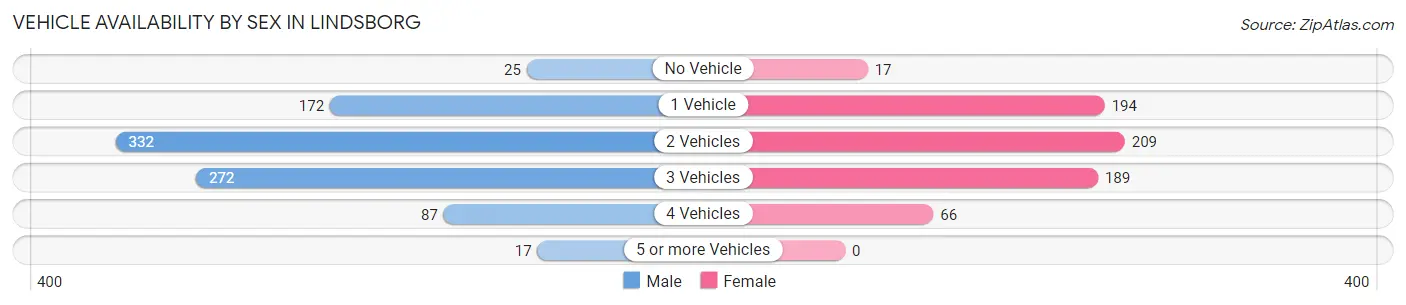
| Vehicles Available | Male | Female |
| No Vehicle | 25 (2.8%) | 17 (2.5%) |
| 1 Vehicle | 172 (19.0%) | 194 (28.7%) |
| 2 Vehicles | 332 (36.7%) | 209 (31.0%) |
| 3 Vehicles | 272 (30.1%) | 189 (28.0%) |
| 4 Vehicles | 87 (9.6%) | 66 (9.8%) |
| 5 or more Vehicles | 17 (1.9%) | 0 (0.0%) |
| Total | 905 (100.0%) | 675 (100.0%) |
Commute Time in Lindsborg
The most frequently occuring commute durations in Lindsborg are 20 to 24 minutes (332 commuters, 19.7%), less than 5 minutes (317 commuters, 18.8%), and 5 to 9 minutes (316 commuters, 18.7%).
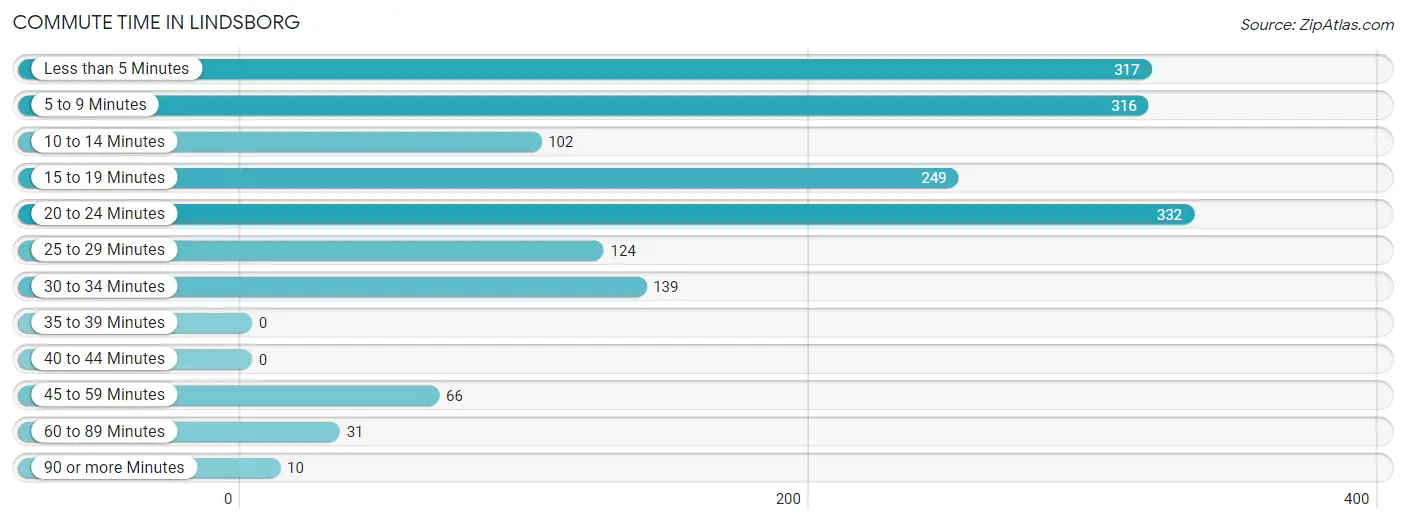
| Commute Time | # Commuters | % Commuters |
| Less than 5 Minutes | 317 | 18.8% |
| 5 to 9 Minutes | 316 | 18.7% |
| 10 to 14 Minutes | 102 | 6.0% |
| 15 to 19 Minutes | 249 | 14.8% |
| 20 to 24 Minutes | 332 | 19.7% |
| 25 to 29 Minutes | 124 | 7.3% |
| 30 to 34 Minutes | 139 | 8.2% |
| 35 to 39 Minutes | 0 | 0.0% |
| 40 to 44 Minutes | 0 | 0.0% |
| 45 to 59 Minutes | 66 | 3.9% |
| 60 to 89 Minutes | 31 | 1.8% |
| 90 or more Minutes | 10 | 0.6% |
Commute Time by Sex in Lindsborg
The most common commute times in Lindsborg are 15 to 19 minutes (218 commuters, 21.6%) for males and 5 to 9 minutes (207 commuters, 30.7%) for females.
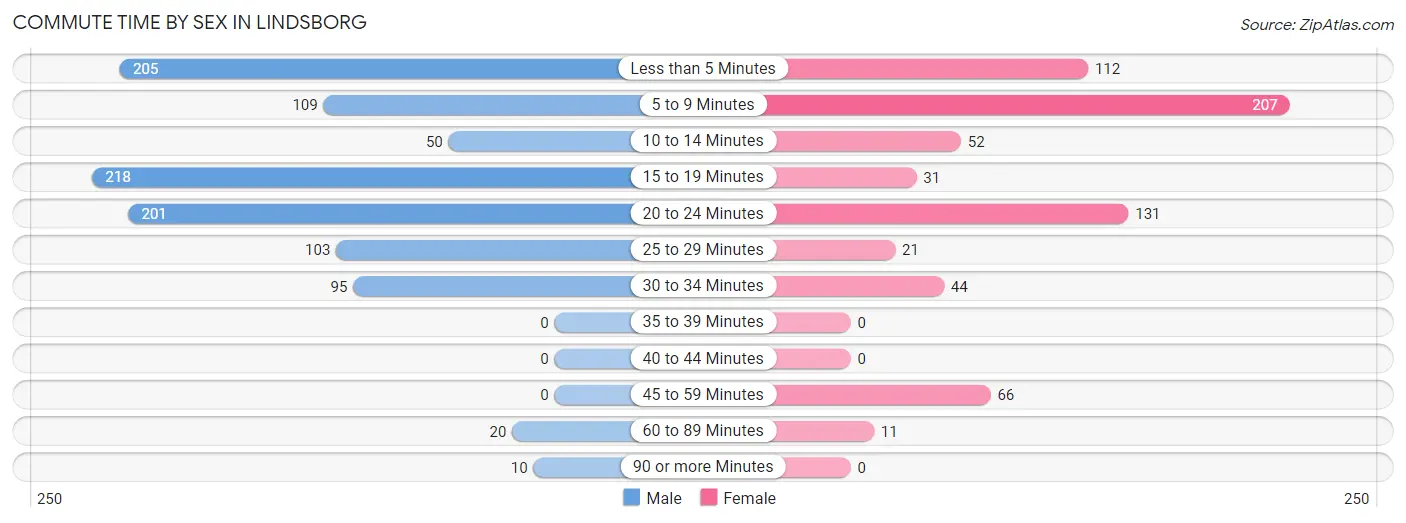
| Commute Time | Male | Female |
| Less than 5 Minutes | 205 (20.3%) | 112 (16.6%) |
| 5 to 9 Minutes | 109 (10.8%) | 207 (30.7%) |
| 10 to 14 Minutes | 50 (5.0%) | 52 (7.7%) |
| 15 to 19 Minutes | 218 (21.6%) | 31 (4.6%) |
| 20 to 24 Minutes | 201 (19.9%) | 131 (19.4%) |
| 25 to 29 Minutes | 103 (10.2%) | 21 (3.1%) |
| 30 to 34 Minutes | 95 (9.4%) | 44 (6.5%) |
| 35 to 39 Minutes | 0 (0.0%) | 0 (0.0%) |
| 40 to 44 Minutes | 0 (0.0%) | 0 (0.0%) |
| 45 to 59 Minutes | 0 (0.0%) | 66 (9.8%) |
| 60 to 89 Minutes | 20 (2.0%) | 11 (1.6%) |
| 90 or more Minutes | 10 (1.0%) | 0 (0.0%) |
Time of Departure to Work by Sex in Lindsborg
The most frequent times of departure to work in Lindsborg are 5:00 AM to 5:29 AM (175, 17.3%) for males and 6:30 AM to 6:59 AM (142, 21.0%) for females.
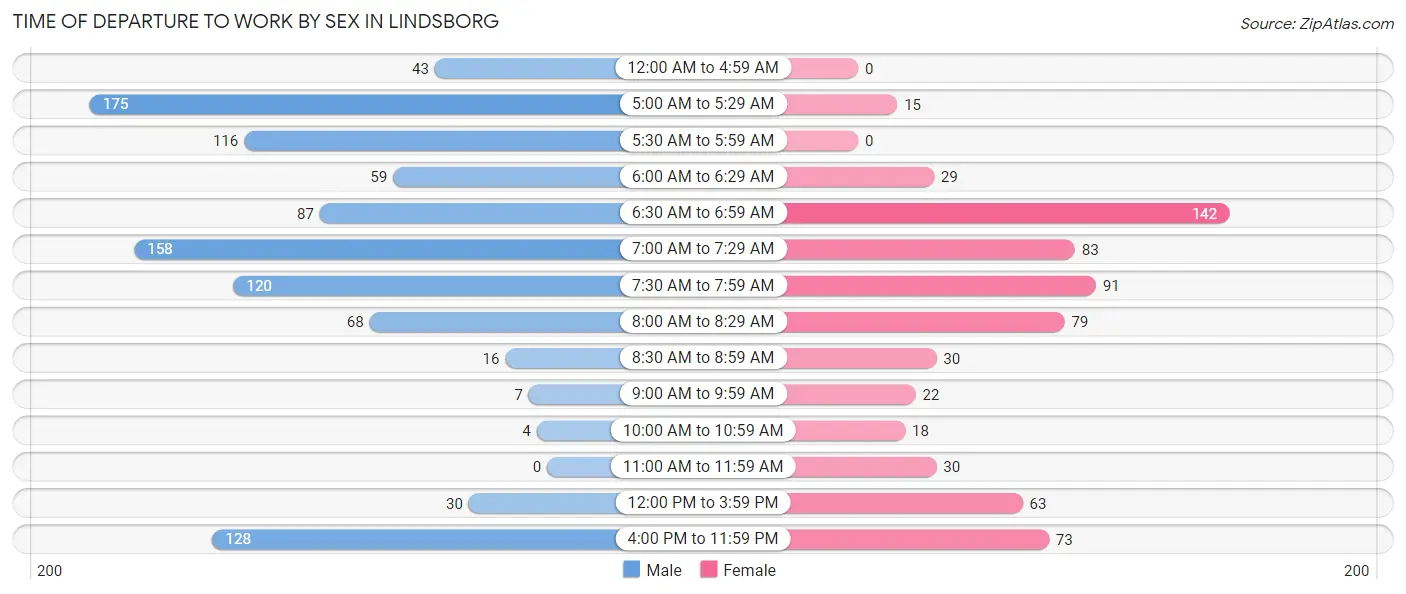
| Time of Departure | Male | Female |
| 12:00 AM to 4:59 AM | 43 (4.3%) | 0 (0.0%) |
| 5:00 AM to 5:29 AM | 175 (17.3%) | 15 (2.2%) |
| 5:30 AM to 5:59 AM | 116 (11.5%) | 0 (0.0%) |
| 6:00 AM to 6:29 AM | 59 (5.8%) | 29 (4.3%) |
| 6:30 AM to 6:59 AM | 87 (8.6%) | 142 (21.0%) |
| 7:00 AM to 7:29 AM | 158 (15.6%) | 83 (12.3%) |
| 7:30 AM to 7:59 AM | 120 (11.9%) | 91 (13.5%) |
| 8:00 AM to 8:29 AM | 68 (6.7%) | 79 (11.7%) |
| 8:30 AM to 8:59 AM | 16 (1.6%) | 30 (4.4%) |
| 9:00 AM to 9:59 AM | 7 (0.7%) | 22 (3.3%) |
| 10:00 AM to 10:59 AM | 4 (0.4%) | 18 (2.7%) |
| 11:00 AM to 11:59 AM | 0 (0.0%) | 30 (4.4%) |
| 12:00 PM to 3:59 PM | 30 (3.0%) | 63 (9.3%) |
| 4:00 PM to 11:59 PM | 128 (12.7%) | 73 (10.8%) |
| Total | 1,011 (100.0%) | 675 (100.0%) |
Housing Occupancy in Lindsborg
Occupancy by Ownership in Lindsborg
Of the total 1,322 dwellings in Lindsborg, owner-occupied units account for 927 (70.1%), while renter-occupied units make up 395 (29.9%).
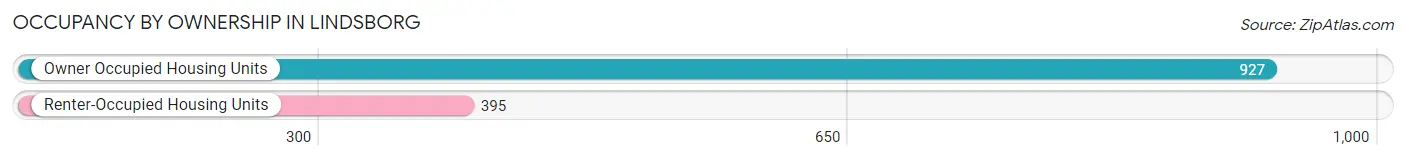
| Occupancy | # Housing Units | % Housing Units |
| Owner Occupied Housing Units | 927 | 70.1% |
| Renter-Occupied Housing Units | 395 | 29.9% |
| Total Occupied Housing Units | 1,322 | 100.0% |
Occupancy by Household Size in Lindsborg
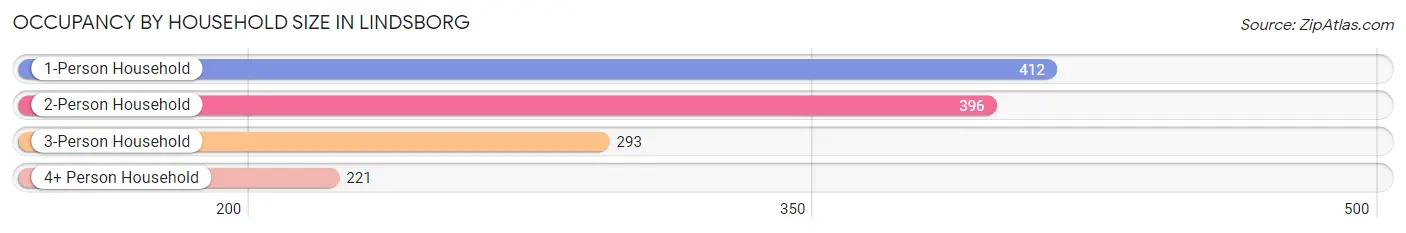
| Household Size | # Housing Units | % Housing Units |
| 1-Person Household | 412 | 31.2% |
| 2-Person Household | 396 | 29.9% |
| 3-Person Household | 293 | 22.2% |
| 4+ Person Household | 221 | 16.7% |
| Total Housing Units | 1,322 | 100.0% |
Occupancy by Ownership by Household Size in Lindsborg
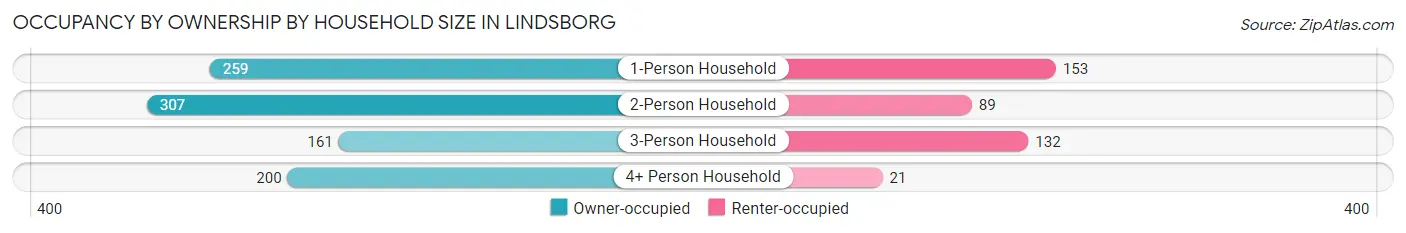
| Household Size | Owner-occupied | Renter-occupied |
| 1-Person Household | 259 (62.9%) | 153 (37.1%) |
| 2-Person Household | 307 (77.5%) | 89 (22.5%) |
| 3-Person Household | 161 (54.9%) | 132 (45.1%) |
| 4+ Person Household | 200 (90.5%) | 21 (9.5%) |
| Total Housing Units | 927 (70.1%) | 395 (29.9%) |
Occupancy by Educational Attainment in Lindsborg
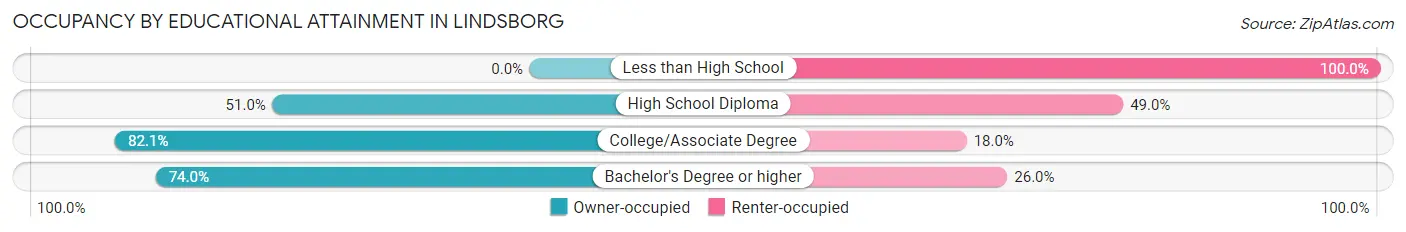
| Household Size | Owner-occupied | Renter-occupied |
| Less than High School | 0 (0.0%) | 55 (100.0%) |
| High School Diploma | 100 (51.0%) | 96 (49.0%) |
| College/Associate Degree | 352 (82.1%) | 77 (17.9%) |
| Bachelor's Degree or higher | 475 (74.0%) | 167 (26.0%) |
Occupancy by Age of Householder in Lindsborg
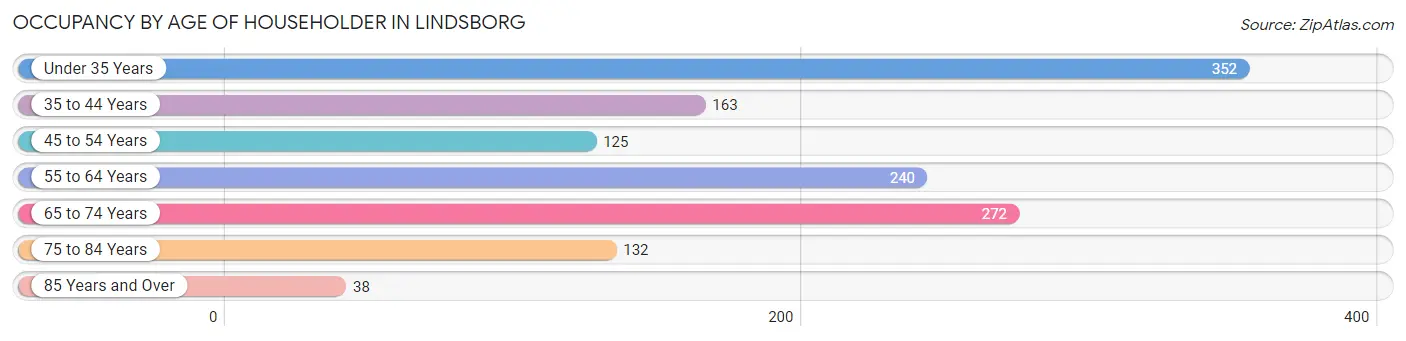
| Age Bracket | # Households | % Households |
| Under 35 Years | 352 | 26.6% |
| 35 to 44 Years | 163 | 12.3% |
| 45 to 54 Years | 125 | 9.5% |
| 55 to 64 Years | 240 | 18.1% |
| 65 to 74 Years | 272 | 20.6% |
| 75 to 84 Years | 132 | 10.0% |
| 85 Years and Over | 38 | 2.9% |
| Total | 1,322 | 100.0% |
Housing Finances in Lindsborg
Median Income by Occupancy in Lindsborg
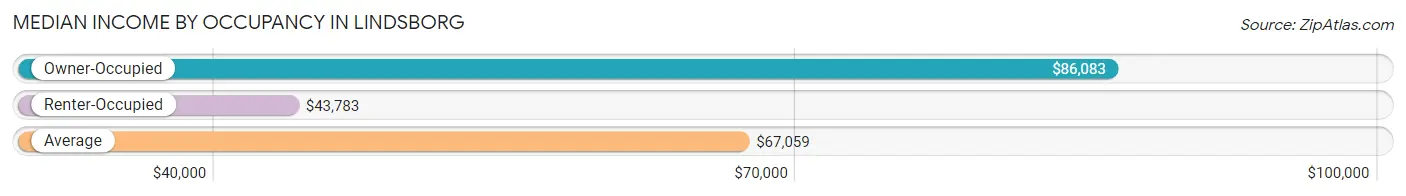
| Occupancy Type | # Households | Median Income |
| Owner-Occupied | 927 (70.1%) | $86,083 |
| Renter-Occupied | 395 (29.9%) | $43,783 |
| Average | 1,322 (100.0%) | $67,059 |
Occupancy by Householder Income Bracket in Lindsborg
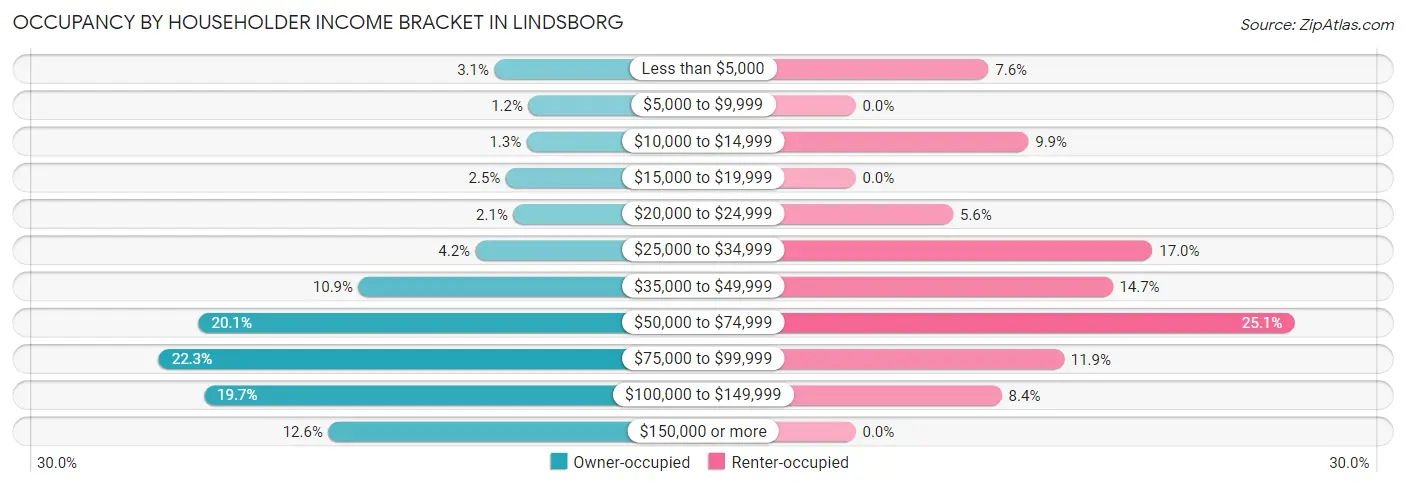
| Income Bracket | Owner-occupied | Renter-occupied |
| Less than $5,000 | 29 (3.1%) | 30 (7.6%) |
| $5,000 to $9,999 | 11 (1.2%) | 0 (0.0%) |
| $10,000 to $14,999 | 12 (1.3%) | 39 (9.9%) |
| $15,000 to $19,999 | 23 (2.5%) | 0 (0.0%) |
| $20,000 to $24,999 | 19 (2.1%) | 22 (5.6%) |
| $25,000 to $34,999 | 39 (4.2%) | 67 (17.0%) |
| $35,000 to $49,999 | 101 (10.9%) | 58 (14.7%) |
| $50,000 to $74,999 | 186 (20.1%) | 99 (25.1%) |
| $75,000 to $99,999 | 207 (22.3%) | 47 (11.9%) |
| $100,000 to $149,999 | 183 (19.7%) | 33 (8.4%) |
| $150,000 or more | 117 (12.6%) | 0 (0.0%) |
| Total | 927 (100.0%) | 395 (100.0%) |
Monthly Housing Cost Tiers in Lindsborg
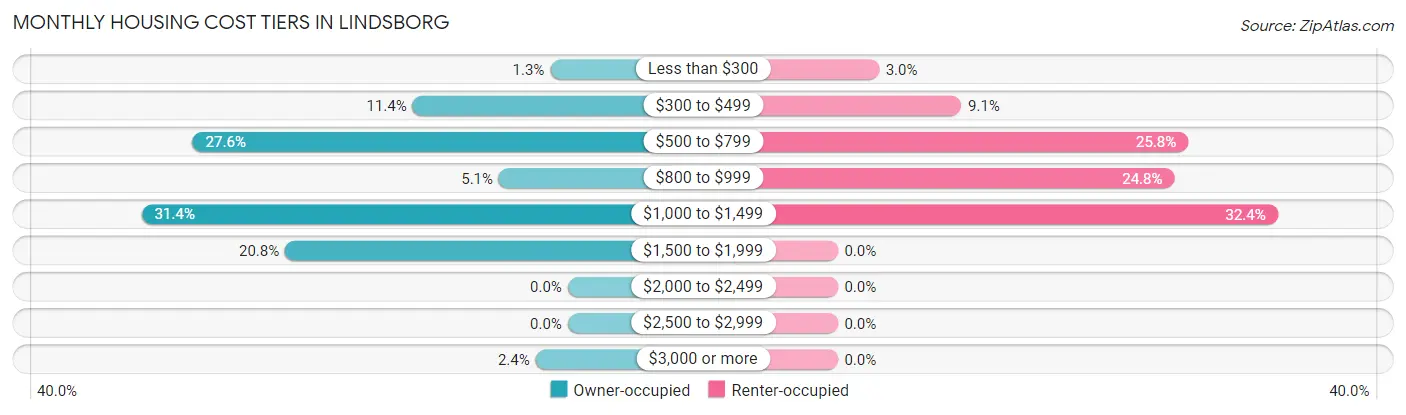
| Monthly Cost | Owner-occupied | Renter-occupied |
| Less than $300 | 12 (1.3%) | 12 (3.0%) |
| $300 to $499 | 106 (11.4%) | 36 (9.1%) |
| $500 to $799 | 256 (27.6%) | 102 (25.8%) |
| $800 to $999 | 47 (5.1%) | 98 (24.8%) |
| $1,000 to $1,499 | 291 (31.4%) | 128 (32.4%) |
| $1,500 to $1,999 | 193 (20.8%) | 0 (0.0%) |
| $2,000 to $2,499 | 0 (0.0%) | 0 (0.0%) |
| $2,500 to $2,999 | 0 (0.0%) | 0 (0.0%) |
| $3,000 or more | 22 (2.4%) | 0 (0.0%) |
| Total | 927 (100.0%) | 395 (100.0%) |
Physical Housing Characteristics in Lindsborg
Housing Structures in Lindsborg
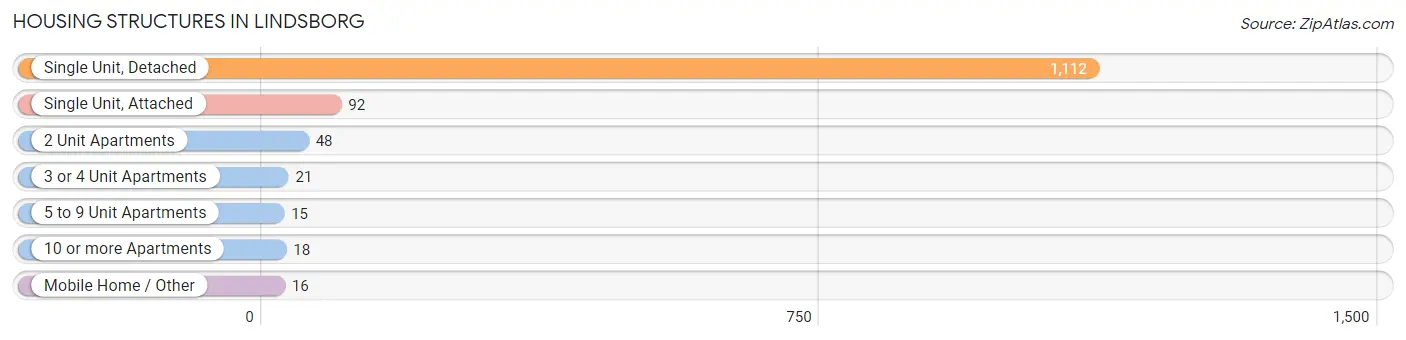
| Structure Type | # Housing Units | % Housing Units |
| Single Unit, Detached | 1,112 | 84.1% |
| Single Unit, Attached | 92 | 7.0% |
| 2 Unit Apartments | 48 | 3.6% |
| 3 or 4 Unit Apartments | 21 | 1.6% |
| 5 to 9 Unit Apartments | 15 | 1.1% |
| 10 or more Apartments | 18 | 1.4% |
| Mobile Home / Other | 16 | 1.2% |
| Total | 1,322 | 100.0% |
Housing Structures by Occupancy in Lindsborg
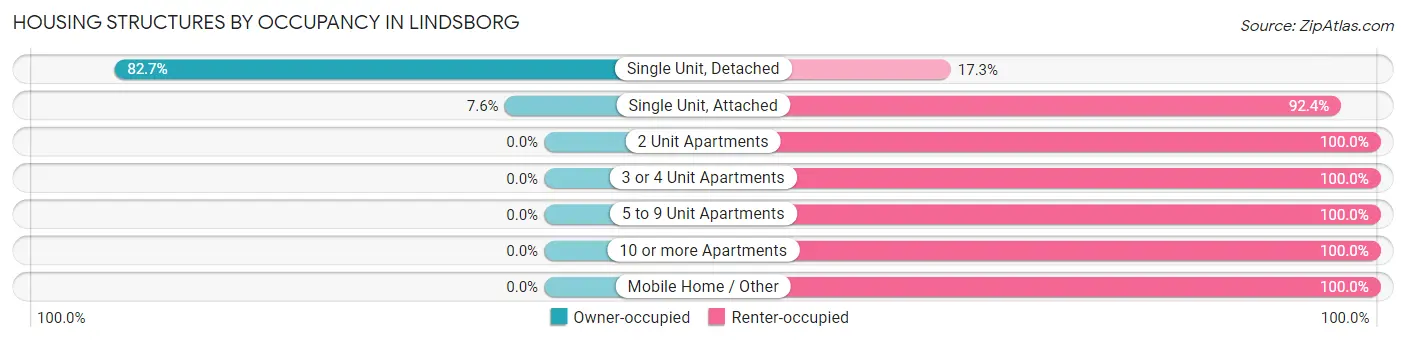
| Structure Type | Owner-occupied | Renter-occupied |
| Single Unit, Detached | 920 (82.7%) | 192 (17.3%) |
| Single Unit, Attached | 7 (7.6%) | 85 (92.4%) |
| 2 Unit Apartments | 0 (0.0%) | 48 (100.0%) |
| 3 or 4 Unit Apartments | 0 (0.0%) | 21 (100.0%) |
| 5 to 9 Unit Apartments | 0 (0.0%) | 15 (100.0%) |
| 10 or more Apartments | 0 (0.0%) | 18 (100.0%) |
| Mobile Home / Other | 0 (0.0%) | 16 (100.0%) |
| Total | 927 (70.1%) | 395 (29.9%) |
Housing Structures by Number of Rooms in Lindsborg
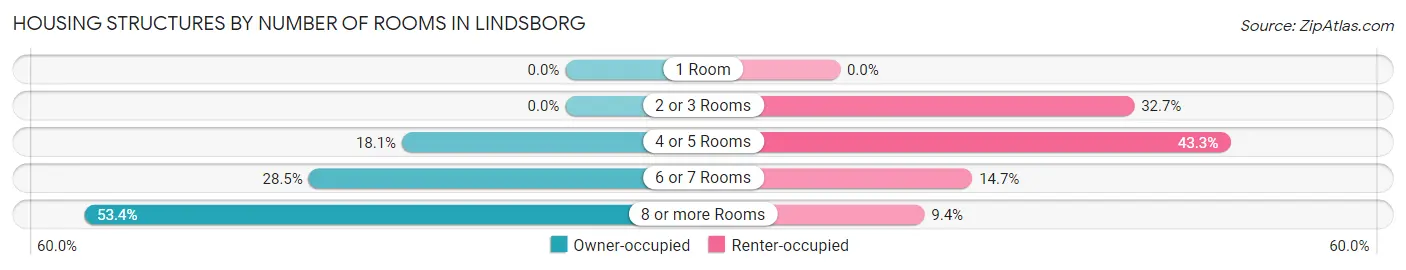
| Number of Rooms | Owner-occupied | Renter-occupied |
| 1 Room | 0 (0.0%) | 0 (0.0%) |
| 2 or 3 Rooms | 0 (0.0%) | 129 (32.7%) |
| 4 or 5 Rooms | 168 (18.1%) | 171 (43.3%) |
| 6 or 7 Rooms | 264 (28.5%) | 58 (14.7%) |
| 8 or more Rooms | 495 (53.4%) | 37 (9.4%) |
| Total | 927 (100.0%) | 395 (100.0%) |
Housing Structure by Heating Type in Lindsborg
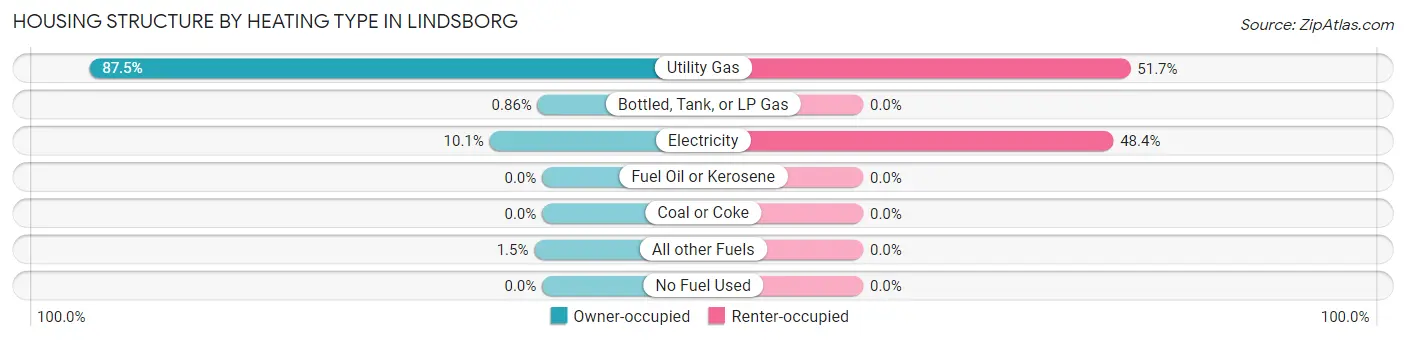
| Heating Type | Owner-occupied | Renter-occupied |
| Utility Gas | 811 (87.5%) | 204 (51.6%) |
| Bottled, Tank, or LP Gas | 8 (0.9%) | 0 (0.0%) |
| Electricity | 94 (10.1%) | 191 (48.3%) |
| Fuel Oil or Kerosene | 0 (0.0%) | 0 (0.0%) |
| Coal or Coke | 0 (0.0%) | 0 (0.0%) |
| All other Fuels | 14 (1.5%) | 0 (0.0%) |
| No Fuel Used | 0 (0.0%) | 0 (0.0%) |
| Total | 927 (100.0%) | 395 (100.0%) |
Household Vehicle Usage in Lindsborg
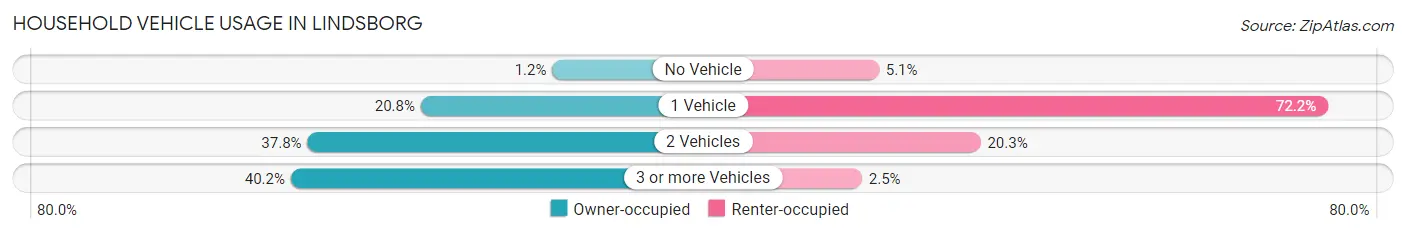
| Vehicles per Household | Owner-occupied | Renter-occupied |
| No Vehicle | 11 (1.2%) | 20 (5.1%) |
| 1 Vehicle | 193 (20.8%) | 285 (72.2%) |
| 2 Vehicles | 350 (37.8%) | 80 (20.3%) |
| 3 or more Vehicles | 373 (40.2%) | 10 (2.5%) |
| Total | 927 (100.0%) | 395 (100.0%) |
Real Estate & Mortgages in Lindsborg
Real Estate and Mortgage Overview in Lindsborg
| Characteristic | Without Mortgage | With Mortgage |
| Housing Units | 343 | 584 |
| Median Property Value | $181,300 | $143,500 |
| Median Household Income | $71,815 | $67 |
| Monthly Housing Costs | $581 | $22 |
| Real Estate Taxes | $2,438 | $0 |
Property Value by Mortgage Status in Lindsborg
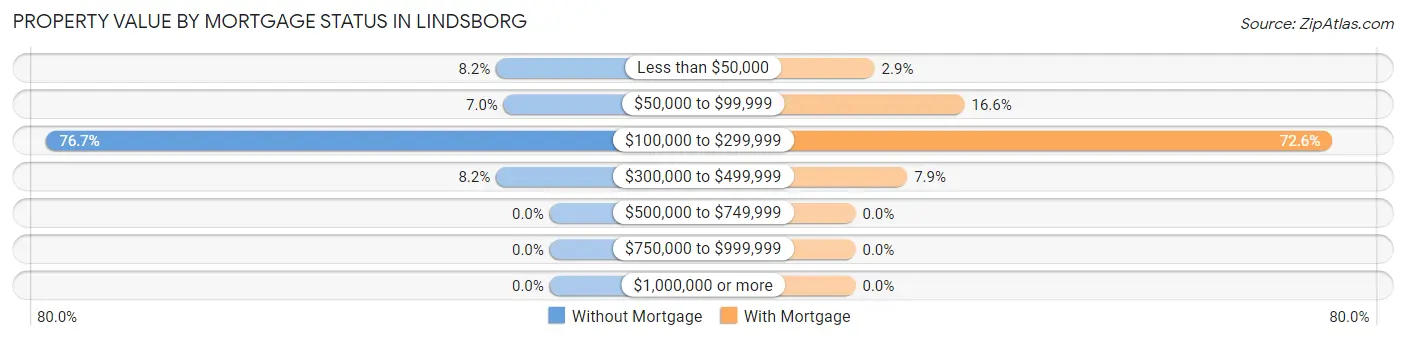
| Property Value | Without Mortgage | With Mortgage |
| Less than $50,000 | 28 (8.2%) | 17 (2.9%) |
| $50,000 to $99,999 | 24 (7.0%) | 97 (16.6%) |
| $100,000 to $299,999 | 263 (76.7%) | 424 (72.6%) |
| $300,000 to $499,999 | 28 (8.2%) | 46 (7.9%) |
| $500,000 to $749,999 | 0 (0.0%) | 0 (0.0%) |
| $750,000 to $999,999 | 0 (0.0%) | 0 (0.0%) |
| $1,000,000 or more | 0 (0.0%) | 0 (0.0%) |
| Total | 343 (100.0%) | 584 (100.0%) |
Household Income by Mortgage Status in Lindsborg
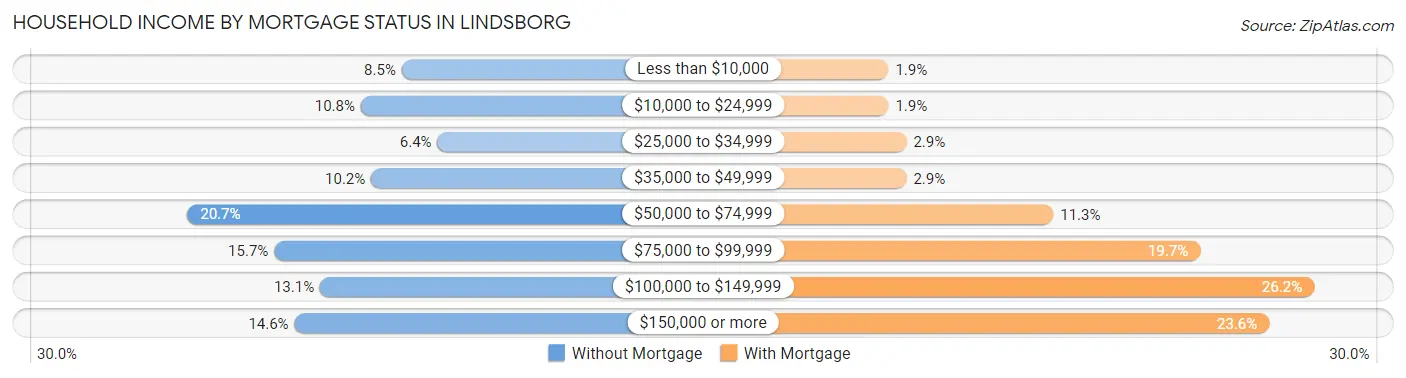
| Household Income | Without Mortgage | With Mortgage |
| Less than $10,000 | 29 (8.5%) | 11 (1.9%) |
| $10,000 to $24,999 | 37 (10.8%) | 11 (1.9%) |
| $25,000 to $34,999 | 22 (6.4%) | 17 (2.9%) |
| $35,000 to $49,999 | 35 (10.2%) | 17 (2.9%) |
| $50,000 to $74,999 | 71 (20.7%) | 66 (11.3%) |
| $75,000 to $99,999 | 54 (15.7%) | 115 (19.7%) |
| $100,000 to $149,999 | 45 (13.1%) | 153 (26.2%) |
| $150,000 or more | 50 (14.6%) | 138 (23.6%) |
| Total | 343 (100.0%) | 584 (100.0%) |
Property Value to Household Income Ratio in Lindsborg
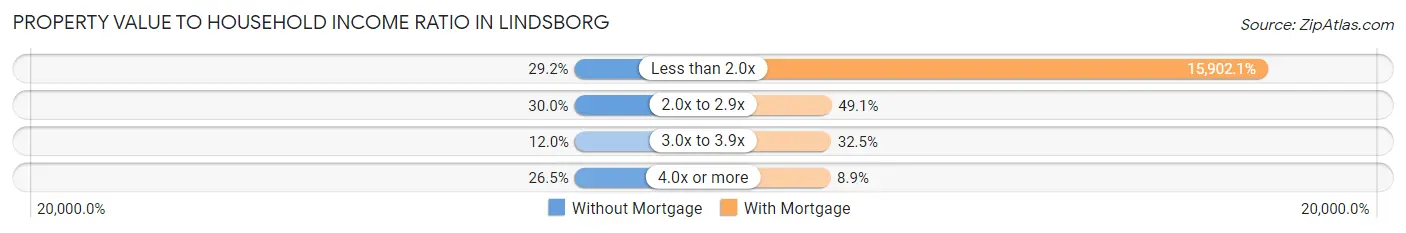
| Value-to-Income Ratio | Without Mortgage | With Mortgage |
| Less than 2.0x | 100 (29.1%) | 92,868 (15,902.0%) |
| 2.0x to 2.9x | 103 (30.0%) | 287 (49.1%) |
| 3.0x to 3.9x | 41 (11.9%) | 190 (32.5%) |
| 4.0x or more | 91 (26.5%) | 52 (8.9%) |
| Total | 343 (100.0%) | 584 (100.0%) |
Real Estate Taxes by Mortgage Status in Lindsborg
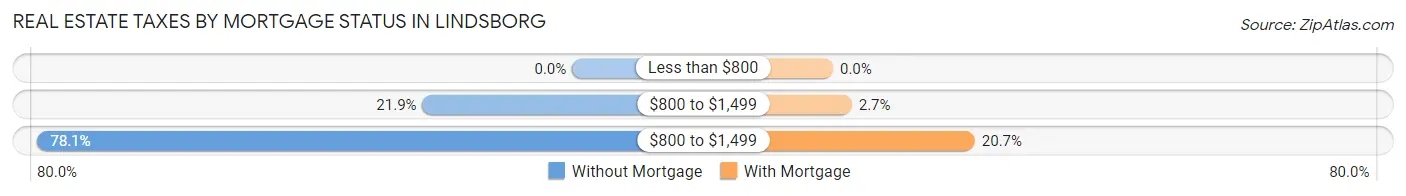
| Property Taxes | Without Mortgage | With Mortgage |
| Less than $800 | 0 (0.0%) | 0 (0.0%) |
| $800 to $1,499 | 75 (21.9%) | 16 (2.7%) |
| $800 to $1,499 | 268 (78.1%) | 121 (20.7%) |
| Total | 343 (100.0%) | 584 (100.0%) |
Health & Disability in Lindsborg
Health Insurance Coverage by Age in Lindsborg
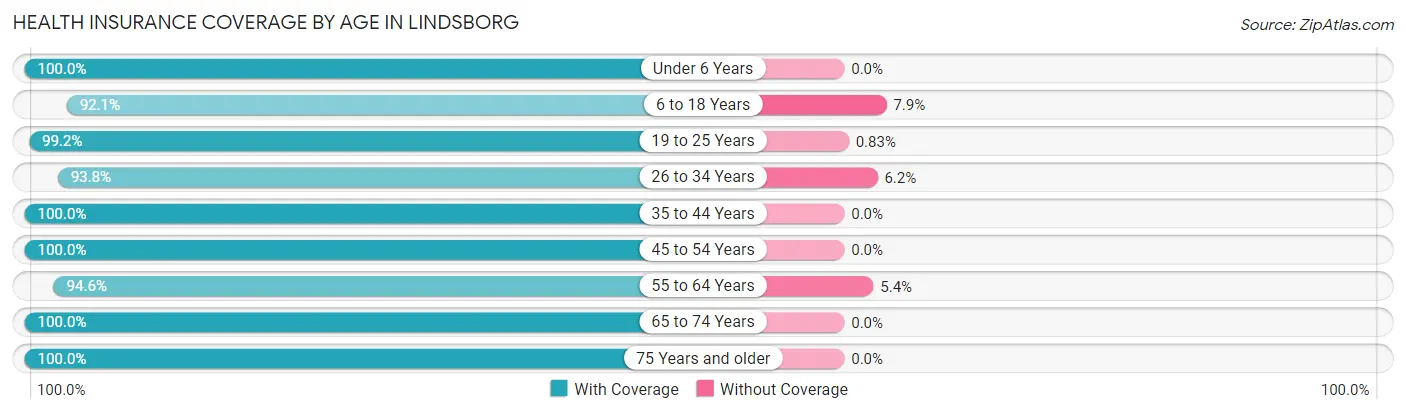
| Age Bracket | With Coverage | Without Coverage |
| Under 6 Years | 293 (100.0%) | 0 (0.0%) |
| 6 to 18 Years | 598 (92.1%) | 51 (7.9%) |
| 19 to 25 Years | 594 (99.2%) | 5 (0.8%) |
| 26 to 34 Years | 471 (93.8%) | 31 (6.2%) |
| 35 to 44 Years | 314 (100.0%) | 0 (0.0%) |
| 45 to 54 Years | 173 (100.0%) | 0 (0.0%) |
| 55 to 64 Years | 436 (94.6%) | 25 (5.4%) |
| 65 to 74 Years | 403 (100.0%) | 0 (0.0%) |
| 75 Years and older | 250 (100.0%) | 0 (0.0%) |
| Total | 3,532 (96.9%) | 112 (3.1%) |
Health Insurance Coverage by Citizenship Status in Lindsborg
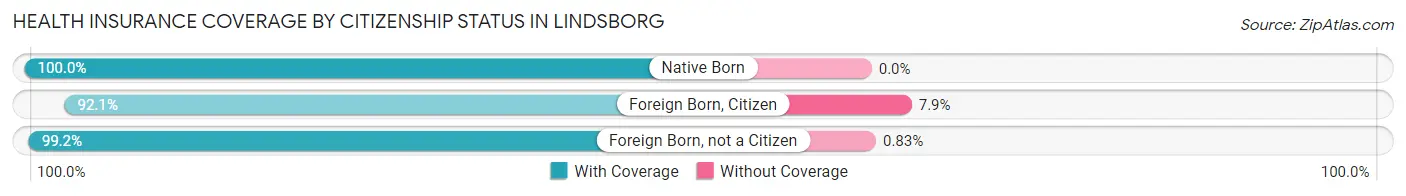
| Citizenship Status | With Coverage | Without Coverage |
| Native Born | 293 (100.0%) | 0 (0.0%) |
| Foreign Born, Citizen | 598 (92.1%) | 51 (7.9%) |
| Foreign Born, not a Citizen | 594 (99.2%) | 5 (0.8%) |
Health Insurance Coverage by Household Income in Lindsborg
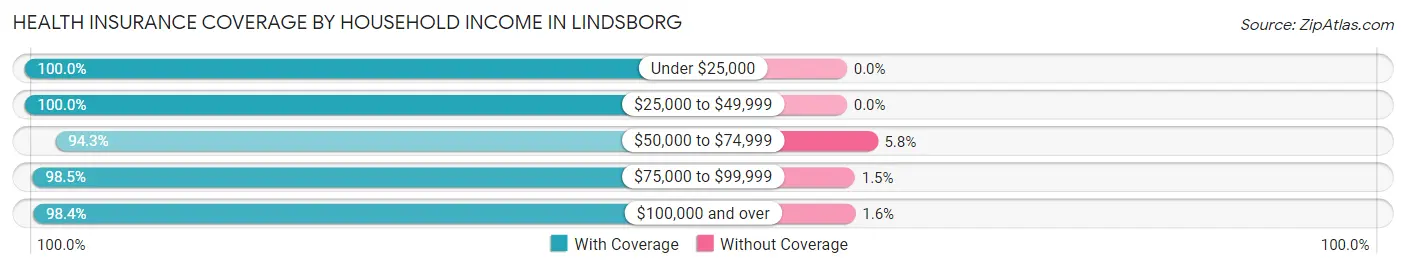
| Household Income | With Coverage | Without Coverage |
| Under $25,000 | 304 (100.0%) | 0 (0.0%) |
| $25,000 to $49,999 | 351 (100.0%) | 0 (0.0%) |
| $50,000 to $74,999 | 639 (94.3%) | 39 (5.8%) |
| $75,000 to $99,999 | 786 (98.5%) | 12 (1.5%) |
| $100,000 and over | 1,036 (98.4%) | 17 (1.6%) |
Public vs Private Health Insurance Coverage by Age in Lindsborg
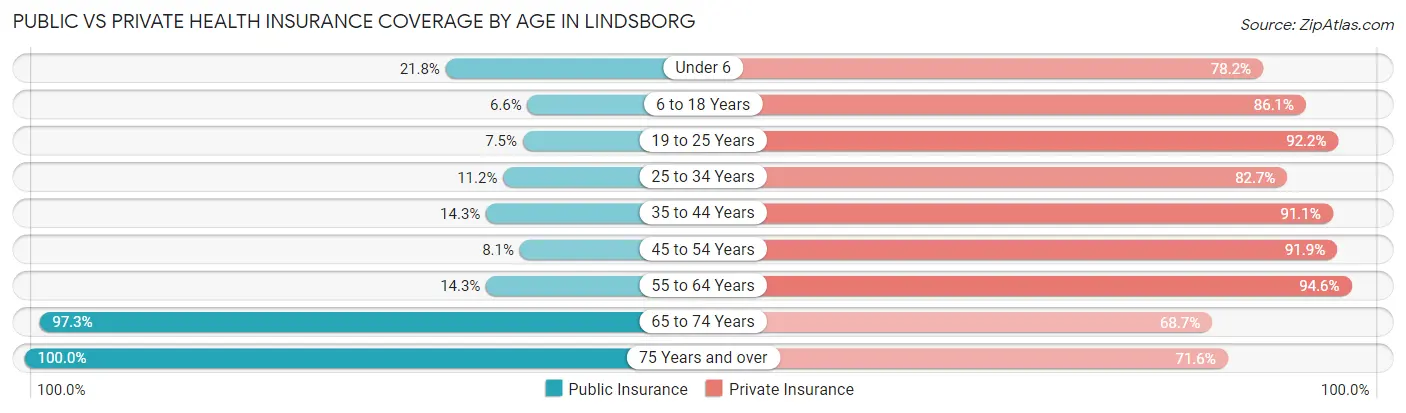
| Age Bracket | Public Insurance | Private Insurance |
| Under 6 | 64 (21.8%) | 229 (78.2%) |
| 6 to 18 Years | 43 (6.6%) | 559 (86.1%) |
| 19 to 25 Years | 45 (7.5%) | 552 (92.1%) |
| 25 to 34 Years | 56 (11.2%) | 415 (82.7%) |
| 35 to 44 Years | 45 (14.3%) | 286 (91.1%) |
| 45 to 54 Years | 14 (8.1%) | 159 (91.9%) |
| 55 to 64 Years | 66 (14.3%) | 436 (94.6%) |
| 65 to 74 Years | 392 (97.3%) | 277 (68.7%) |
| 75 Years and over | 250 (100.0%) | 179 (71.6%) |
| Total | 975 (26.8%) | 3,092 (84.9%) |
Disability Status by Sex by Age in Lindsborg
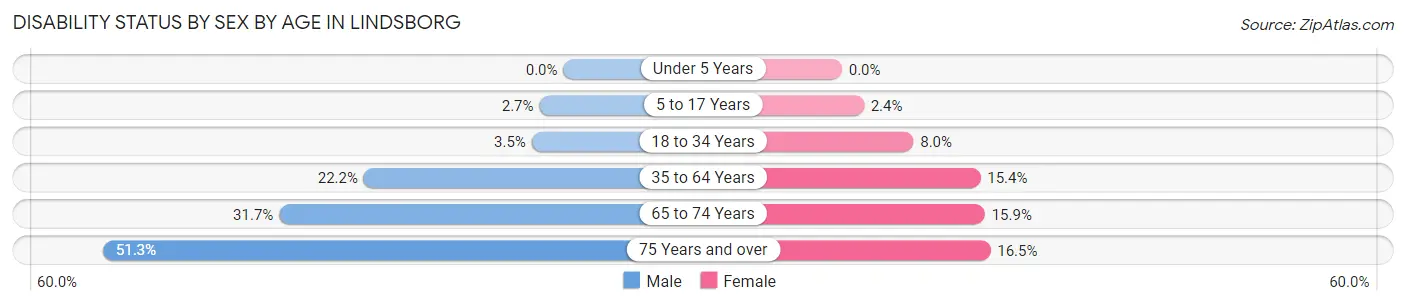
| Age Bracket | Male | Female |
| Under 5 Years | 0 (0.0%) | 0 (0.0%) |
| 5 to 17 Years | 7 (2.7%) | 6 (2.4%) |
| 18 to 34 Years | 25 (3.5%) | 44 (8.0%) |
| 35 to 64 Years | 104 (22.2%) | 74 (15.4%) |
| 65 to 74 Years | 50 (31.7%) | 39 (15.9%) |
| 75 Years and over | 60 (51.3%) | 22 (16.5%) |
Disability Class by Sex by Age in Lindsborg
Disability Class: Hearing Difficulty
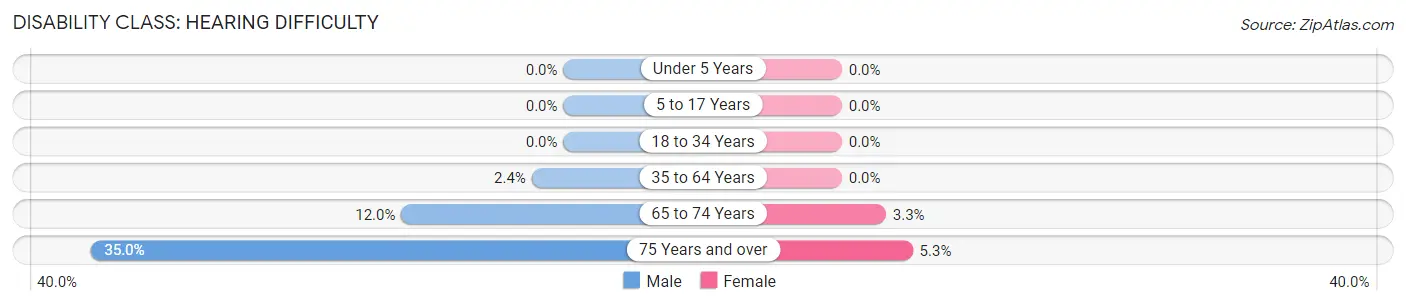
| Age Bracket | Male | Female |
| Under 5 Years | 0 (0.0%) | 0 (0.0%) |
| 5 to 17 Years | 0 (0.0%) | 0 (0.0%) |
| 18 to 34 Years | 0 (0.0%) | 0 (0.0%) |
| 35 to 64 Years | 11 (2.4%) | 0 (0.0%) |
| 65 to 74 Years | 19 (12.0%) | 8 (3.3%) |
| 75 Years and over | 41 (35.0%) | 7 (5.3%) |
Disability Class: Vision Difficulty
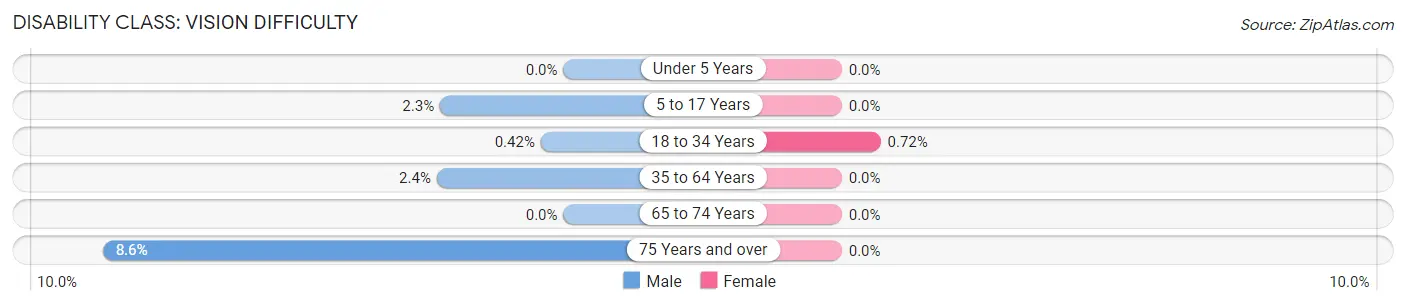
| Age Bracket | Male | Female |
| Under 5 Years | 0 (0.0%) | 0 (0.0%) |
| 5 to 17 Years | 6 (2.3%) | 0 (0.0%) |
| 18 to 34 Years | 3 (0.4%) | 4 (0.7%) |
| 35 to 64 Years | 11 (2.4%) | 0 (0.0%) |
| 65 to 74 Years | 0 (0.0%) | 0 (0.0%) |
| 75 Years and over | 10 (8.6%) | 0 (0.0%) |
Disability Class: Cognitive Difficulty
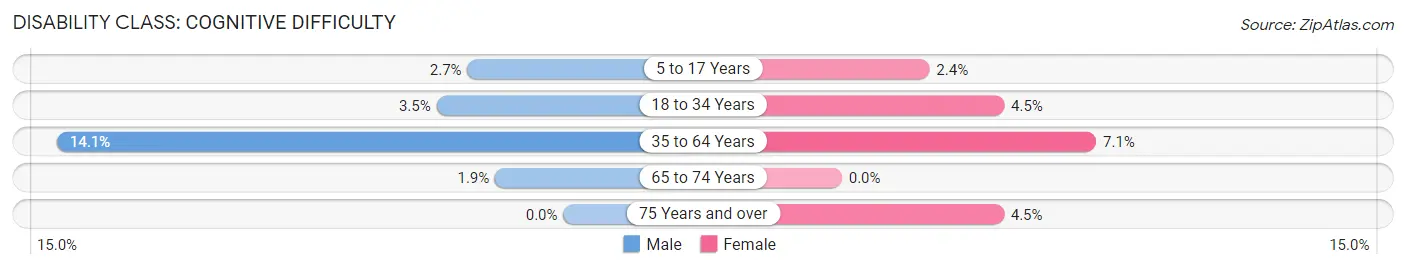
| Age Bracket | Male | Female |
| 5 to 17 Years | 7 (2.7%) | 6 (2.4%) |
| 18 to 34 Years | 25 (3.5%) | 25 (4.5%) |
| 35 to 64 Years | 66 (14.1%) | 34 (7.1%) |
| 65 to 74 Years | 3 (1.9%) | 0 (0.0%) |
| 75 Years and over | 0 (0.0%) | 6 (4.5%) |
Disability Class: Ambulatory Difficulty
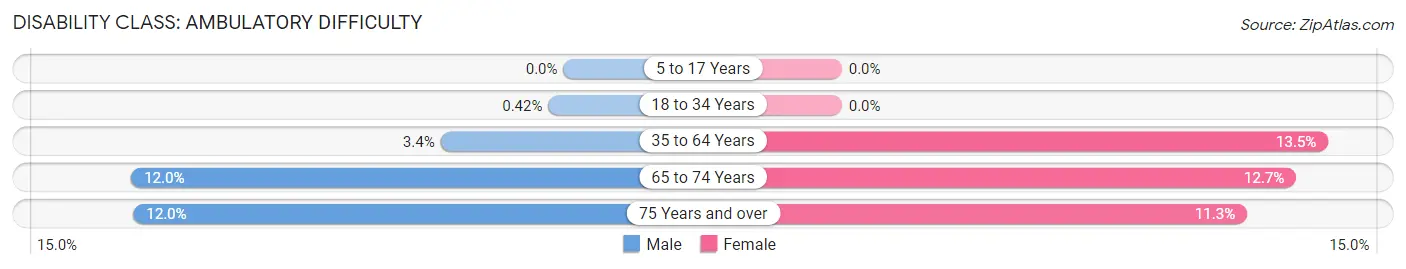
| Age Bracket | Male | Female |
| 5 to 17 Years | 0 (0.0%) | 0 (0.0%) |
| 18 to 34 Years | 3 (0.4%) | 0 (0.0%) |
| 35 to 64 Years | 16 (3.4%) | 65 (13.5%) |
| 65 to 74 Years | 19 (12.0%) | 31 (12.7%) |
| 75 Years and over | 14 (12.0%) | 15 (11.3%) |
Disability Class: Self-Care Difficulty
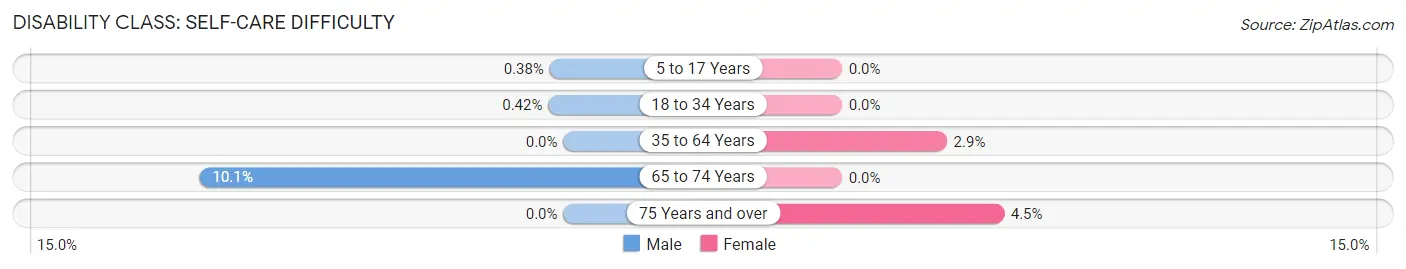
| Age Bracket | Male | Female |
| 5 to 17 Years | 1 (0.4%) | 0 (0.0%) |
| 18 to 34 Years | 3 (0.4%) | 0 (0.0%) |
| 35 to 64 Years | 0 (0.0%) | 14 (2.9%) |
| 65 to 74 Years | 16 (10.1%) | 0 (0.0%) |
| 75 Years and over | 0 (0.0%) | 6 (4.5%) |
Technology Access in Lindsborg
Computing Device Access in Lindsborg
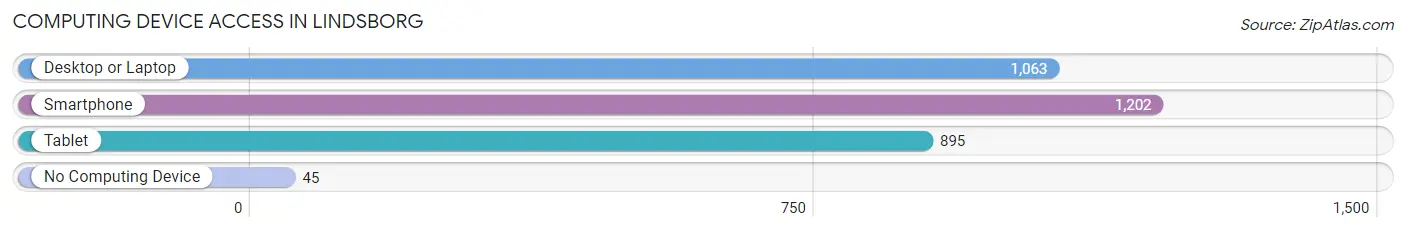
| Device Type | # Households | % Households |
| Desktop or Laptop | 1,063 | 80.4% |
| Smartphone | 1,202 | 90.9% |
| Tablet | 895 | 67.7% |
| No Computing Device | 45 | 3.4% |
| Total | 1,322 | 100.0% |
Internet Access in Lindsborg
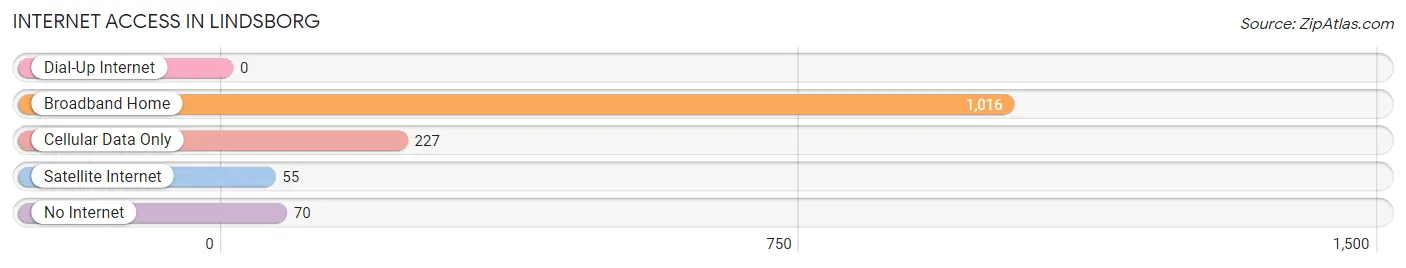
| Internet Type | # Households | % Households |
| Dial-Up Internet | 0 | 0.0% |
| Broadband Home | 1,016 | 76.8% |
| Cellular Data Only | 227 | 17.2% |
| Satellite Internet | 55 | 4.2% |
| No Internet | 70 | 5.3% |
| Total | 1,322 | 100.0% |
Lindsborg Summary
Lindsborg, Kansas is a small town located in McPherson County, in the central part of the state. It is situated on the Smoky Hill River, about 30 miles north of Salina. The town was founded in 1869 by Swedish immigrants, and today it is known as “Little Sweden, USA” due to its strong Swedish heritage.
Geography
Lindsborg is located in the Smoky Hills region of Kansas, which is characterized by rolling hills and prairies. The town is situated on the Smoky Hill River, which flows through the center of town. The town is located at an elevation of 1,400 feet above sea level. The climate in Lindsborg is generally mild, with hot summers and cold winters.
Economy
The economy of Lindsborg is largely based on agriculture and tourism. The town is home to several small businesses, including restaurants, retail stores, and art galleries. The town is also home to Bethany College, a private liberal arts college founded in 1881. The college provides a variety of educational opportunities for students, and it is a major employer in the town.
Demographics
As of the 2010 census, the population of Lindsborg was 3,458. The racial makeup of the town was 95.3% White, 0.7% African American, 0.3% Native American, 0.7% Asian, 0.1% Pacific Islander, 1.2% from other races, and 1.7% from two or more races. Hispanic or Latino of any race were 3.2% of the population.
The median income for a household in Lindsborg was $41,944, and the median income for a family was $50,938. The per capita income for the town was $20,945. About 8.2% of families and 11.2% of the population were below the poverty line, including 14.2% of those under age 18 and 8.2% of those age 65 or over.
History
Lindsborg was founded in 1869 by Swedish immigrants who were seeking religious freedom. The town was named after the Swedish city of Lindsborg, and it was the first Swedish settlement in the United States. The town quickly grew, and by the early 1900s it had become a thriving community.
In the early 1900s, Lindsborg was home to a thriving Swedish-American culture. The town was home to several Swedish-American organizations, including the Swedish-American Historical Society and the Swedish-American Museum. The town also hosted several Swedish-American festivals, including the annual Midsommar Festival.
Today, Lindsborg is still home to a strong Swedish-American culture. The town is home to several Swedish-American organizations, and it hosts several Swedish-American festivals each year. The town is also home to Bethany College, which is a major employer in the town. Lindsborg is a popular tourist destination, and it is known for its unique Swedish-American culture.
Common Questions
What is Per Capita Income in Lindsborg?
Per Capita income in Lindsborg is $29,518.
What is the Median Family Income in Lindsborg?
Median Family Income in Lindsborg is $86,833.
What is the Median Household income in Lindsborg?
Median Household Income in Lindsborg is $67,059.
What is Income or Wage Gap in Lindsborg?
Income or Wage Gap in Lindsborg is 32.5%.
Women in Lindsborg earn 67.5 cents for every dollar earned by a man.
What is Inequality or Gini Index in Lindsborg?
Inequality or Gini Index in Lindsborg is 0.37.
What is the Total Population of Lindsborg?
Total Population of Lindsborg is 3,762.
What is the Total Male Population of Lindsborg?
Total Male Population of Lindsborg is 1,840.
What is the Total Female Population of Lindsborg?
Total Female Population of Lindsborg is 1,922.
What is the Ratio of Males per 100 Females in Lindsborg?
There are 95.73 Males per 100 Females in Lindsborg.
What is the Ratio of Females per 100 Males in Lindsborg?
There are 104.46 Females per 100 Males in Lindsborg.
What is the Median Population Age in Lindsborg?
Median Population Age in Lindsborg is 31.6 Years.
What is the Average Family Size in Lindsborg
Average Family Size in Lindsborg is 3.1 People.
What is the Average Household Size in Lindsborg
Average Household Size in Lindsborg is 2.4 People.
How Large is the Labor Force in Lindsborg?
There are 1,928 People in the Labor Forcein in Lindsborg.
What is the Percentage of People in the Labor Force in Lindsborg?
62.4% of People are in the Labor Force in Lindsborg.
What is the Unemployment Rate in Lindsborg?
Unemployment Rate in Lindsborg is 2.0%.