Lehigh, KS Map & Demographics
Lehigh Map
Lehigh Overview
$30,516
PER CAPITA INCOME
$88,750
AVG FAMILY INCOME
$75,625
AVG HOUSEHOLD INCOME
17.1%
WAGE / INCOME GAP [ % ]
82.9¢/ $1
WAGE / INCOME GAP [ $ ]
0.28
INEQUALITY / GINI INDEX
196
TOTAL POPULATION
125
MALE POPULATION
71
FEMALE POPULATION
176.06
MALES / 100 FEMALES
56.80
FEMALES / 100 MALES
33.9
MEDIAN AGE
3.0
AVG FAMILY SIZE
2.5
AVG HOUSEHOLD SIZE
98
LABOR FORCE [ PEOPLE ]
67.1%
PERCENT IN LABOR FORCE
Lehigh Zip Codes
Lehigh Area Codes
Income in Lehigh
Income Overview in Lehigh
Per Capita Income in Lehigh is $30,516, while median incomes of families and households are $88,750 and $75,625 respectively.
| Characteristic | Number | Measure |
| Per Capita Income | 196 | $30,516 |
| Median Family Income | 59 | $88,750 |
| Mean Family Income | 59 | $84,351 |
| Median Household Income | 77 | $75,625 |
| Mean Household Income | 77 | $75,201 |
| Income Deficit | 59 | $0 |
| Wage / Income Gap (%) | 196 | 17.14% |
| Wage / Income Gap ($) | 196 | 82.86¢ per $1 |
| Gini / Inequality Index | 196 | 0.28 |
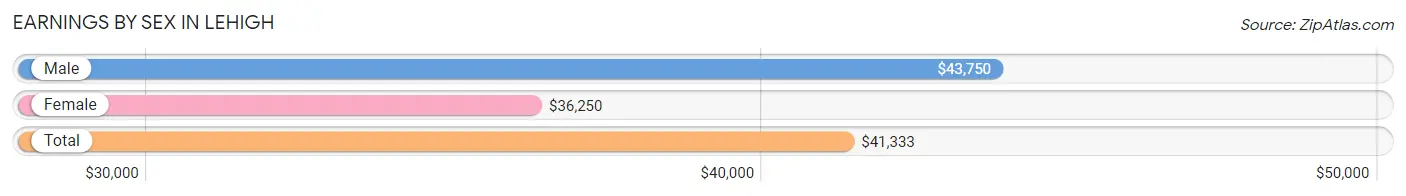
Earnings by Sex in Lehigh
Average Earnings in Lehigh are $41,333, $43,750 for men and $36,250 for women, a difference of 17.1%.
| Sex | Number | Average Earnings |
| Male | 77 (70.0%) | $43,750 |
| Female | 33 (30.0%) | $36,250 |
| Total | 110 (100.0%) | $41,333 |
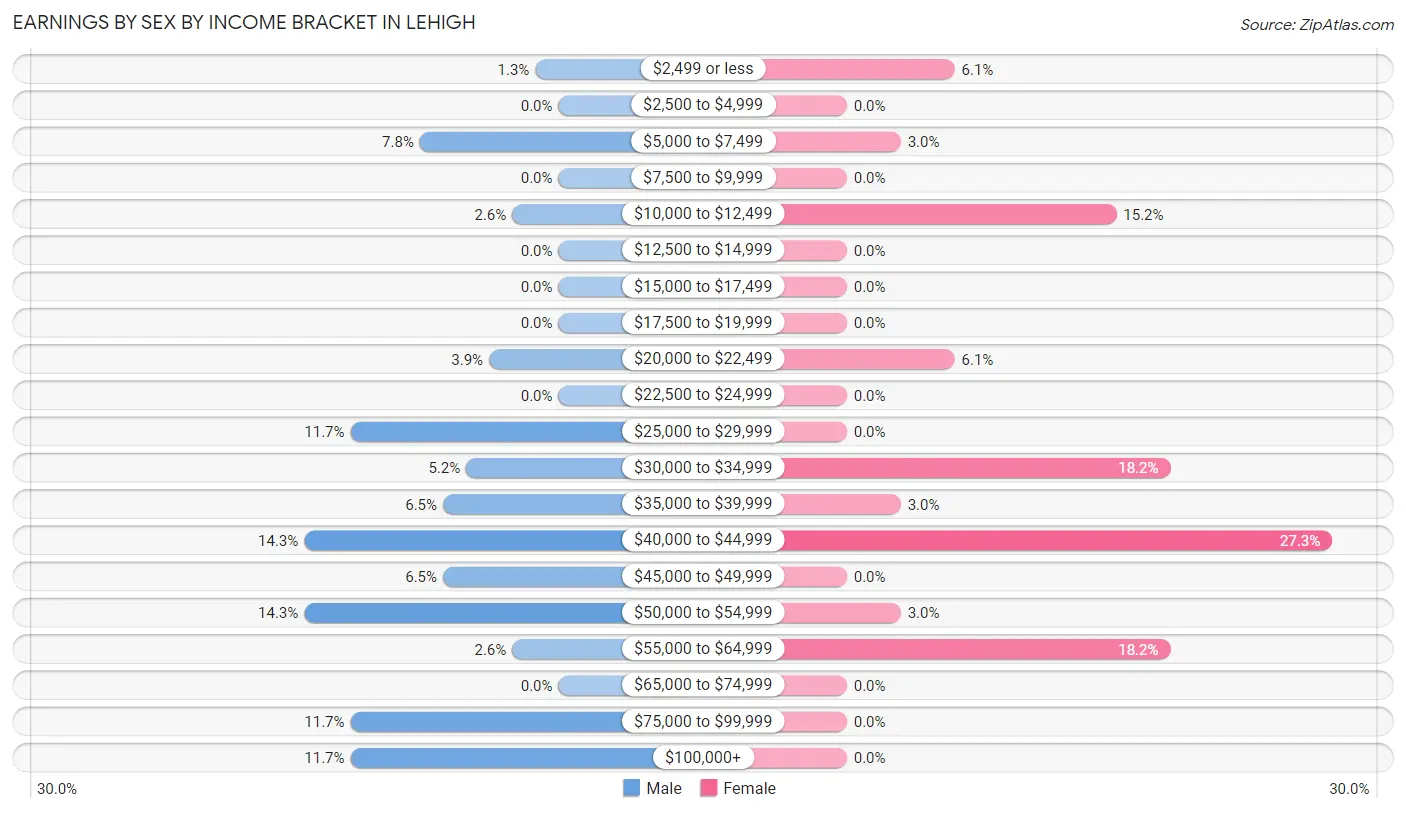
Earnings by Sex by Income Bracket in Lehigh
The most common earnings brackets in Lehigh are $40,000 to $44,999 for men (11 | 14.3%) and $40,000 to $44,999 for women (9 | 27.3%).
| Income | Male | Female |
| $2,499 or less | 1 (1.3%) | 2 (6.1%) |
| $2,500 to $4,999 | 0 (0.0%) | 0 (0.0%) |
| $5,000 to $7,499 | 6 (7.8%) | 1 (3.0%) |
| $7,500 to $9,999 | 0 (0.0%) | 0 (0.0%) |
| $10,000 to $12,499 | 2 (2.6%) | 5 (15.1%) |
| $12,500 to $14,999 | 0 (0.0%) | 0 (0.0%) |
| $15,000 to $17,499 | 0 (0.0%) | 0 (0.0%) |
| $17,500 to $19,999 | 0 (0.0%) | 0 (0.0%) |
| $20,000 to $22,499 | 3 (3.9%) | 2 (6.1%) |
| $22,500 to $24,999 | 0 (0.0%) | 0 (0.0%) |
| $25,000 to $29,999 | 9 (11.7%) | 0 (0.0%) |
| $30,000 to $34,999 | 4 (5.2%) | 6 (18.2%) |
| $35,000 to $39,999 | 5 (6.5%) | 1 (3.0%) |
| $40,000 to $44,999 | 11 (14.3%) | 9 (27.3%) |
| $45,000 to $49,999 | 5 (6.5%) | 0 (0.0%) |
| $50,000 to $54,999 | 11 (14.3%) | 1 (3.0%) |
| $55,000 to $64,999 | 2 (2.6%) | 6 (18.2%) |
| $65,000 to $74,999 | 0 (0.0%) | 0 (0.0%) |
| $75,000 to $99,999 | 9 (11.7%) | 0 (0.0%) |
| $100,000+ | 9 (11.7%) | 0 (0.0%) |
| Total | 77 (100.0%) | 33 (100.0%) |
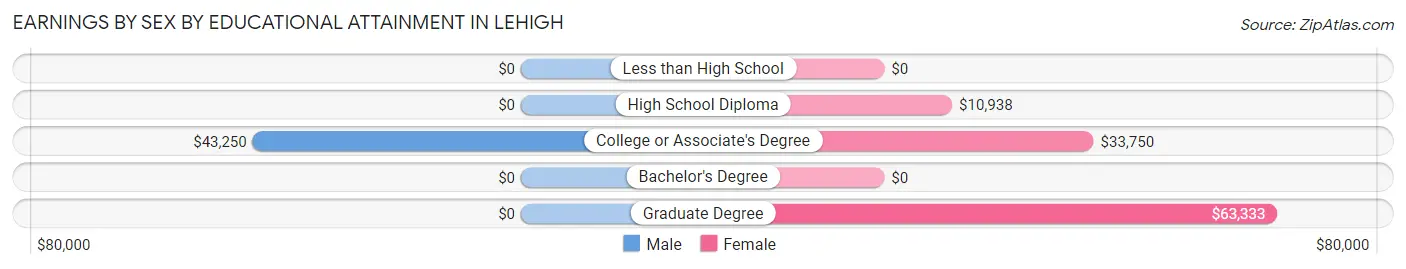
Earnings by Sex by Educational Attainment in Lehigh
Average earnings in Lehigh are $46,250 for men and $40,139 for women, a difference of 13.2%. Men with an educational attainment of college or associate's degree enjoy the highest average annual earnings of $43,250, while those with college or associate's degree education earn the least with $43,250. Women with an educational attainment of graduate degree earn the most with the average annual earnings of $63,333, while those with high school diploma education have the smallest earnings of $10,938.
| Educational Attainment | Male Income | Female Income |
| Less than High School | - | - |
| High School Diploma | - | - |
| College or Associate's Degree | $43,250 | $33,750 |
| Bachelor's Degree | - | - |
| Graduate Degree | - | - |
| Total | $46,250 | $40,139 |
Family Income in Lehigh
Family Income Brackets in Lehigh
According to the Lehigh family income data, there are 19 families falling into the $75,000 to $99,999 income range, which is the most common income bracket and makes up 32.2% of all families.
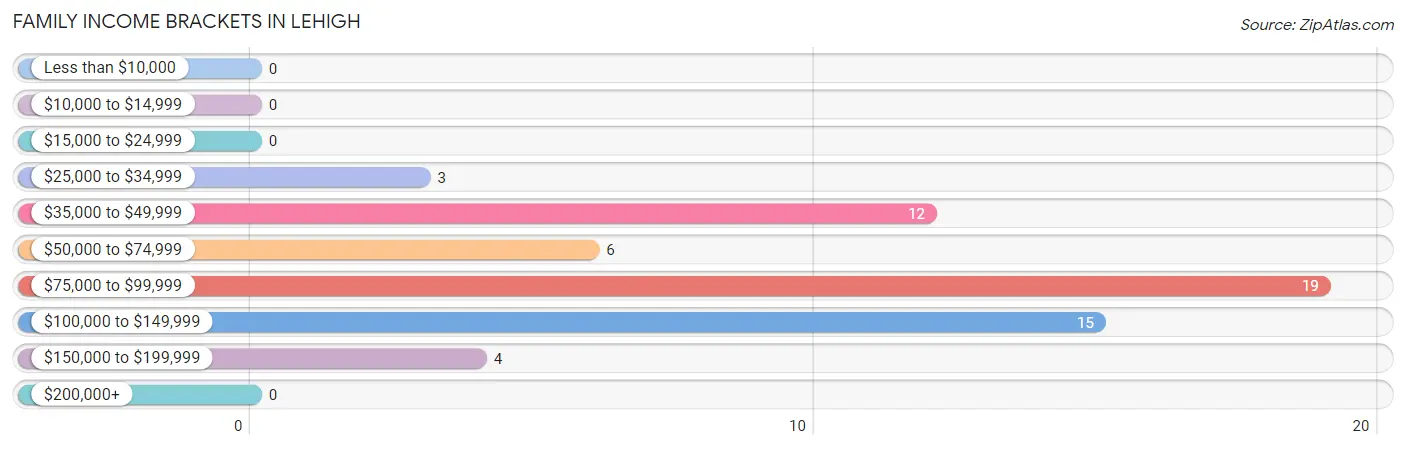
| Income Bracket | # Families | % Families |
| Less than $10,000 | 0 | 0.0% |
| $10,000 to $14,999 | 0 | 0.0% |
| $15,000 to $24,999 | 0 | 0.0% |
| $25,000 to $34,999 | 3 | 5.1% |
| $35,000 to $49,999 | 12 | 20.3% |
| $50,000 to $74,999 | 6 | 10.2% |
| $75,000 to $99,999 | 19 | 32.2% |
| $100,000 to $149,999 | 15 | 25.4% |
| $150,000 to $199,999 | 4 | 6.8% |
| $200,000+ | 0 | 0.0% |
Family Income by Famaliy Size in Lehigh
3-person families (13 | 22.0%) account for the highest median family income in Lehigh with $115,625 per family, while 3-person families (13 | 22.0%) have the highest median income of $38,542 per family member.
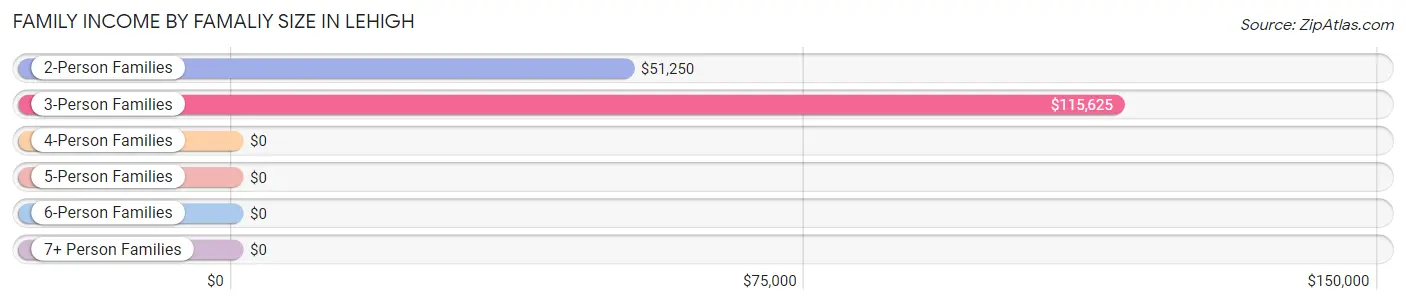
| Income Bracket | # Families | Median Income |
| 2-Person Families | 29 (49.1%) | $51,250 |
| 3-Person Families | 13 (22.0%) | $115,625 |
| 4-Person Families | 7 (11.9%) | $0 |
| 5-Person Families | 7 (11.9%) | $0 |
| 6-Person Families | 0 (0.0%) | $0 |
| 7+ Person Families | 3 (5.1%) | $0 |
| Total | 59 (100.0%) | $88,750 |
Family Income by Number of Earners in Lehigh
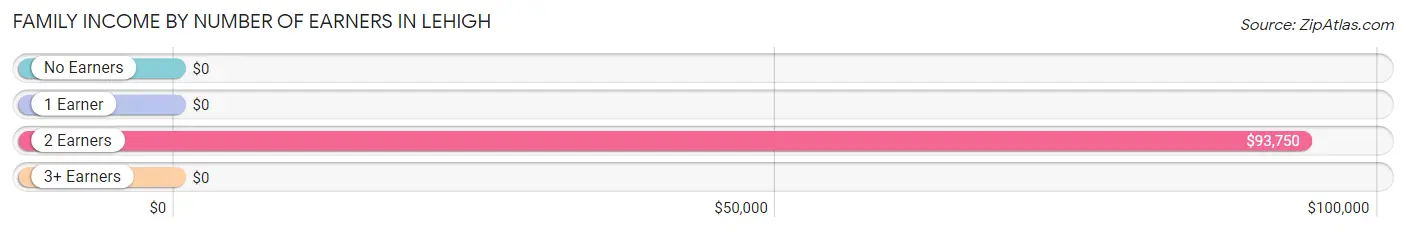
| Number of Earners | # Families | Median Income |
| No Earners | 5 (8.5%) | $0 |
| 1 Earner | 19 (32.2%) | $0 |
| 2 Earners | 34 (57.6%) | $93,750 |
| 3+ Earners | 1 (1.7%) | $0 |
| Total | 59 (100.0%) | $88,750 |
Household Income in Lehigh
Household Income Brackets in Lehigh
With 20 households falling in the category, the $35,000 to $49,999 income range is the most frequent in Lehigh, accounting for 26.0% of all households.
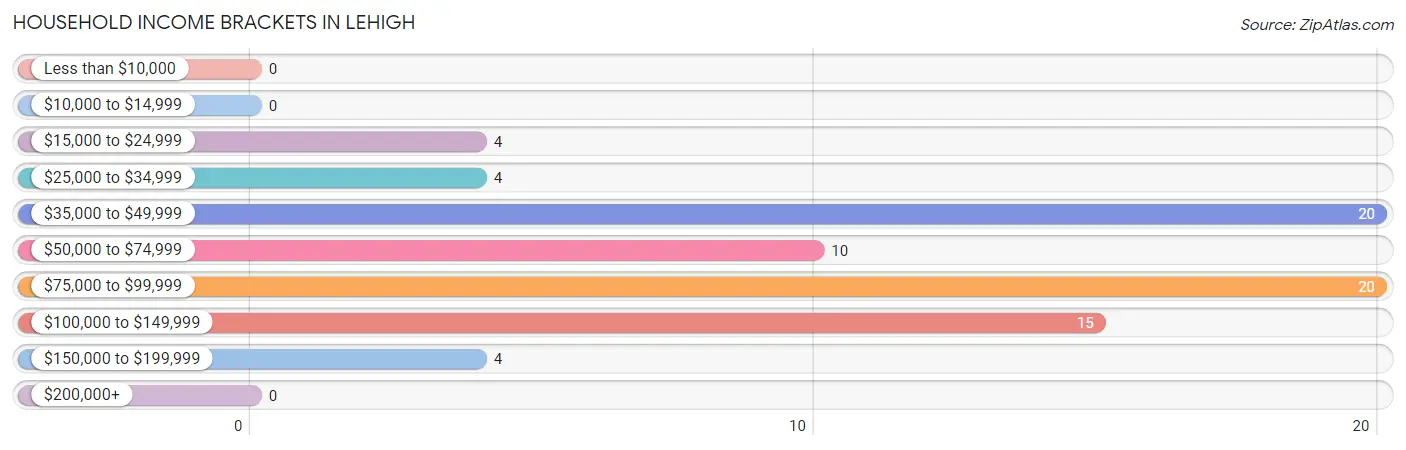
| Income Bracket | # Households | % Households |
| Less than $10,000 | 0 | 0.0% |
| $10,000 to $14,999 | 0 | 0.0% |
| $15,000 to $24,999 | 4 | 5.2% |
| $25,000 to $34,999 | 4 | 5.2% |
| $35,000 to $49,999 | 20 | 26.0% |
| $50,000 to $74,999 | 10 | 13.0% |
| $75,000 to $99,999 | 20 | 26.0% |
| $100,000 to $149,999 | 15 | 19.5% |
| $150,000 to $199,999 | 4 | 5.2% |
| $200,000+ | 0 | 0.0% |
Household Income by Householder Age in Lehigh
The median household income in Lehigh is $75,625, with the highest median household income of $115,417 found in the 45 to 64 years age bracket for the primary householder. A total of 18 households (23.4%) fall into this category. Meanwhile, the 15 to 24 years age bracket for the primary householder has the lowest median household income of $0, with 2 households (2.6%) in this group.
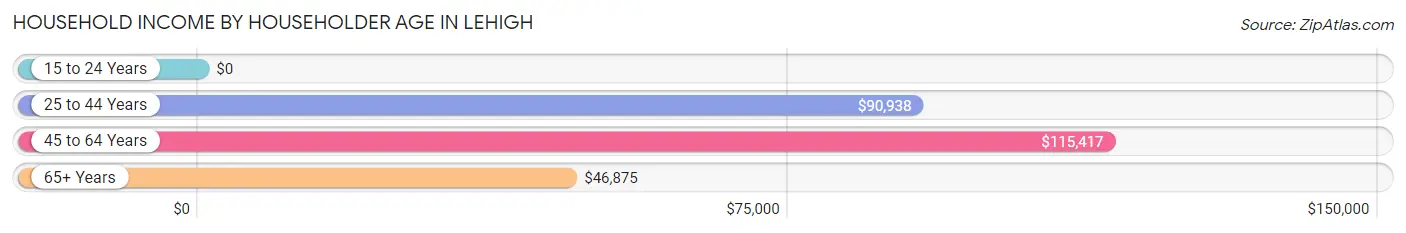
| Income Bracket | # Households | Median Income |
| 15 to 24 Years | 2 (2.6%) | $0 |
| 25 to 44 Years | 28 (36.4%) | $90,938 |
| 45 to 64 Years | 18 (23.4%) | $115,417 |
| 65+ Years | 29 (37.7%) | $46,875 |
| Total | 77 (100.0%) | $75,625 |
Poverty in Lehigh
Income Below Poverty by Sex and Age in Lehigh
With 0.8% poverty level for males and 2.8% for females among the residents of Lehigh, 35 to 44 year old males and 35 to 44 year old females are the most vulnerable to poverty, with 1 males (12.5%) and 2 females (22.2%) in their respective age groups living below the poverty level.
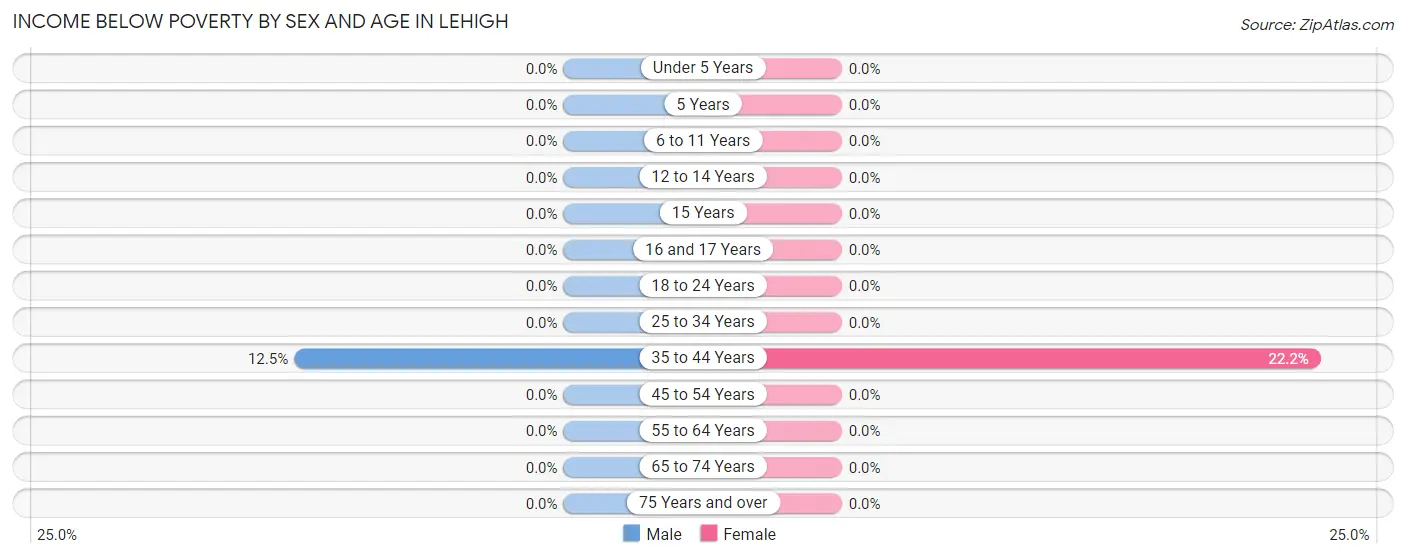
| Age Bracket | Male | Female |
| Under 5 Years | 0 (0.0%) | 0 (0.0%) |
| 5 Years | 0 (0.0%) | 0 (0.0%) |
| 6 to 11 Years | 0 (0.0%) | 0 (0.0%) |
| 12 to 14 Years | 0 (0.0%) | 0 (0.0%) |
| 15 Years | 0 (0.0%) | 0 (0.0%) |
| 16 and 17 Years | 0 (0.0%) | 0 (0.0%) |
| 18 to 24 Years | 0 (0.0%) | 0 (0.0%) |
| 25 to 34 Years | 0 (0.0%) | 0 (0.0%) |
| 35 to 44 Years | 1 (12.5%) | 2 (22.2%) |
| 45 to 54 Years | 0 (0.0%) | 0 (0.0%) |
| 55 to 64 Years | 0 (0.0%) | 0 (0.0%) |
| 65 to 74 Years | 0 (0.0%) | 0 (0.0%) |
| 75 Years and over | 0 (0.0%) | 0 (0.0%) |
| Total | 1 (0.8%) | 2 (2.8%) |
Income Above Poverty by Sex and Age in Lehigh
According to the poverty statistics in Lehigh, males aged under 5 years and females aged under 5 years are the age groups that are most secure financially, with 100.0% of males and 100.0% of females in these age groups living above the poverty line.
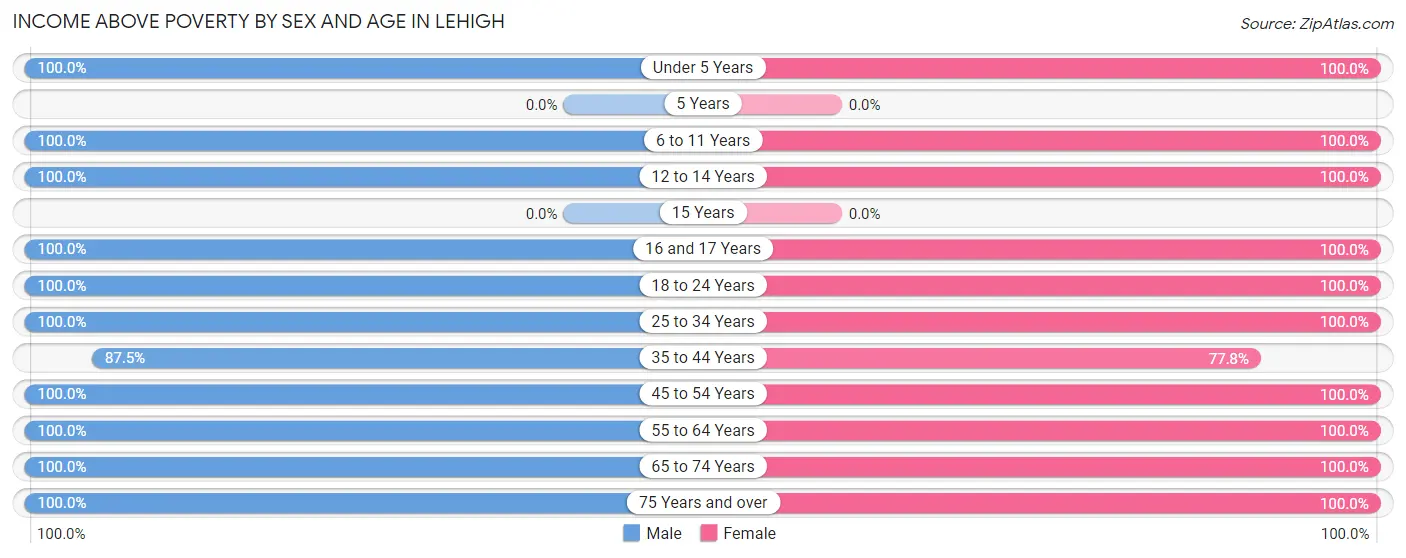
| Age Bracket | Male | Female |
| Under 5 Years | 6 (100.0%) | 1 (100.0%) |
| 5 Years | 0 (0.0%) | 0 (0.0%) |
| 6 to 11 Years | 15 (100.0%) | 13 (100.0%) |
| 12 to 14 Years | 14 (100.0%) | 1 (100.0%) |
| 15 Years | 0 (0.0%) | 0 (0.0%) |
| 16 and 17 Years | 1 (100.0%) | 1 (100.0%) |
| 18 to 24 Years | 9 (100.0%) | 2 (100.0%) |
| 25 to 34 Years | 21 (100.0%) | 15 (100.0%) |
| 35 to 44 Years | 7 (87.5%) | 7 (77.8%) |
| 45 to 54 Years | 13 (100.0%) | 12 (100.0%) |
| 55 to 64 Years | 14 (100.0%) | 1 (100.0%) |
| 65 to 74 Years | 22 (100.0%) | 15 (100.0%) |
| 75 Years and over | 2 (100.0%) | 1 (100.0%) |
| Total | 124 (99.2%) | 69 (97.2%) |
Income Below Poverty Among Married-Couple Families in Lehigh
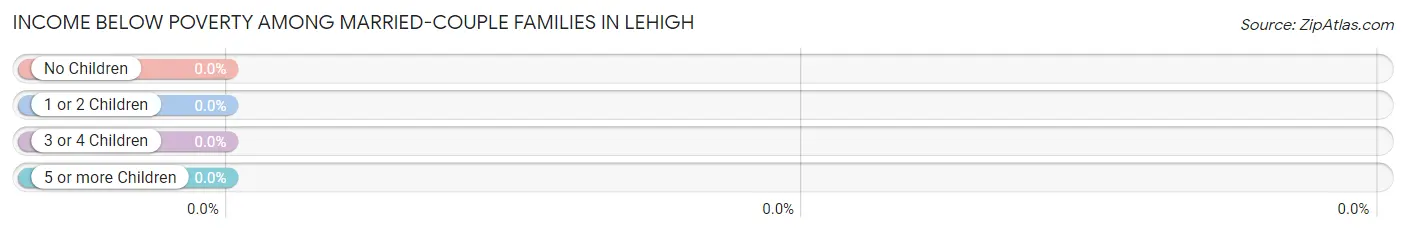
| Children | Above Poverty | Below Poverty |
| No Children | 26 (100.0%) | 0 (0.0%) |
| 1 or 2 Children | 18 (100.0%) | 0 (0.0%) |
| 3 or 4 Children | 7 (100.0%) | 0 (0.0%) |
| 5 or more Children | 3 (100.0%) | 0 (0.0%) |
| Total | 54 (100.0%) | 0 (0.0%) |
Income Below Poverty Among Single-Parent Households in Lehigh
| Children | Single Father | Single Mother |
| No Children | 0 (0.0%) | 0 (0.0%) |
| 1 or 2 Children | 0 (0.0%) | 0 (0.0%) |
| 3 or 4 Children | 0 (0.0%) | 0 (0.0%) |
| 5 or more Children | 0 (0.0%) | 0 (0.0%) |
| Total | 0 (0.0%) | 0 (0.0%) |
Income Below Poverty Among Married-Couple vs Single-Parent Households in Lehigh
| Children | Married-Couple Families | Single-Parent Households |
| No Children | 0 (0.0%) | 0 (0.0%) |
| 1 or 2 Children | 0 (0.0%) | 0 (0.0%) |
| 3 or 4 Children | 0 (0.0%) | 0 (0.0%) |
| 5 or more Children | 0 (0.0%) | 0 (0.0%) |
| Total | 0 (0.0%) | 0 (0.0%) |
Race in Lehigh
The most populous races in Lehigh are White / Caucasian (192 | 98.0%), and Black / African American (4 | 2.0%).
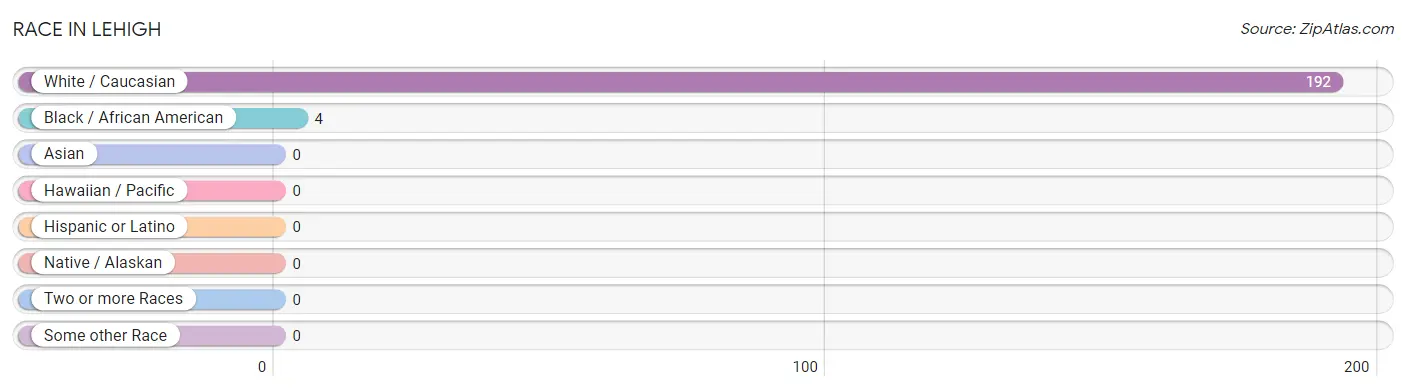
| Race | # Population | % Population |
| Asian | 0 | 0.0% |
| Black / African American | 4 | 2.0% |
| Hawaiian / Pacific | 0 | 0.0% |
| Hispanic or Latino | 0 | 0.0% |
| Native / Alaskan | 0 | 0.0% |
| White / Caucasian | 192 | 98.0% |
| Two or more Races | 0 | 0.0% |
| Some other Race | 0 | 0.0% |
| Total | 196 | 100.0% |
Ancestry in Lehigh
The most populous ancestries reported in Lehigh are German (66 | 33.7%), Irish (26 | 13.3%), Czech (17 | 8.7%), Scandinavian (17 | 8.7%), and English (13 | 6.6%), together accounting for 70.9% of all Lehigh residents.
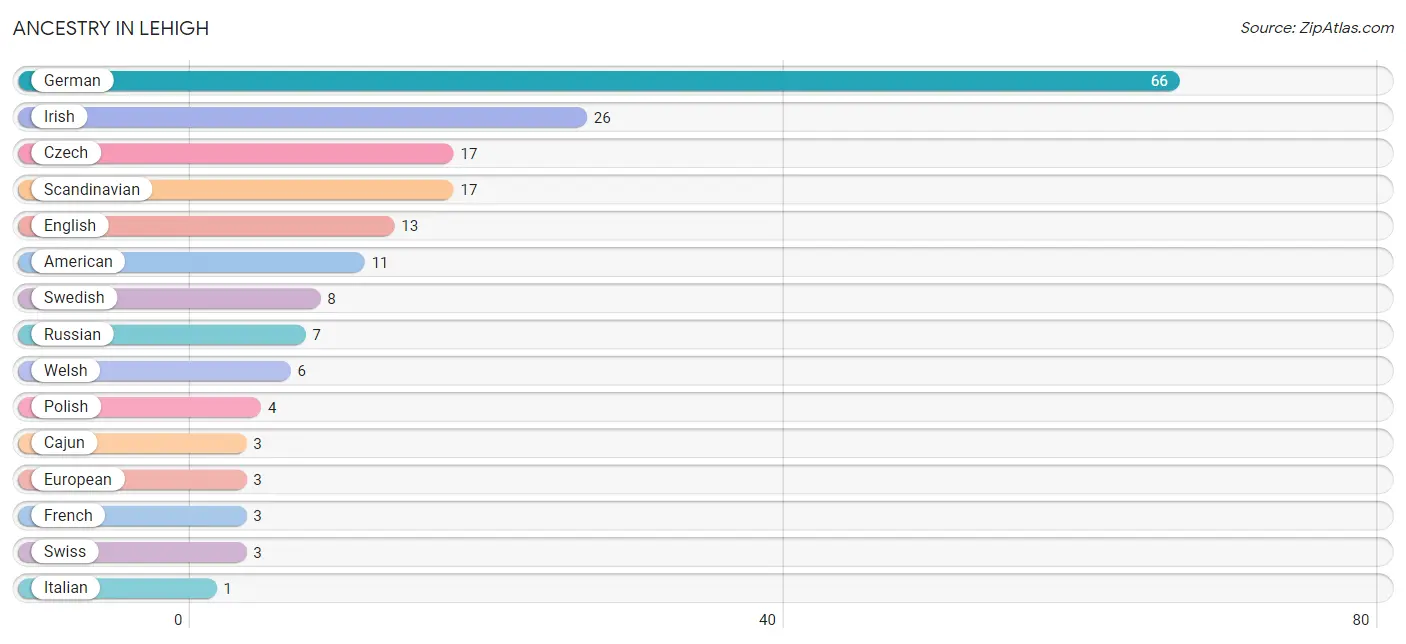
| Ancestry | # Population | % Population |
| American | 11 | 5.6% |
| Cajun | 3 | 1.5% |
| Czech | 17 | 8.7% |
| English | 13 | 6.6% |
| European | 3 | 1.5% |
| French | 3 | 1.5% |
| German | 66 | 33.7% |
| Irish | 26 | 13.3% |
| Italian | 1 | 0.5% |
| Polish | 4 | 2.0% |
| Russian | 7 | 3.6% |
| Scandinavian | 17 | 8.7% |
| Swedish | 8 | 4.1% |
| Swiss | 3 | 1.5% |
| Welsh | 6 | 3.1% | View All 15 Rows |
Immigrants in Lehigh

| Immigration Origin | # Population | % Population | View All 0 Rows |
Sex and Age in Lehigh
Sex and Age in Lehigh
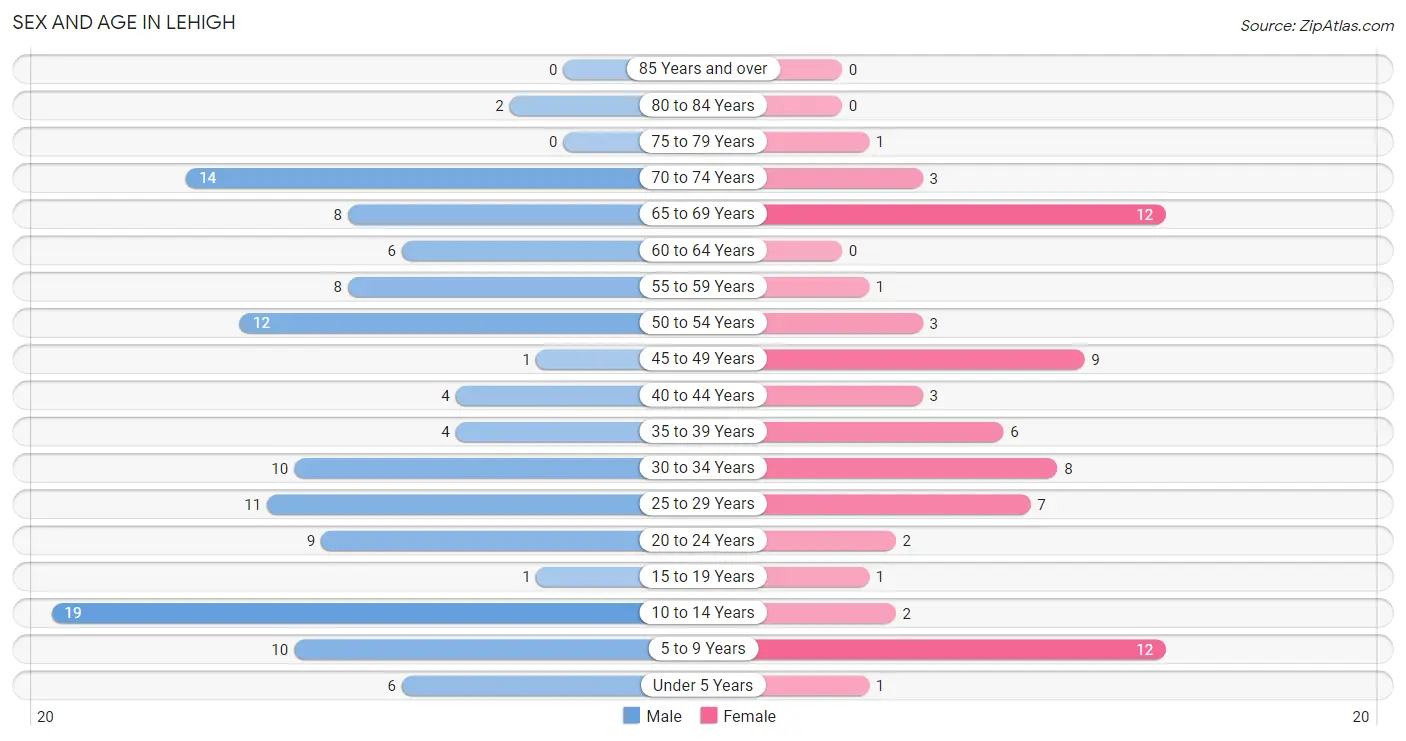
The most populous age groups in Lehigh are 10 to 14 Years (19 | 15.2%) for men and 5 to 9 Years (12 | 16.9%) for women.
| Age Bracket | Male | Female |
| Under 5 Years | 6 (4.8%) | 1 (1.4%) |
| 5 to 9 Years | 10 (8.0%) | 12 (16.9%) |
| 10 to 14 Years | 19 (15.2%) | 2 (2.8%) |
| 15 to 19 Years | 1 (0.8%) | 1 (1.4%) |
| 20 to 24 Years | 9 (7.2%) | 2 (2.8%) |
| 25 to 29 Years | 11 (8.8%) | 7 (9.9%) |
| 30 to 34 Years | 10 (8.0%) | 8 (11.3%) |
| 35 to 39 Years | 4 (3.2%) | 6 (8.5%) |
| 40 to 44 Years | 4 (3.2%) | 3 (4.2%) |
| 45 to 49 Years | 1 (0.8%) | 9 (12.7%) |
| 50 to 54 Years | 12 (9.6%) | 3 (4.2%) |
| 55 to 59 Years | 8 (6.4%) | 1 (1.4%) |
| 60 to 64 Years | 6 (4.8%) | 0 (0.0%) |
| 65 to 69 Years | 8 (6.4%) | 12 (16.9%) |
| 70 to 74 Years | 14 (11.2%) | 3 (4.2%) |
| 75 to 79 Years | 0 (0.0%) | 1 (1.4%) |
| 80 to 84 Years | 2 (1.6%) | 0 (0.0%) |
| 85 Years and over | 0 (0.0%) | 0 (0.0%) |
| Total | 125 (100.0%) | 71 (100.0%) |
Families and Households in Lehigh
Median Family Size in Lehigh
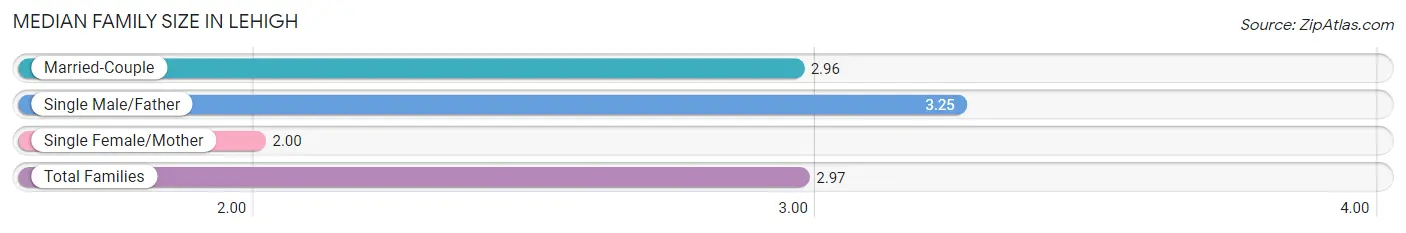
The median family size in Lehigh is 2.97 persons per family, with single male/father families (4 | 6.8%) accounting for the largest median family size of 3.25 persons per family. On the other hand, single female/mother families (1 | 1.7%) represent the smallest median family size with 2.00 persons per family.
| Family Type | # Families | Family Size |
| Married-Couple | 54 (91.5%) | 2.96 |
| Single Male/Father | 4 (6.8%) | 3.25 |
| Single Female/Mother | 1 (1.7%) | 2.00 |
| Total Families | 59 (100.0%) | 2.97 |
Median Household Size in Lehigh
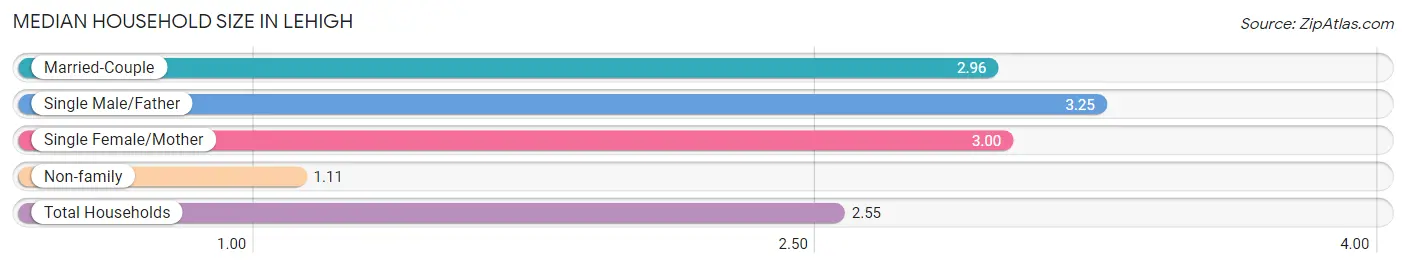
The median household size in Lehigh is 2.55 persons per household, with single male/father households (4 | 5.2%) accounting for the largest median household size of 3.25 persons per household. non-family households (18 | 23.4%) represent the smallest median household size with 1.11 persons per household.
| Household Type | # Households | Household Size |
| Married-Couple | 54 (70.1%) | 2.96 |
| Single Male/Father | 4 (5.2%) | 3.25 |
| Single Female/Mother | 1 (1.3%) | 3.00 |
| Non-family | 18 (23.4%) | 1.11 |
| Total Households | 77 (100.0%) | 2.55 |
Household Size by Marriage Status in Lehigh
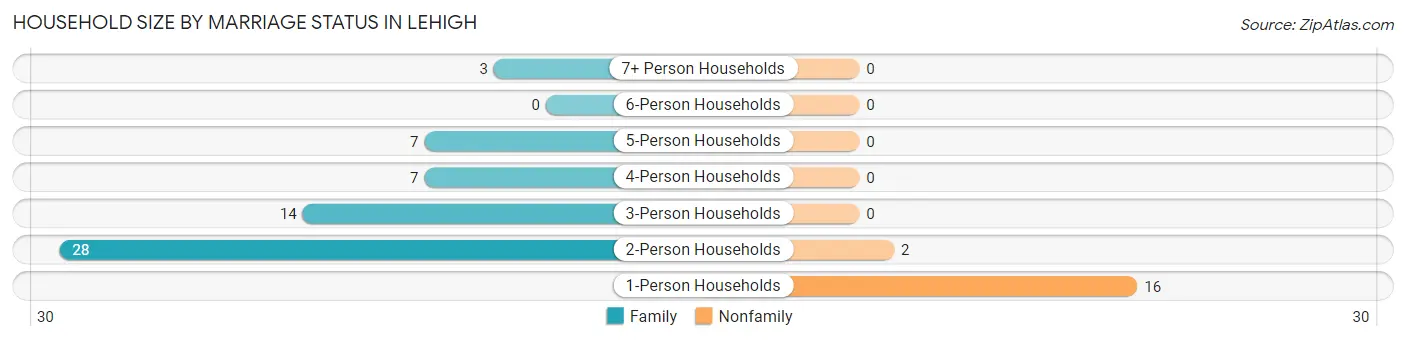
Out of a total of 77 households in Lehigh, 59 (76.6%) are family households, while 18 (23.4%) are nonfamily households. The most numerous type of family households are 2-person households, comprising 28, and the most common type of nonfamily households are 1-person households, comprising 16.
| Household Size | Family Households | Nonfamily Households |
| 1-Person Households | - | 16 (20.8%) |
| 2-Person Households | 28 (36.4%) | 2 (2.6%) |
| 3-Person Households | 14 (18.2%) | 0 (0.0%) |
| 4-Person Households | 7 (9.1%) | 0 (0.0%) |
| 5-Person Households | 7 (9.1%) | 0 (0.0%) |
| 6-Person Households | 0 (0.0%) | 0 (0.0%) |
| 7+ Person Households | 3 (3.9%) | 0 (0.0%) |
| Total | 59 (76.6%) | 18 (23.4%) |
Female Fertility in Lehigh
Fertility by Age in Lehigh
Average fertility rate in Lehigh is 167.0 births per 1,000 women. Women in the age bracket of 20 to 34 years have the highest fertility rate with 353.0 births per 1,000 women. Women in the age bracket of 20 to 34 years acount for 100.0% of all women with births.
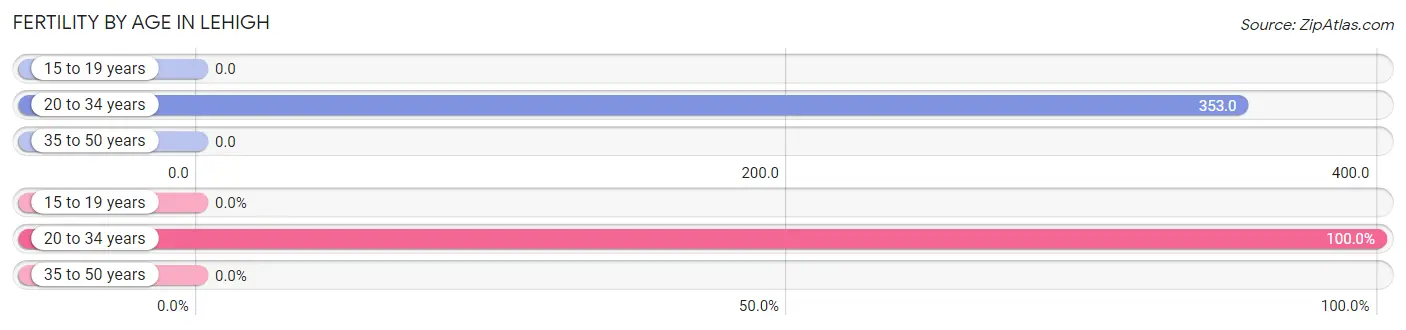
| Age Bracket | Women with Births | Births / 1,000 Women |
| 15 to 19 years | 0 (0.0%) | 0.0 |
| 20 to 34 years | 6 (100.0%) | 353.0 |
| 35 to 50 years | 0 (0.0%) | 0.0 |
| Total | 6 (100.0%) | 167.0 |
Fertility by Age by Marriage Status in Lehigh
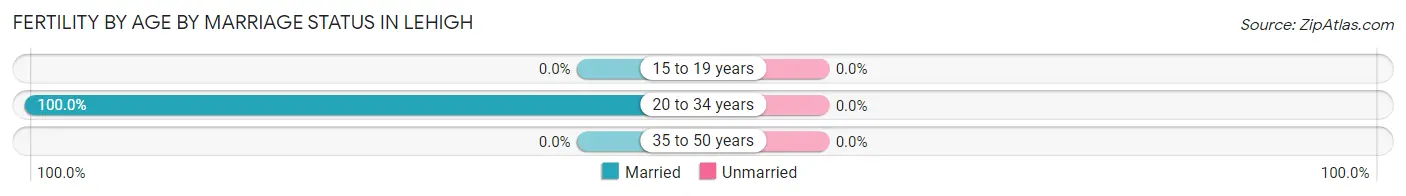
| Age Bracket | Married | Unmarried |
| 15 to 19 years | 0 (0.0%) | 0 (0.0%) |
| 20 to 34 years | 6 (100.0%) | 0 (0.0%) |
| 35 to 50 years | 0 (0.0%) | 0 (0.0%) |
| Total | 6 (100.0%) | 0 (0.0%) |
Fertility by Education in Lehigh
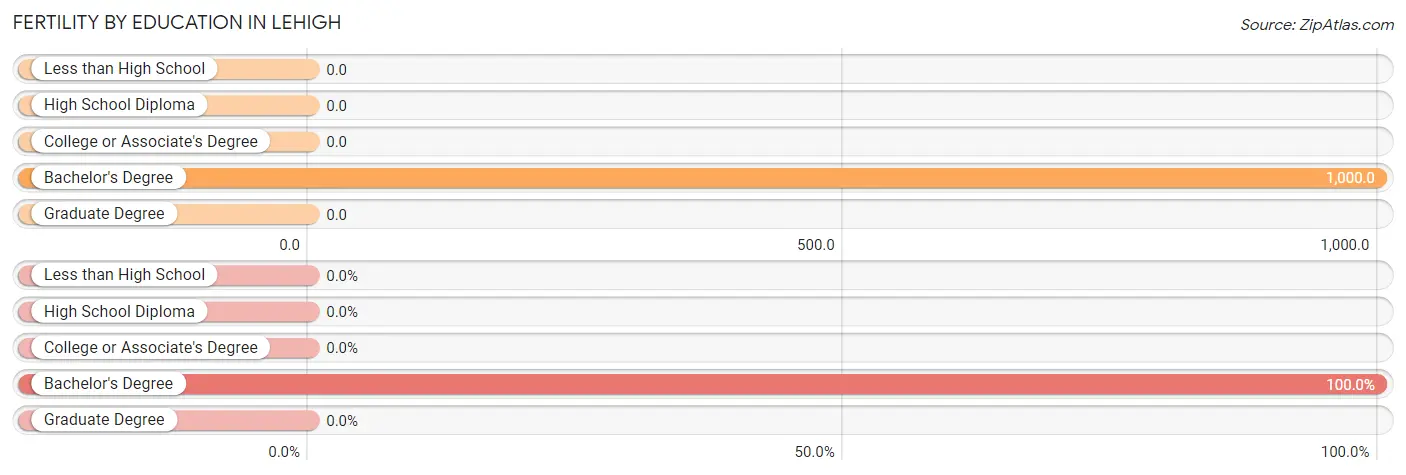
| Educational Attainment | Women with Births | Births / 1,000 Women |
| Less than High School | 0 (0.0%) | 0.0 |
| High School Diploma | 0 (0.0%) | 0.0 |
| College or Associate's Degree | 0 (0.0%) | 0.0 |
| Bachelor's Degree | 6 (100.0%) | 1,000.0 |
| Graduate Degree | 0 (0.0%) | 0.0 |
| Total | 6 (100.0%) | 167.0 |
Fertility by Education by Marriage Status in Lehigh
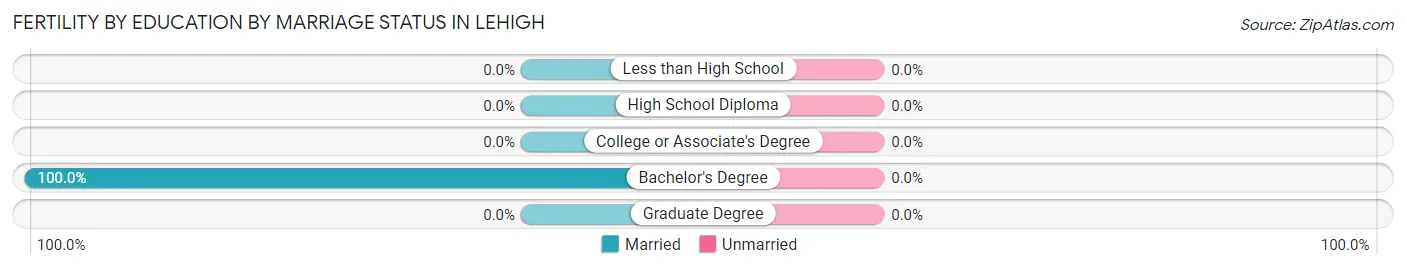
| Educational Attainment | Married | Unmarried |
| Less than High School | 0 (0.0%) | 0 (0.0%) |
| High School Diploma | 0 (0.0%) | 0 (0.0%) |
| College or Associate's Degree | 0 (0.0%) | 0 (0.0%) |
| Bachelor's Degree | 6 (100.0%) | 0 (0.0%) |
| Graduate Degree | 0 (0.0%) | 0 (0.0%) |
| Total | 6 (100.0%) | 0 (0.0%) |
Employment Characteristics in Lehigh
Employment by Class of Employer in Lehigh
Among the 98 employed individuals in Lehigh, private company employees (43 | 43.9%), not-for-profit organizations (20 | 20.4%), and local government employees (19 | 19.4%) make up the most common classes of employment.
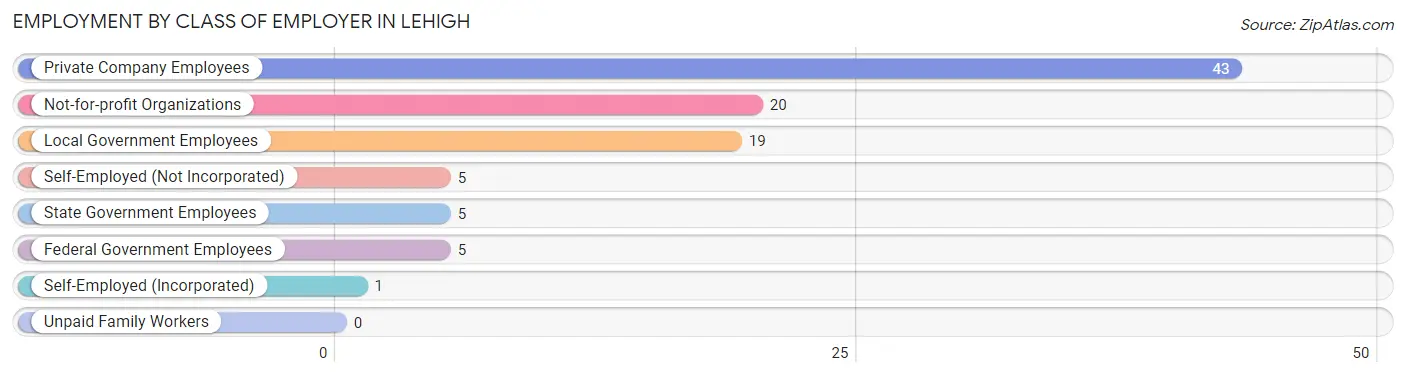
| Employer Class | # Employees | % Employees |
| Private Company Employees | 43 | 43.9% |
| Self-Employed (Incorporated) | 1 | 1.0% |
| Self-Employed (Not Incorporated) | 5 | 5.1% |
| Not-for-profit Organizations | 20 | 20.4% |
| Local Government Employees | 19 | 19.4% |
| State Government Employees | 5 | 5.1% |
| Federal Government Employees | 5 | 5.1% |
| Unpaid Family Workers | 0 | 0.0% |
| Total | 98 | 100.0% |
Employment Status by Age in Lehigh
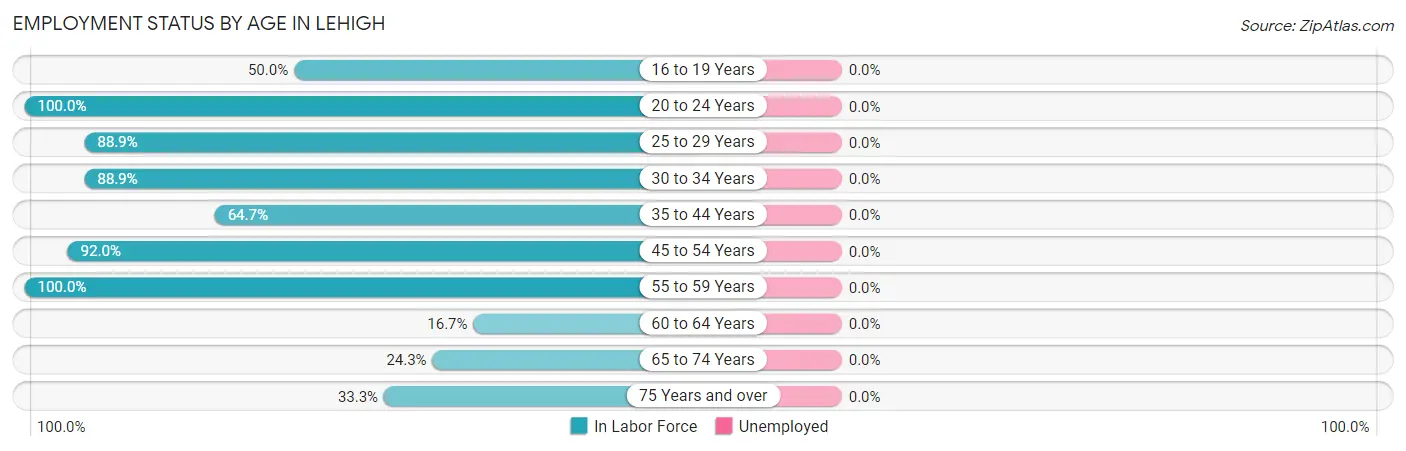
| Age Bracket | In Labor Force | Unemployed |
| 16 to 19 Years | 1 (50.0%) | 0 (0.0%) |
| 20 to 24 Years | 11 (100.0%) | 0 (0.0%) |
| 25 to 29 Years | 16 (88.9%) | 0 (0.0%) |
| 30 to 34 Years | 16 (88.9%) | 0 (0.0%) |
| 35 to 44 Years | 11 (64.7%) | 0 (0.0%) |
| 45 to 54 Years | 23 (92.0%) | 0 (0.0%) |
| 55 to 59 Years | 9 (100.0%) | 0 (0.0%) |
| 60 to 64 Years | 1 (16.7%) | 0 (0.0%) |
| 65 to 74 Years | 9 (24.3%) | 0 (0.0%) |
| 75 Years and over | 1 (33.3%) | 0 (0.0%) |
| Total | 98 (67.1%) | 0 (0.0%) |
Employment Status by Educational Attainment in Lehigh
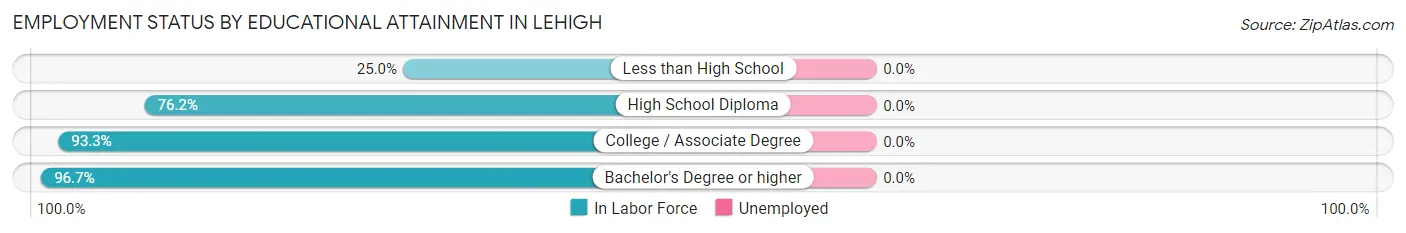
| Educational Attainment | In Labor Force | Unemployed |
| Less than High School | 3 (25.0%) | 0 (0.0%) |
| High School Diploma | 16 (76.2%) | 0 (0.0%) |
| College / Associate Degree | 28 (93.3%) | 0 (0.0%) |
| Bachelor's Degree or higher | 29 (96.7%) | 0 (0.0%) |
| Total | 76 (81.7%) | 0 (0.0%) |
Employment Occupations by Sex in Lehigh
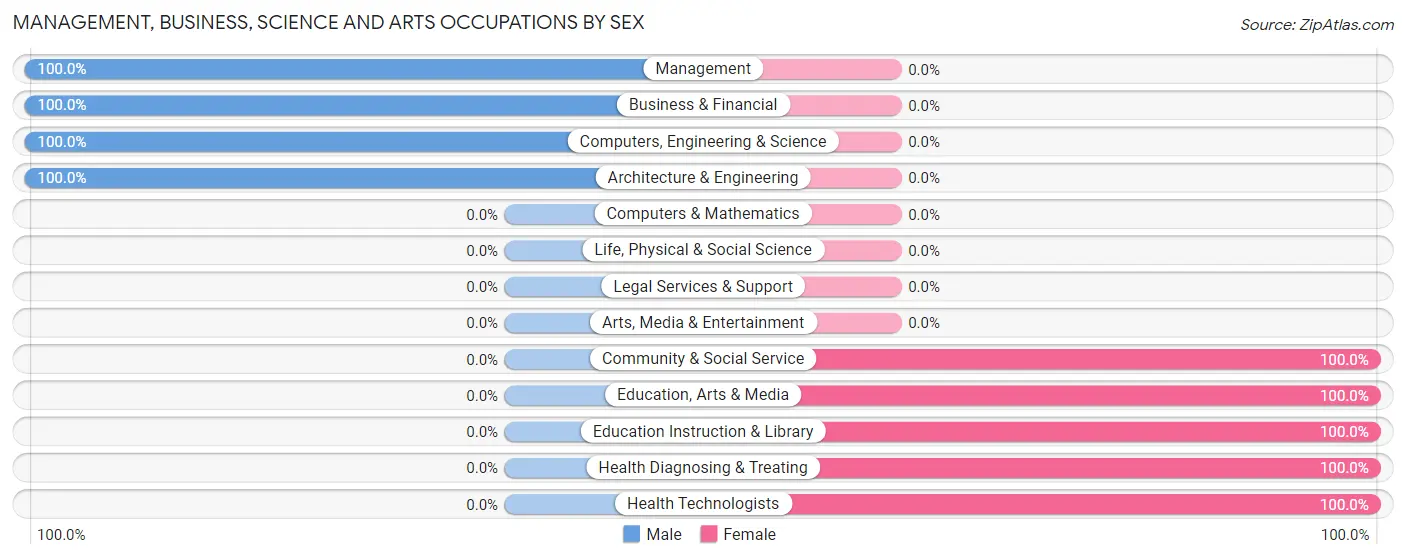
Management, Business, Science and Arts Occupations
The most common Management, Business, Science and Arts occupations in Lehigh are Community & Social Service (22 | 22.5%), Education Instruction & Library (18 | 18.4%), Business & Financial (11 | 11.2%), Management (10 | 10.2%), and Education, Arts & Media (4 | 4.1%).
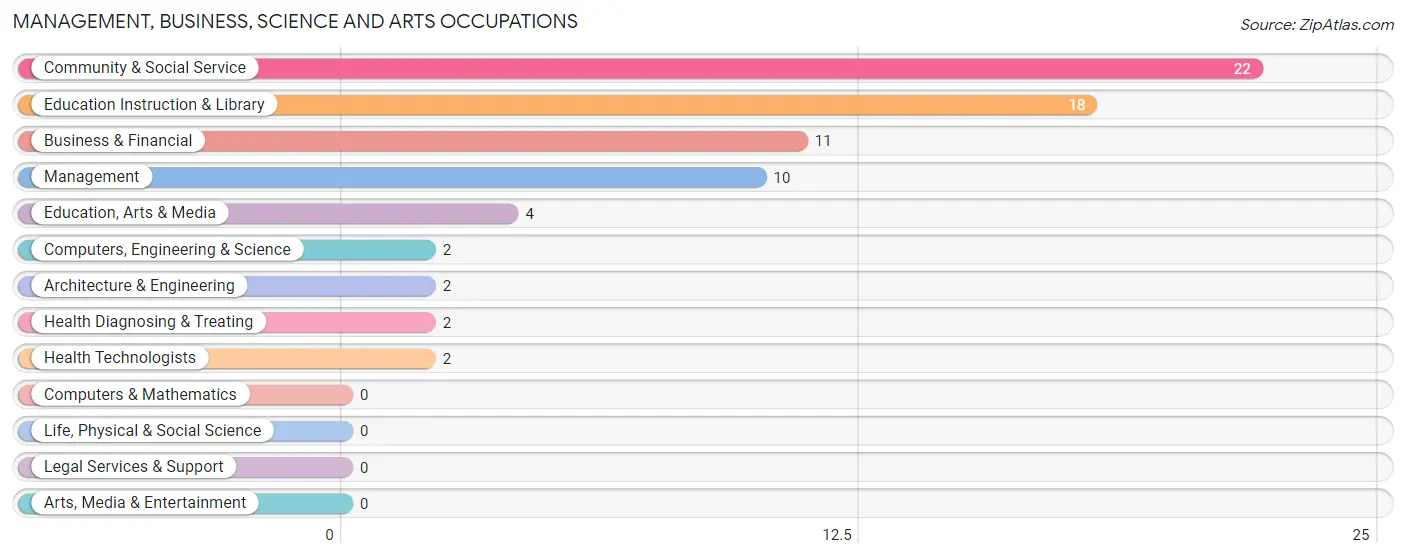
Management, Business, Science and Arts Occupations by Sex
Within the Management, Business, Science and Arts occupations in Lehigh, the most male-oriented occupations are Management (100.0%), Business & Financial (100.0%), and Computers, Engineering & Science (100.0%), while the most female-oriented occupations are Community & Social Service (100.0%), Education, Arts & Media (100.0%), and Education Instruction & Library (100.0%).
| Occupation | Male | Female |
| Management | 10 (100.0%) | 0 (0.0%) |
| Business & Financial | 11 (100.0%) | 0 (0.0%) |
| Computers, Engineering & Science | 2 (100.0%) | 0 (0.0%) |
| Computers & Mathematics | 0 (0.0%) | 0 (0.0%) |
| Architecture & Engineering | 2 (100.0%) | 0 (0.0%) |
| Life, Physical & Social Science | 0 (0.0%) | 0 (0.0%) |
| Community & Social Service | 0 (0.0%) | 22 (100.0%) |
| Education, Arts & Media | 0 (0.0%) | 4 (100.0%) |
| Legal Services & Support | 0 (0.0%) | 0 (0.0%) |
| Education Instruction & Library | 0 (0.0%) | 18 (100.0%) |
| Arts, Media & Entertainment | 0 (0.0%) | 0 (0.0%) |
| Health Diagnosing & Treating | 0 (0.0%) | 2 (100.0%) |
| Health Technologists | 0 (0.0%) | 2 (100.0%) |
| Total (Category) | 23 (48.9%) | 24 (51.1%) |
| Total (Overall) | 66 (67.3%) | 32 (32.7%) |
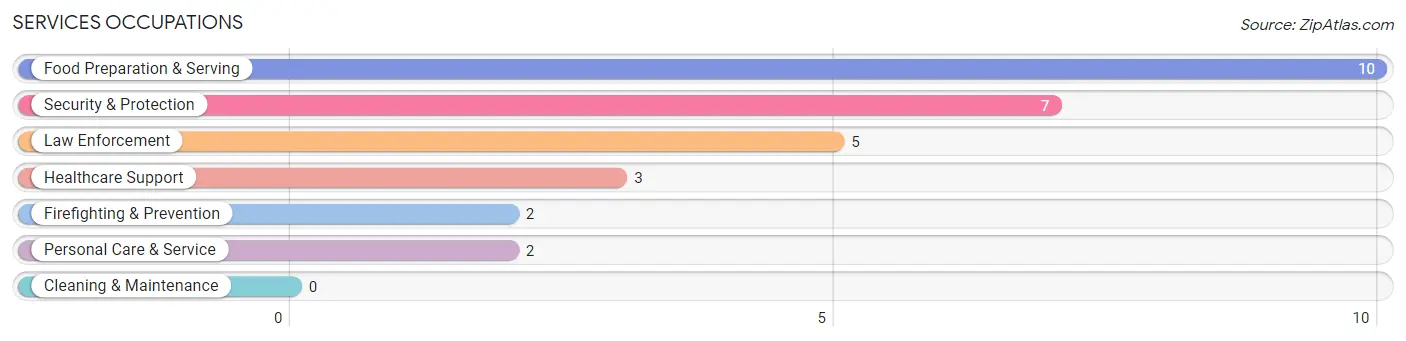
Services Occupations
The most common Services occupations in Lehigh are Food Preparation & Serving (10 | 10.2%), Security & Protection (7 | 7.1%), Law Enforcement (5 | 5.1%), Healthcare Support (3 | 3.1%), and Firefighting & Prevention (2 | 2.0%).
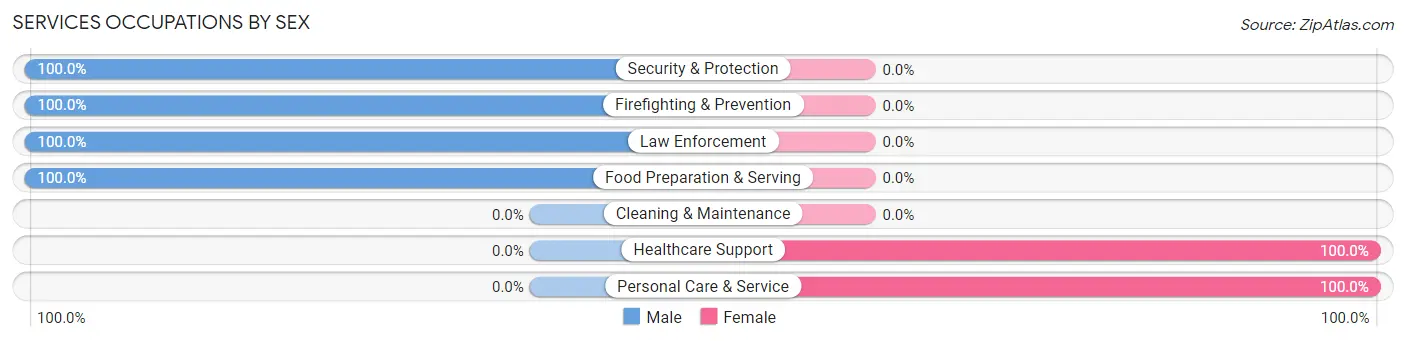
Services Occupations by Sex
Within the Services occupations in Lehigh, the most male-oriented occupations are Security & Protection (100.0%), Firefighting & Prevention (100.0%), and Law Enforcement (100.0%), while the most female-oriented occupations are Healthcare Support (100.0%), and Personal Care & Service (100.0%).
| Occupation | Male | Female |
| Healthcare Support | 0 (0.0%) | 3 (100.0%) |
| Security & Protection | 7 (100.0%) | 0 (0.0%) |
| Firefighting & Prevention | 2 (100.0%) | 0 (0.0%) |
| Law Enforcement | 5 (100.0%) | 0 (0.0%) |
| Food Preparation & Serving | 10 (100.0%) | 0 (0.0%) |
| Cleaning & Maintenance | 0 (0.0%) | 0 (0.0%) |
| Personal Care & Service | 0 (0.0%) | 2 (100.0%) |
| Total (Category) | 17 (77.3%) | 5 (22.7%) |
| Total (Overall) | 66 (67.3%) | 32 (32.7%) |
Sales and Office Occupations
The most common Sales and Office occupations in Lehigh are , and Office & Administration (1 | 1.0%).
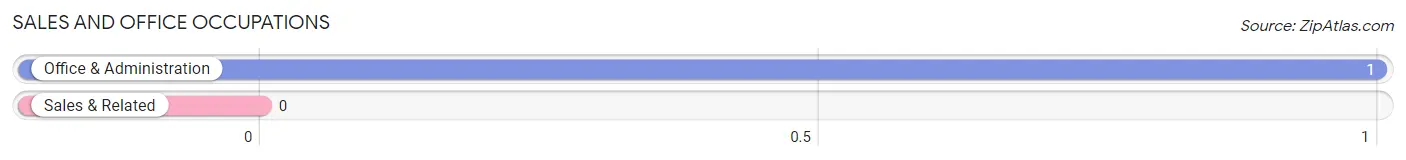
Sales and Office Occupations by Sex
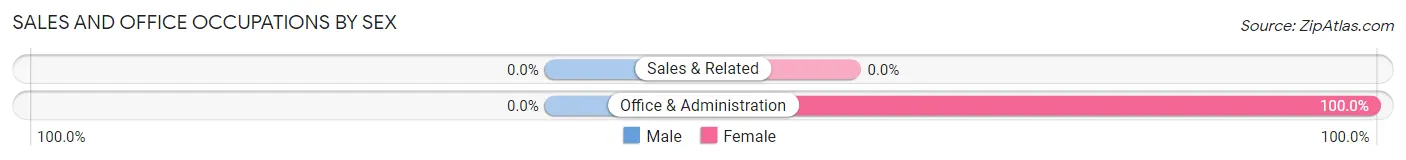
| Occupation | Male | Female |
| Sales & Related | 0 (0.0%) | 0 (0.0%) |
| Office & Administration | 0 (0.0%) | 1 (100.0%) |
| Total (Category) | 0 (0.0%) | 1 (100.0%) |
| Total (Overall) | 66 (67.3%) | 32 (32.7%) |
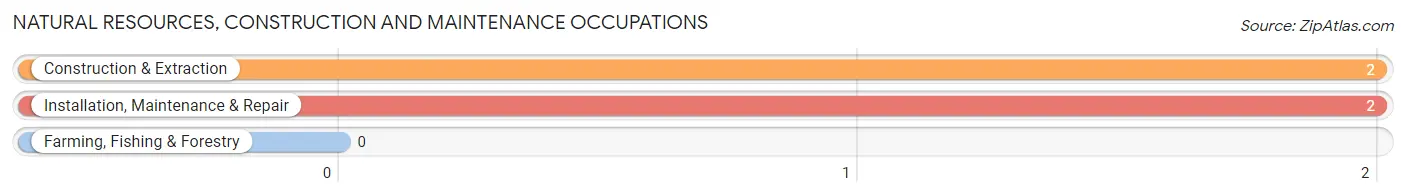
Natural Resources, Construction and Maintenance Occupations
The most common Natural Resources, Construction and Maintenance occupations in Lehigh are Construction & Extraction (2 | 2.0%), and Installation, Maintenance & Repair (2 | 2.0%).
Natural Resources, Construction and Maintenance Occupations by Sex
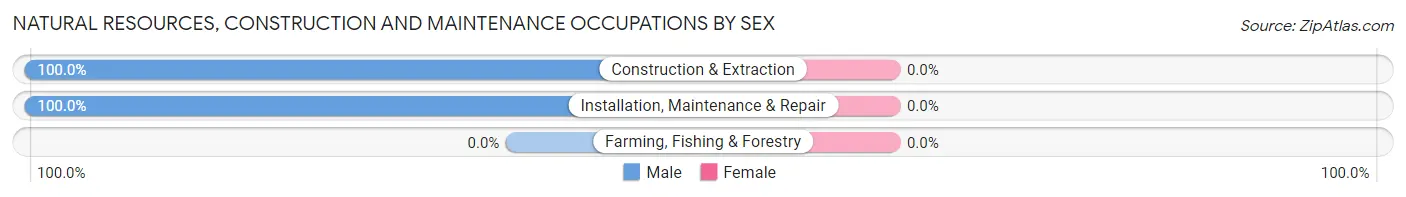
| Occupation | Male | Female |
| Farming, Fishing & Forestry | 0 (0.0%) | 0 (0.0%) |
| Construction & Extraction | 2 (100.0%) | 0 (0.0%) |
| Installation, Maintenance & Repair | 2 (100.0%) | 0 (0.0%) |
| Total (Category) | 4 (100.0%) | 0 (0.0%) |
| Total (Overall) | 66 (67.3%) | 32 (32.7%) |
Production, Transportation and Moving Occupations
The most common Production, Transportation and Moving occupations in Lehigh are Production (17 | 17.3%), and Material Moving (7 | 7.1%).
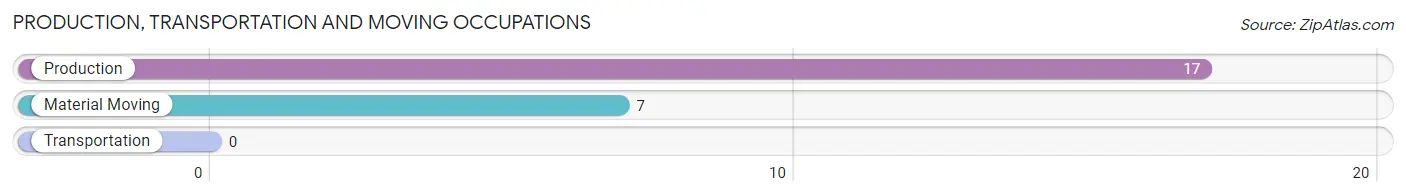
Production, Transportation and Moving Occupations by Sex
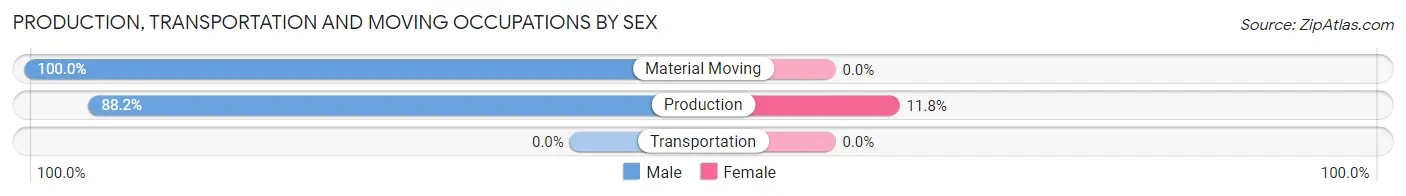
| Occupation | Male | Female |
| Production | 15 (88.2%) | 2 (11.8%) |
| Transportation | 0 (0.0%) | 0 (0.0%) |
| Material Moving | 7 (100.0%) | 0 (0.0%) |
| Total (Category) | 22 (91.7%) | 2 (8.3%) |
| Total (Overall) | 66 (67.3%) | 32 (32.7%) |
Employment Industries by Sex in Lehigh
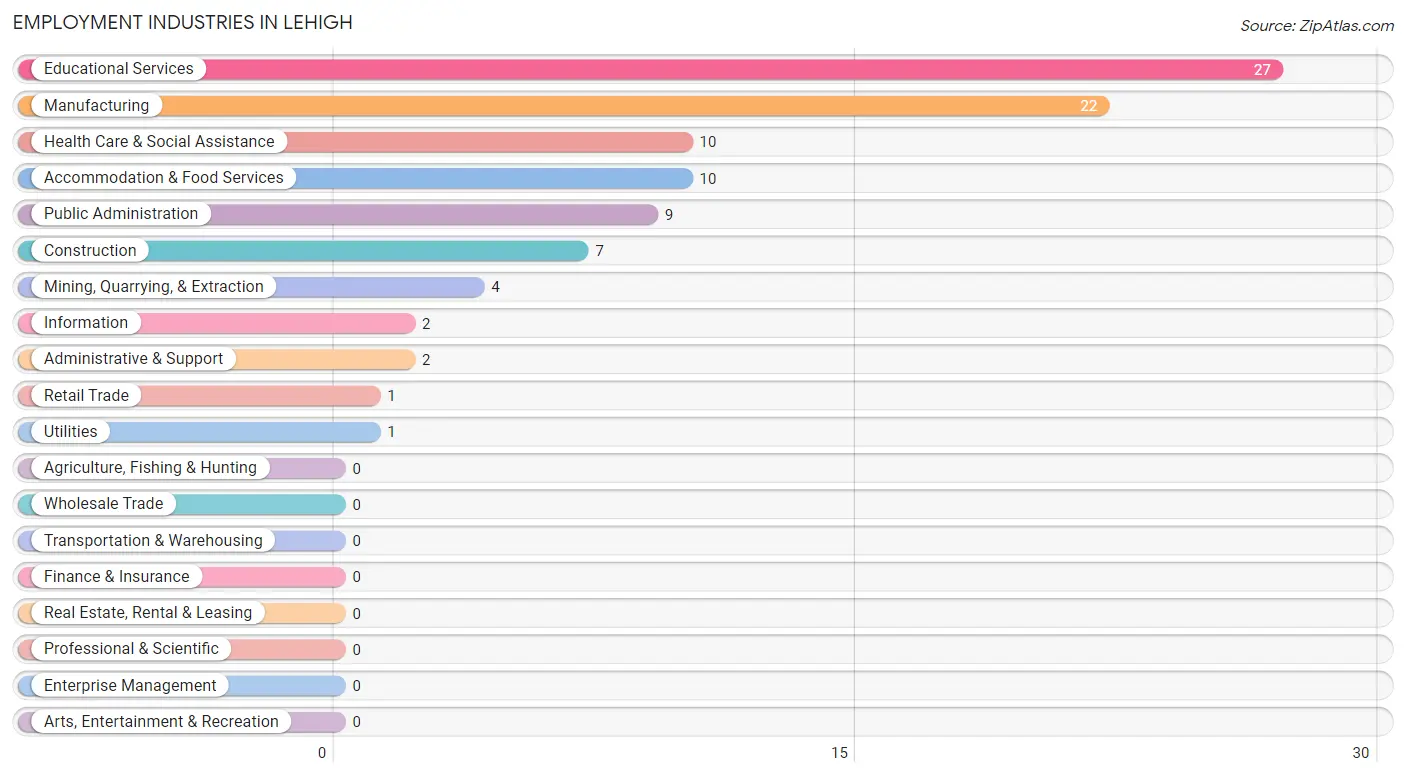
Employment Industries in Lehigh
The major employment industries in Lehigh include Educational Services (27 | 27.6%), Manufacturing (22 | 22.5%), Health Care & Social Assistance (10 | 10.2%), Accommodation & Food Services (10 | 10.2%), and Public Administration (9 | 9.2%).
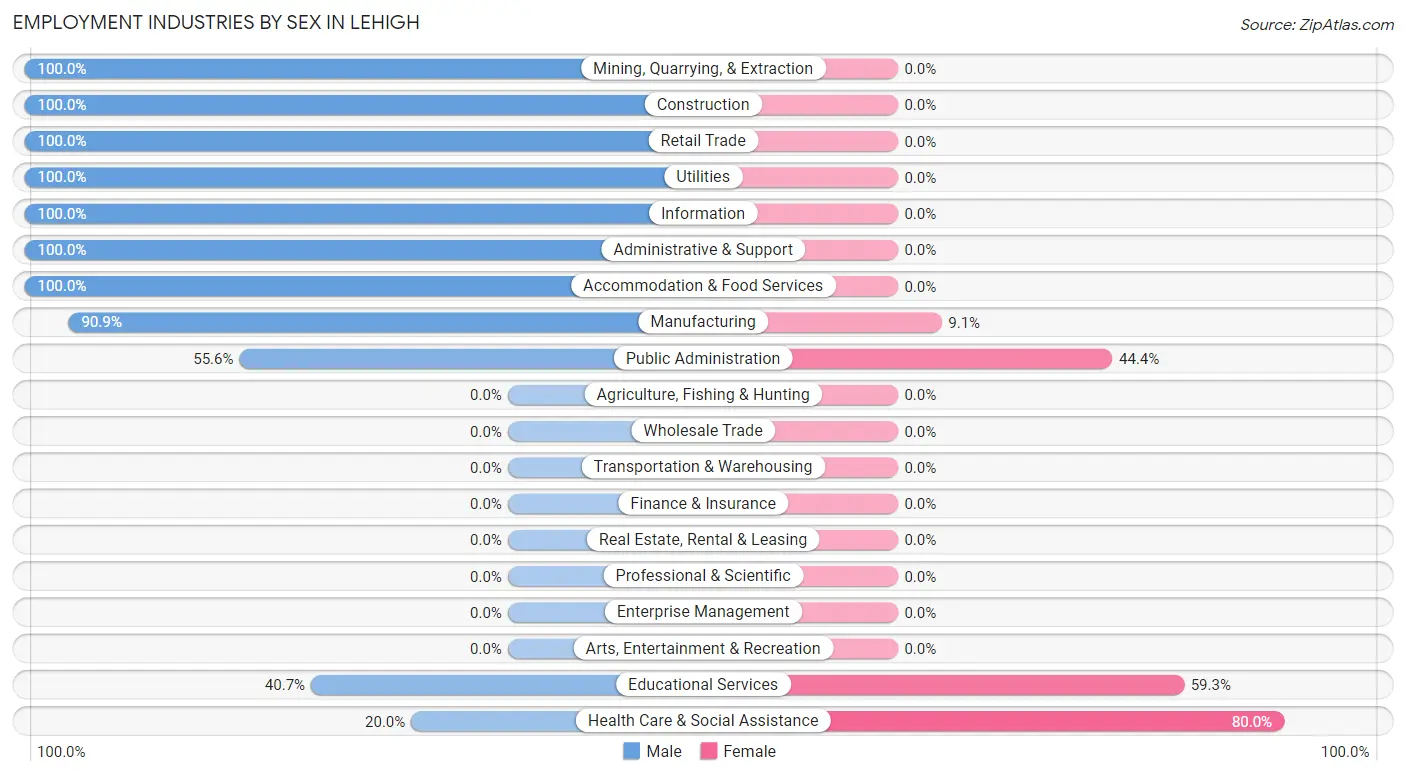
Employment Industries by Sex in Lehigh
The Lehigh industries that see more men than women are Mining, Quarrying, & Extraction (100.0%), Construction (100.0%), and Retail Trade (100.0%), whereas the industries that tend to have a higher number of women are Health Care & Social Assistance (80.0%), Educational Services (59.3%), and Public Administration (44.4%).
| Industry | Male | Female |
| Agriculture, Fishing & Hunting | 0 (0.0%) | 0 (0.0%) |
| Mining, Quarrying, & Extraction | 4 (100.0%) | 0 (0.0%) |
| Construction | 7 (100.0%) | 0 (0.0%) |
| Manufacturing | 20 (90.9%) | 2 (9.1%) |
| Wholesale Trade | 0 (0.0%) | 0 (0.0%) |
| Retail Trade | 1 (100.0%) | 0 (0.0%) |
| Transportation & Warehousing | 0 (0.0%) | 0 (0.0%) |
| Utilities | 1 (100.0%) | 0 (0.0%) |
| Information | 2 (100.0%) | 0 (0.0%) |
| Finance & Insurance | 0 (0.0%) | 0 (0.0%) |
| Real Estate, Rental & Leasing | 0 (0.0%) | 0 (0.0%) |
| Professional & Scientific | 0 (0.0%) | 0 (0.0%) |
| Enterprise Management | 0 (0.0%) | 0 (0.0%) |
| Administrative & Support | 2 (100.0%) | 0 (0.0%) |
| Educational Services | 11 (40.7%) | 16 (59.3%) |
| Health Care & Social Assistance | 2 (20.0%) | 8 (80.0%) |
| Arts, Entertainment & Recreation | 0 (0.0%) | 0 (0.0%) |
| Accommodation & Food Services | 10 (100.0%) | 0 (0.0%) |
| Public Administration | 5 (55.6%) | 4 (44.4%) |
| Total | 66 (67.3%) | 32 (32.7%) |
Education in Lehigh
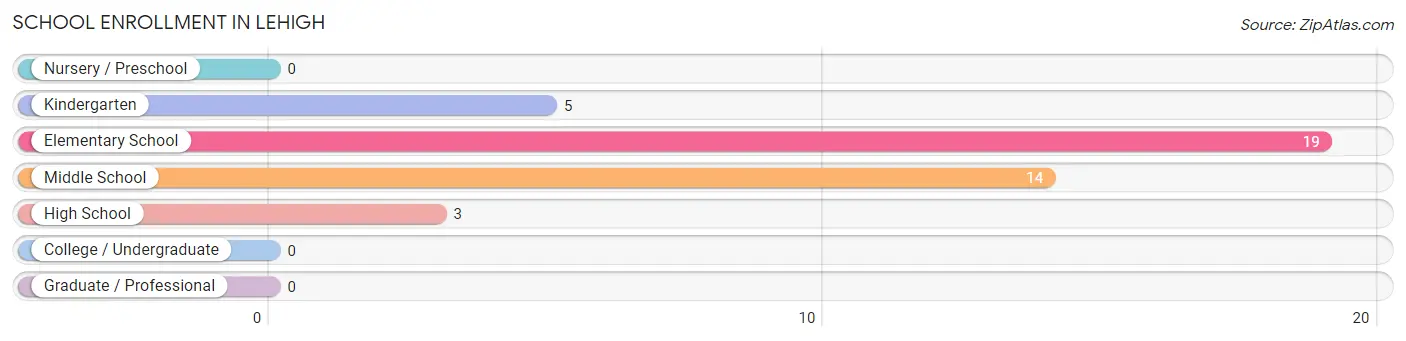
School Enrollment in Lehigh
The most common levels of schooling among the 41 students in Lehigh are elementary school (19 | 46.3%), middle school (14 | 34.2%), and kindergarten (5 | 12.2%).
| School Level | # Students | % Students |
| Nursery / Preschool | 0 | 0.0% |
| Kindergarten | 5 | 12.2% |
| Elementary School | 19 | 46.3% |
| Middle School | 14 | 34.2% |
| High School | 3 | 7.3% |
| College / Undergraduate | 0 | 0.0% |
| Graduate / Professional | 0 | 0.0% |
| Total | 41 | 100.0% |
School Enrollment by Age by Funding Source in Lehigh
Out of a total of 41 students who are enrolled in schools in Lehigh, 14 (34.1%) attend a private institution, while the remaining 27 (65.9%) are enrolled in public schools. The age group of 5 to 9 year old has the highest likelihood of being enrolled in private schools, with 13 (59.1% in the age bracket) enrolled. Conversely, the age group of 15 to 17 year olds has the lowest likelihood of being enrolled in a private school, with 2 (100.0% in the age bracket) attending a public institution.
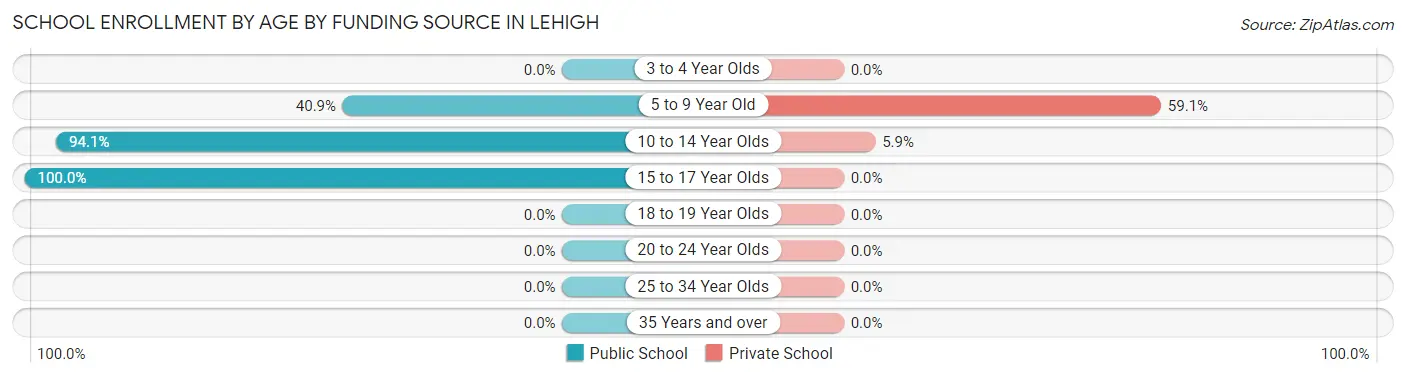
| Age Bracket | Public School | Private School |
| 3 to 4 Year Olds | 0 (0.0%) | 0 (0.0%) |
| 5 to 9 Year Old | 9 (40.9%) | 13 (59.1%) |
| 10 to 14 Year Olds | 16 (94.1%) | 1 (5.9%) |
| 15 to 17 Year Olds | 2 (100.0%) | 0 (0.0%) |
| 18 to 19 Year Olds | 0 (0.0%) | 0 (0.0%) |
| 20 to 24 Year Olds | 0 (0.0%) | 0 (0.0%) |
| 25 to 34 Year Olds | 0 (0.0%) | 0 (0.0%) |
| 35 Years and over | 0 (0.0%) | 0 (0.0%) |
| Total | 27 (65.9%) | 14 (34.1%) |
Educational Attainment by Field of Study in Lehigh
Liberal arts & history (17 | 46.0%), education (9 | 24.3%), bio, nature & agricultural (5 | 13.5%), arts & humanities (3 | 8.1%), and computers & mathematics (2 | 5.4%) are the most common fields of study among 37 individuals in Lehigh who have obtained a bachelor's degree or higher.
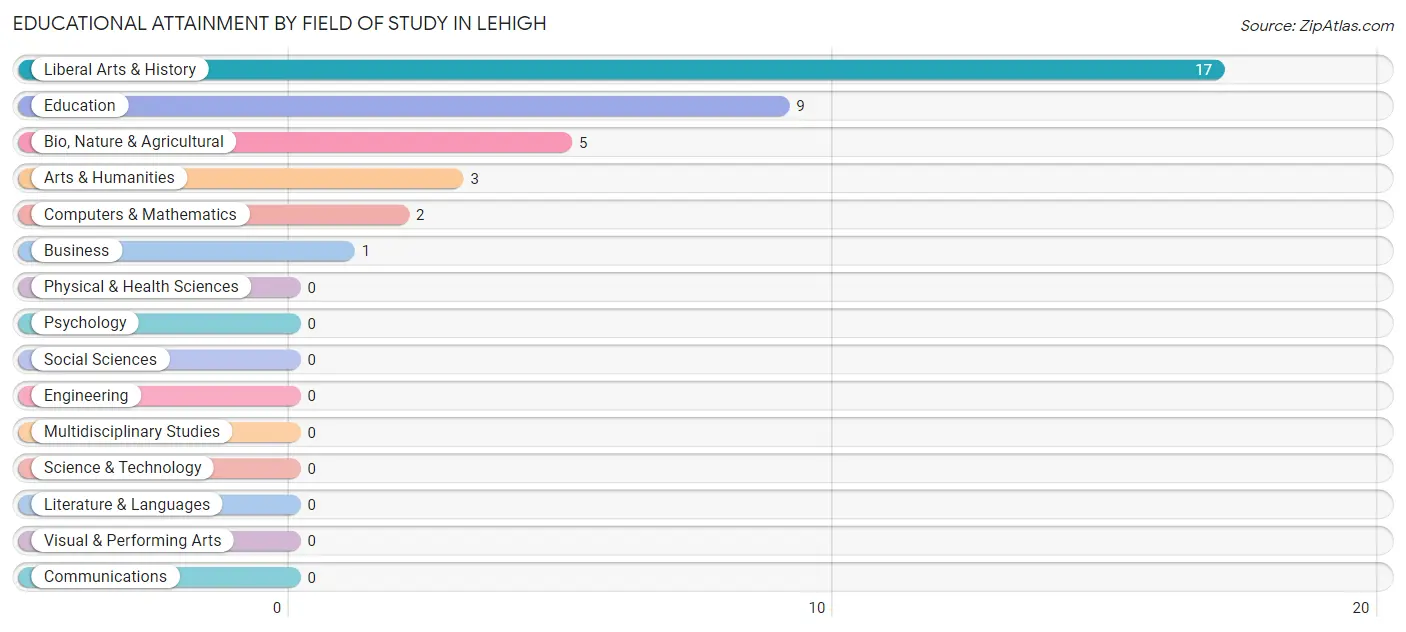
| Field of Study | # Graduates | % Graduates |
| Computers & Mathematics | 2 | 5.4% |
| Bio, Nature & Agricultural | 5 | 13.5% |
| Physical & Health Sciences | 0 | 0.0% |
| Psychology | 0 | 0.0% |
| Social Sciences | 0 | 0.0% |
| Engineering | 0 | 0.0% |
| Multidisciplinary Studies | 0 | 0.0% |
| Science & Technology | 0 | 0.0% |
| Business | 1 | 2.7% |
| Education | 9 | 24.3% |
| Literature & Languages | 0 | 0.0% |
| Liberal Arts & History | 17 | 46.0% |
| Visual & Performing Arts | 0 | 0.0% |
| Communications | 0 | 0.0% |
| Arts & Humanities | 3 | 8.1% |
| Total | 37 | 100.0% |
Transportation & Commute in Lehigh
Vehicle Availability by Sex in Lehigh
The most prevalent vehicle ownership categories in Lehigh are males with 1 vehicle (25, accounting for 37.9%) and females with 1 vehicle (8, making up 78.1%).
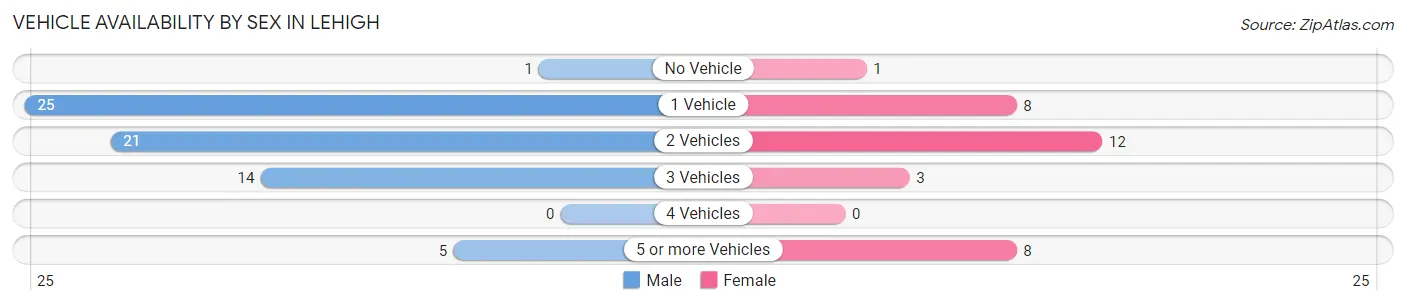
| Vehicles Available | Male | Female |
| No Vehicle | 1 (1.5%) | 1 (3.1%) |
| 1 Vehicle | 25 (37.9%) | 8 (25.0%) |
| 2 Vehicles | 21 (31.8%) | 12 (37.5%) |
| 3 Vehicles | 14 (21.2%) | 3 (9.4%) |
| 4 Vehicles | 0 (0.0%) | 0 (0.0%) |
| 5 or more Vehicles | 5 (7.6%) | 8 (25.0%) |
| Total | 66 (100.0%) | 32 (100.0%) |
Commute Time in Lehigh
The most frequently occuring commute durations in Lehigh are 15 to 19 minutes (27 commuters, 27.8%), 30 to 34 minutes (19 commuters, 19.6%), and 20 to 24 minutes (13 commuters, 13.4%).
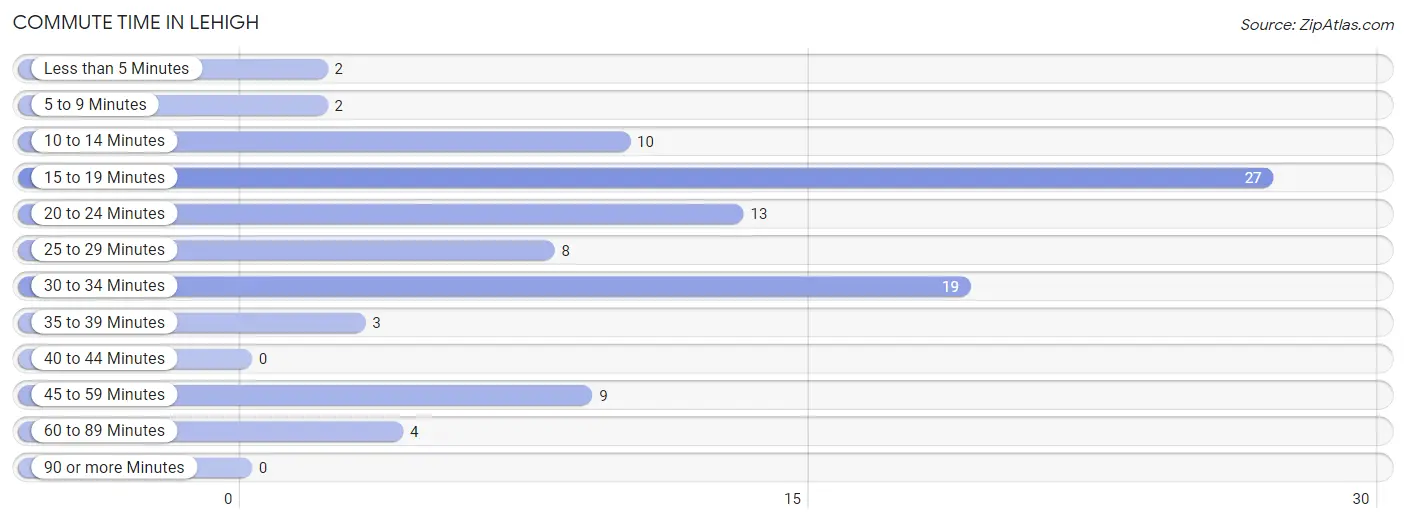
| Commute Time | # Commuters | % Commuters |
| Less than 5 Minutes | 2 | 2.1% |
| 5 to 9 Minutes | 2 | 2.1% |
| 10 to 14 Minutes | 10 | 10.3% |
| 15 to 19 Minutes | 27 | 27.8% |
| 20 to 24 Minutes | 13 | 13.4% |
| 25 to 29 Minutes | 8 | 8.3% |
| 30 to 34 Minutes | 19 | 19.6% |
| 35 to 39 Minutes | 3 | 3.1% |
| 40 to 44 Minutes | 0 | 0.0% |
| 45 to 59 Minutes | 9 | 9.3% |
| 60 to 89 Minutes | 4 | 4.1% |
| 90 or more Minutes | 0 | 0.0% |
Commute Time by Sex in Lehigh
The most common commute times in Lehigh are 30 to 34 minutes (19 commuters, 29.2%) for males and 15 to 19 minutes (10 commuters, 31.2%) for females.
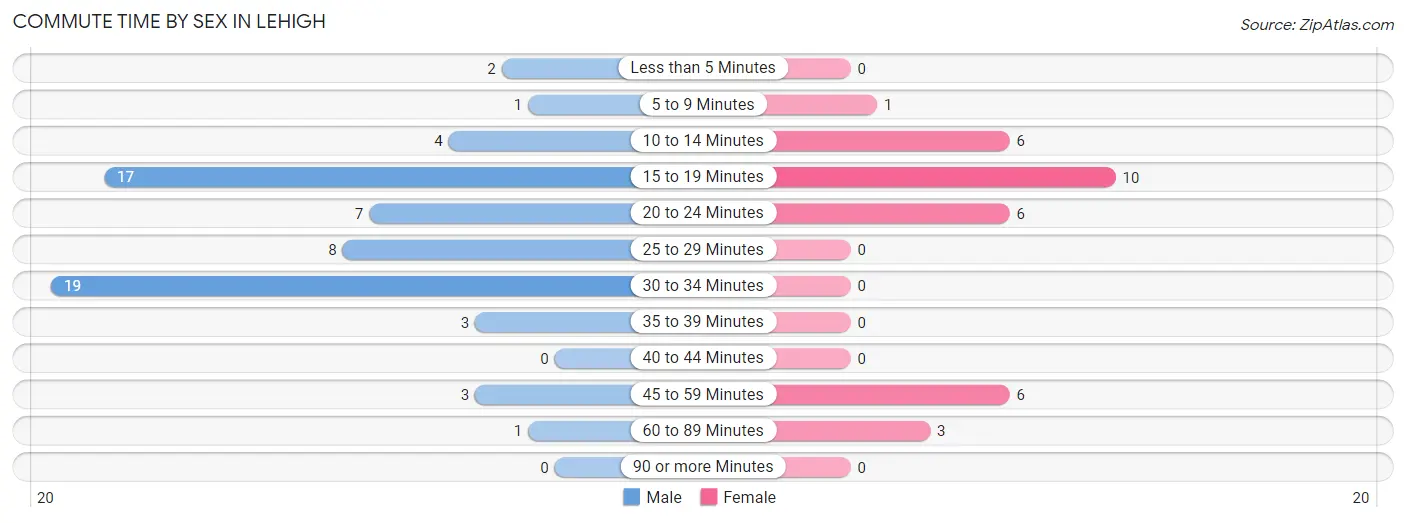
| Commute Time | Male | Female |
| Less than 5 Minutes | 2 (3.1%) | 0 (0.0%) |
| 5 to 9 Minutes | 1 (1.5%) | 1 (3.1%) |
| 10 to 14 Minutes | 4 (6.1%) | 6 (18.8%) |
| 15 to 19 Minutes | 17 (26.2%) | 10 (31.2%) |
| 20 to 24 Minutes | 7 (10.8%) | 6 (18.8%) |
| 25 to 29 Minutes | 8 (12.3%) | 0 (0.0%) |
| 30 to 34 Minutes | 19 (29.2%) | 0 (0.0%) |
| 35 to 39 Minutes | 3 (4.6%) | 0 (0.0%) |
| 40 to 44 Minutes | 0 (0.0%) | 0 (0.0%) |
| 45 to 59 Minutes | 3 (4.6%) | 6 (18.8%) |
| 60 to 89 Minutes | 1 (1.5%) | 3 (9.4%) |
| 90 or more Minutes | 0 (0.0%) | 0 (0.0%) |
Time of Departure to Work by Sex in Lehigh
The most frequent times of departure to work in Lehigh are 12:00 AM to 4:59 AM (17, 26.2%) for males and 6:30 AM to 6:59 AM (13, 40.6%) for females.
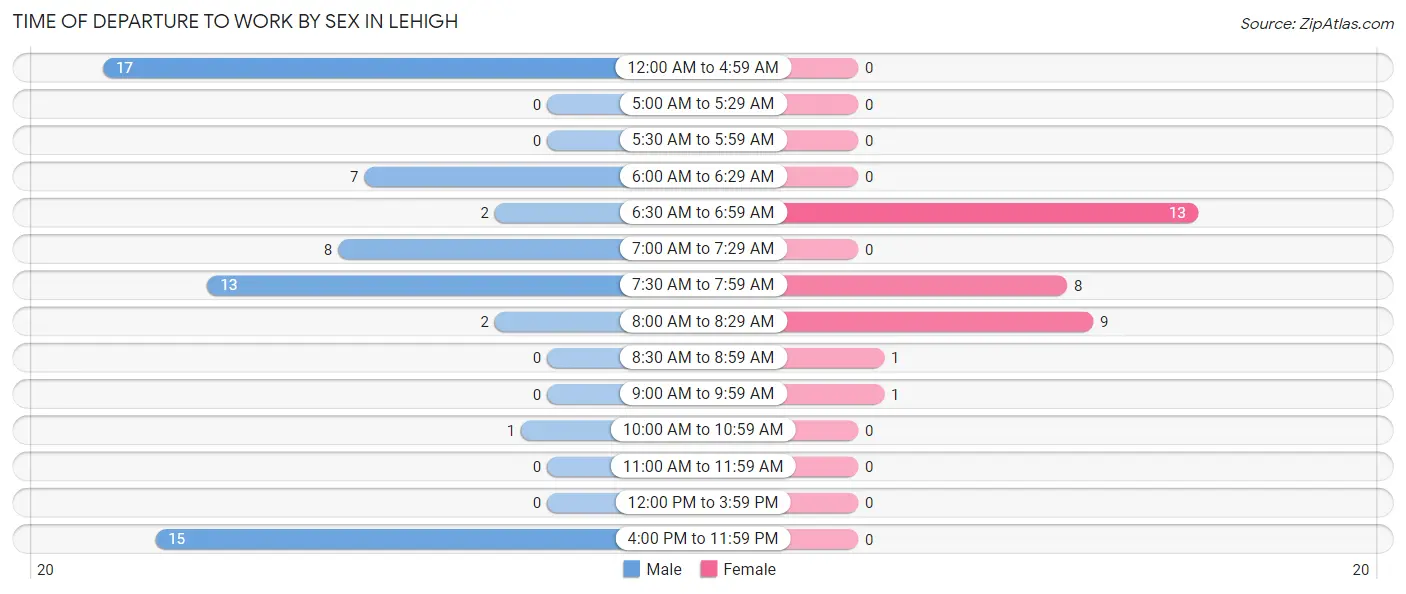
| Time of Departure | Male | Female |
| 12:00 AM to 4:59 AM | 17 (26.2%) | 0 (0.0%) |
| 5:00 AM to 5:29 AM | 0 (0.0%) | 0 (0.0%) |
| 5:30 AM to 5:59 AM | 0 (0.0%) | 0 (0.0%) |
| 6:00 AM to 6:29 AM | 7 (10.8%) | 0 (0.0%) |
| 6:30 AM to 6:59 AM | 2 (3.1%) | 13 (40.6%) |
| 7:00 AM to 7:29 AM | 8 (12.3%) | 0 (0.0%) |
| 7:30 AM to 7:59 AM | 13 (20.0%) | 8 (25.0%) |
| 8:00 AM to 8:29 AM | 2 (3.1%) | 9 (28.1%) |
| 8:30 AM to 8:59 AM | 0 (0.0%) | 1 (3.1%) |
| 9:00 AM to 9:59 AM | 0 (0.0%) | 1 (3.1%) |
| 10:00 AM to 10:59 AM | 1 (1.5%) | 0 (0.0%) |
| 11:00 AM to 11:59 AM | 0 (0.0%) | 0 (0.0%) |
| 12:00 PM to 3:59 PM | 0 (0.0%) | 0 (0.0%) |
| 4:00 PM to 11:59 PM | 15 (23.1%) | 0 (0.0%) |
| Total | 65 (100.0%) | 32 (100.0%) |
Housing Occupancy in Lehigh
Occupancy by Ownership in Lehigh
Of the total 77 dwellings in Lehigh, owner-occupied units account for 52 (67.5%), while renter-occupied units make up 25 (32.5%).
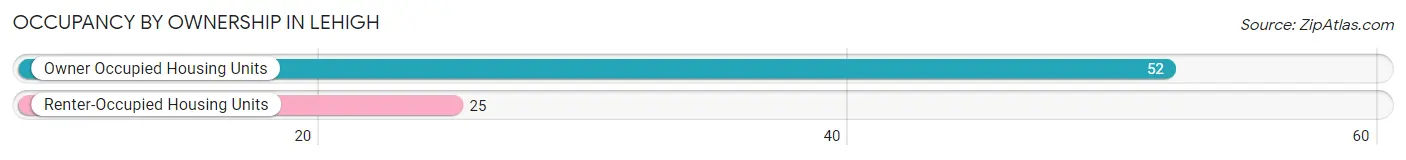
| Occupancy | # Housing Units | % Housing Units |
| Owner Occupied Housing Units | 52 | 67.5% |
| Renter-Occupied Housing Units | 25 | 32.5% |
| Total Occupied Housing Units | 77 | 100.0% |
Occupancy by Household Size in Lehigh
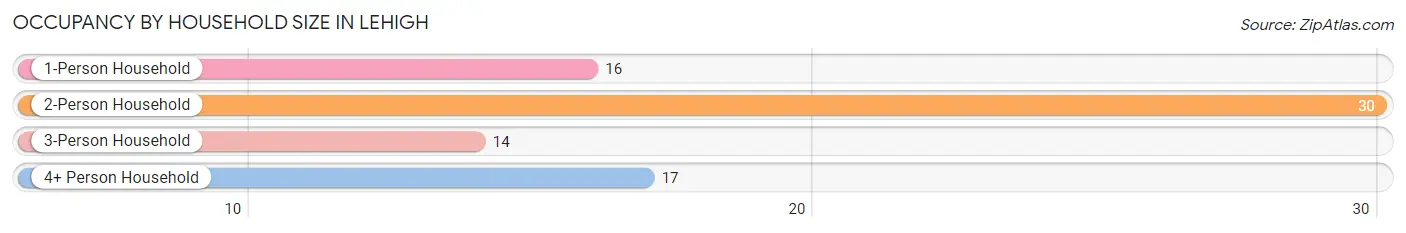
| Household Size | # Housing Units | % Housing Units |
| 1-Person Household | 16 | 20.8% |
| 2-Person Household | 30 | 39.0% |
| 3-Person Household | 14 | 18.2% |
| 4+ Person Household | 17 | 22.1% |
| Total Housing Units | 77 | 100.0% |
Occupancy by Ownership by Household Size in Lehigh
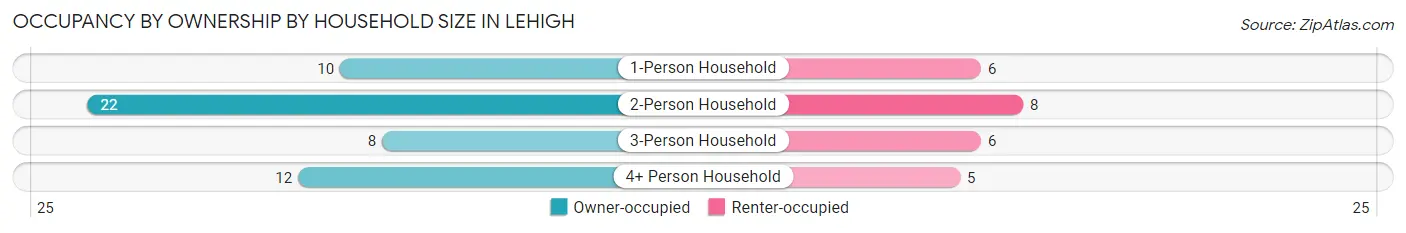
| Household Size | Owner-occupied | Renter-occupied |
| 1-Person Household | 10 (62.5%) | 6 (37.5%) |
| 2-Person Household | 22 (73.3%) | 8 (26.7%) |
| 3-Person Household | 8 (57.1%) | 6 (42.9%) |
| 4+ Person Household | 12 (70.6%) | 5 (29.4%) |
| Total Housing Units | 52 (67.5%) | 25 (32.5%) |
Occupancy by Educational Attainment in Lehigh
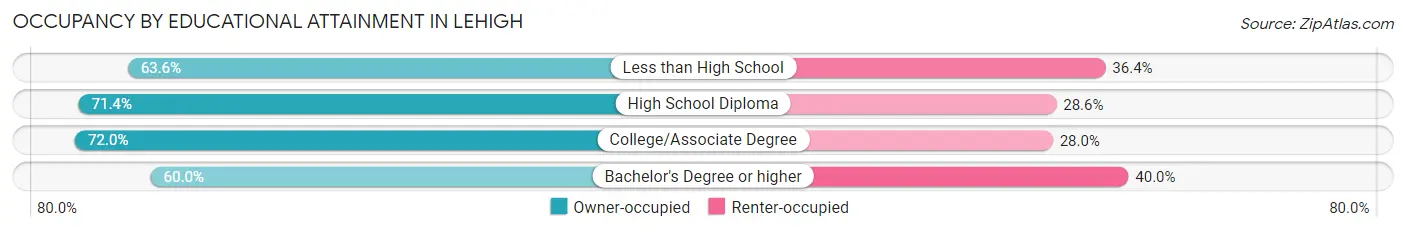
| Household Size | Owner-occupied | Renter-occupied |
| Less than High School | 7 (63.6%) | 4 (36.4%) |
| High School Diploma | 15 (71.4%) | 6 (28.6%) |
| College/Associate Degree | 18 (72.0%) | 7 (28.0%) |
| Bachelor's Degree or higher | 12 (60.0%) | 8 (40.0%) |
Occupancy by Age of Householder in Lehigh

| Age Bracket | # Households | % Households |
| Under 35 Years | 22 | 28.6% |
| 35 to 44 Years | 8 | 10.4% |
| 45 to 54 Years | 10 | 13.0% |
| 55 to 64 Years | 8 | 10.4% |
| 65 to 74 Years | 26 | 33.8% |
| 75 to 84 Years | 3 | 3.9% |
| 85 Years and Over | 0 | 0.0% |
| Total | 77 | 100.0% |
Housing Finances in Lehigh
Median Income by Occupancy in Lehigh
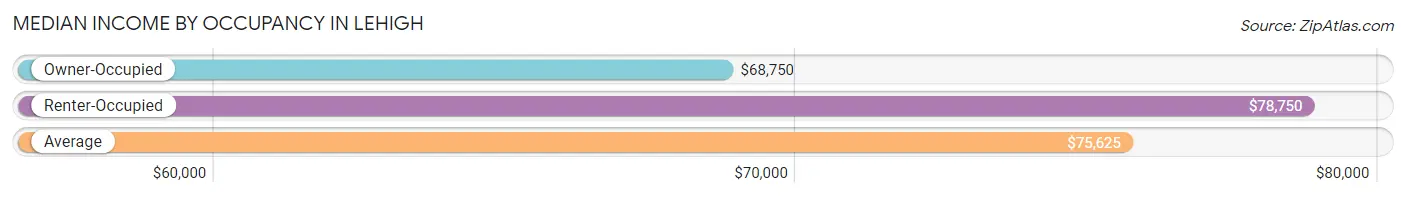
| Occupancy Type | # Households | Median Income |
| Owner-Occupied | 52 (67.5%) | $68,750 |
| Renter-Occupied | 25 (32.5%) | $78,750 |
| Average | 77 (100.0%) | $75,625 |
Occupancy by Householder Income Bracket in Lehigh
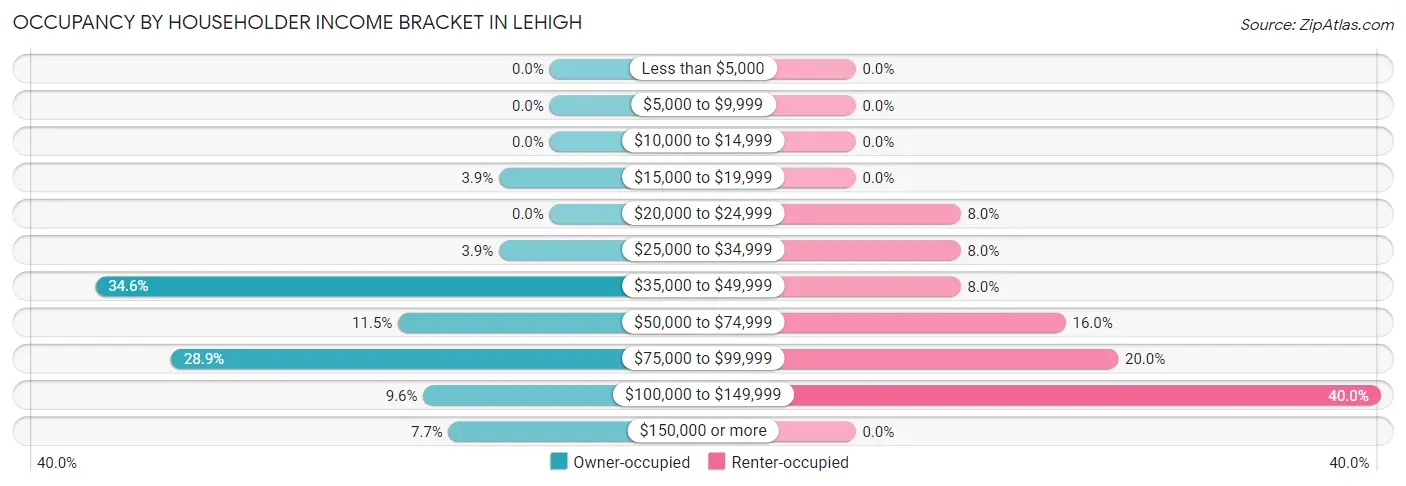
| Income Bracket | Owner-occupied | Renter-occupied |
| Less than $5,000 | 0 (0.0%) | 0 (0.0%) |
| $5,000 to $9,999 | 0 (0.0%) | 0 (0.0%) |
| $10,000 to $14,999 | 0 (0.0%) | 0 (0.0%) |
| $15,000 to $19,999 | 2 (3.8%) | 0 (0.0%) |
| $20,000 to $24,999 | 0 (0.0%) | 2 (8.0%) |
| $25,000 to $34,999 | 2 (3.8%) | 2 (8.0%) |
| $35,000 to $49,999 | 18 (34.6%) | 2 (8.0%) |
| $50,000 to $74,999 | 6 (11.5%) | 4 (16.0%) |
| $75,000 to $99,999 | 15 (28.8%) | 5 (20.0%) |
| $100,000 to $149,999 | 5 (9.6%) | 10 (40.0%) |
| $150,000 or more | 4 (7.7%) | 0 (0.0%) |
| Total | 52 (100.0%) | 25 (100.0%) |
Monthly Housing Cost Tiers in Lehigh
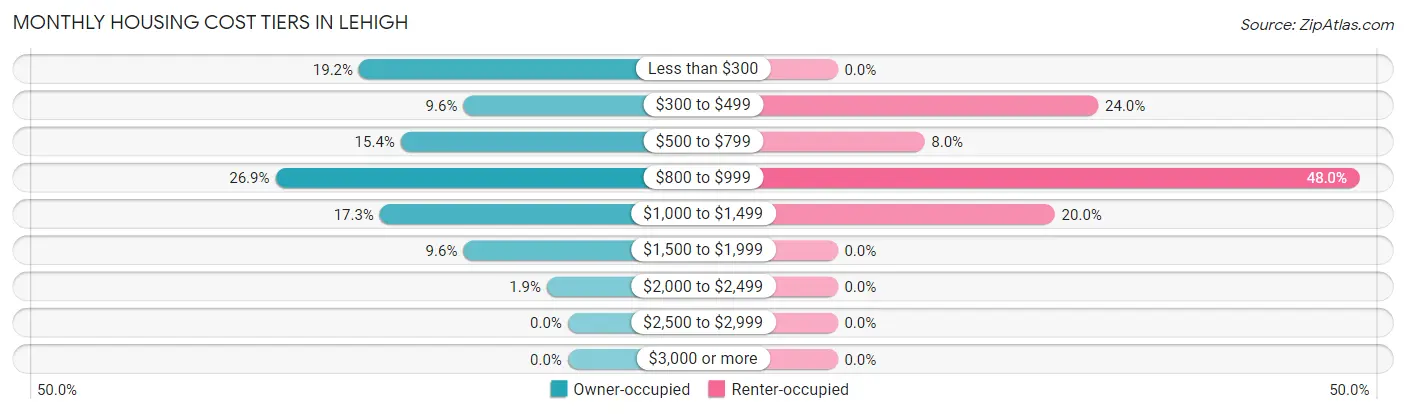
| Monthly Cost | Owner-occupied | Renter-occupied |
| Less than $300 | 10 (19.2%) | 0 (0.0%) |
| $300 to $499 | 5 (9.6%) | 6 (24.0%) |
| $500 to $799 | 8 (15.4%) | 2 (8.0%) |
| $800 to $999 | 14 (26.9%) | 12 (48.0%) |
| $1,000 to $1,499 | 9 (17.3%) | 5 (20.0%) |
| $1,500 to $1,999 | 5 (9.6%) | 0 (0.0%) |
| $2,000 to $2,499 | 1 (1.9%) | 0 (0.0%) |
| $2,500 to $2,999 | 0 (0.0%) | 0 (0.0%) |
| $3,000 or more | 0 (0.0%) | 0 (0.0%) |
| Total | 52 (100.0%) | 25 (100.0%) |
Physical Housing Characteristics in Lehigh
Housing Structures in Lehigh
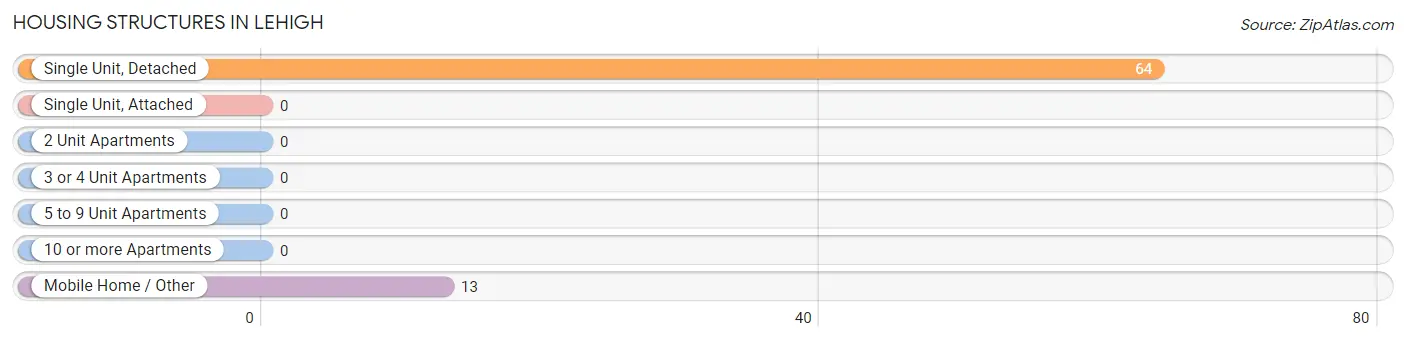
| Structure Type | # Housing Units | % Housing Units |
| Single Unit, Detached | 64 | 83.1% |
| Single Unit, Attached | 0 | 0.0% |
| 2 Unit Apartments | 0 | 0.0% |
| 3 or 4 Unit Apartments | 0 | 0.0% |
| 5 to 9 Unit Apartments | 0 | 0.0% |
| 10 or more Apartments | 0 | 0.0% |
| Mobile Home / Other | 13 | 16.9% |
| Total | 77 | 100.0% |
Housing Structures by Occupancy in Lehigh
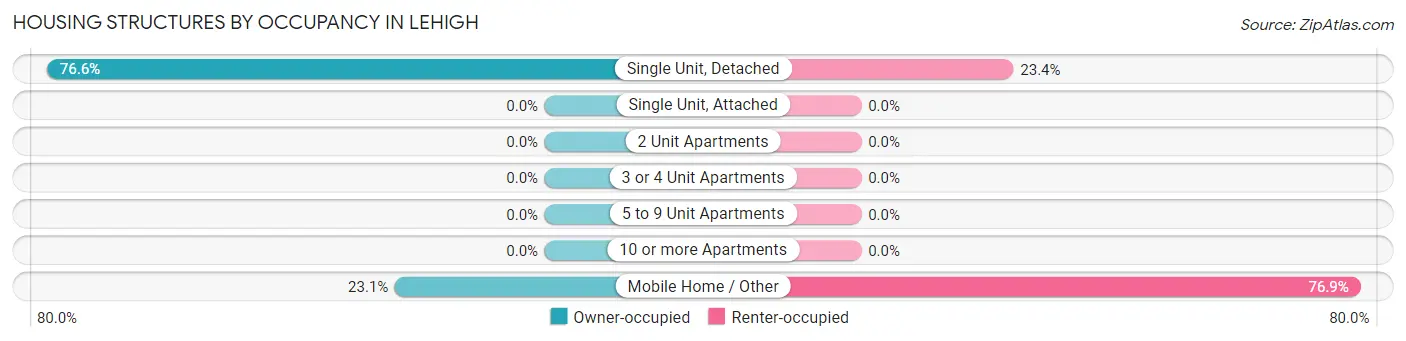
| Structure Type | Owner-occupied | Renter-occupied |
| Single Unit, Detached | 49 (76.6%) | 15 (23.4%) |
| Single Unit, Attached | 0 (0.0%) | 0 (0.0%) |
| 2 Unit Apartments | 0 (0.0%) | 0 (0.0%) |
| 3 or 4 Unit Apartments | 0 (0.0%) | 0 (0.0%) |
| 5 to 9 Unit Apartments | 0 (0.0%) | 0 (0.0%) |
| 10 or more Apartments | 0 (0.0%) | 0 (0.0%) |
| Mobile Home / Other | 3 (23.1%) | 10 (76.9%) |
| Total | 52 (67.5%) | 25 (32.5%) |
Housing Structures by Number of Rooms in Lehigh
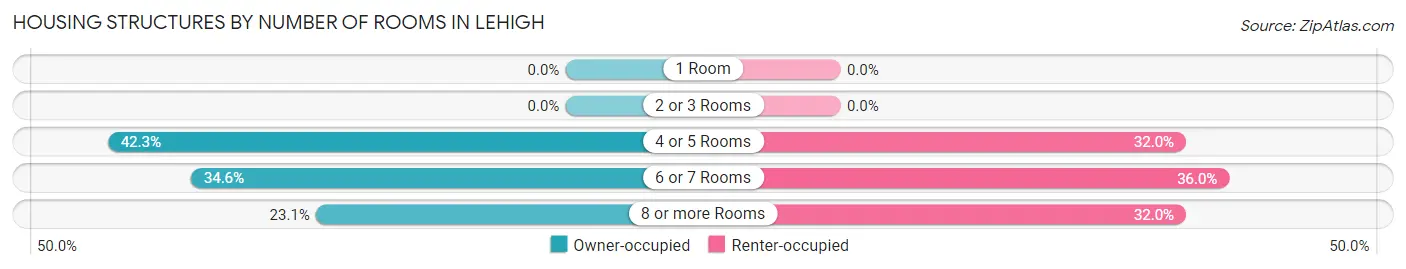
| Number of Rooms | Owner-occupied | Renter-occupied |
| 1 Room | 0 (0.0%) | 0 (0.0%) |
| 2 or 3 Rooms | 0 (0.0%) | 0 (0.0%) |
| 4 or 5 Rooms | 22 (42.3%) | 8 (32.0%) |
| 6 or 7 Rooms | 18 (34.6%) | 9 (36.0%) |
| 8 or more Rooms | 12 (23.1%) | 8 (32.0%) |
| Total | 52 (100.0%) | 25 (100.0%) |
Housing Structure by Heating Type in Lehigh
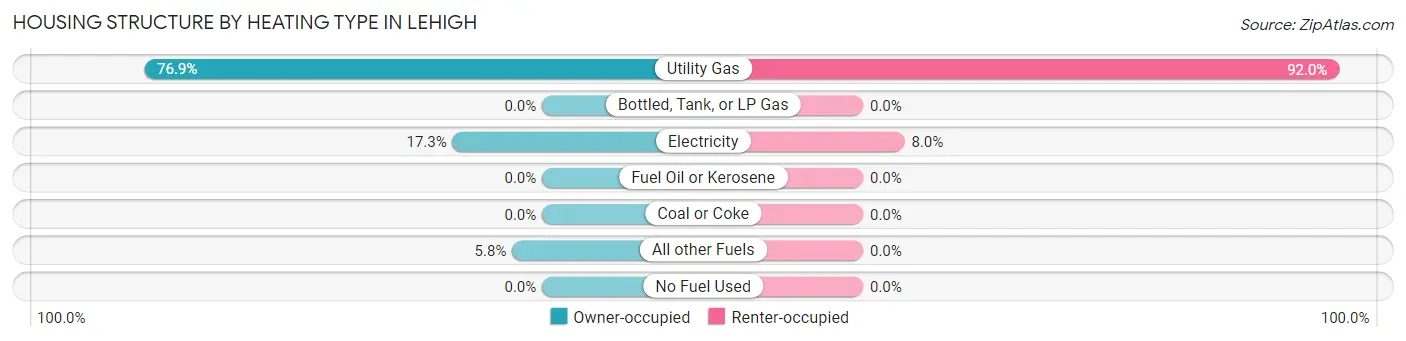
| Heating Type | Owner-occupied | Renter-occupied |
| Utility Gas | 40 (76.9%) | 23 (92.0%) |
| Bottled, Tank, or LP Gas | 0 (0.0%) | 0 (0.0%) |
| Electricity | 9 (17.3%) | 2 (8.0%) |
| Fuel Oil or Kerosene | 0 (0.0%) | 0 (0.0%) |
| Coal or Coke | 0 (0.0%) | 0 (0.0%) |
| All other Fuels | 3 (5.8%) | 0 (0.0%) |
| No Fuel Used | 0 (0.0%) | 0 (0.0%) |
| Total | 52 (100.0%) | 25 (100.0%) |
Household Vehicle Usage in Lehigh
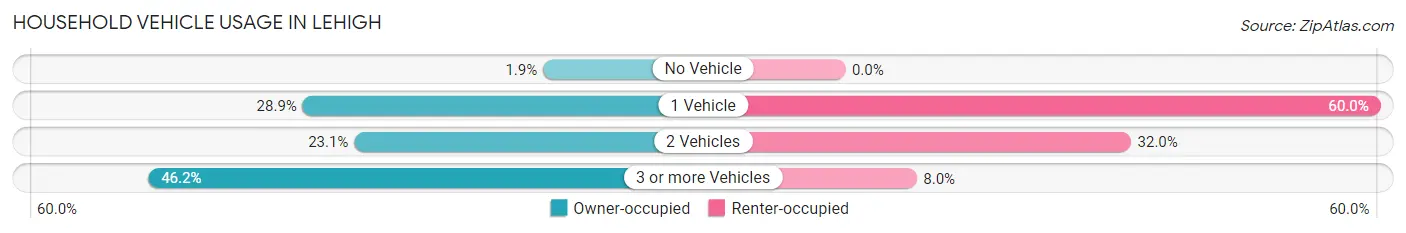
| Vehicles per Household | Owner-occupied | Renter-occupied |
| No Vehicle | 1 (1.9%) | 0 (0.0%) |
| 1 Vehicle | 15 (28.8%) | 15 (60.0%) |
| 2 Vehicles | 12 (23.1%) | 8 (32.0%) |
| 3 or more Vehicles | 24 (46.2%) | 2 (8.0%) |
| Total | 52 (100.0%) | 25 (100.0%) |
Real Estate & Mortgages in Lehigh
Real Estate and Mortgage Overview in Lehigh
| Characteristic | Without Mortgage | With Mortgage |
| Housing Units | 21 | 31 |
| Median Property Value | $49,400 | $101,800 |
| Median Household Income | $46,875 | $4 |
| Monthly Housing Costs | $410 | $0 |
| Real Estate Taxes | $1,325 | $2 |
Property Value by Mortgage Status in Lehigh
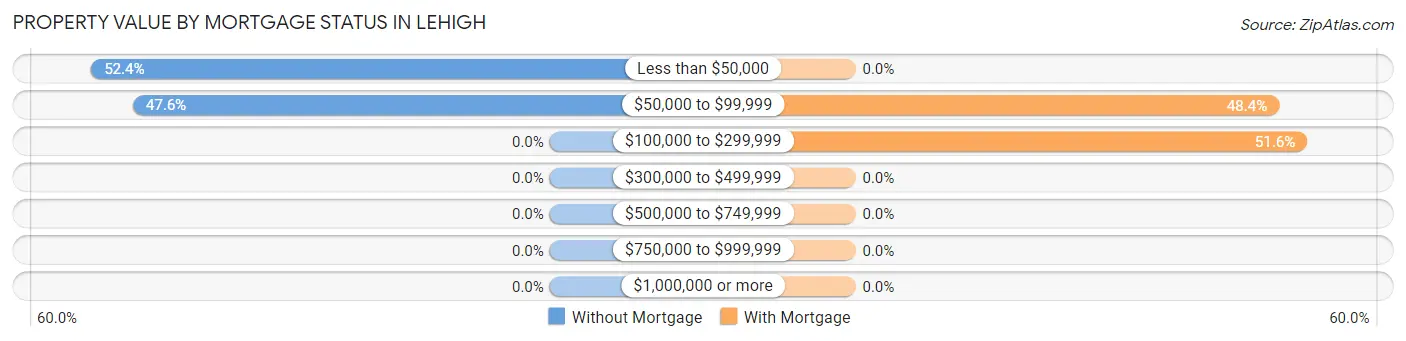
| Property Value | Without Mortgage | With Mortgage |
| Less than $50,000 | 11 (52.4%) | 0 (0.0%) |
| $50,000 to $99,999 | 10 (47.6%) | 15 (48.4%) |
| $100,000 to $299,999 | 0 (0.0%) | 16 (51.6%) |
| $300,000 to $499,999 | 0 (0.0%) | 0 (0.0%) |
| $500,000 to $749,999 | 0 (0.0%) | 0 (0.0%) |
| $750,000 to $999,999 | 0 (0.0%) | 0 (0.0%) |
| $1,000,000 or more | 0 (0.0%) | 0 (0.0%) |
| Total | 21 (100.0%) | 31 (100.0%) |
Household Income by Mortgage Status in Lehigh
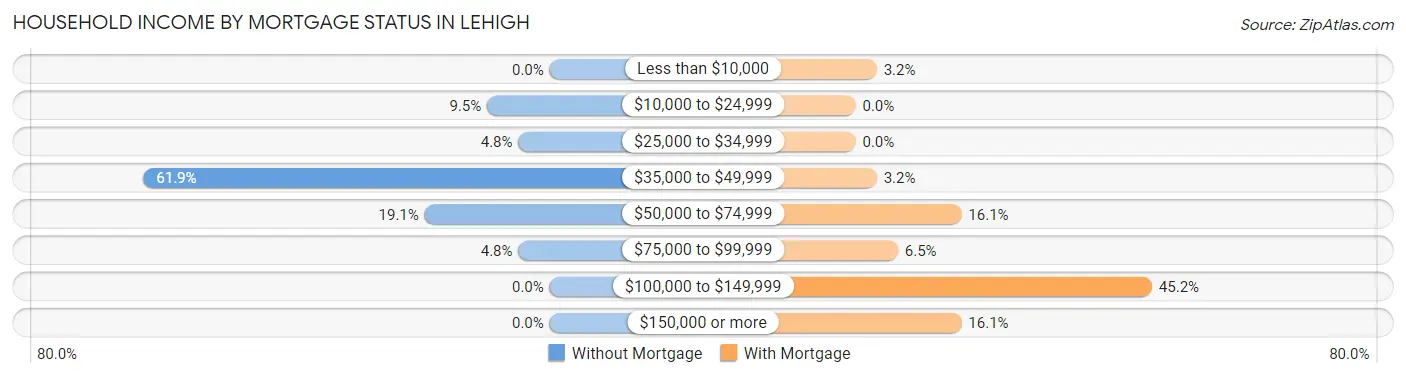
| Household Income | Without Mortgage | With Mortgage |
| Less than $10,000 | 0 (0.0%) | 1 (3.2%) |
| $10,000 to $24,999 | 2 (9.5%) | 0 (0.0%) |
| $25,000 to $34,999 | 1 (4.8%) | 0 (0.0%) |
| $35,000 to $49,999 | 13 (61.9%) | 1 (3.2%) |
| $50,000 to $74,999 | 4 (19.1%) | 5 (16.1%) |
| $75,000 to $99,999 | 1 (4.8%) | 2 (6.5%) |
| $100,000 to $149,999 | 0 (0.0%) | 14 (45.2%) |
| $150,000 or more | 0 (0.0%) | 5 (16.1%) |
| Total | 21 (100.0%) | 31 (100.0%) |
Property Value to Household Income Ratio in Lehigh
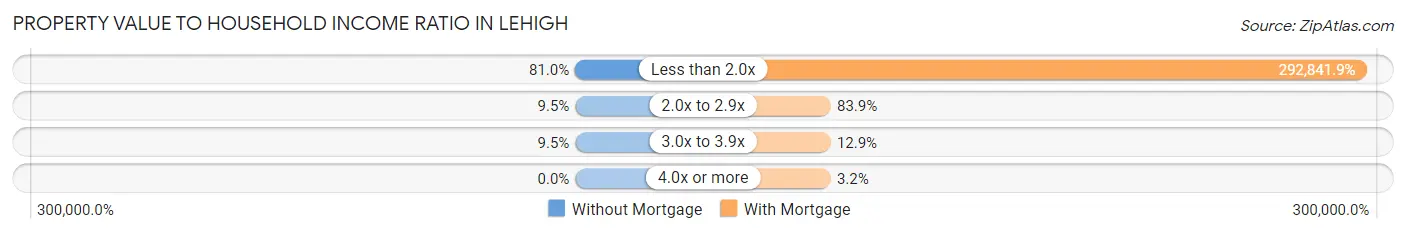
| Value-to-Income Ratio | Without Mortgage | With Mortgage |
| Less than 2.0x | 17 (80.9%) | 90,781 (292,841.9%) |
| 2.0x to 2.9x | 2 (9.5%) | 26 (83.9%) |
| 3.0x to 3.9x | 2 (9.5%) | 4 (12.9%) |
| 4.0x or more | 0 (0.0%) | 1 (3.2%) |
| Total | 21 (100.0%) | 31 (100.0%) |
Real Estate Taxes by Mortgage Status in Lehigh
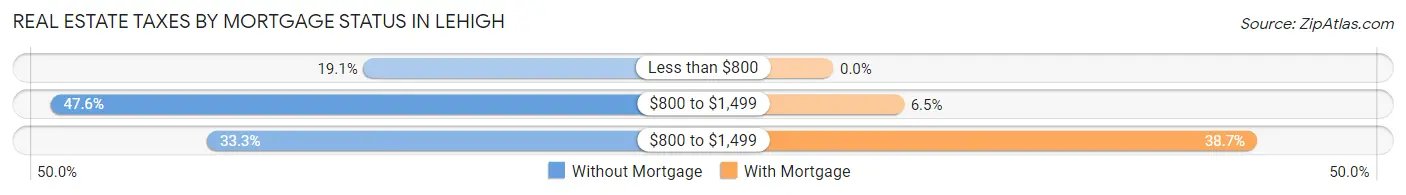
| Property Taxes | Without Mortgage | With Mortgage |
| Less than $800 | 4 (19.1%) | 0 (0.0%) |
| $800 to $1,499 | 10 (47.6%) | 2 (6.5%) |
| $800 to $1,499 | 7 (33.3%) | 12 (38.7%) |
| Total | 21 (100.0%) | 31 (100.0%) |
Health & Disability in Lehigh
Health Insurance Coverage by Age in Lehigh
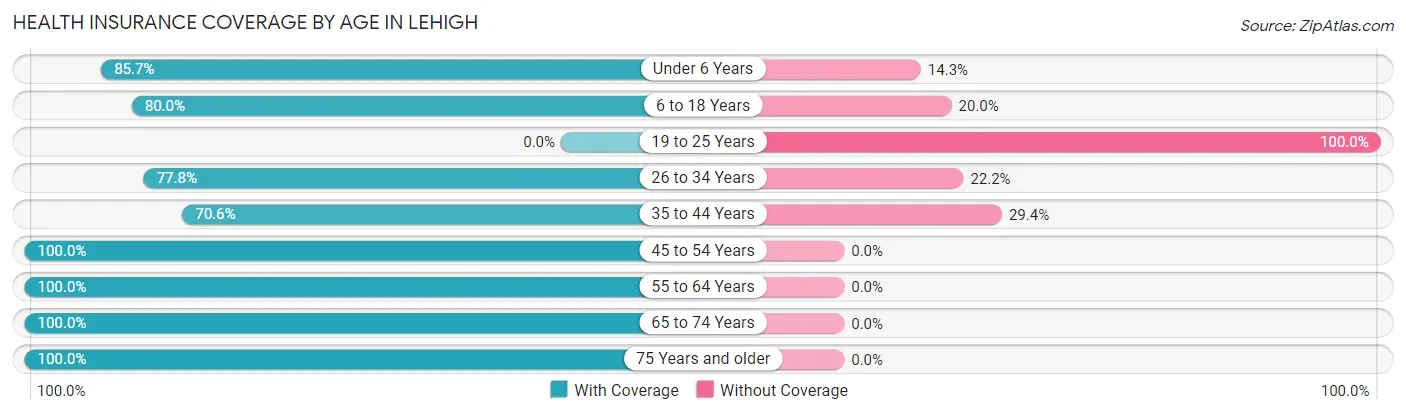
| Age Bracket | With Coverage | Without Coverage |
| Under 6 Years | 6 (85.7%) | 1 (14.3%) |
| 6 to 18 Years | 36 (80.0%) | 9 (20.0%) |
| 19 to 25 Years | 0 (0.0%) | 11 (100.0%) |
| 26 to 34 Years | 28 (77.8%) | 8 (22.2%) |
| 35 to 44 Years | 12 (70.6%) | 5 (29.4%) |
| 45 to 54 Years | 25 (100.0%) | 0 (0.0%) |
| 55 to 64 Years | 15 (100.0%) | 0 (0.0%) |
| 65 to 74 Years | 37 (100.0%) | 0 (0.0%) |
| 75 Years and older | 3 (100.0%) | 0 (0.0%) |
| Total | 162 (82.7%) | 34 (17.3%) |
Health Insurance Coverage by Citizenship Status in Lehigh
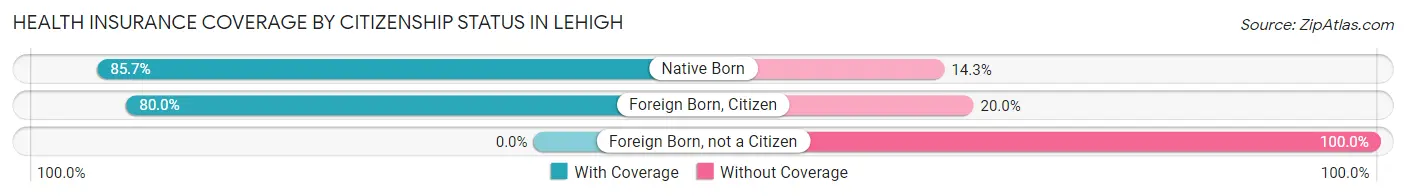
| Citizenship Status | With Coverage | Without Coverage |
| Native Born | 6 (85.7%) | 1 (14.3%) |
| Foreign Born, Citizen | 36 (80.0%) | 9 (20.0%) |
| Foreign Born, not a Citizen | 0 (0.0%) | 11 (100.0%) |
Health Insurance Coverage by Household Income in Lehigh
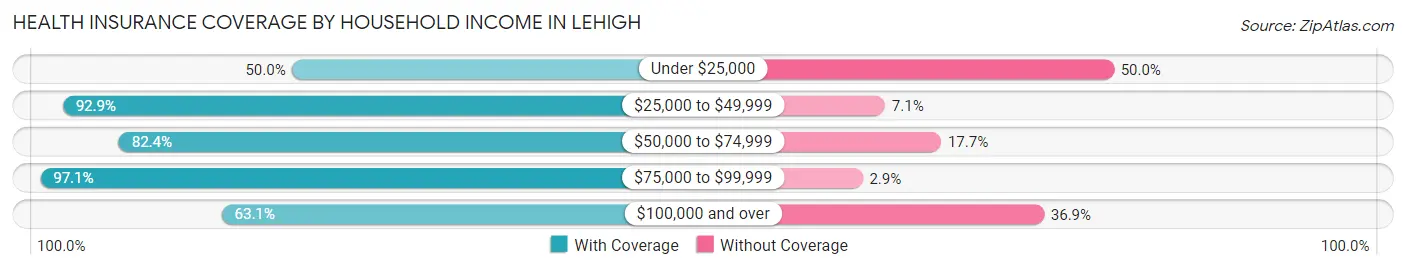
| Household Income | With Coverage | Without Coverage |
| Under $25,000 | 2 (50.0%) | 2 (50.0%) |
| $25,000 to $49,999 | 39 (92.9%) | 3 (7.1%) |
| $50,000 to $74,999 | 14 (82.4%) | 3 (17.6%) |
| $75,000 to $99,999 | 66 (97.1%) | 2 (2.9%) |
| $100,000 and over | 41 (63.1%) | 24 (36.9%) |
Public vs Private Health Insurance Coverage by Age in Lehigh
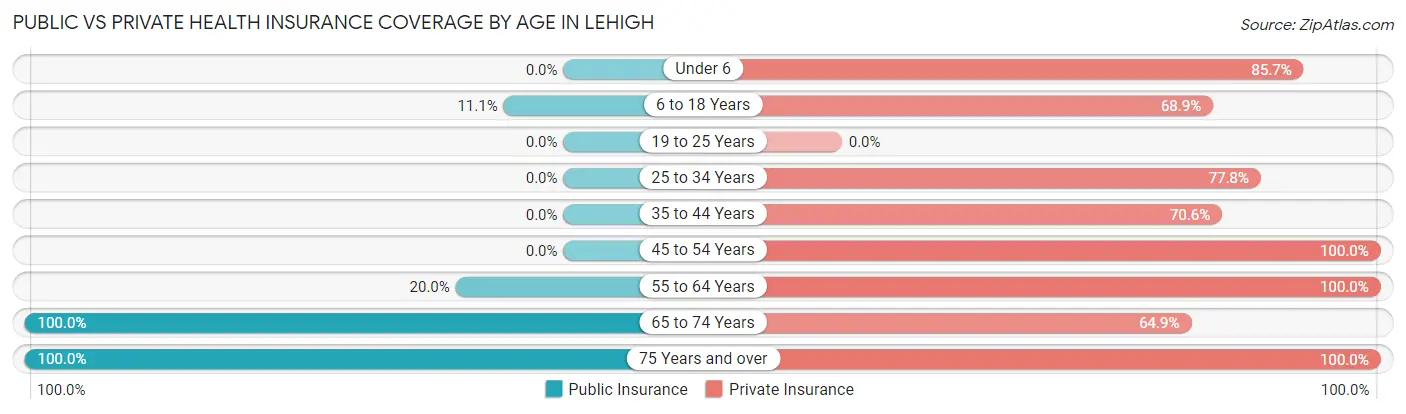
| Age Bracket | Public Insurance | Private Insurance |
| Under 6 | 0 (0.0%) | 6 (85.7%) |
| 6 to 18 Years | 5 (11.1%) | 31 (68.9%) |
| 19 to 25 Years | 0 (0.0%) | 0 (0.0%) |
| 25 to 34 Years | 0 (0.0%) | 28 (77.8%) |
| 35 to 44 Years | 0 (0.0%) | 12 (70.6%) |
| 45 to 54 Years | 0 (0.0%) | 25 (100.0%) |
| 55 to 64 Years | 3 (20.0%) | 15 (100.0%) |
| 65 to 74 Years | 37 (100.0%) | 24 (64.9%) |
| 75 Years and over | 3 (100.0%) | 3 (100.0%) |
| Total | 48 (24.5%) | 144 (73.5%) |
Disability Status by Sex by Age in Lehigh
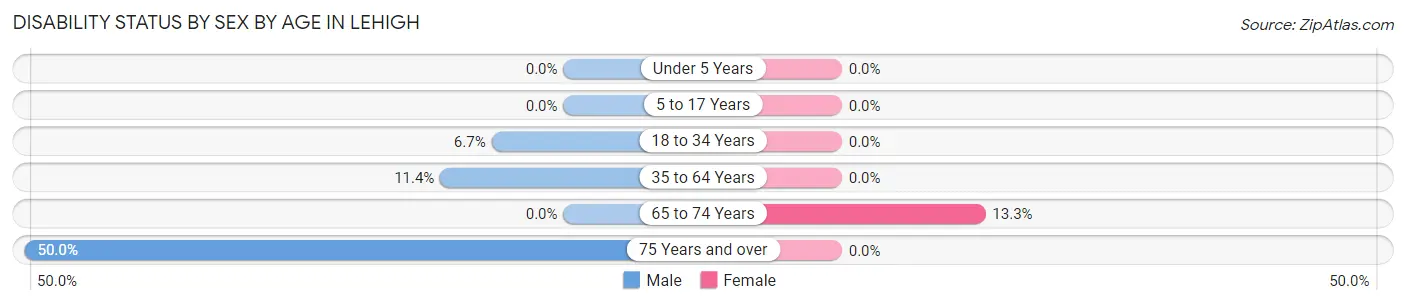
| Age Bracket | Male | Female |
| Under 5 Years | 0 (0.0%) | 0 (0.0%) |
| 5 to 17 Years | 0 (0.0%) | 0 (0.0%) |
| 18 to 34 Years | 2 (6.7%) | 0 (0.0%) |
| 35 to 64 Years | 4 (11.4%) | 0 (0.0%) |
| 65 to 74 Years | 0 (0.0%) | 2 (13.3%) |
| 75 Years and over | 1 (50.0%) | 0 (0.0%) |
Disability Class by Sex by Age in Lehigh
Disability Class: Hearing Difficulty
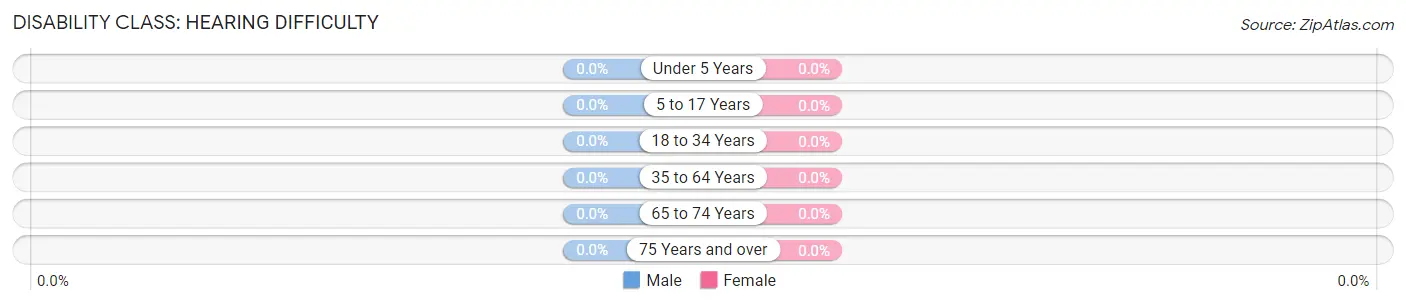
| Age Bracket | Male | Female |
| Under 5 Years | 0 (0.0%) | 0 (0.0%) |
| 5 to 17 Years | 0 (0.0%) | 0 (0.0%) |
| 18 to 34 Years | 0 (0.0%) | 0 (0.0%) |
| 35 to 64 Years | 0 (0.0%) | 0 (0.0%) |
| 65 to 74 Years | 0 (0.0%) | 0 (0.0%) |
| 75 Years and over | 0 (0.0%) | 0 (0.0%) |
Disability Class: Vision Difficulty
| Age Bracket | Male | Female |
| Under 5 Years | 0 (0.0%) | 0 (0.0%) |
| 5 to 17 Years | 0 (0.0%) | 0 (0.0%) |
| 18 to 34 Years | 0 (0.0%) | 0 (0.0%) |
| 35 to 64 Years | 0 (0.0%) | 0 (0.0%) |
| 65 to 74 Years | 0 (0.0%) | 0 (0.0%) |
| 75 Years and over | 0 (0.0%) | 0 (0.0%) |
Disability Class: Cognitive Difficulty
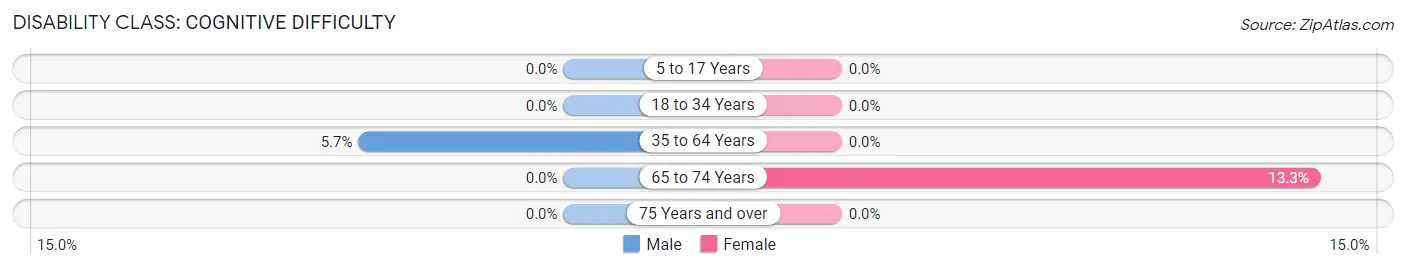
| Age Bracket | Male | Female |
| 5 to 17 Years | 0 (0.0%) | 0 (0.0%) |
| 18 to 34 Years | 0 (0.0%) | 0 (0.0%) |
| 35 to 64 Years | 2 (5.7%) | 0 (0.0%) |
| 65 to 74 Years | 0 (0.0%) | 2 (13.3%) |
| 75 Years and over | 0 (0.0%) | 0 (0.0%) |
Disability Class: Ambulatory Difficulty
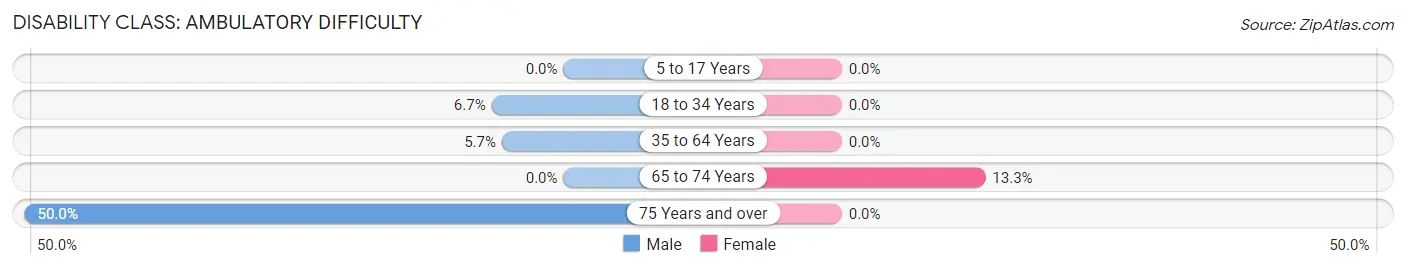
| Age Bracket | Male | Female |
| 5 to 17 Years | 0 (0.0%) | 0 (0.0%) |
| 18 to 34 Years | 2 (6.7%) | 0 (0.0%) |
| 35 to 64 Years | 2 (5.7%) | 0 (0.0%) |
| 65 to 74 Years | 0 (0.0%) | 2 (13.3%) |
| 75 Years and over | 1 (50.0%) | 0 (0.0%) |
Disability Class: Self-Care Difficulty
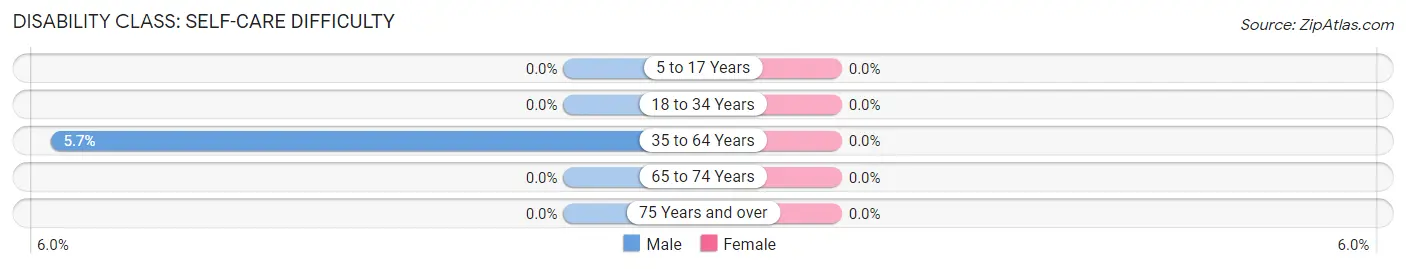
| Age Bracket | Male | Female |
| 5 to 17 Years | 0 (0.0%) | 0 (0.0%) |
| 18 to 34 Years | 0 (0.0%) | 0 (0.0%) |
| 35 to 64 Years | 2 (5.7%) | 0 (0.0%) |
| 65 to 74 Years | 0 (0.0%) | 0 (0.0%) |
| 75 Years and over | 0 (0.0%) | 0 (0.0%) |
Technology Access in Lehigh
Computing Device Access in Lehigh
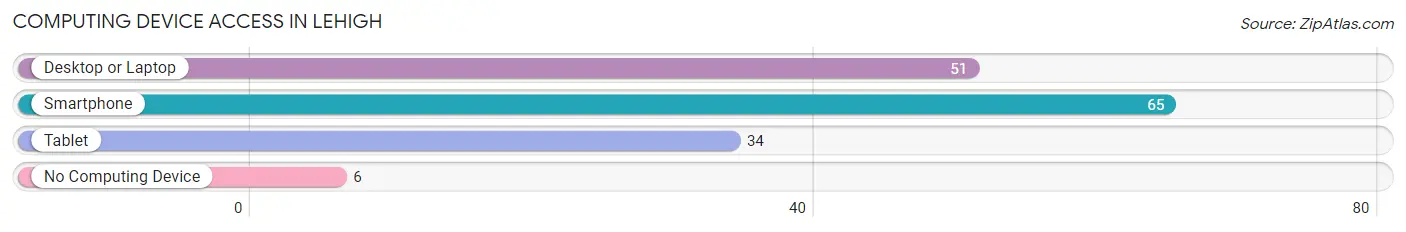
| Device Type | # Households | % Households |
| Desktop or Laptop | 51 | 66.2% |
| Smartphone | 65 | 84.4% |
| Tablet | 34 | 44.2% |
| No Computing Device | 6 | 7.8% |
| Total | 77 | 100.0% |
Internet Access in Lehigh
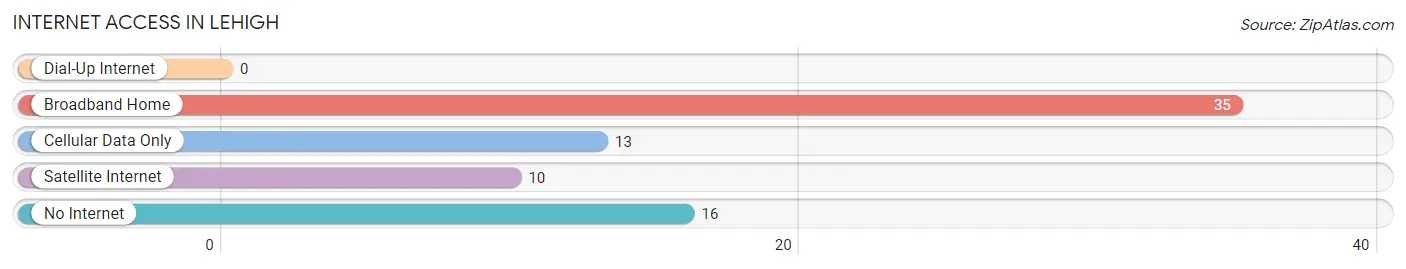
| Internet Type | # Households | % Households |
| Dial-Up Internet | 0 | 0.0% |
| Broadband Home | 35 | 45.5% |
| Cellular Data Only | 13 | 16.9% |
| Satellite Internet | 10 | 13.0% |
| No Internet | 16 | 20.8% |
| Total | 77 | 100.0% |
Lehigh Summary
Lehigh, Kansas is a small town located in the northeast corner of the state, in the county of Leavenworth. It is situated on the banks of the Missouri River, and is part of the Kansas City metropolitan area. The town has a population of just over 1,000 people, and is known for its rural charm and small-town atmosphere.
History
Lehigh was founded in 1854 by a group of settlers from Ohio, led by William Lehigh. The town was originally named Lehigh Station, and was a stop on the Missouri Pacific Railroad. The town was officially incorporated in 1887, and the name was changed to Lehigh.
The town grew steadily throughout the late 19th and early 20th centuries, and by the 1920s, it had become a thriving agricultural community. The town was home to several businesses, including a flour mill, a creamery, and a general store.
Geography
Lehigh is located in the northeast corner of Kansas, in Leavenworth County. It is situated on the banks of the Missouri River, and is part of the Kansas City metropolitan area. The town is located at an elevation of 845 feet above sea level.
The town is surrounded by rolling hills and farmland, and is home to several small lakes and streams. The climate in Lehigh is generally mild, with hot summers and cold winters.
Economy
Lehigh’s economy is largely based on agriculture. The town is home to several farms, and the surrounding area is known for its production of corn, soybeans, and wheat. The town is also home to several small businesses, including a grocery store, a hardware store, and a restaurant.
Demographics
As of the 2010 census, the population of Lehigh was 1,072. The racial makeup of the town was 95.3% White, 0.9% African American, 0.3% Native American, 0.3% Asian, 0.1% Pacific Islander, and 2.1% from other races. The median household income was $41,250, and the median family income was $48,750.
Lehigh is a small, rural town with a strong sense of community. The town is home to several churches, and is known for its friendly atmosphere and welcoming attitude. The town is also home to several parks and recreational areas, and is a popular destination for outdoor enthusiasts.
Common Questions
What is Per Capita Income in Lehigh?
Per Capita income in Lehigh is $30,516.
What is the Median Family Income in Lehigh?
Median Family Income in Lehigh is $88,750.
What is the Median Household income in Lehigh?
Median Household Income in Lehigh is $75,625.
What is Income or Wage Gap in Lehigh?
Income or Wage Gap in Lehigh is 17.1%.
Women in Lehigh earn 82.9 cents for every dollar earned by a man.
What is Inequality or Gini Index in Lehigh?
Inequality or Gini Index in Lehigh is 0.28.
What is the Total Population of Lehigh?
Total Population of Lehigh is 196.
What is the Total Male Population of Lehigh?
Total Male Population of Lehigh is 125.
What is the Total Female Population of Lehigh?
Total Female Population of Lehigh is 71.
What is the Ratio of Males per 100 Females in Lehigh?
There are 176.06 Males per 100 Females in Lehigh.
What is the Ratio of Females per 100 Males in Lehigh?
There are 56.80 Females per 100 Males in Lehigh.
What is the Median Population Age in Lehigh?
Median Population Age in Lehigh is 33.9 Years.
What is the Average Family Size in Lehigh
Average Family Size in Lehigh is 3.0 People.
What is the Average Household Size in Lehigh
Average Household Size in Lehigh is 2.5 People.
How Large is the Labor Force in Lehigh?
There are 98 People in the Labor Forcein in Lehigh.
What is the Percentage of People in the Labor Force in Lehigh?
67.1% of People are in the Labor Force in Lehigh.