Lakin, KS Map & Demographics
Lakin Map
Lakin Overview
$26,804
PER CAPITA INCOME
$54,223
AVG FAMILY INCOME
$58,846
AVG HOUSEHOLD INCOME
52.3%
WAGE / INCOME GAP [ % ]
47.7¢/ $1
WAGE / INCOME GAP [ $ ]
$14,320
FAMILY INCOME DEFICIT
0.37
INEQUALITY / GINI INDEX
2,066
TOTAL POPULATION
1,060
MALE POPULATION
1,006
FEMALE POPULATION
105.37
MALES / 100 FEMALES
94.91
FEMALES / 100 MALES
34.1
MEDIAN AGE
3.3
AVG FAMILY SIZE
2.8
AVG HOUSEHOLD SIZE
829
LABOR FORCE [ PEOPLE ]
55.5%
PERCENT IN LABOR FORCE
4.7%
UNEMPLOYMENT RATE
Lakin Zip Codes
Lakin Area Codes
Income in Lakin
Income Overview in Lakin
Per Capita Income in Lakin is $26,804, while median incomes of families and households are $54,223 and $58,846 respectively.
| Characteristic | Number | Measure |
| Per Capita Income | 2,066 | $26,804 |
| Median Family Income | 511 | $54,223 |
| Mean Family Income | 511 | $68,262 |
| Median Household Income | 704 | $58,846 |
| Mean Household Income | 704 | $75,593 |
| Income Deficit | 511 | $14,320 |
| Wage / Income Gap (%) | 2,066 | 52.26% |
| Wage / Income Gap ($) | 2,066 | 47.74¢ per $1 |
| Gini / Inequality Index | 2,066 | 0.37 |
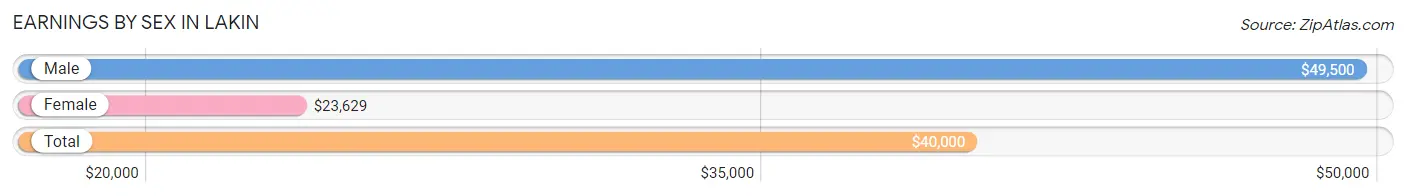
Earnings by Sex in Lakin
Average Earnings in Lakin are $40,000, $49,500 for men and $23,629 for women, a difference of 52.3%.
| Sex | Number | Average Earnings |
| Male | 510 (58.2%) | $49,500 |
| Female | 366 (41.8%) | $23,629 |
| Total | 876 (100.0%) | $40,000 |
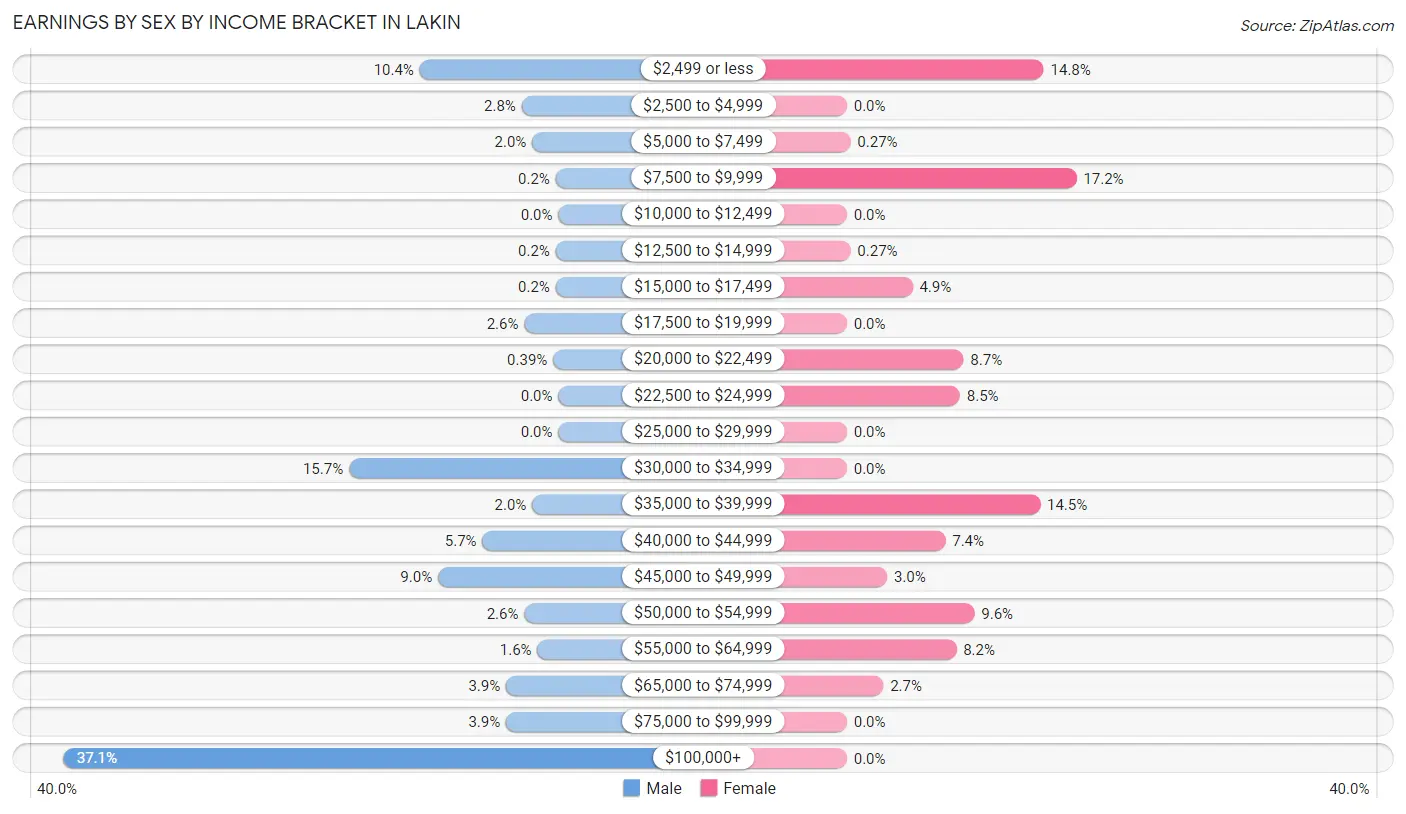
Earnings by Sex by Income Bracket in Lakin
The most common earnings brackets in Lakin are $100,000+ for men (189 | 37.1%) and $7,500 to $9,999 for women (63 | 17.2%).
| Income | Male | Female |
| $2,499 or less | 53 (10.4%) | 54 (14.7%) |
| $2,500 to $4,999 | 14 (2.8%) | 0 (0.0%) |
| $5,000 to $7,499 | 10 (2.0%) | 1 (0.3%) |
| $7,500 to $9,999 | 1 (0.2%) | 63 (17.2%) |
| $10,000 to $12,499 | 0 (0.0%) | 0 (0.0%) |
| $12,500 to $14,999 | 1 (0.2%) | 1 (0.3%) |
| $15,000 to $17,499 | 1 (0.2%) | 18 (4.9%) |
| $17,500 to $19,999 | 13 (2.5%) | 0 (0.0%) |
| $20,000 to $22,499 | 2 (0.4%) | 32 (8.7%) |
| $22,500 to $24,999 | 0 (0.0%) | 31 (8.5%) |
| $25,000 to $29,999 | 0 (0.0%) | 0 (0.0%) |
| $30,000 to $34,999 | 80 (15.7%) | 0 (0.0%) |
| $35,000 to $39,999 | 10 (2.0%) | 53 (14.5%) |
| $40,000 to $44,999 | 29 (5.7%) | 27 (7.4%) |
| $45,000 to $49,999 | 46 (9.0%) | 11 (3.0%) |
| $50,000 to $54,999 | 13 (2.5%) | 35 (9.6%) |
| $55,000 to $64,999 | 8 (1.6%) | 30 (8.2%) |
| $65,000 to $74,999 | 20 (3.9%) | 10 (2.7%) |
| $75,000 to $99,999 | 20 (3.9%) | 0 (0.0%) |
| $100,000+ | 189 (37.1%) | 0 (0.0%) |
| Total | 510 (100.0%) | 366 (100.0%) |
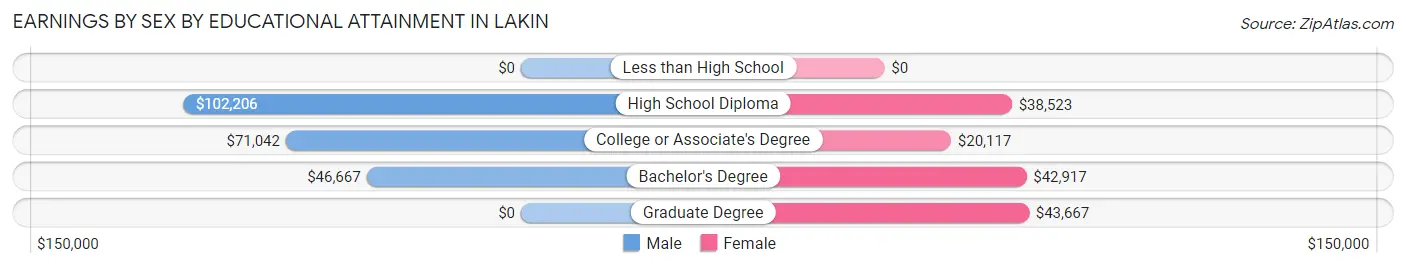
Earnings by Sex by Educational Attainment in Lakin
Average earnings in Lakin are $70,417 for men and $23,871 for women, a difference of 66.1%. Men with an educational attainment of high school diploma enjoy the highest average annual earnings of $102,206, while those with bachelor's degree education earn the least with $46,667. Women with an educational attainment of graduate degree earn the most with the average annual earnings of $43,667, while those with college or associate's degree education have the smallest earnings of $20,117.
| Educational Attainment | Male Income | Female Income |
| Less than High School | - | - |
| High School Diploma | $102,206 | $38,523 |
| College or Associate's Degree | $71,042 | $20,117 |
| Bachelor's Degree | $46,667 | $42,917 |
| Graduate Degree | - | - |
| Total | $70,417 | $23,871 |
Family Income in Lakin
Family Income Brackets in Lakin
According to the Lakin family income data, there are 113 families falling into the $100,000 to $149,999 income range, which is the most common income bracket and makes up 22.1% of all families.
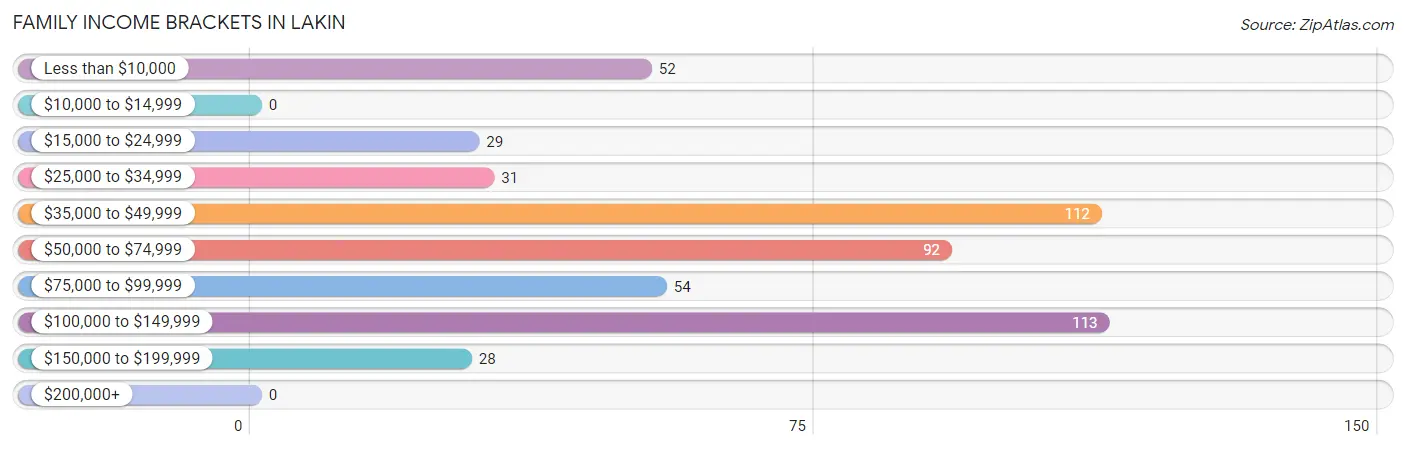
| Income Bracket | # Families | % Families |
| Less than $10,000 | 52 | 10.2% |
| $10,000 to $14,999 | 0 | 0.0% |
| $15,000 to $24,999 | 29 | 5.7% |
| $25,000 to $34,999 | 31 | 6.1% |
| $35,000 to $49,999 | 112 | 21.9% |
| $50,000 to $74,999 | 92 | 18.0% |
| $75,000 to $99,999 | 54 | 10.6% |
| $100,000 to $149,999 | 113 | 22.1% |
| $150,000 to $199,999 | 28 | 5.5% |
| $200,000+ | 0 | 0.0% |
Family Income by Famaliy Size in Lakin
2-person families (234 | 45.8%) account for the highest median family income in Lakin with $82,667 per family, while 2-person families (234 | 45.8%) have the highest median income of $41,334 per family member.
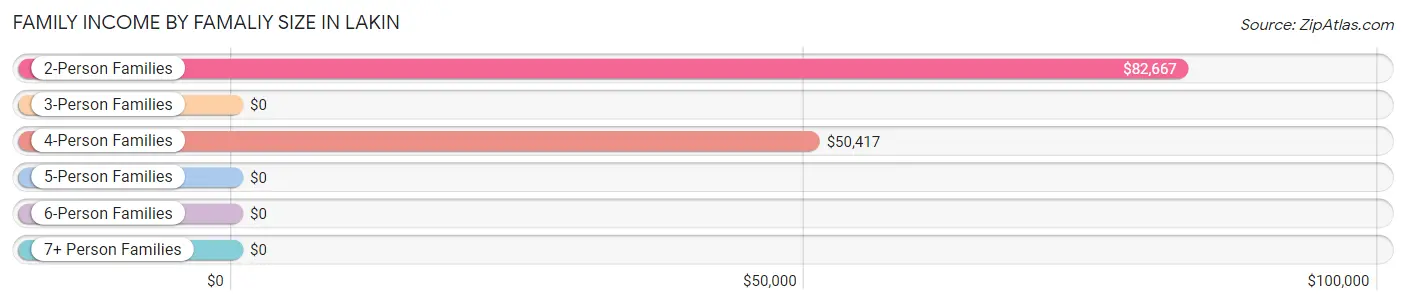
| Income Bracket | # Families | Median Income |
| 2-Person Families | 234 (45.8%) | $82,667 |
| 3-Person Families | 92 (18.0%) | $0 |
| 4-Person Families | 94 (18.4%) | $50,417 |
| 5-Person Families | 56 (11.0%) | $0 |
| 6-Person Families | 35 (6.9%) | $0 |
| 7+ Person Families | 0 (0.0%) | $0 |
| Total | 511 (100.0%) | $54,223 |
Family Income by Number of Earners in Lakin
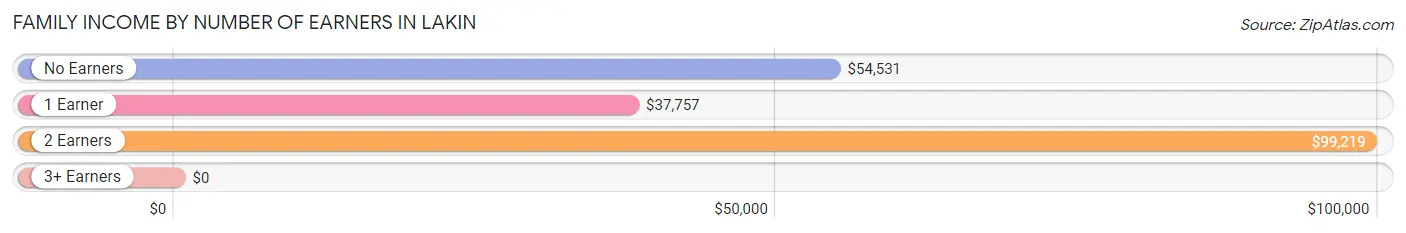
| Number of Earners | # Families | Median Income |
| No Earners | 66 (12.9%) | $54,531 |
| 1 Earner | 231 (45.2%) | $37,757 |
| 2 Earners | 211 (41.3%) | $99,219 |
| 3+ Earners | 3 (0.6%) | $0 |
| Total | 511 (100.0%) | $54,223 |
Household Income in Lakin
Household Income Brackets in Lakin
With 161 households falling in the category, the $100,000 to $149,999 income range is the most frequent in Lakin, accounting for 22.9% of all households.
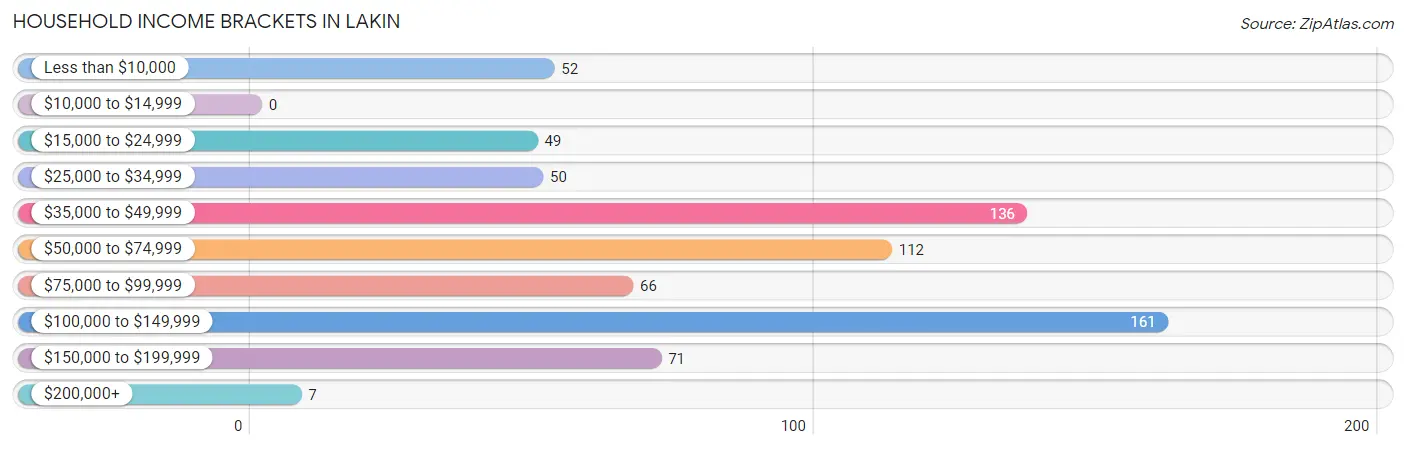
| Income Bracket | # Households | % Households |
| Less than $10,000 | 52 | 7.4% |
| $10,000 to $14,999 | 0 | 0.0% |
| $15,000 to $24,999 | 49 | 7.0% |
| $25,000 to $34,999 | 50 | 7.1% |
| $35,000 to $49,999 | 136 | 19.3% |
| $50,000 to $74,999 | 112 | 15.9% |
| $75,000 to $99,999 | 66 | 9.4% |
| $100,000 to $149,999 | 161 | 22.9% |
| $150,000 to $199,999 | 71 | 10.1% |
| $200,000+ | 7 | 1.0% |
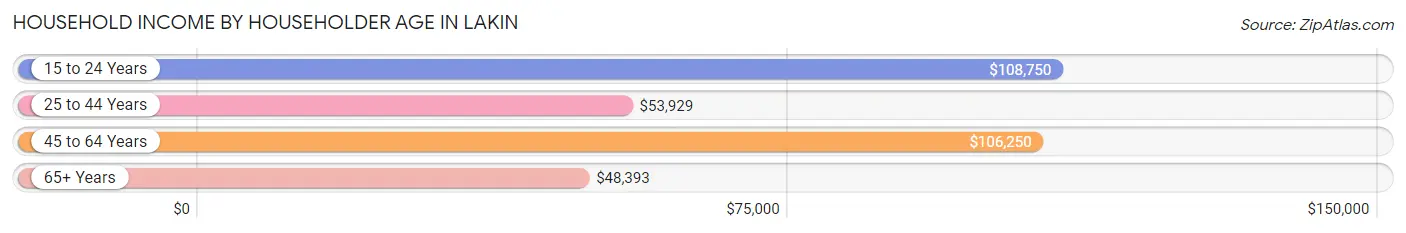
Household Income by Householder Age in Lakin
The median household income in Lakin is $58,846, with the highest median household income of $108,750 found in the 15 to 24 years age bracket for the primary householder. A total of 44 households (6.2%) fall into this category. Meanwhile, the 65+ years age bracket for the primary householder has the lowest median household income of $48,393, with 218 households (31.0%) in this group.
| Income Bracket | # Households | Median Income |
| 15 to 24 Years | 44 (6.2%) | $108,750 |
| 25 to 44 Years | 230 (32.7%) | $53,929 |
| 45 to 64 Years | 212 (30.1%) | $106,250 |
| 65+ Years | 218 (31.0%) | $48,393 |
| Total | 704 (100.0%) | $58,846 |
Poverty in Lakin
Income Below Poverty by Sex and Age in Lakin
With 11.0% poverty level for males and 26.5% for females among the residents of Lakin, 6 to 11 year old males and 6 to 11 year old females are the most vulnerable to poverty, with 56 males (100.0%) and 68 females (54.0%) in their respective age groups living below the poverty level.
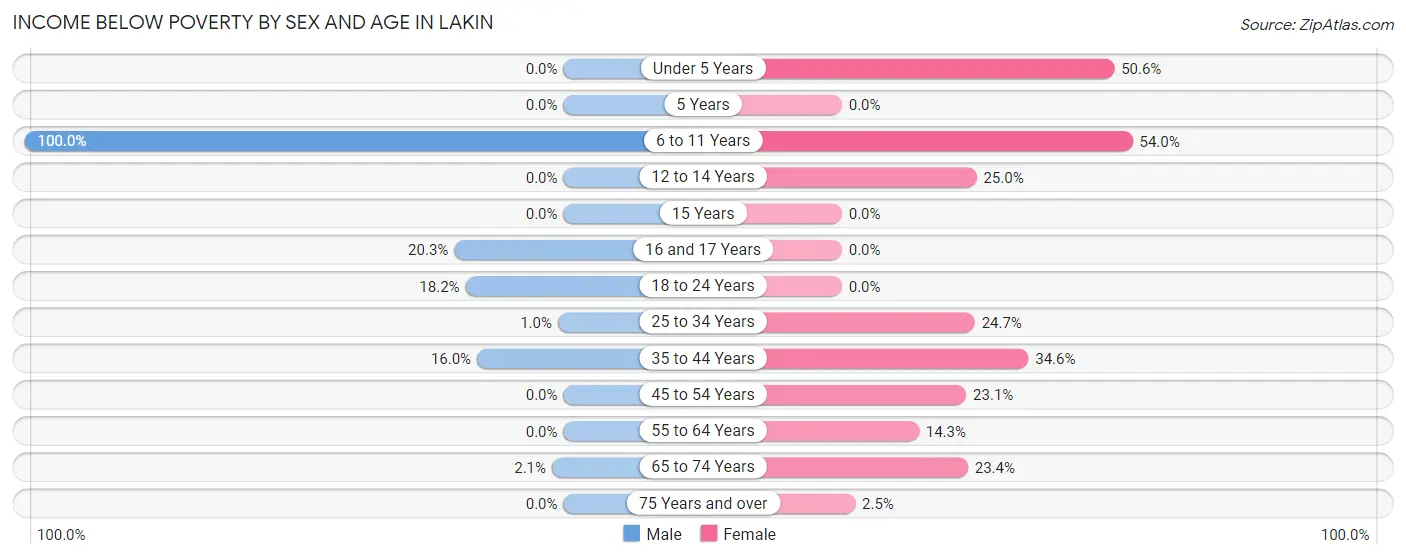
| Age Bracket | Male | Female |
| Under 5 Years | 0 (0.0%) | 45 (50.6%) |
| 5 Years | 0 (0.0%) | 0 (0.0%) |
| 6 to 11 Years | 56 (100.0%) | 68 (54.0%) |
| 12 to 14 Years | 0 (0.0%) | 17 (25.0%) |
| 15 Years | 0 (0.0%) | 0 (0.0%) |
| 16 and 17 Years | 15 (20.3%) | 0 (0.0%) |
| 18 to 24 Years | 22 (18.2%) | 0 (0.0%) |
| 25 to 34 Years | 1 (1.0%) | 37 (24.7%) |
| 35 to 44 Years | 17 (16.0%) | 36 (34.6%) |
| 45 to 54 Years | 0 (0.0%) | 15 (23.1%) |
| 55 to 64 Years | 0 (0.0%) | 10 (14.3%) |
| 65 to 74 Years | 1 (2.1%) | 29 (23.4%) |
| 75 Years and over | 0 (0.0%) | 2 (2.5%) |
| Total | 112 (11.0%) | 259 (26.5%) |
Income Above Poverty by Sex and Age in Lakin
According to the poverty statistics in Lakin, males aged under 5 years and females aged 16 and 17 years are the age groups that are most secure financially, with 100.0% of males and 100.0% of females in these age groups living above the poverty line.
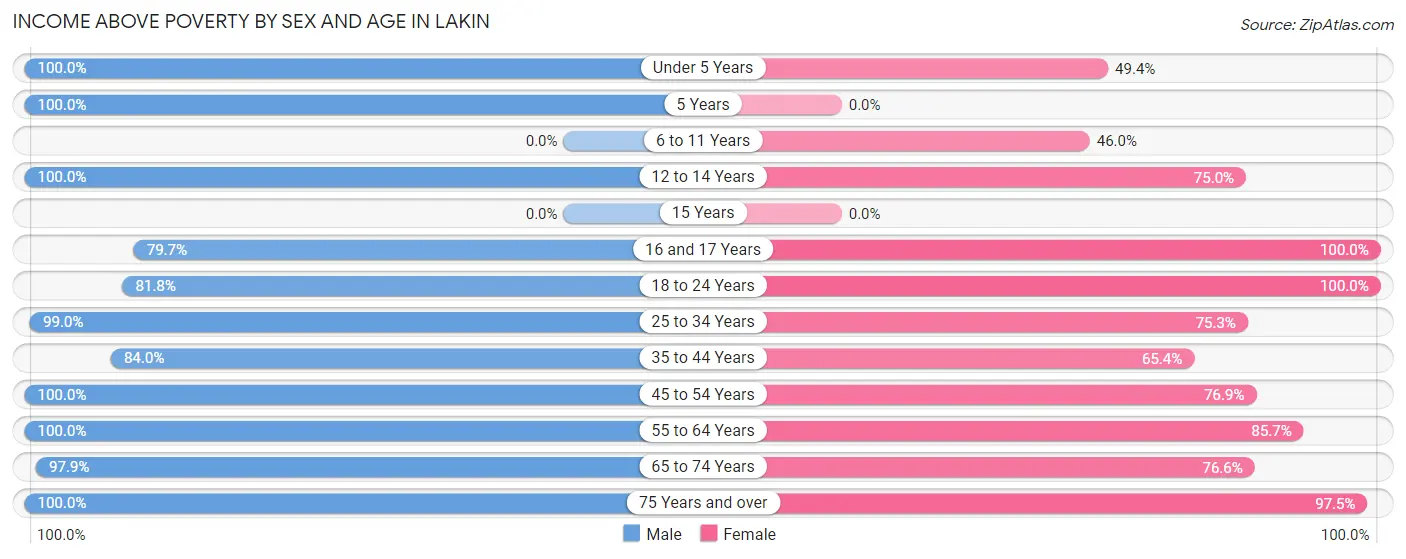
| Age Bracket | Male | Female |
| Under 5 Years | 62 (100.0%) | 44 (49.4%) |
| 5 Years | 36 (100.0%) | 0 (0.0%) |
| 6 to 11 Years | 0 (0.0%) | 58 (46.0%) |
| 12 to 14 Years | 136 (100.0%) | 51 (75.0%) |
| 15 Years | 0 (0.0%) | 0 (0.0%) |
| 16 and 17 Years | 59 (79.7%) | 31 (100.0%) |
| 18 to 24 Years | 99 (81.8%) | 71 (100.0%) |
| 25 to 34 Years | 96 (99.0%) | 113 (75.3%) |
| 35 to 44 Years | 89 (84.0%) | 68 (65.4%) |
| 45 to 54 Years | 75 (100.0%) | 50 (76.9%) |
| 55 to 64 Years | 168 (100.0%) | 60 (85.7%) |
| 65 to 74 Years | 46 (97.9%) | 95 (76.6%) |
| 75 Years and over | 38 (100.0%) | 79 (97.5%) |
| Total | 904 (89.0%) | 720 (73.5%) |
Income Below Poverty Among Married-Couple Families in Lakin
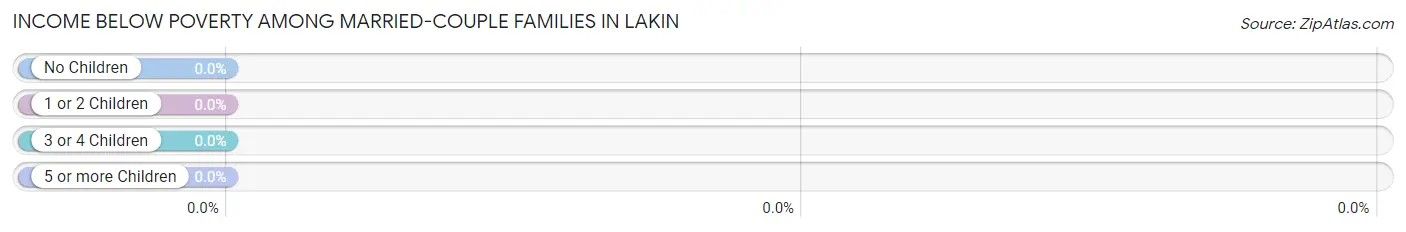
| Children | Above Poverty | Below Poverty |
| No Children | 167 (100.0%) | 0 (0.0%) |
| 1 or 2 Children | 125 (100.0%) | 0 (0.0%) |
| 3 or 4 Children | 21 (100.0%) | 0 (0.0%) |
| 5 or more Children | 0 (0.0%) | 0 (0.0%) |
| Total | 313 (100.0%) | 0 (0.0%) |
Income Below Poverty Among Single-Parent Households in Lakin
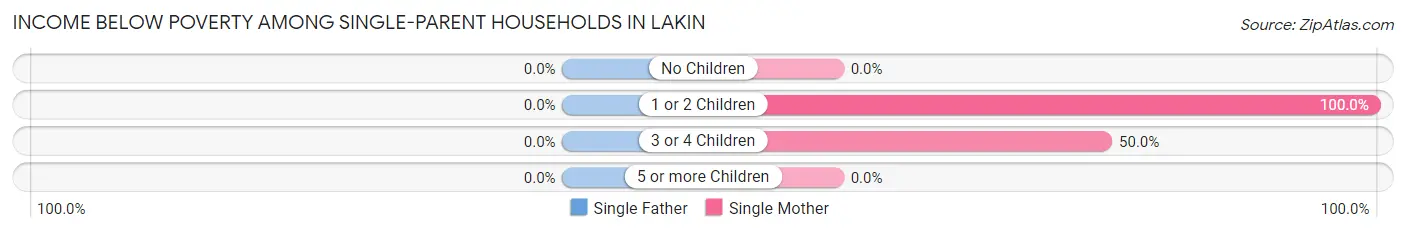
| Children | Single Father | Single Mother |
| No Children | 0 (0.0%) | 0 (0.0%) |
| 1 or 2 Children | 0 (0.0%) | 52 (100.0%) |
| 3 or 4 Children | 0 (0.0%) | 29 (50.0%) |
| 5 or more Children | 0 (0.0%) | 0 (0.0%) |
| Total | 0 (0.0%) | 81 (65.3%) |
Income Below Poverty Among Married-Couple vs Single-Parent Households in Lakin
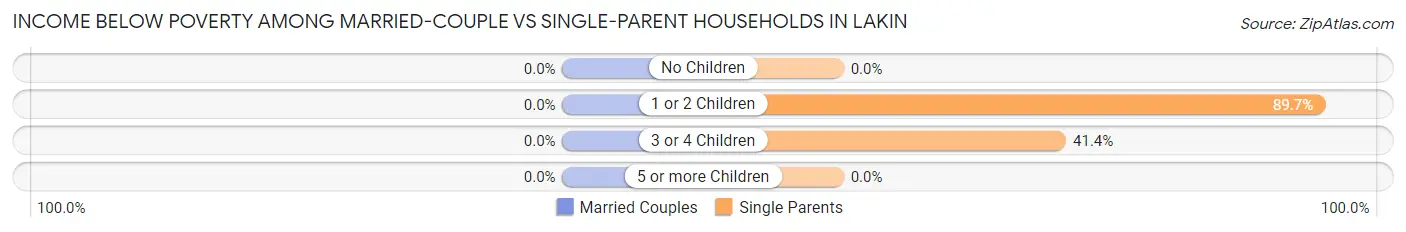
| Children | Married-Couple Families | Single-Parent Households |
| No Children | 0 (0.0%) | 0 (0.0%) |
| 1 or 2 Children | 0 (0.0%) | 52 (89.7%) |
| 3 or 4 Children | 0 (0.0%) | 29 (41.4%) |
| 5 or more Children | 0 (0.0%) | 0 (0.0%) |
| Total | 0 (0.0%) | 81 (40.9%) |
Race in Lakin
The most populous races in Lakin are White / Caucasian (1,594 | 77.1%), Hispanic or Latino (744 | 36.0%), and Some other Race (211 | 10.2%).
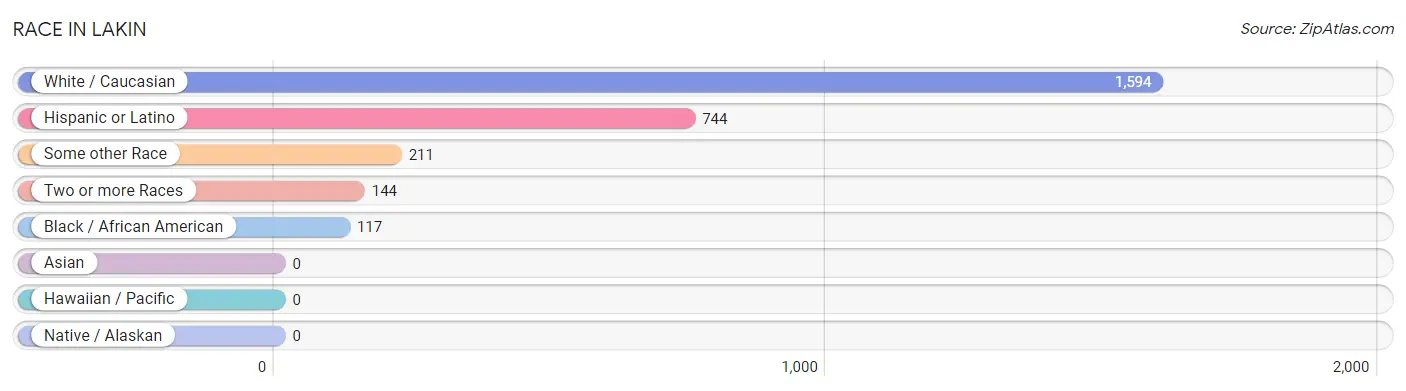
| Race | # Population | % Population |
| Asian | 0 | 0.0% |
| Black / African American | 117 | 5.7% |
| Hawaiian / Pacific | 0 | 0.0% |
| Hispanic or Latino | 744 | 36.0% |
| Native / Alaskan | 0 | 0.0% |
| White / Caucasian | 1,594 | 77.1% |
| Two or more Races | 144 | 7.0% |
| Some other Race | 211 | 10.2% |
| Total | 2,066 | 100.0% |
Ancestry in Lakin
The most populous ancestries reported in Lakin are Mexican (636 | 30.8%), German (277 | 13.4%), English (180 | 8.7%), Irish (177 | 8.6%), and American (30 | 1.5%), together accounting for 62.9% of all Lakin residents.
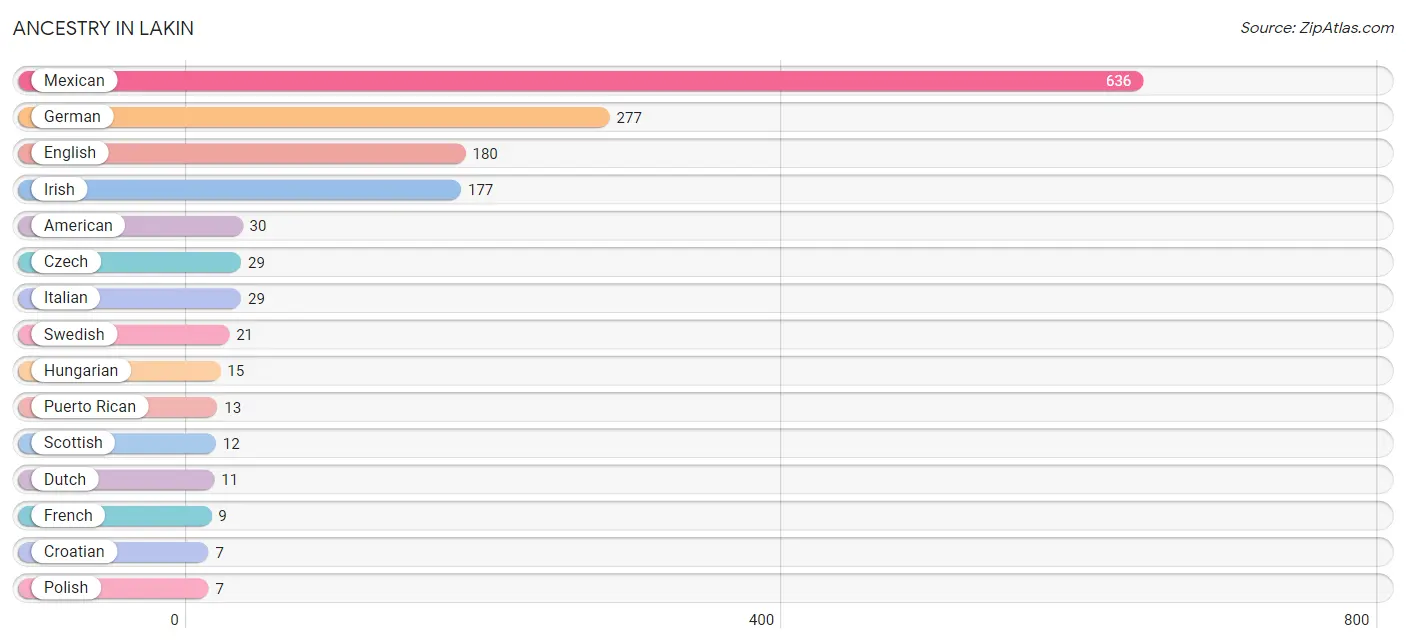
| Ancestry | # Population | % Population |
| American | 30 | 1.5% |
| Austrian | 4 | 0.2% |
| Croatian | 7 | 0.3% |
| Cuban | 1 | 0.1% |
| Czech | 29 | 1.4% |
| Danish | 2 | 0.1% |
| Dutch | 11 | 0.5% |
| English | 180 | 8.7% |
| European | 4 | 0.2% |
| French | 9 | 0.4% |
| German | 277 | 13.4% |
| Hungarian | 15 | 0.7% |
| Irish | 177 | 8.6% |
| Italian | 29 | 1.4% |
| Mexican | 636 | 30.8% |
| Polish | 7 | 0.3% |
| Puerto Rican | 13 | 0.6% |
| Scottish | 12 | 0.6% |
| Swedish | 21 | 1.0% | View All 19 Rows |
Immigrants in Lakin
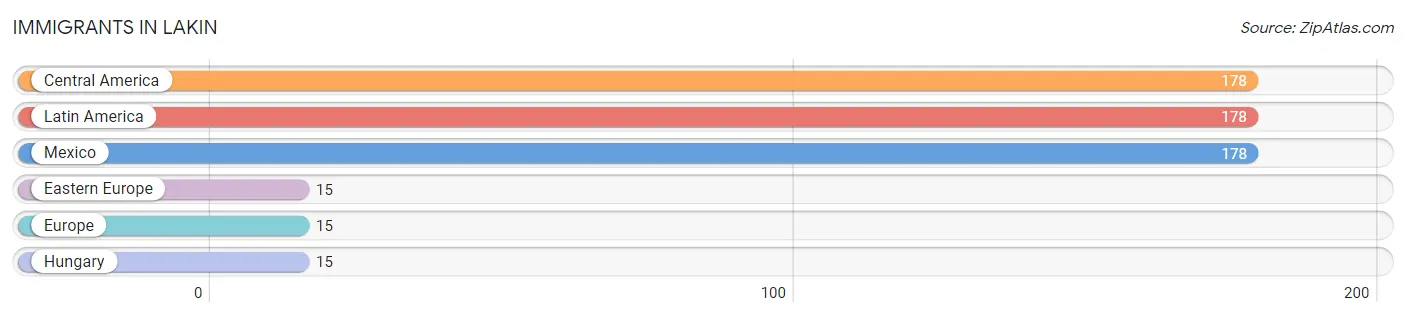
The most numerous immigrant groups reported in Lakin came from Central America (178 | 8.6%), Latin America (178 | 8.6%), Mexico (178 | 8.6%), Eastern Europe (15 | 0.7%), and Europe (15 | 0.7%), together accounting for 27.3% of all Lakin residents.
| Immigration Origin | # Population | % Population |
| Central America | 178 | 8.6% |
| Eastern Europe | 15 | 0.7% |
| Europe | 15 | 0.7% |
| Hungary | 15 | 0.7% |
| Latin America | 178 | 8.6% |
| Mexico | 178 | 8.6% | View All 6 Rows |
Sex and Age in Lakin
Sex and Age in Lakin
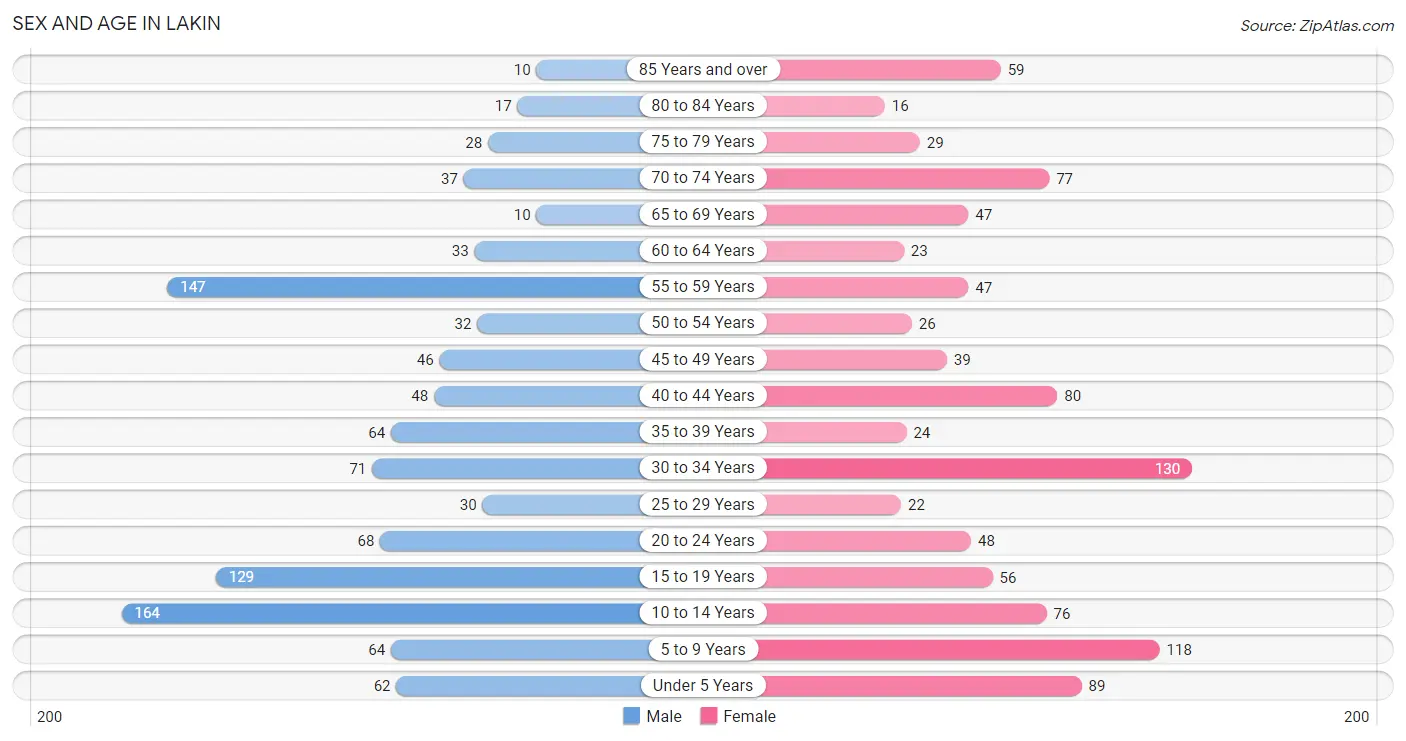
The most populous age groups in Lakin are 10 to 14 Years (164 | 15.5%) for men and 30 to 34 Years (130 | 12.9%) for women.
| Age Bracket | Male | Female |
| Under 5 Years | 62 (5.9%) | 89 (8.8%) |
| 5 to 9 Years | 64 (6.0%) | 118 (11.7%) |
| 10 to 14 Years | 164 (15.5%) | 76 (7.5%) |
| 15 to 19 Years | 129 (12.2%) | 56 (5.6%) |
| 20 to 24 Years | 68 (6.4%) | 48 (4.8%) |
| 25 to 29 Years | 30 (2.8%) | 22 (2.2%) |
| 30 to 34 Years | 71 (6.7%) | 130 (12.9%) |
| 35 to 39 Years | 64 (6.0%) | 24 (2.4%) |
| 40 to 44 Years | 48 (4.5%) | 80 (8.0%) |
| 45 to 49 Years | 46 (4.3%) | 39 (3.9%) |
| 50 to 54 Years | 32 (3.0%) | 26 (2.6%) |
| 55 to 59 Years | 147 (13.9%) | 47 (4.7%) |
| 60 to 64 Years | 33 (3.1%) | 23 (2.3%) |
| 65 to 69 Years | 10 (0.9%) | 47 (4.7%) |
| 70 to 74 Years | 37 (3.5%) | 77 (7.6%) |
| 75 to 79 Years | 28 (2.6%) | 29 (2.9%) |
| 80 to 84 Years | 17 (1.6%) | 16 (1.6%) |
| 85 Years and over | 10 (0.9%) | 59 (5.9%) |
| Total | 1,060 (100.0%) | 1,006 (100.0%) |
Families and Households in Lakin
Median Family Size in Lakin
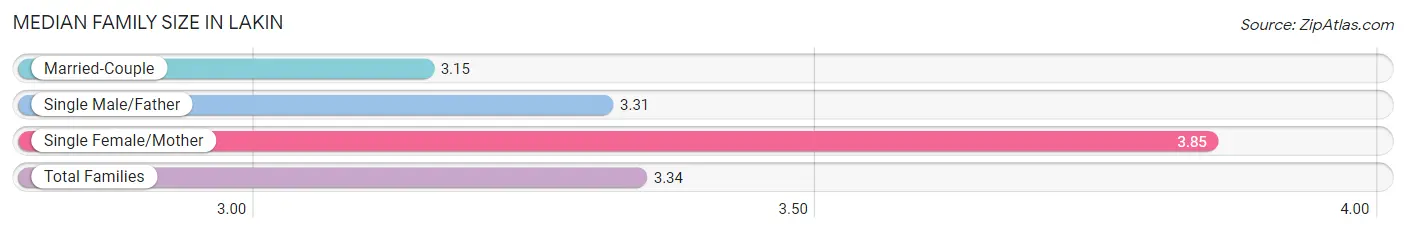
The median family size in Lakin is 3.34 persons per family, with single female/mother families (124 | 24.3%) accounting for the largest median family size of 3.85 persons per family. On the other hand, married-couple families (313 | 61.3%) represent the smallest median family size with 3.15 persons per family.
| Family Type | # Families | Family Size |
| Married-Couple | 313 (61.3%) | 3.15 |
| Single Male/Father | 74 (14.5%) | 3.31 |
| Single Female/Mother | 124 (24.3%) | 3.85 |
| Total Families | 511 (100.0%) | 3.34 |
Median Household Size in Lakin
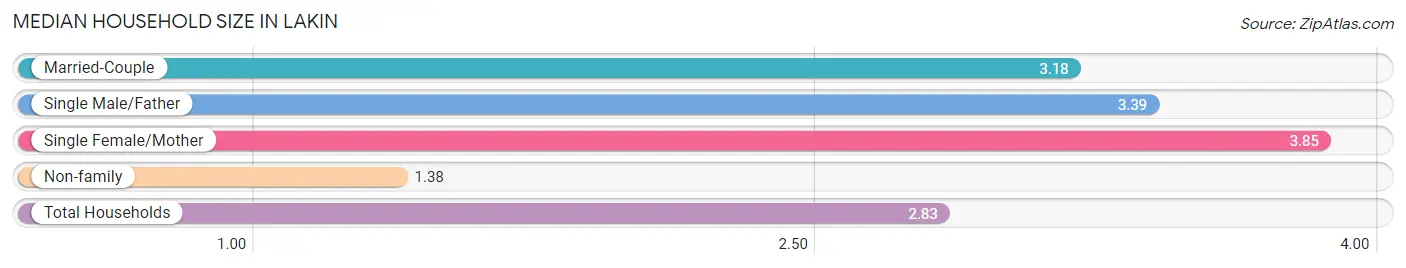
The median household size in Lakin is 2.83 persons per household, with single female/mother households (124 | 17.6%) accounting for the largest median household size of 3.85 persons per household. non-family households (193 | 27.4%) represent the smallest median household size with 1.38 persons per household.
| Household Type | # Households | Household Size |
| Married-Couple | 313 (44.5%) | 3.18 |
| Single Male/Father | 74 (10.5%) | 3.39 |
| Single Female/Mother | 124 (17.6%) | 3.85 |
| Non-family | 193 (27.4%) | 1.38 |
| Total Households | 704 (100.0%) | 2.83 |
Household Size by Marriage Status in Lakin
Out of a total of 704 households in Lakin, 511 (72.6%) are family households, while 193 (27.4%) are nonfamily households. The most numerous type of family households are 2-person households, comprising 234, and the most common type of nonfamily households are 1-person households, comprising 160.
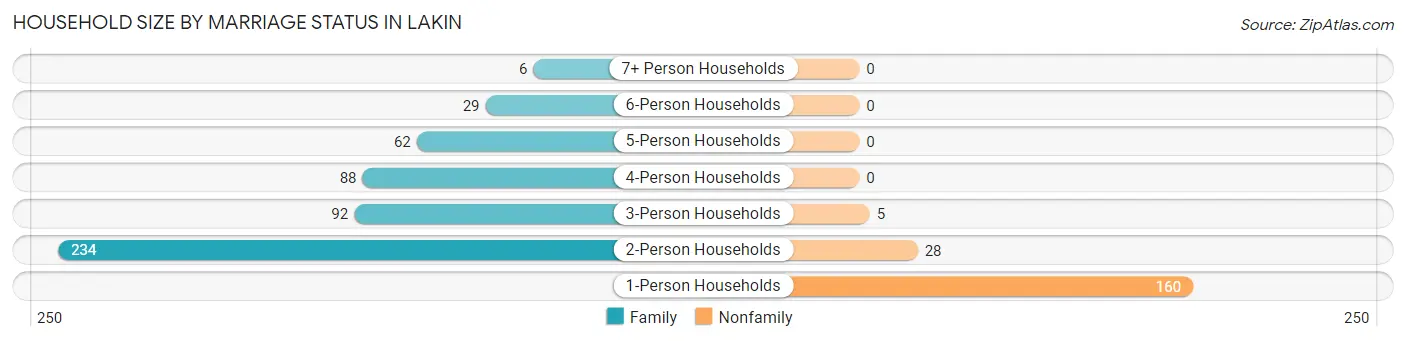
| Household Size | Family Households | Nonfamily Households |
| 1-Person Households | - | 160 (22.7%) |
| 2-Person Households | 234 (33.2%) | 28 (4.0%) |
| 3-Person Households | 92 (13.1%) | 5 (0.7%) |
| 4-Person Households | 88 (12.5%) | 0 (0.0%) |
| 5-Person Households | 62 (8.8%) | 0 (0.0%) |
| 6-Person Households | 29 (4.1%) | 0 (0.0%) |
| 7+ Person Households | 6 (0.9%) | 0 (0.0%) |
| Total | 511 (72.6%) | 193 (27.4%) |
Female Fertility in Lakin
Fertility by Age in Lakin
Average fertility rate in Lakin is 171.0 births per 1,000 women. Women in the age bracket of 20 to 34 years have the highest fertility rate with 355.0 births per 1,000 women. Women in the age bracket of 20 to 34 years acount for 100.0% of all women with births.
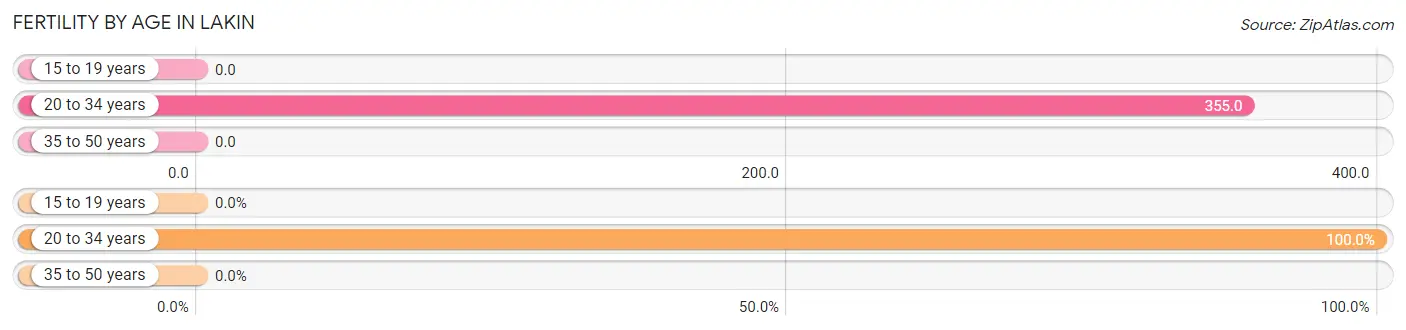
| Age Bracket | Women with Births | Births / 1,000 Women |
| 15 to 19 years | 0 (0.0%) | 0.0 |
| 20 to 34 years | 71 (100.0%) | 355.0 |
| 35 to 50 years | 0 (0.0%) | 0.0 |
| Total | 71 (100.0%) | 171.0 |
Fertility by Age by Marriage Status in Lakin
47.9% of women with births (71) in Lakin are married. The highest percentage of unmarried women with births falls into 20 to 34 years age bracket with 52.1% of them unmarried at the time of birth, while the lowest percentage of unmarried women with births belong to 20 to 34 years age bracket with 52.1% of them unmarried.
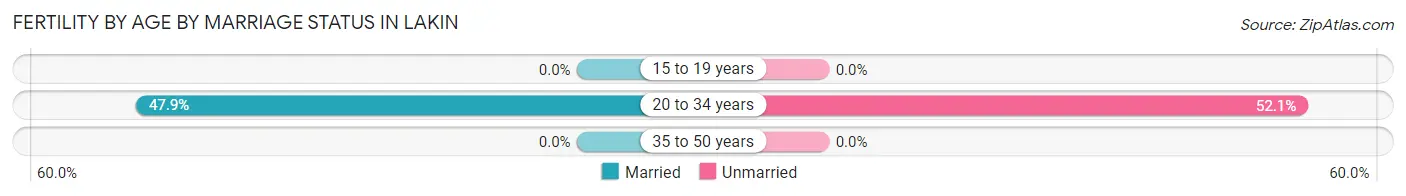
| Age Bracket | Married | Unmarried |
| 15 to 19 years | 0 (0.0%) | 0 (0.0%) |
| 20 to 34 years | 34 (47.9%) | 37 (52.1%) |
| 35 to 50 years | 0 (0.0%) | 0 (0.0%) |
| Total | 34 (47.9%) | 37 (52.1%) |
Fertility by Education in Lakin
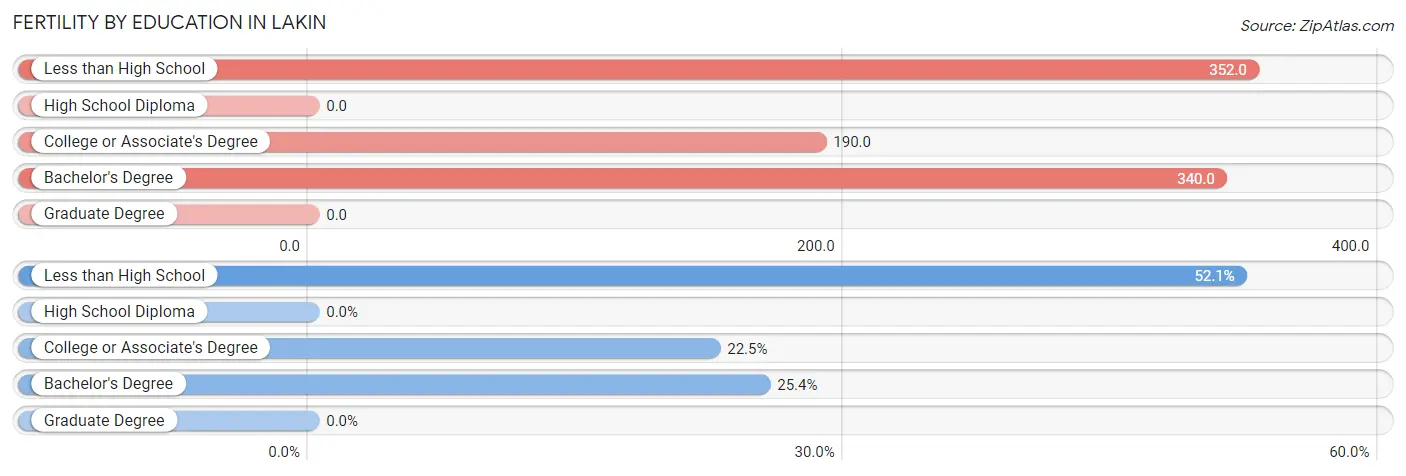
| Educational Attainment | Women with Births | Births / 1,000 Women |
| Less than High School | 37 (52.1%) | 352.0 |
| High School Diploma | 0 (0.0%) | 0.0 |
| College or Associate's Degree | 16 (22.5%) | 190.0 |
| Bachelor's Degree | 18 (25.4%) | 340.0 |
| Graduate Degree | 0 (0.0%) | 0.0 |
| Total | 71 (100.0%) | 171.0 |
Fertility by Education by Marriage Status in Lakin
52.1% of women with births in Lakin are unmarried. Women with the educational attainment of college or associate's degree are most likely to be married with 100.0% of them married at childbirth, while women with the educational attainment of less than high school are least likely to be married with 100.0% of them unmarried at childbirth.
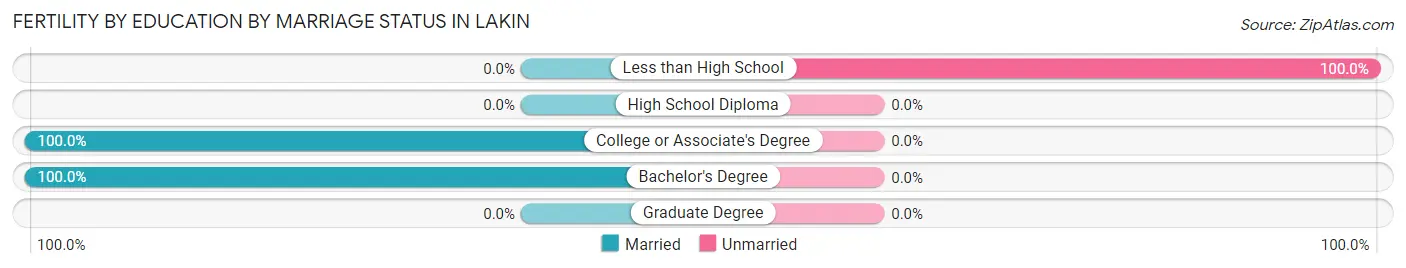
| Educational Attainment | Married | Unmarried |
| Less than High School | 0 (0.0%) | 37 (100.0%) |
| High School Diploma | 0 (0.0%) | 0 (0.0%) |
| College or Associate's Degree | 16 (100.0%) | 0 (0.0%) |
| Bachelor's Degree | 18 (100.0%) | 0 (0.0%) |
| Graduate Degree | 0 (0.0%) | 0 (0.0%) |
| Total | 34 (47.9%) | 37 (52.1%) |
Employment Characteristics in Lakin
Employment by Class of Employer in Lakin
Among the 788 employed individuals in Lakin, private company employees (511 | 64.8%), self-employed (not incorporated) (129 | 16.4%), and state government employees (69 | 8.8%) make up the most common classes of employment.
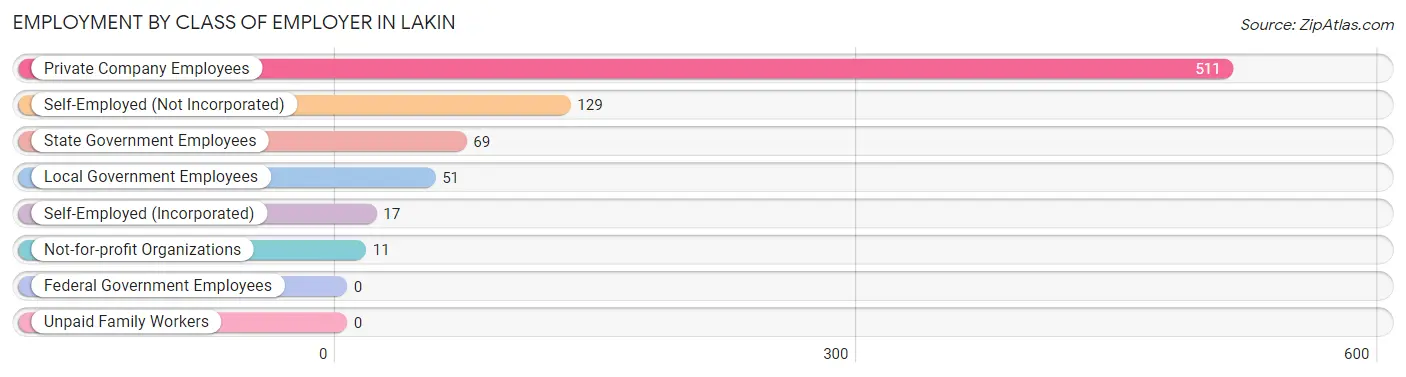
| Employer Class | # Employees | % Employees |
| Private Company Employees | 511 | 64.8% |
| Self-Employed (Incorporated) | 17 | 2.2% |
| Self-Employed (Not Incorporated) | 129 | 16.4% |
| Not-for-profit Organizations | 11 | 1.4% |
| Local Government Employees | 51 | 6.5% |
| State Government Employees | 69 | 8.8% |
| Federal Government Employees | 0 | 0.0% |
| Unpaid Family Workers | 0 | 0.0% |
| Total | 788 | 100.0% |
Employment Status by Age in Lakin
According to the labor force statistics for Lakin, out of the total population over 16 years of age (1,493), 55.5% or 829 individuals are in the labor force, with 4.7% or 39 of them unemployed. The age group with the highest labor force participation rate is 30 to 34 years, with 91.5% or 184 individuals in the labor force. Within the labor force, the 16 to 19 years age range has the highest percentage of unemployed individuals, with 21.8% or 17 of them being unemployed.
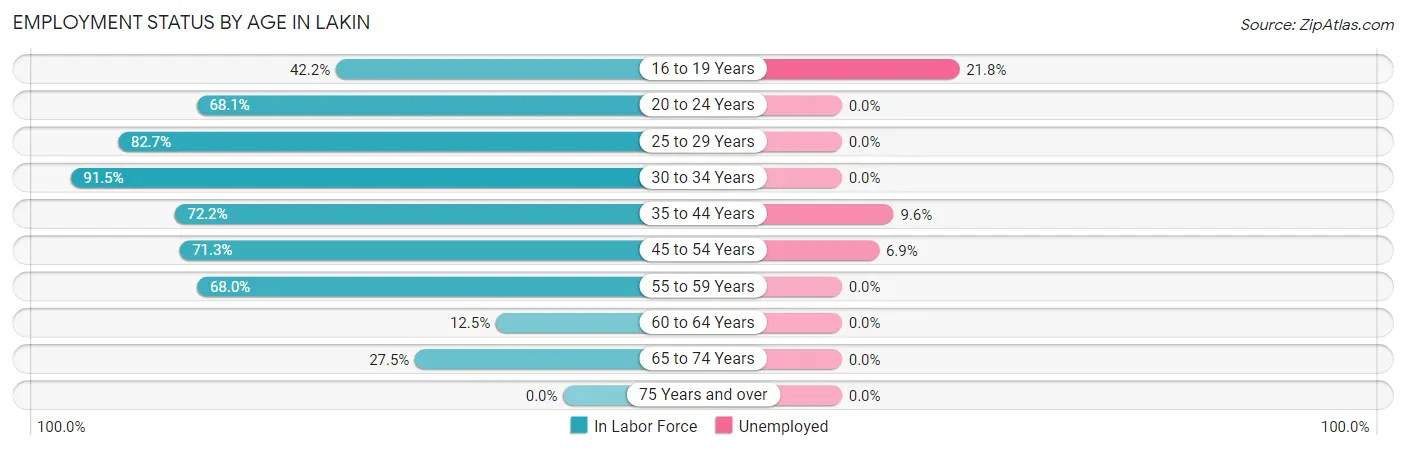
| Age Bracket | In Labor Force | Unemployed |
| 16 to 19 Years | 78 (42.2%) | 17 (21.8%) |
| 20 to 24 Years | 79 (68.1%) | 0 (0.0%) |
| 25 to 29 Years | 43 (82.7%) | 0 (0.0%) |
| 30 to 34 Years | 184 (91.5%) | 0 (0.0%) |
| 35 to 44 Years | 156 (72.2%) | 15 (9.6%) |
| 45 to 54 Years | 102 (71.3%) | 7 (6.9%) |
| 55 to 59 Years | 132 (68.0%) | 0 (0.0%) |
| 60 to 64 Years | 7 (12.5%) | 0 (0.0%) |
| 65 to 74 Years | 47 (27.5%) | 0 (0.0%) |
| 75 Years and over | 0 (0.0%) | 0 (0.0%) |
| Total | 829 (55.5%) | 39 (4.7%) |
Employment Status by Educational Attainment in Lakin
According to labor force statistics for Lakin, 72.4% of individuals (624) out of the total population between 25 and 64 years of age (862) are in the labor force, with 3.5% or 22 of them being unemployed. The group with the highest labor force participation rate are those with the educational attainment of college / associate degree, with 93.1% or 149 individuals in the labor force. Within the labor force, individuals with high school diploma education have the highest percentage of unemployment, with 7.3% or 22 of them being unemployed.
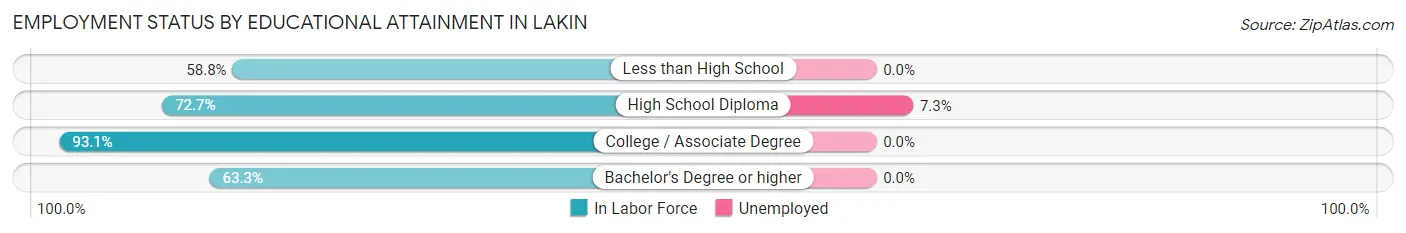
| Educational Attainment | In Labor Force | Unemployed |
| Less than High School | 110 (58.8%) | 0 (0.0%) |
| High School Diploma | 303 (72.7%) | 30 (7.3%) |
| College / Associate Degree | 149 (93.1%) | 0 (0.0%) |
| Bachelor's Degree or higher | 62 (63.3%) | 0 (0.0%) |
| Total | 624 (72.4%) | 30 (3.5%) |
Employment Occupations by Sex in Lakin
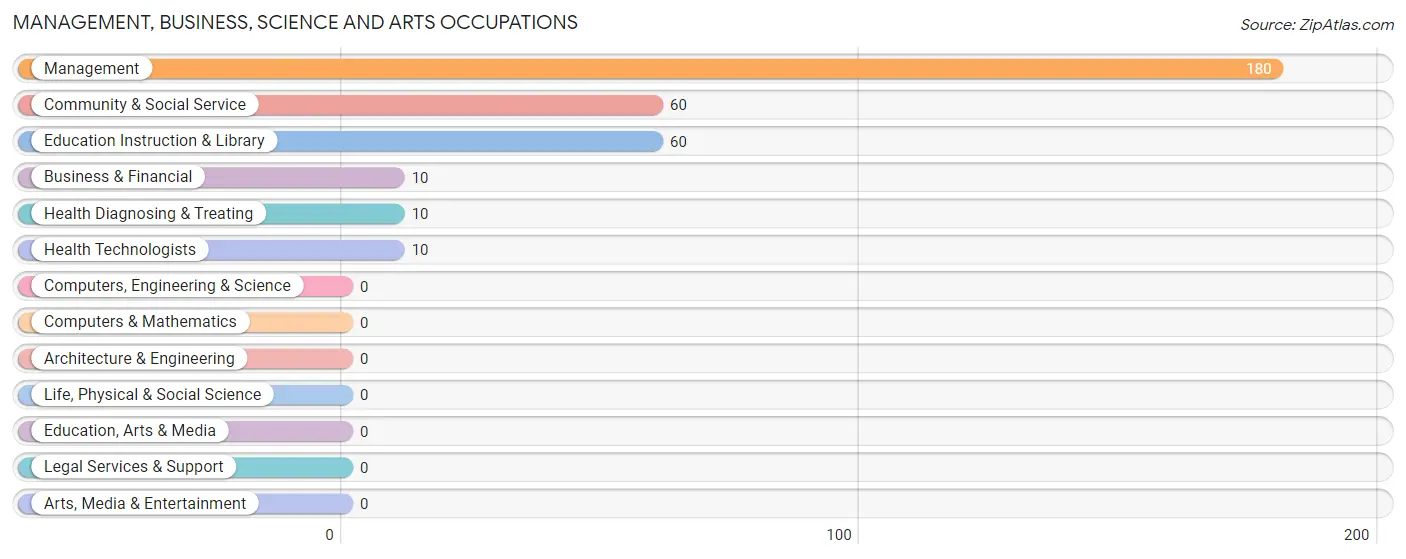
Management, Business, Science and Arts Occupations
The most common Management, Business, Science and Arts occupations in Lakin are Management (180 | 22.8%), Community & Social Service (60 | 7.6%), Education Instruction & Library (60 | 7.6%), Business & Financial (10 | 1.3%), and Health Diagnosing & Treating (10 | 1.3%).
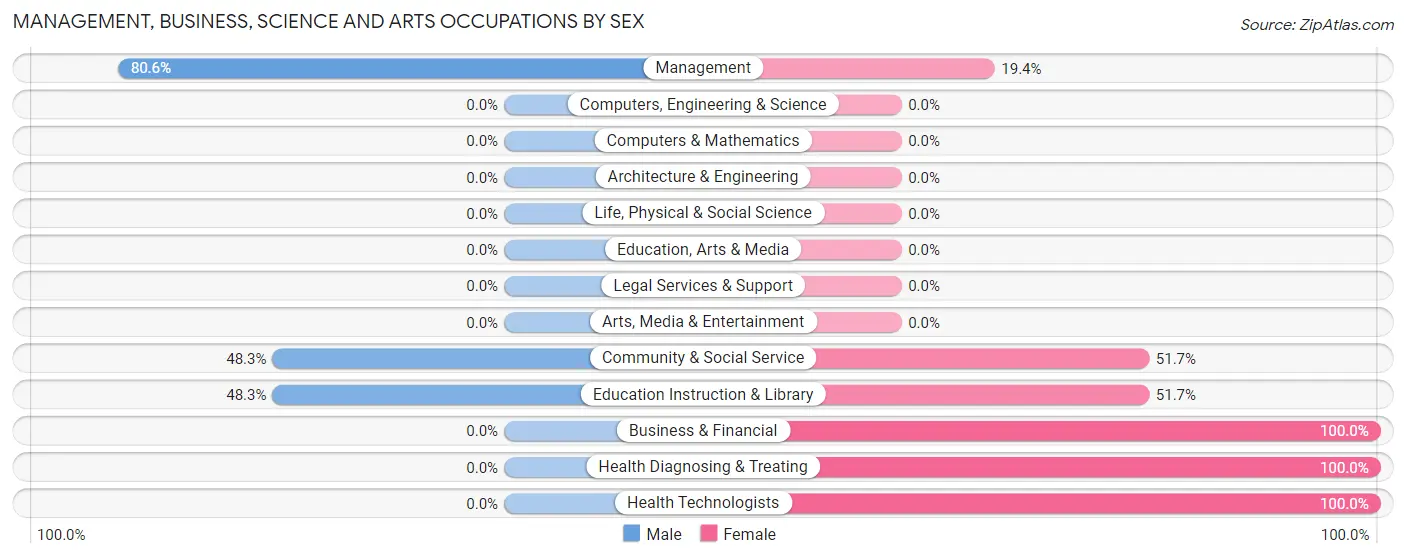
Management, Business, Science and Arts Occupations by Sex
Within the Management, Business, Science and Arts occupations in Lakin, the most male-oriented occupations are Management (80.6%), Community & Social Service (48.3%), and Education Instruction & Library (48.3%), while the most female-oriented occupations are Business & Financial (100.0%), Health Diagnosing & Treating (100.0%), and Health Technologists (100.0%).
| Occupation | Male | Female |
| Management | 145 (80.6%) | 35 (19.4%) |
| Business & Financial | 0 (0.0%) | 10 (100.0%) |
| Computers, Engineering & Science | 0 (0.0%) | 0 (0.0%) |
| Computers & Mathematics | 0 (0.0%) | 0 (0.0%) |
| Architecture & Engineering | 0 (0.0%) | 0 (0.0%) |
| Life, Physical & Social Science | 0 (0.0%) | 0 (0.0%) |
| Community & Social Service | 29 (48.3%) | 31 (51.7%) |
| Education, Arts & Media | 0 (0.0%) | 0 (0.0%) |
| Legal Services & Support | 0 (0.0%) | 0 (0.0%) |
| Education Instruction & Library | 29 (48.3%) | 31 (51.7%) |
| Arts, Media & Entertainment | 0 (0.0%) | 0 (0.0%) |
| Health Diagnosing & Treating | 0 (0.0%) | 10 (100.0%) |
| Health Technologists | 0 (0.0%) | 10 (100.0%) |
| Total (Category) | 174 (66.9%) | 86 (33.1%) |
| Total (Overall) | 494 (62.6%) | 295 (37.4%) |
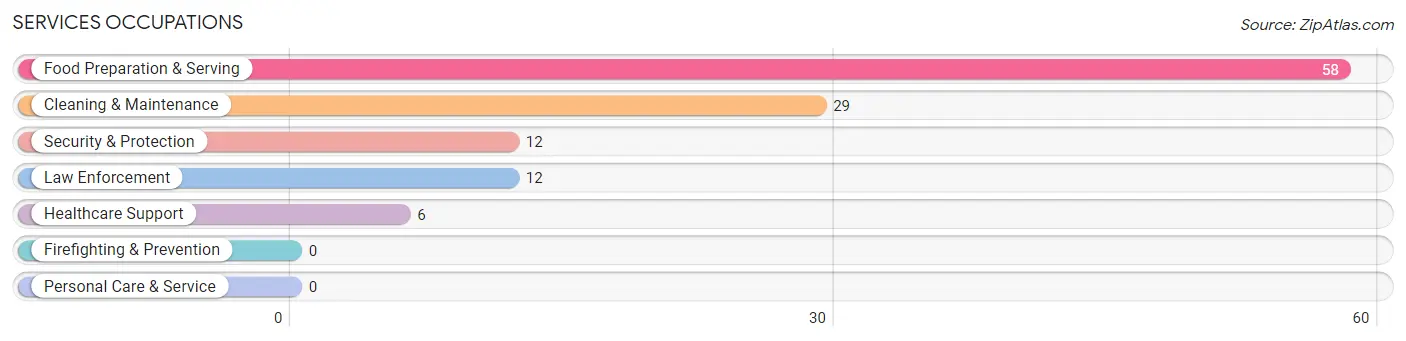
Services Occupations
The most common Services occupations in Lakin are Food Preparation & Serving (58 | 7.3%), Cleaning & Maintenance (29 | 3.7%), Security & Protection (12 | 1.5%), Law Enforcement (12 | 1.5%), and Healthcare Support (6 | 0.8%).
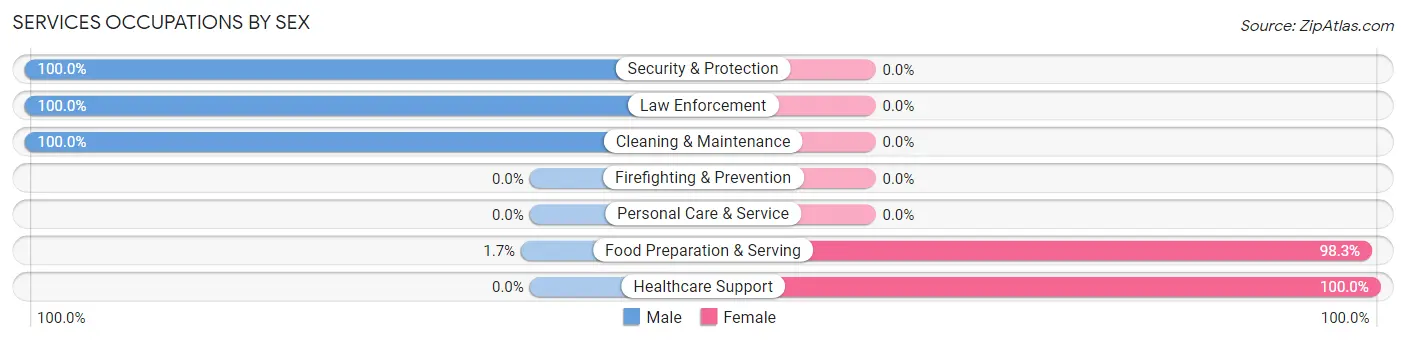
Services Occupations by Sex
Within the Services occupations in Lakin, the most male-oriented occupations are Security & Protection (100.0%), Law Enforcement (100.0%), and Cleaning & Maintenance (100.0%), while the most female-oriented occupations are Healthcare Support (100.0%), and Food Preparation & Serving (98.3%).
| Occupation | Male | Female |
| Healthcare Support | 0 (0.0%) | 6 (100.0%) |
| Security & Protection | 12 (100.0%) | 0 (0.0%) |
| Firefighting & Prevention | 0 (0.0%) | 0 (0.0%) |
| Law Enforcement | 12 (100.0%) | 0 (0.0%) |
| Food Preparation & Serving | 1 (1.7%) | 57 (98.3%) |
| Cleaning & Maintenance | 29 (100.0%) | 0 (0.0%) |
| Personal Care & Service | 0 (0.0%) | 0 (0.0%) |
| Total (Category) | 42 (40.0%) | 63 (60.0%) |
| Total (Overall) | 494 (62.6%) | 295 (37.4%) |
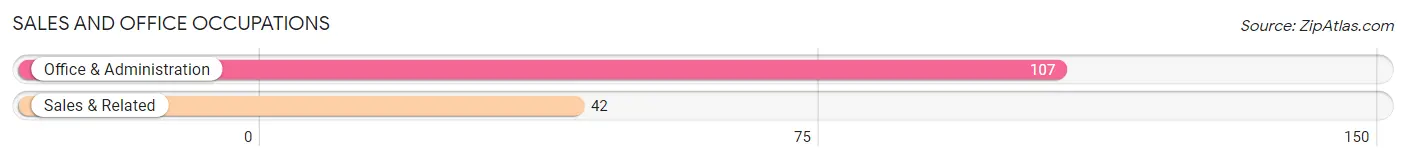
Sales and Office Occupations
The most common Sales and Office occupations in Lakin are Office & Administration (107 | 13.6%), and Sales & Related (42 | 5.3%).
Sales and Office Occupations by Sex
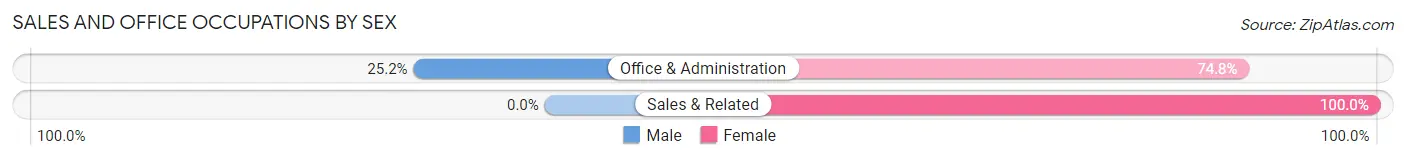
| Occupation | Male | Female |
| Sales & Related | 0 (0.0%) | 42 (100.0%) |
| Office & Administration | 27 (25.2%) | 80 (74.8%) |
| Total (Category) | 27 (18.1%) | 122 (81.9%) |
| Total (Overall) | 494 (62.6%) | 295 (37.4%) |
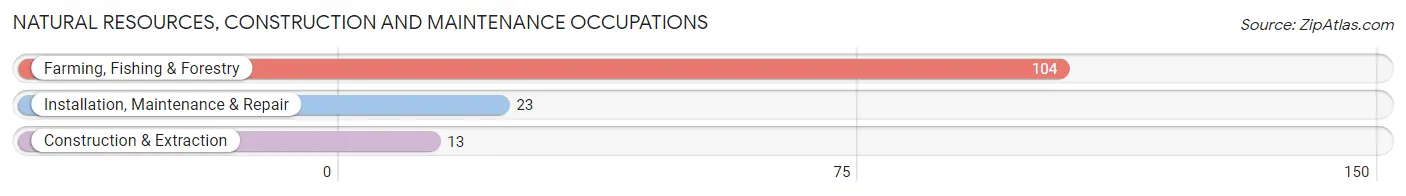
Natural Resources, Construction and Maintenance Occupations
The most common Natural Resources, Construction and Maintenance occupations in Lakin are Farming, Fishing & Forestry (104 | 13.2%), Installation, Maintenance & Repair (23 | 2.9%), and Construction & Extraction (13 | 1.7%).
Natural Resources, Construction and Maintenance Occupations by Sex
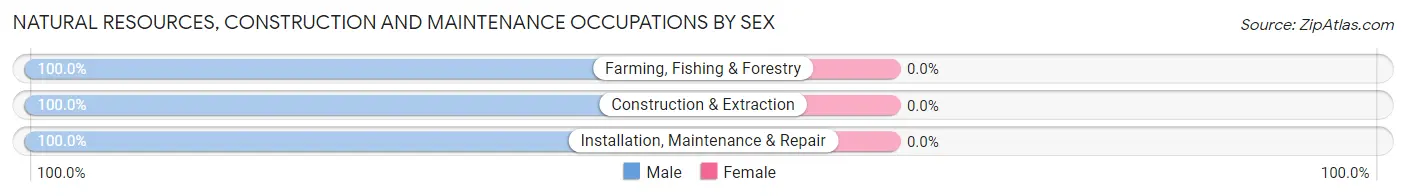
| Occupation | Male | Female |
| Farming, Fishing & Forestry | 104 (100.0%) | 0 (0.0%) |
| Construction & Extraction | 13 (100.0%) | 0 (0.0%) |
| Installation, Maintenance & Repair | 23 (100.0%) | 0 (0.0%) |
| Total (Category) | 140 (100.0%) | 0 (0.0%) |
| Total (Overall) | 494 (62.6%) | 295 (37.4%) |
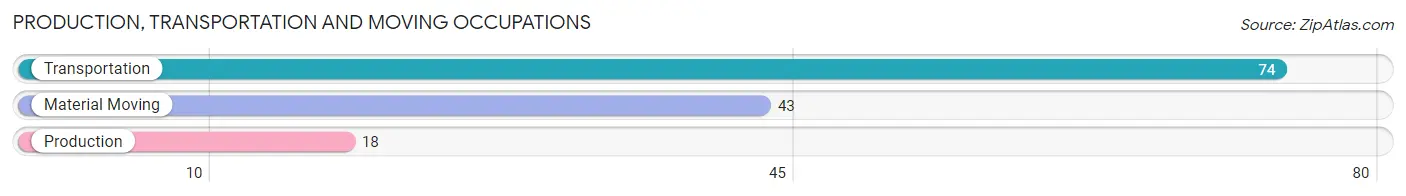
Production, Transportation and Moving Occupations
The most common Production, Transportation and Moving occupations in Lakin are Transportation (74 | 9.4%), Material Moving (43 | 5.4%), and Production (18 | 2.3%).
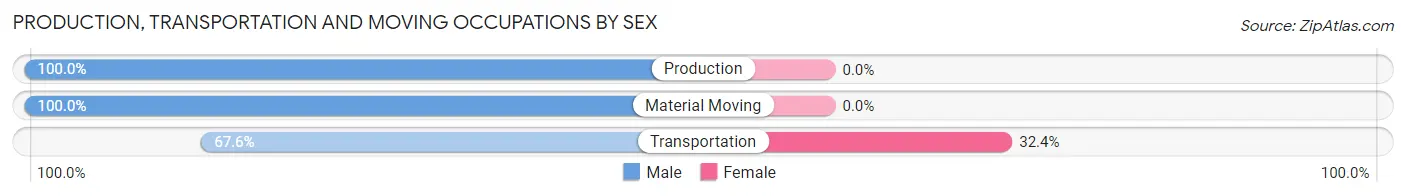
Production, Transportation and Moving Occupations by Sex
| Occupation | Male | Female |
| Production | 18 (100.0%) | 0 (0.0%) |
| Transportation | 50 (67.6%) | 24 (32.4%) |
| Material Moving | 43 (100.0%) | 0 (0.0%) |
| Total (Category) | 111 (82.2%) | 24 (17.8%) |
| Total (Overall) | 494 (62.6%) | 295 (37.4%) |
Employment Industries by Sex in Lakin
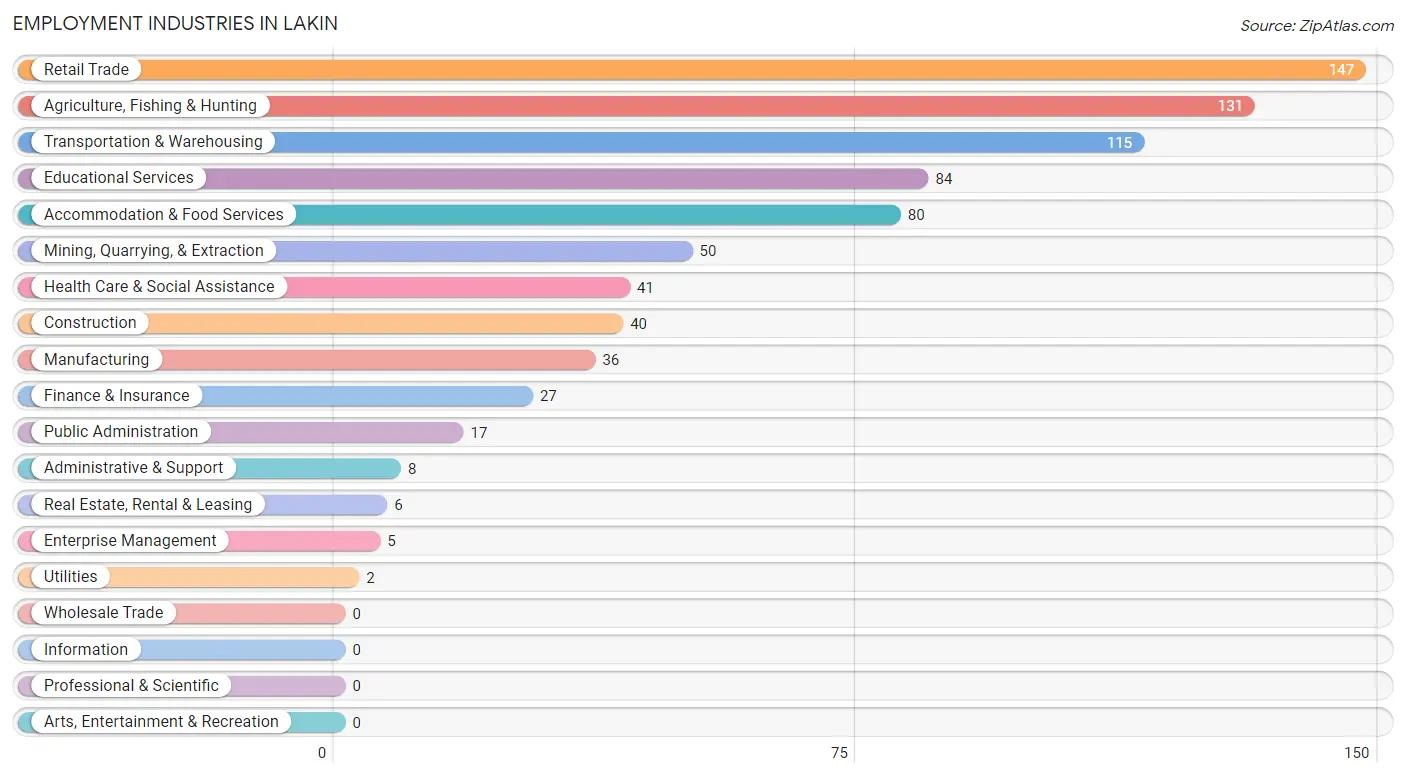
Employment Industries in Lakin
The major employment industries in Lakin include Retail Trade (147 | 18.6%), Agriculture, Fishing & Hunting (131 | 16.6%), Transportation & Warehousing (115 | 14.6%), Educational Services (84 | 10.6%), and Accommodation & Food Services (80 | 10.1%).
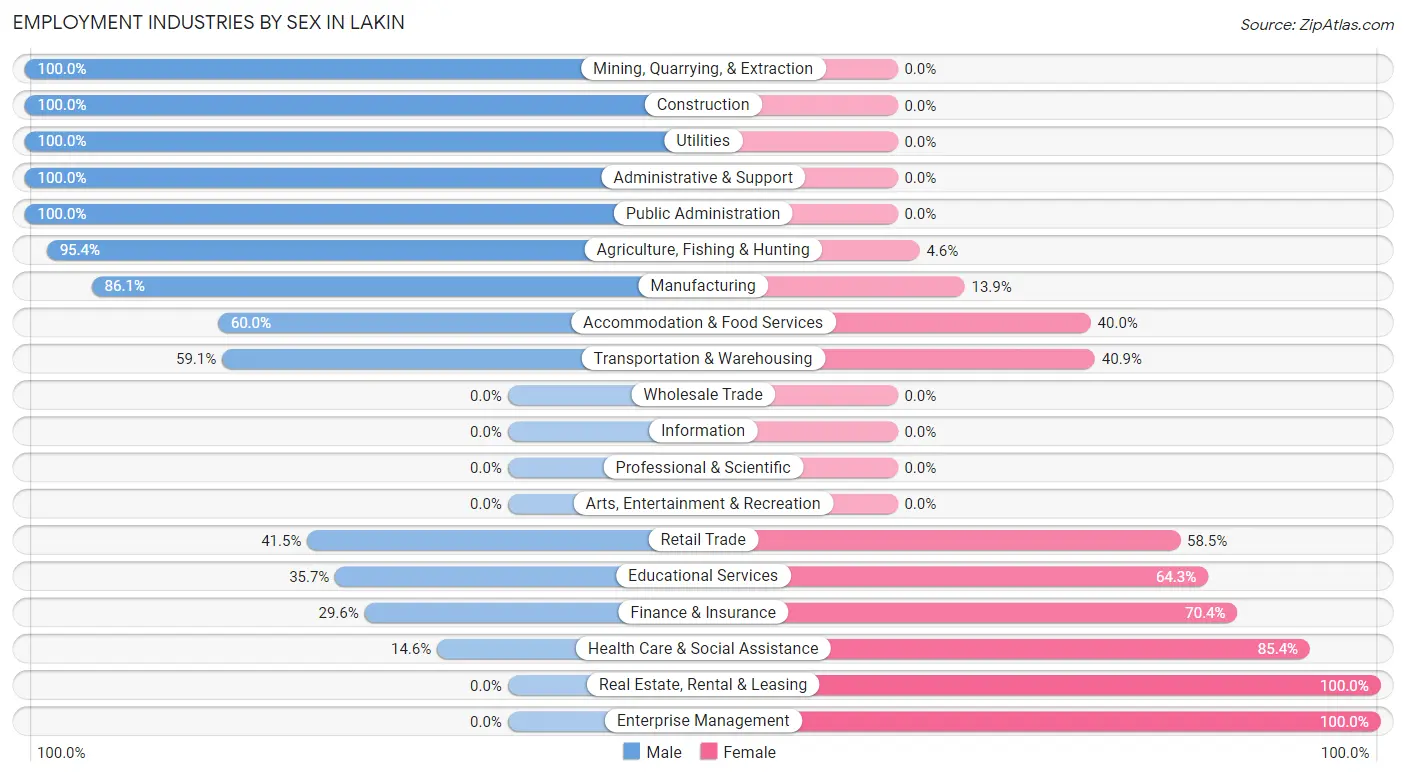
Employment Industries by Sex in Lakin
The Lakin industries that see more men than women are Mining, Quarrying, & Extraction (100.0%), Construction (100.0%), and Utilities (100.0%), whereas the industries that tend to have a higher number of women are Real Estate, Rental & Leasing (100.0%), Enterprise Management (100.0%), and Health Care & Social Assistance (85.4%).
| Industry | Male | Female |
| Agriculture, Fishing & Hunting | 125 (95.4%) | 6 (4.6%) |
| Mining, Quarrying, & Extraction | 50 (100.0%) | 0 (0.0%) |
| Construction | 40 (100.0%) | 0 (0.0%) |
| Manufacturing | 31 (86.1%) | 5 (13.9%) |
| Wholesale Trade | 0 (0.0%) | 0 (0.0%) |
| Retail Trade | 61 (41.5%) | 86 (58.5%) |
| Transportation & Warehousing | 68 (59.1%) | 47 (40.9%) |
| Utilities | 2 (100.0%) | 0 (0.0%) |
| Information | 0 (0.0%) | 0 (0.0%) |
| Finance & Insurance | 8 (29.6%) | 19 (70.4%) |
| Real Estate, Rental & Leasing | 0 (0.0%) | 6 (100.0%) |
| Professional & Scientific | 0 (0.0%) | 0 (0.0%) |
| Enterprise Management | 0 (0.0%) | 5 (100.0%) |
| Administrative & Support | 8 (100.0%) | 0 (0.0%) |
| Educational Services | 30 (35.7%) | 54 (64.3%) |
| Health Care & Social Assistance | 6 (14.6%) | 35 (85.4%) |
| Arts, Entertainment & Recreation | 0 (0.0%) | 0 (0.0%) |
| Accommodation & Food Services | 48 (60.0%) | 32 (40.0%) |
| Public Administration | 17 (100.0%) | 0 (0.0%) |
| Total | 494 (62.6%) | 295 (37.4%) |
Education in Lakin
School Enrollment in Lakin
The most common levels of schooling among the 596 students in Lakin are high school (201 | 33.7%), middle school (162 | 27.2%), and elementary school (118 | 19.8%).
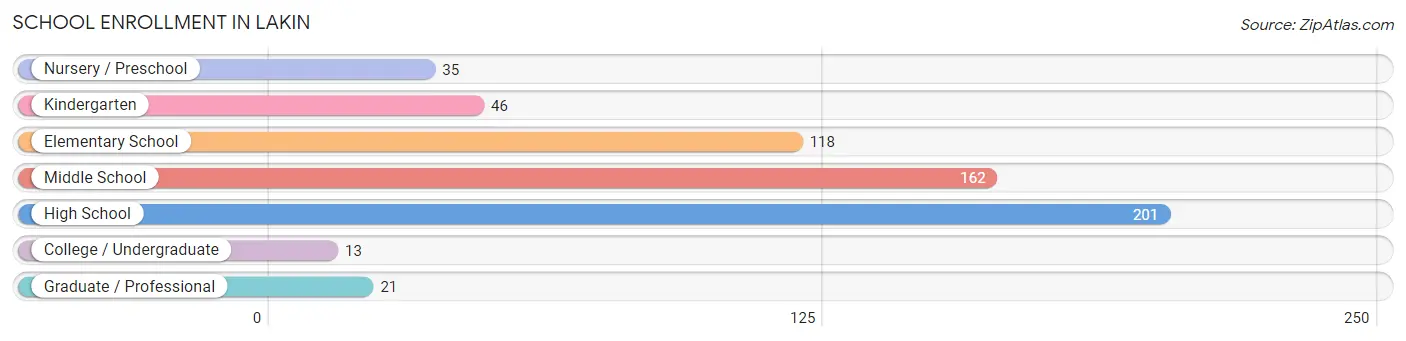
| School Level | # Students | % Students |
| Nursery / Preschool | 35 | 5.9% |
| Kindergarten | 46 | 7.7% |
| Elementary School | 118 | 19.8% |
| Middle School | 162 | 27.2% |
| High School | 201 | 33.7% |
| College / Undergraduate | 13 | 2.2% |
| Graduate / Professional | 21 | 3.5% |
| Total | 596 | 100.0% |
School Enrollment by Age by Funding Source in Lakin
Out of a total of 596 students who are enrolled in schools in Lakin, 20 (3.4%) attend a private institution, while the remaining 576 (96.6%) are enrolled in public schools. The age group of 3 to 4 year olds has the highest likelihood of being enrolled in private schools, with 17 (100.0% in the age bracket) enrolled. Conversely, the age group of 5 to 9 year old has the lowest likelihood of being enrolled in a private school, with 182 (100.0% in the age bracket) attending a public institution.
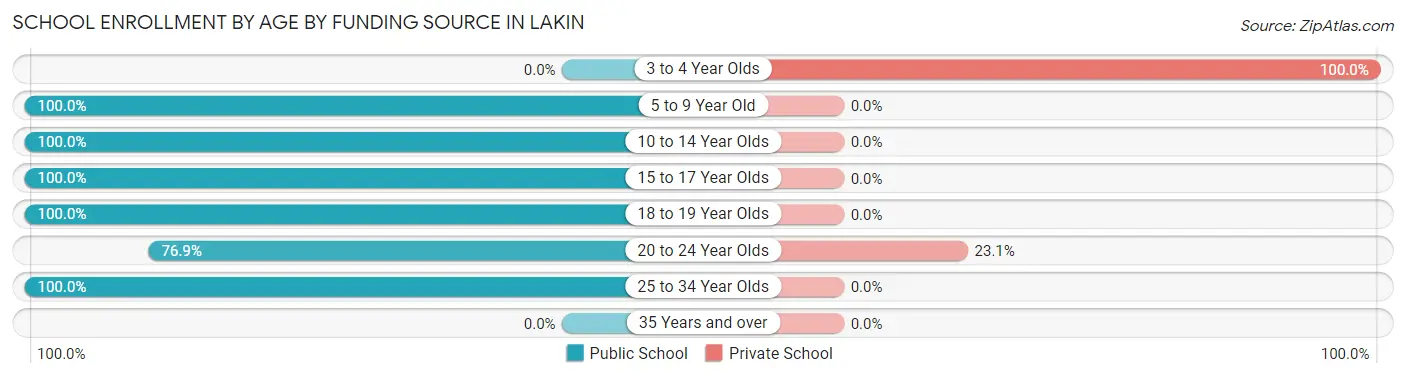
| Age Bracket | Public School | Private School |
| 3 to 4 Year Olds | 0 (0.0%) | 17 (100.0%) |
| 5 to 9 Year Old | 182 (100.0%) | 0 (0.0%) |
| 10 to 14 Year Olds | 240 (100.0%) | 0 (0.0%) |
| 15 to 17 Year Olds | 105 (100.0%) | 0 (0.0%) |
| 18 to 19 Year Olds | 18 (100.0%) | 0 (0.0%) |
| 20 to 24 Year Olds | 10 (76.9%) | 3 (23.1%) |
| 25 to 34 Year Olds | 21 (100.0%) | 0 (0.0%) |
| 35 Years and over | 0 (0.0%) | 0 (0.0%) |
| Total | 576 (96.6%) | 20 (3.4%) |
Educational Attainment by Field of Study in Lakin
Education (46 | 33.8%), business (41 | 30.1%), arts & humanities (21 | 15.4%), communications (15 | 11.0%), and liberal arts & history (6 | 4.4%) are the most common fields of study among 136 individuals in Lakin who have obtained a bachelor's degree or higher.
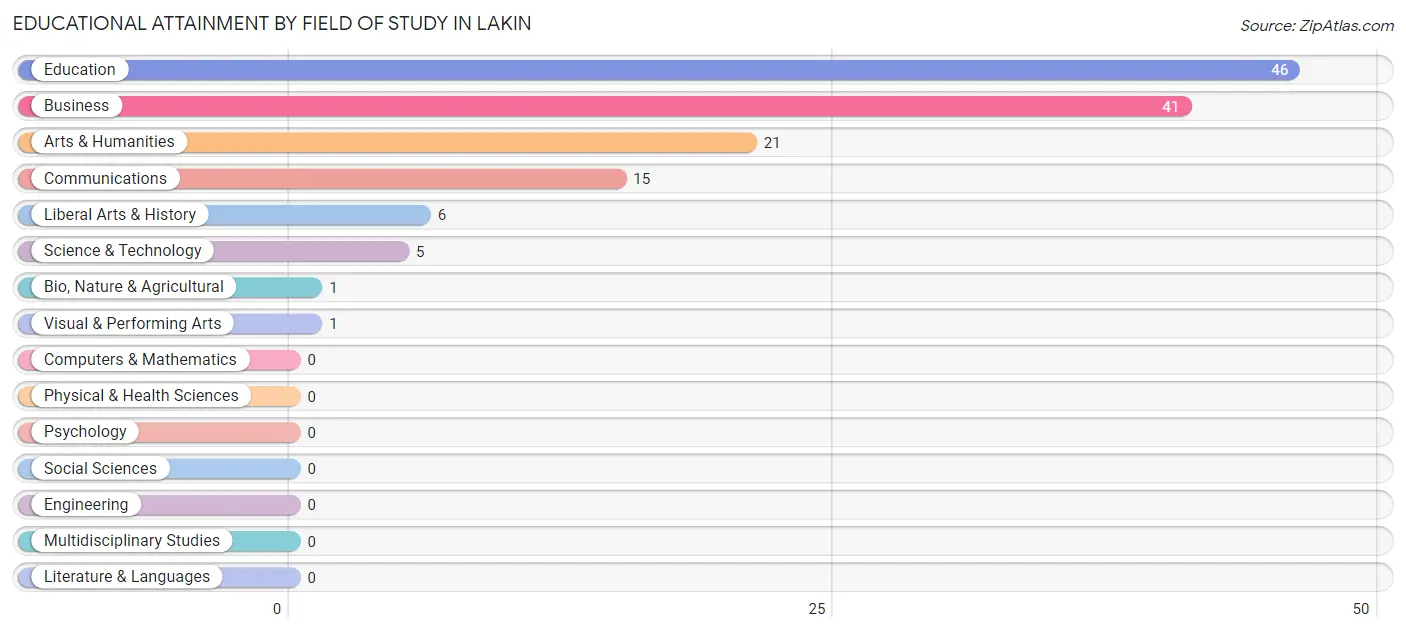
| Field of Study | # Graduates | % Graduates |
| Computers & Mathematics | 0 | 0.0% |
| Bio, Nature & Agricultural | 1 | 0.7% |
| Physical & Health Sciences | 0 | 0.0% |
| Psychology | 0 | 0.0% |
| Social Sciences | 0 | 0.0% |
| Engineering | 0 | 0.0% |
| Multidisciplinary Studies | 0 | 0.0% |
| Science & Technology | 5 | 3.7% |
| Business | 41 | 30.1% |
| Education | 46 | 33.8% |
| Literature & Languages | 0 | 0.0% |
| Liberal Arts & History | 6 | 4.4% |
| Visual & Performing Arts | 1 | 0.7% |
| Communications | 15 | 11.0% |
| Arts & Humanities | 21 | 15.4% |
| Total | 136 | 100.0% |
Transportation & Commute in Lakin
Vehicle Availability by Sex in Lakin
The most prevalent vehicle ownership categories in Lakin are males with 2 vehicles (292, accounting for 59.2%) and females with 2 vehicles (121, making up 99.0%).
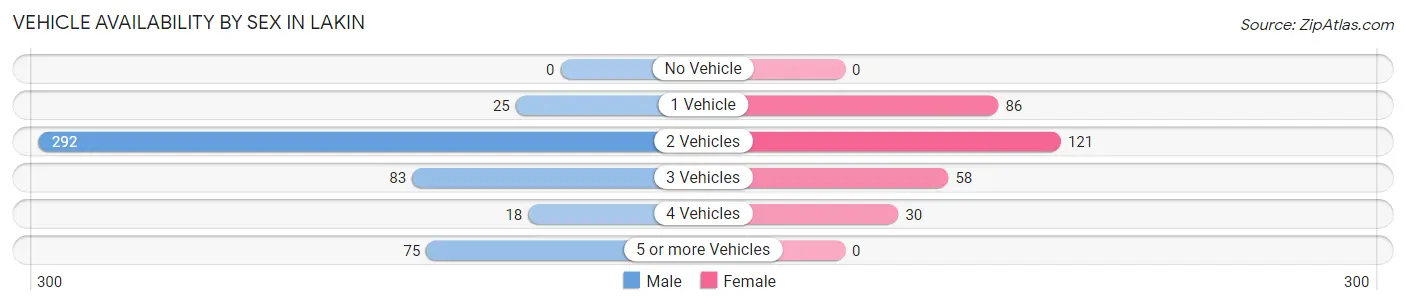
| Vehicles Available | Male | Female |
| No Vehicle | 0 (0.0%) | 0 (0.0%) |
| 1 Vehicle | 25 (5.1%) | 86 (29.1%) |
| 2 Vehicles | 292 (59.2%) | 121 (41.0%) |
| 3 Vehicles | 83 (16.8%) | 58 (19.7%) |
| 4 Vehicles | 18 (3.6%) | 30 (10.2%) |
| 5 or more Vehicles | 75 (15.2%) | 0 (0.0%) |
| Total | 493 (100.0%) | 295 (100.0%) |
Commute Time in Lakin
The most frequently occuring commute durations in Lakin are less than 5 minutes (200 commuters, 28.2%), 5 to 9 minutes (157 commuters, 22.2%), and 20 to 24 minutes (69 commuters, 9.8%).
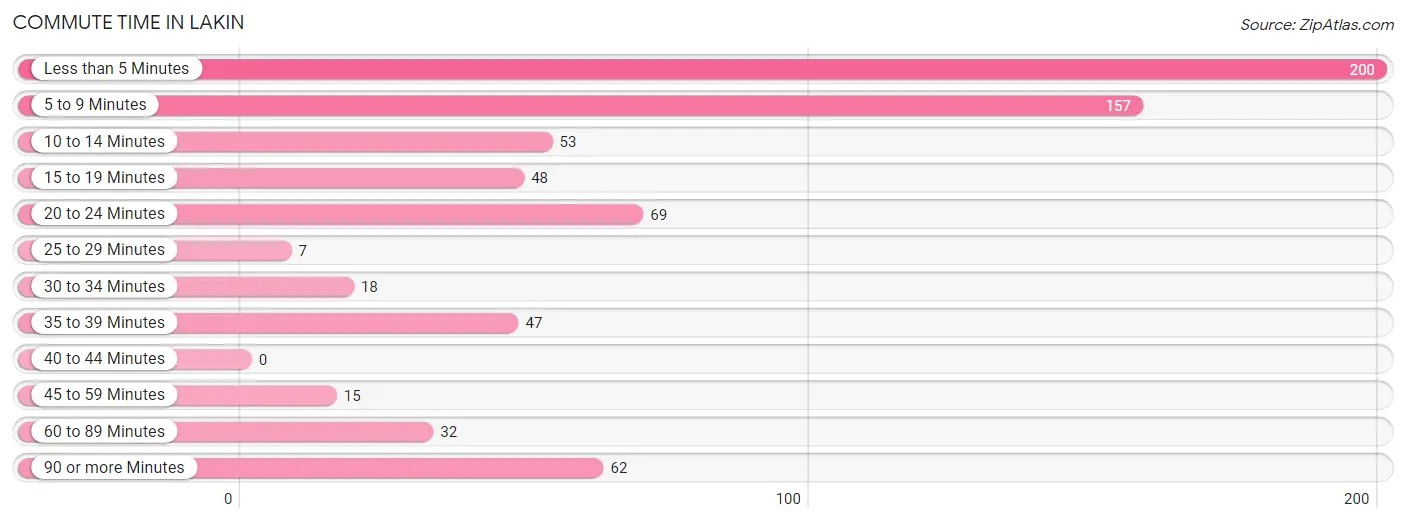
| Commute Time | # Commuters | % Commuters |
| Less than 5 Minutes | 200 | 28.2% |
| 5 to 9 Minutes | 157 | 22.2% |
| 10 to 14 Minutes | 53 | 7.5% |
| 15 to 19 Minutes | 48 | 6.8% |
| 20 to 24 Minutes | 69 | 9.8% |
| 25 to 29 Minutes | 7 | 1.0% |
| 30 to 34 Minutes | 18 | 2.5% |
| 35 to 39 Minutes | 47 | 6.6% |
| 40 to 44 Minutes | 0 | 0.0% |
| 45 to 59 Minutes | 15 | 2.1% |
| 60 to 89 Minutes | 32 | 4.5% |
| 90 or more Minutes | 62 | 8.8% |
Commute Time by Sex in Lakin
The most common commute times in Lakin are less than 5 minutes (113 commuters, 25.9%) for males and less than 5 minutes (87 commuters, 32.0%) for females.
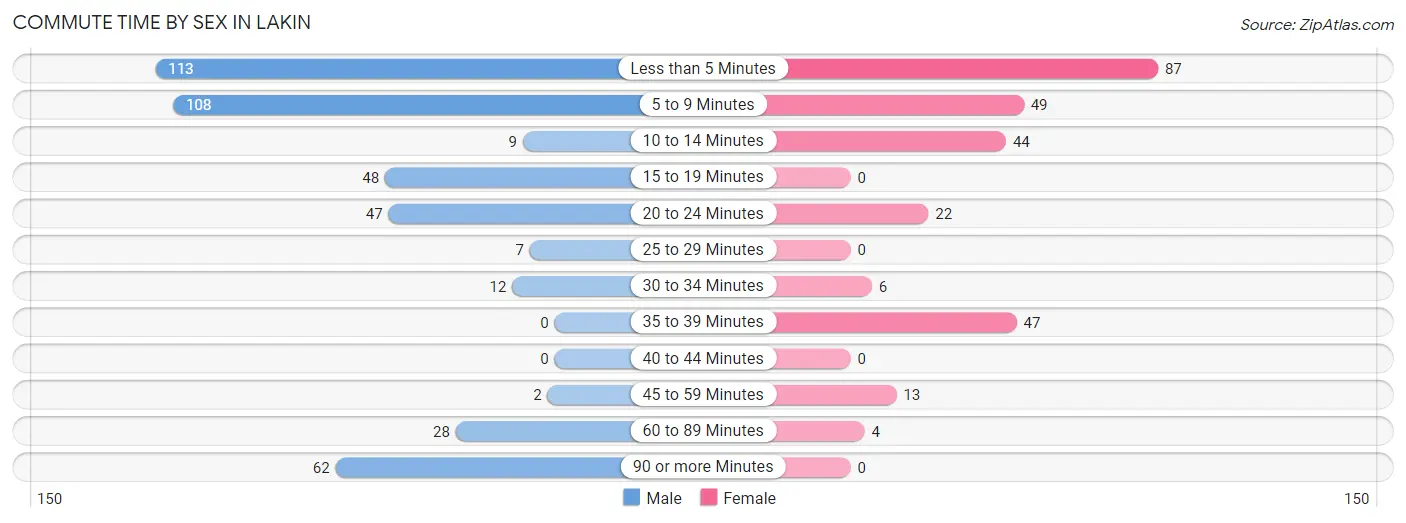
| Commute Time | Male | Female |
| Less than 5 Minutes | 113 (25.9%) | 87 (32.0%) |
| 5 to 9 Minutes | 108 (24.8%) | 49 (18.0%) |
| 10 to 14 Minutes | 9 (2.1%) | 44 (16.2%) |
| 15 to 19 Minutes | 48 (11.0%) | 0 (0.0%) |
| 20 to 24 Minutes | 47 (10.8%) | 22 (8.1%) |
| 25 to 29 Minutes | 7 (1.6%) | 0 (0.0%) |
| 30 to 34 Minutes | 12 (2.8%) | 6 (2.2%) |
| 35 to 39 Minutes | 0 (0.0%) | 47 (17.3%) |
| 40 to 44 Minutes | 0 (0.0%) | 0 (0.0%) |
| 45 to 59 Minutes | 2 (0.5%) | 13 (4.8%) |
| 60 to 89 Minutes | 28 (6.4%) | 4 (1.5%) |
| 90 or more Minutes | 62 (14.2%) | 0 (0.0%) |
Time of Departure to Work by Sex in Lakin
The most frequent times of departure to work in Lakin are 12:00 AM to 4:59 AM (94, 21.6%) for males and 6:30 AM to 6:59 AM (77, 28.3%) for females.
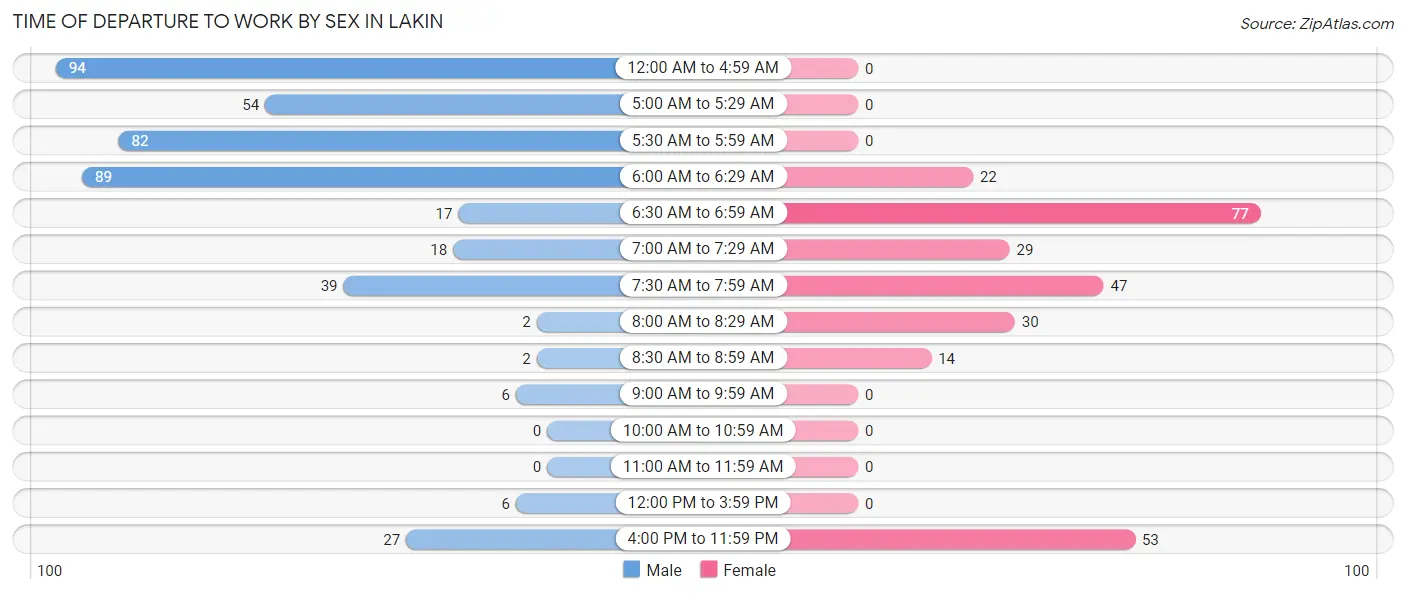
| Time of Departure | Male | Female |
| 12:00 AM to 4:59 AM | 94 (21.6%) | 0 (0.0%) |
| 5:00 AM to 5:29 AM | 54 (12.4%) | 0 (0.0%) |
| 5:30 AM to 5:59 AM | 82 (18.8%) | 0 (0.0%) |
| 6:00 AM to 6:29 AM | 89 (20.4%) | 22 (8.1%) |
| 6:30 AM to 6:59 AM | 17 (3.9%) | 77 (28.3%) |
| 7:00 AM to 7:29 AM | 18 (4.1%) | 29 (10.7%) |
| 7:30 AM to 7:59 AM | 39 (8.9%) | 47 (17.3%) |
| 8:00 AM to 8:29 AM | 2 (0.5%) | 30 (11.0%) |
| 8:30 AM to 8:59 AM | 2 (0.5%) | 14 (5.1%) |
| 9:00 AM to 9:59 AM | 6 (1.4%) | 0 (0.0%) |
| 10:00 AM to 10:59 AM | 0 (0.0%) | 0 (0.0%) |
| 11:00 AM to 11:59 AM | 0 (0.0%) | 0 (0.0%) |
| 12:00 PM to 3:59 PM | 6 (1.4%) | 0 (0.0%) |
| 4:00 PM to 11:59 PM | 27 (6.2%) | 53 (19.5%) |
| Total | 436 (100.0%) | 272 (100.0%) |
Housing Occupancy in Lakin
Occupancy by Ownership in Lakin
Of the total 704 dwellings in Lakin, owner-occupied units account for 482 (68.5%), while renter-occupied units make up 222 (31.5%).
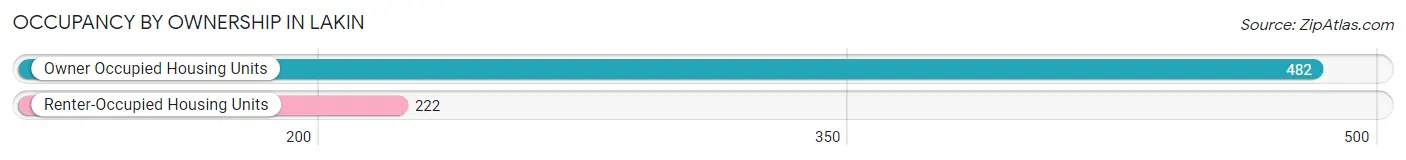
| Occupancy | # Housing Units | % Housing Units |
| Owner Occupied Housing Units | 482 | 68.5% |
| Renter-Occupied Housing Units | 222 | 31.5% |
| Total Occupied Housing Units | 704 | 100.0% |
Occupancy by Household Size in Lakin
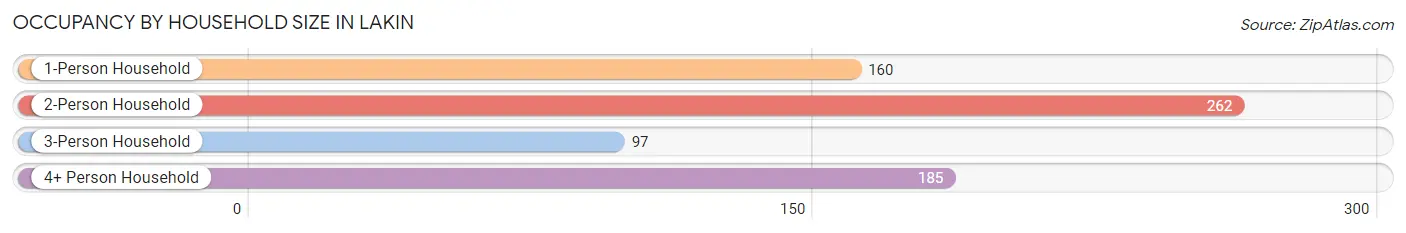
| Household Size | # Housing Units | % Housing Units |
| 1-Person Household | 160 | 22.7% |
| 2-Person Household | 262 | 37.2% |
| 3-Person Household | 97 | 13.8% |
| 4+ Person Household | 185 | 26.3% |
| Total Housing Units | 704 | 100.0% |
Occupancy by Ownership by Household Size in Lakin
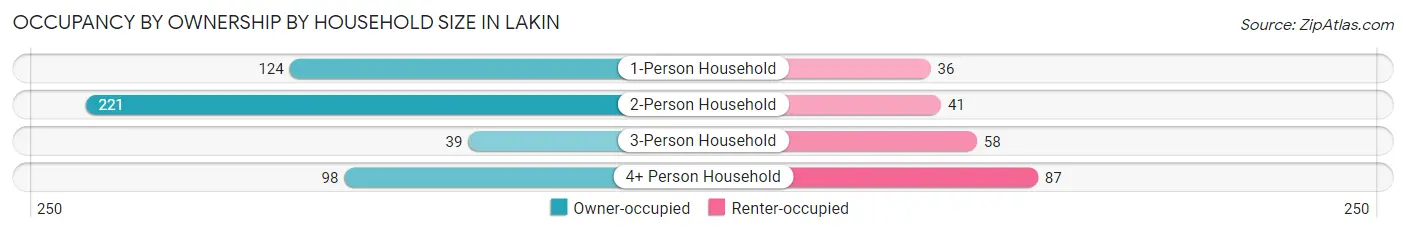
| Household Size | Owner-occupied | Renter-occupied |
| 1-Person Household | 124 (77.5%) | 36 (22.5%) |
| 2-Person Household | 221 (84.4%) | 41 (15.7%) |
| 3-Person Household | 39 (40.2%) | 58 (59.8%) |
| 4+ Person Household | 98 (53.0%) | 87 (47.0%) |
| Total Housing Units | 482 (68.5%) | 222 (31.5%) |
Occupancy by Educational Attainment in Lakin
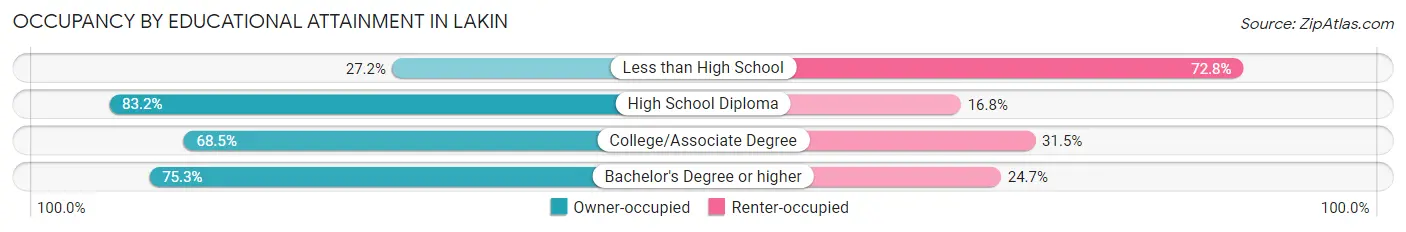
| Household Size | Owner-occupied | Renter-occupied |
| Less than High School | 34 (27.2%) | 91 (72.8%) |
| High School Diploma | 258 (83.2%) | 52 (16.8%) |
| College/Associate Degree | 126 (68.5%) | 58 (31.5%) |
| Bachelor's Degree or higher | 64 (75.3%) | 21 (24.7%) |
Occupancy by Age of Householder in Lakin
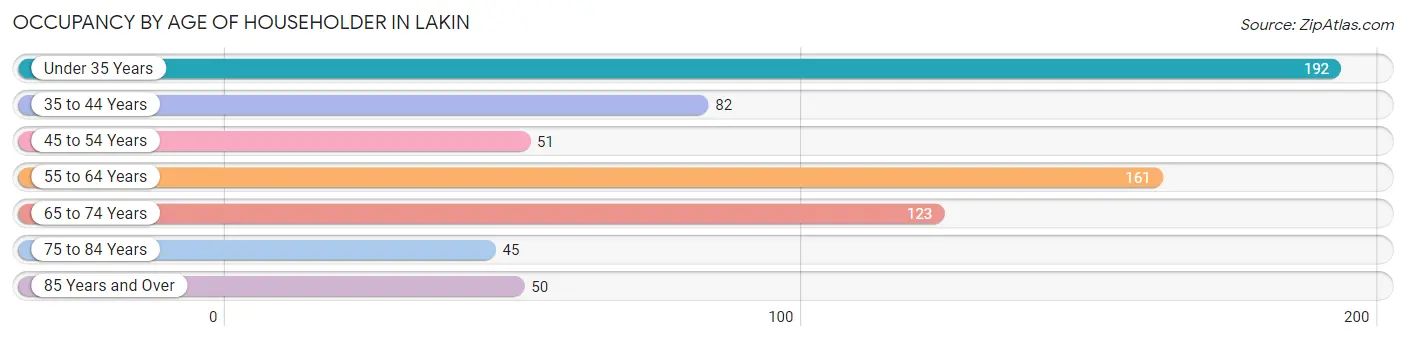
| Age Bracket | # Households | % Households |
| Under 35 Years | 192 | 27.3% |
| 35 to 44 Years | 82 | 11.7% |
| 45 to 54 Years | 51 | 7.2% |
| 55 to 64 Years | 161 | 22.9% |
| 65 to 74 Years | 123 | 17.5% |
| 75 to 84 Years | 45 | 6.4% |
| 85 Years and Over | 50 | 7.1% |
| Total | 704 | 100.0% |
Housing Finances in Lakin
Median Income by Occupancy in Lakin
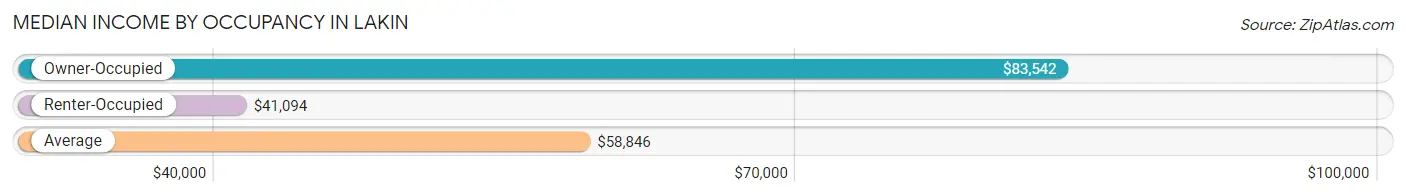
| Occupancy Type | # Households | Median Income |
| Owner-Occupied | 482 (68.5%) | $83,542 |
| Renter-Occupied | 222 (31.5%) | $41,094 |
| Average | 704 (100.0%) | $58,846 |
Occupancy by Householder Income Bracket in Lakin
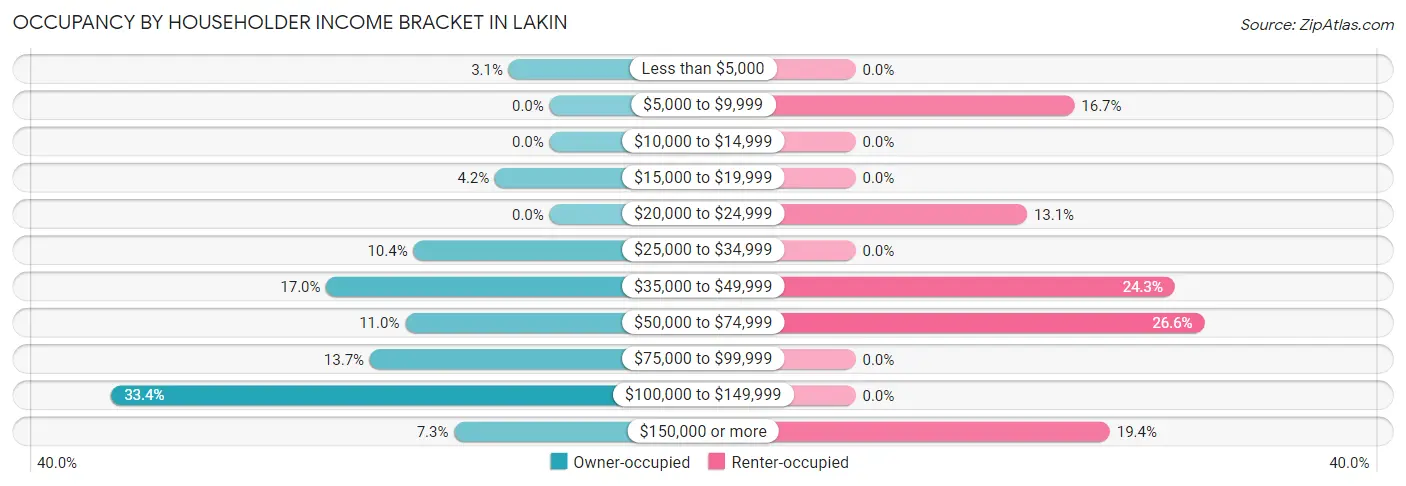
| Income Bracket | Owner-occupied | Renter-occupied |
| Less than $5,000 | 15 (3.1%) | 0 (0.0%) |
| $5,000 to $9,999 | 0 (0.0%) | 37 (16.7%) |
| $10,000 to $14,999 | 0 (0.0%) | 0 (0.0%) |
| $15,000 to $19,999 | 20 (4.2%) | 0 (0.0%) |
| $20,000 to $24,999 | 0 (0.0%) | 29 (13.1%) |
| $25,000 to $34,999 | 50 (10.4%) | 0 (0.0%) |
| $35,000 to $49,999 | 82 (17.0%) | 54 (24.3%) |
| $50,000 to $74,999 | 53 (11.0%) | 59 (26.6%) |
| $75,000 to $99,999 | 66 (13.7%) | 0 (0.0%) |
| $100,000 to $149,999 | 161 (33.4%) | 0 (0.0%) |
| $150,000 or more | 35 (7.3%) | 43 (19.4%) |
| Total | 482 (100.0%) | 222 (100.0%) |
Monthly Housing Cost Tiers in Lakin
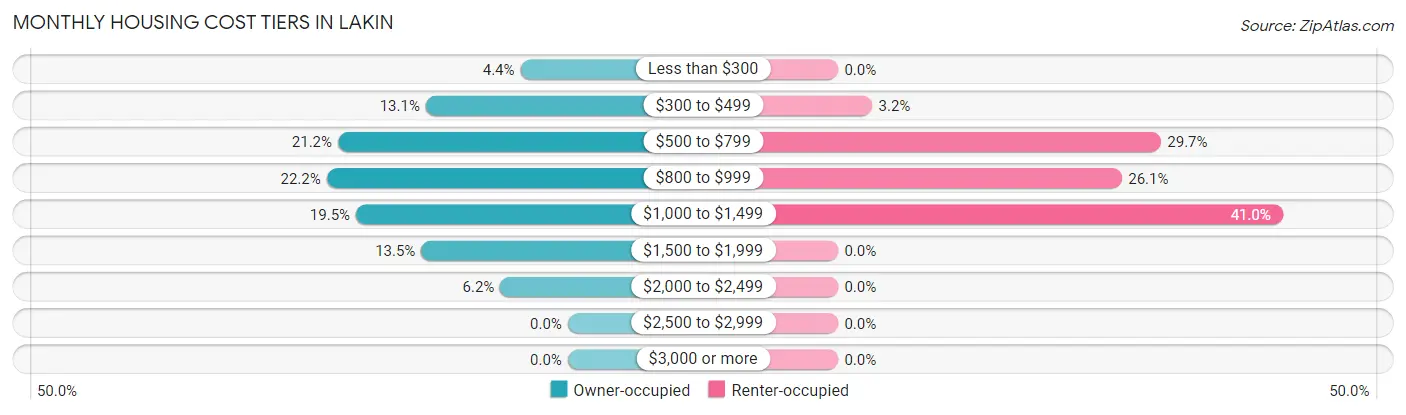
| Monthly Cost | Owner-occupied | Renter-occupied |
| Less than $300 | 21 (4.4%) | 0 (0.0%) |
| $300 to $499 | 63 (13.1%) | 7 (3.2%) |
| $500 to $799 | 102 (21.2%) | 66 (29.7%) |
| $800 to $999 | 107 (22.2%) | 58 (26.1%) |
| $1,000 to $1,499 | 94 (19.5%) | 91 (41.0%) |
| $1,500 to $1,999 | 65 (13.5%) | 0 (0.0%) |
| $2,000 to $2,499 | 30 (6.2%) | 0 (0.0%) |
| $2,500 to $2,999 | 0 (0.0%) | 0 (0.0%) |
| $3,000 or more | 0 (0.0%) | 0 (0.0%) |
| Total | 482 (100.0%) | 222 (100.0%) |
Physical Housing Characteristics in Lakin
Housing Structures in Lakin
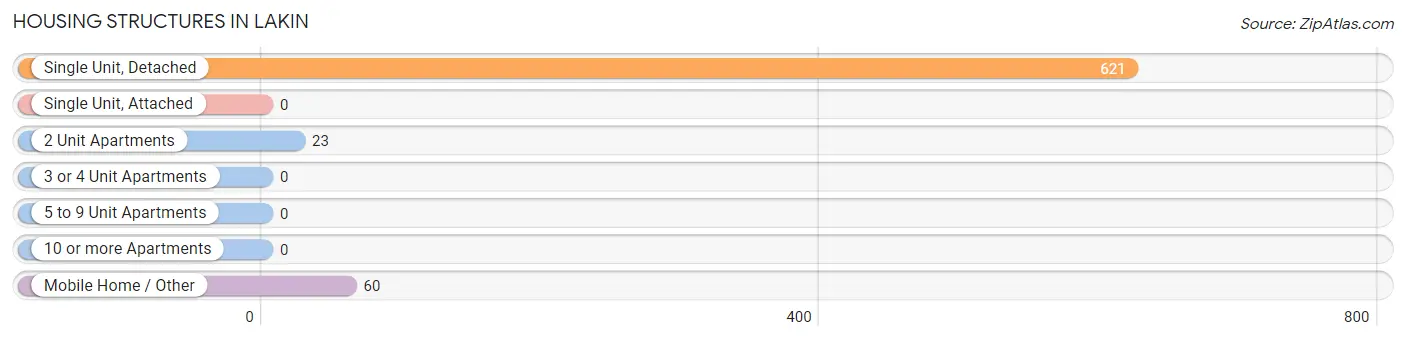
| Structure Type | # Housing Units | % Housing Units |
| Single Unit, Detached | 621 | 88.2% |
| Single Unit, Attached | 0 | 0.0% |
| 2 Unit Apartments | 23 | 3.3% |
| 3 or 4 Unit Apartments | 0 | 0.0% |
| 5 to 9 Unit Apartments | 0 | 0.0% |
| 10 or more Apartments | 0 | 0.0% |
| Mobile Home / Other | 60 | 8.5% |
| Total | 704 | 100.0% |
Housing Structures by Occupancy in Lakin
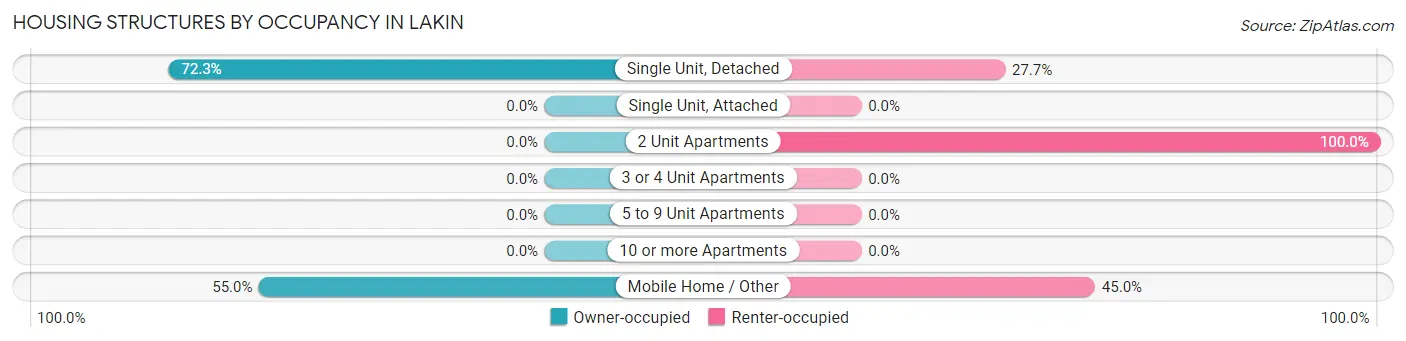
| Structure Type | Owner-occupied | Renter-occupied |
| Single Unit, Detached | 449 (72.3%) | 172 (27.7%) |
| Single Unit, Attached | 0 (0.0%) | 0 (0.0%) |
| 2 Unit Apartments | 0 (0.0%) | 23 (100.0%) |
| 3 or 4 Unit Apartments | 0 (0.0%) | 0 (0.0%) |
| 5 to 9 Unit Apartments | 0 (0.0%) | 0 (0.0%) |
| 10 or more Apartments | 0 (0.0%) | 0 (0.0%) |
| Mobile Home / Other | 33 (55.0%) | 27 (45.0%) |
| Total | 482 (68.5%) | 222 (31.5%) |
Housing Structures by Number of Rooms in Lakin
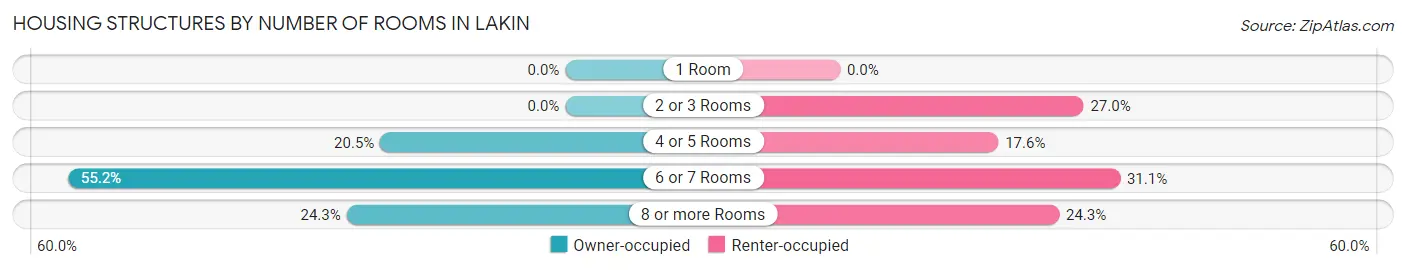
| Number of Rooms | Owner-occupied | Renter-occupied |
| 1 Room | 0 (0.0%) | 0 (0.0%) |
| 2 or 3 Rooms | 0 (0.0%) | 60 (27.0%) |
| 4 or 5 Rooms | 99 (20.5%) | 39 (17.6%) |
| 6 or 7 Rooms | 266 (55.2%) | 69 (31.1%) |
| 8 or more Rooms | 117 (24.3%) | 54 (24.3%) |
| Total | 482 (100.0%) | 222 (100.0%) |
Housing Structure by Heating Type in Lakin
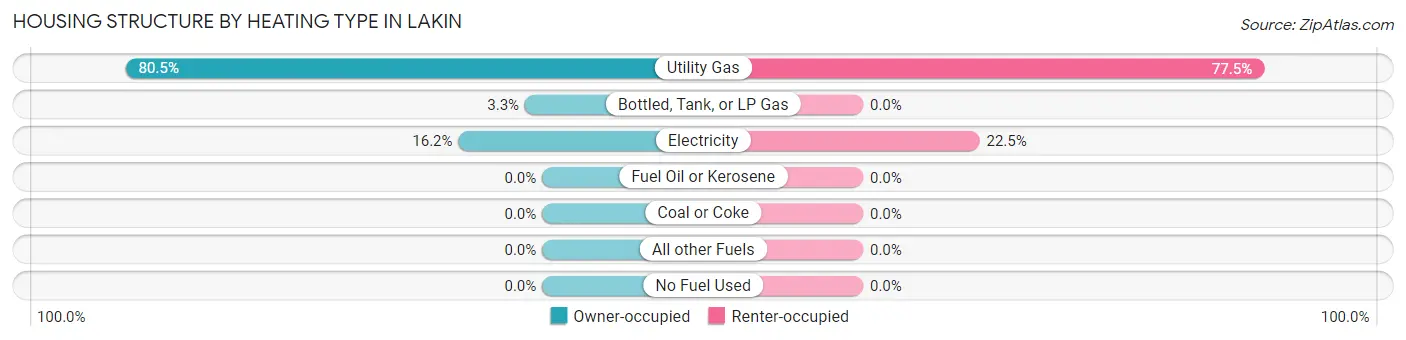
| Heating Type | Owner-occupied | Renter-occupied |
| Utility Gas | 388 (80.5%) | 172 (77.5%) |
| Bottled, Tank, or LP Gas | 16 (3.3%) | 0 (0.0%) |
| Electricity | 78 (16.2%) | 50 (22.5%) |
| Fuel Oil or Kerosene | 0 (0.0%) | 0 (0.0%) |
| Coal or Coke | 0 (0.0%) | 0 (0.0%) |
| All other Fuels | 0 (0.0%) | 0 (0.0%) |
| No Fuel Used | 0 (0.0%) | 0 (0.0%) |
| Total | 482 (100.0%) | 222 (100.0%) |
Household Vehicle Usage in Lakin
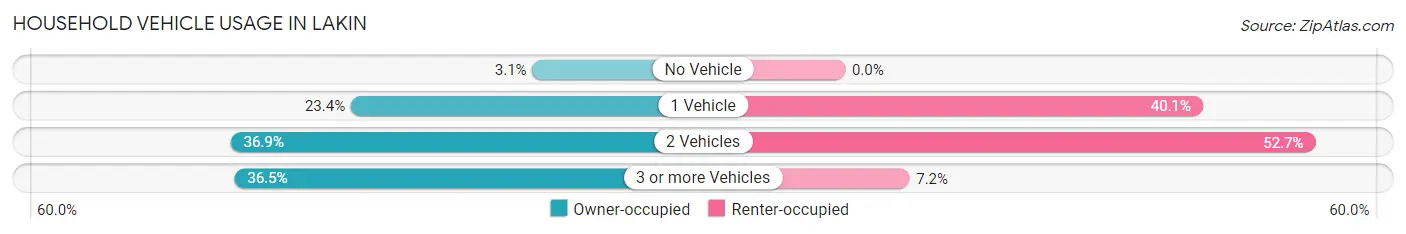
| Vehicles per Household | Owner-occupied | Renter-occupied |
| No Vehicle | 15 (3.1%) | 0 (0.0%) |
| 1 Vehicle | 113 (23.4%) | 89 (40.1%) |
| 2 Vehicles | 178 (36.9%) | 117 (52.7%) |
| 3 or more Vehicles | 176 (36.5%) | 16 (7.2%) |
| Total | 482 (100.0%) | 222 (100.0%) |
Real Estate & Mortgages in Lakin
Real Estate and Mortgage Overview in Lakin
| Characteristic | Without Mortgage | With Mortgage |
| Housing Units | 285 | 197 |
| Median Property Value | $120,700 | $186,300 |
| Median Household Income | $49,856 | $35 |
| Monthly Housing Costs | $601 | $0 |
| Real Estate Taxes | $1,912 | $0 |
Property Value by Mortgage Status in Lakin
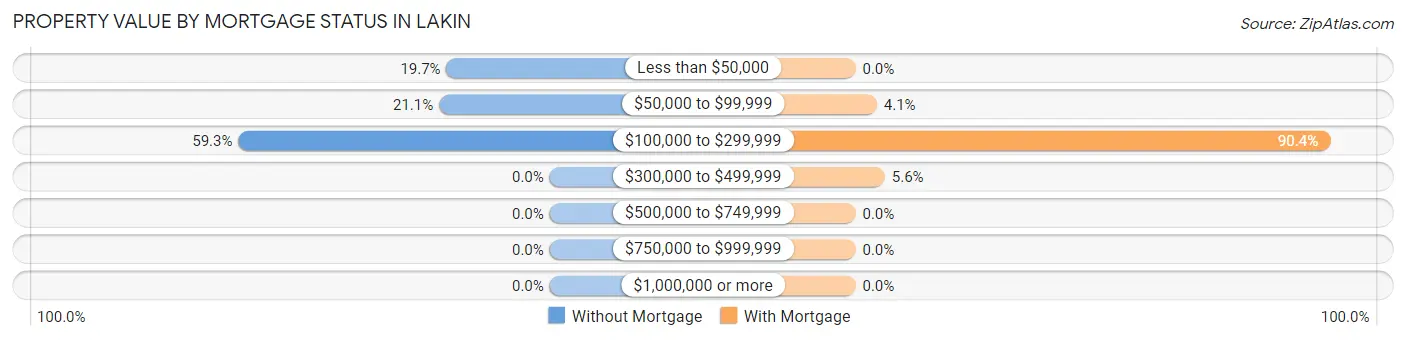
| Property Value | Without Mortgage | With Mortgage |
| Less than $50,000 | 56 (19.7%) | 0 (0.0%) |
| $50,000 to $99,999 | 60 (21.0%) | 8 (4.1%) |
| $100,000 to $299,999 | 169 (59.3%) | 178 (90.4%) |
| $300,000 to $499,999 | 0 (0.0%) | 11 (5.6%) |
| $500,000 to $749,999 | 0 (0.0%) | 0 (0.0%) |
| $750,000 to $999,999 | 0 (0.0%) | 0 (0.0%) |
| $1,000,000 or more | 0 (0.0%) | 0 (0.0%) |
| Total | 285 (100.0%) | 197 (100.0%) |
Household Income by Mortgage Status in Lakin
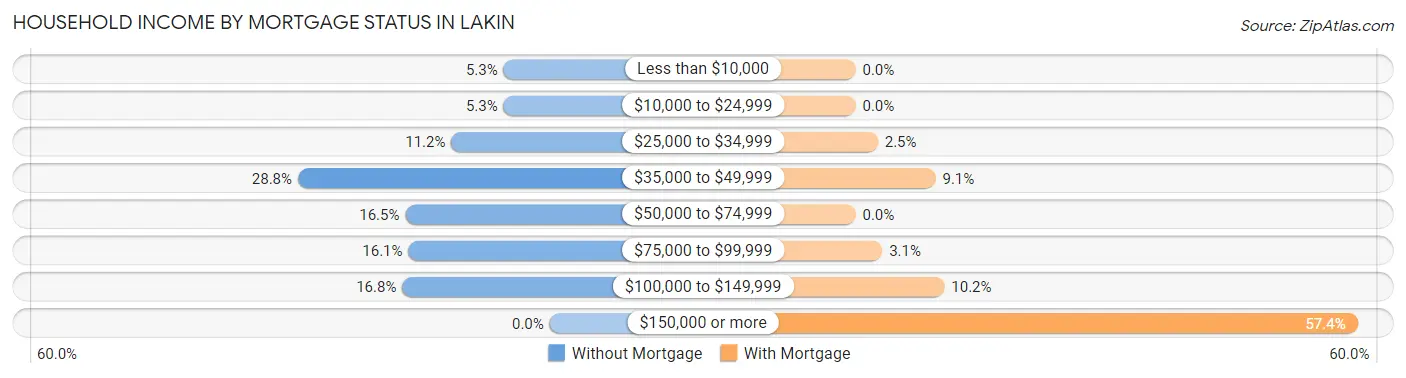
| Household Income | Without Mortgage | With Mortgage |
| Less than $10,000 | 15 (5.3%) | 0 (0.0%) |
| $10,000 to $24,999 | 15 (5.3%) | 0 (0.0%) |
| $25,000 to $34,999 | 32 (11.2%) | 5 (2.5%) |
| $35,000 to $49,999 | 82 (28.8%) | 18 (9.1%) |
| $50,000 to $74,999 | 47 (16.5%) | 0 (0.0%) |
| $75,000 to $99,999 | 46 (16.1%) | 6 (3.0%) |
| $100,000 to $149,999 | 48 (16.8%) | 20 (10.2%) |
| $150,000 or more | 0 (0.0%) | 113 (57.4%) |
| Total | 285 (100.0%) | 197 (100.0%) |
Property Value to Household Income Ratio in Lakin
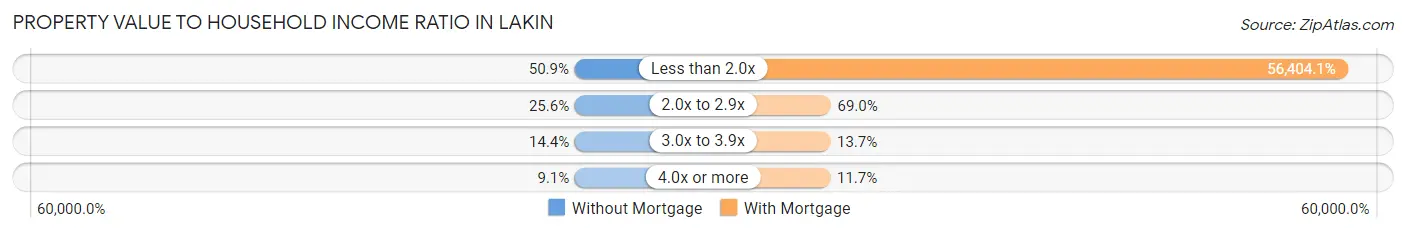
| Value-to-Income Ratio | Without Mortgage | With Mortgage |
| Less than 2.0x | 145 (50.9%) | 111,116 (56,404.1%) |
| 2.0x to 2.9x | 73 (25.6%) | 136 (69.0%) |
| 3.0x to 3.9x | 41 (14.4%) | 27 (13.7%) |
| 4.0x or more | 26 (9.1%) | 23 (11.7%) |
| Total | 285 (100.0%) | 197 (100.0%) |
Real Estate Taxes by Mortgage Status in Lakin
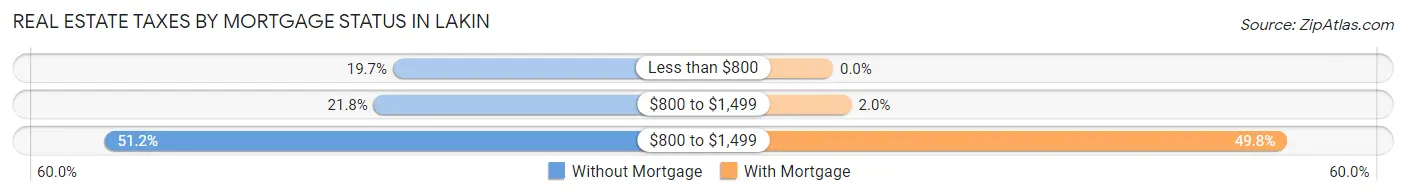
| Property Taxes | Without Mortgage | With Mortgage |
| Less than $800 | 56 (19.7%) | 0 (0.0%) |
| $800 to $1,499 | 62 (21.7%) | 4 (2.0%) |
| $800 to $1,499 | 146 (51.2%) | 98 (49.7%) |
| Total | 285 (100.0%) | 197 (100.0%) |
Health & Disability in Lakin
Health Insurance Coverage by Age in Lakin
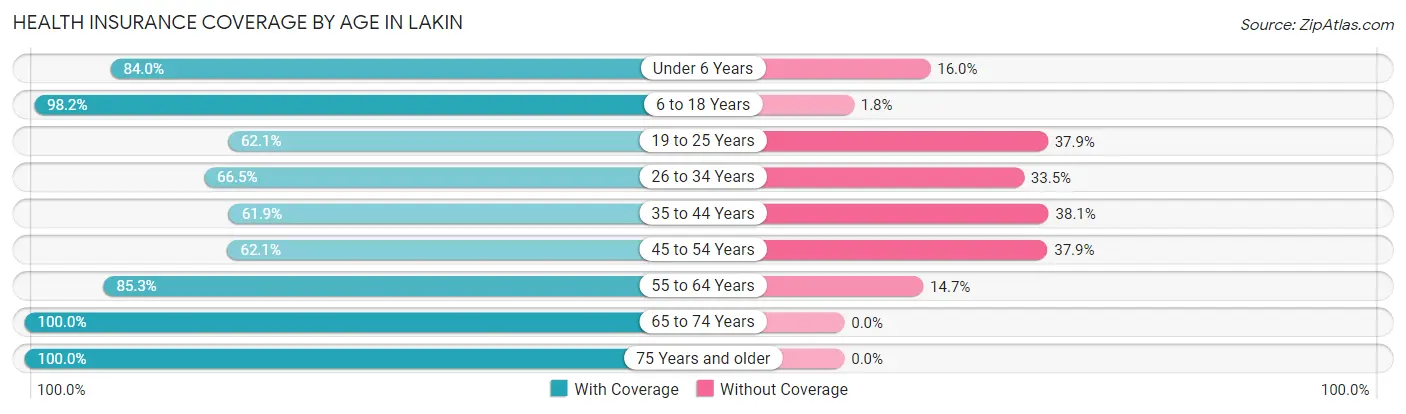
| Age Bracket | With Coverage | Without Coverage |
| Under 6 Years | 157 (84.0%) | 30 (16.0%) |
| 6 to 18 Years | 500 (98.2%) | 9 (1.8%) |
| 19 to 25 Years | 126 (62.1%) | 77 (37.9%) |
| 26 to 34 Years | 145 (66.5%) | 73 (33.5%) |
| 35 to 44 Years | 130 (61.9%) | 80 (38.1%) |
| 45 to 54 Years | 87 (62.1%) | 53 (37.9%) |
| 55 to 64 Years | 203 (85.3%) | 35 (14.7%) |
| 65 to 74 Years | 171 (100.0%) | 0 (0.0%) |
| 75 Years and older | 119 (100.0%) | 0 (0.0%) |
| Total | 1,638 (82.1%) | 357 (17.9%) |
Health Insurance Coverage by Citizenship Status in Lakin
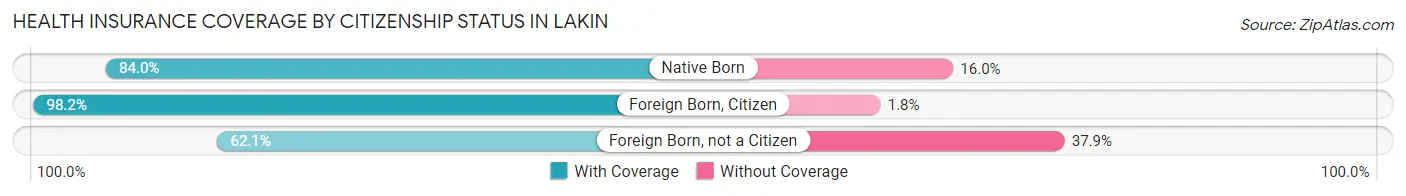
| Citizenship Status | With Coverage | Without Coverage |
| Native Born | 157 (84.0%) | 30 (16.0%) |
| Foreign Born, Citizen | 500 (98.2%) | 9 (1.8%) |
| Foreign Born, not a Citizen | 126 (62.1%) | 77 (37.9%) |
Health Insurance Coverage by Household Income in Lakin
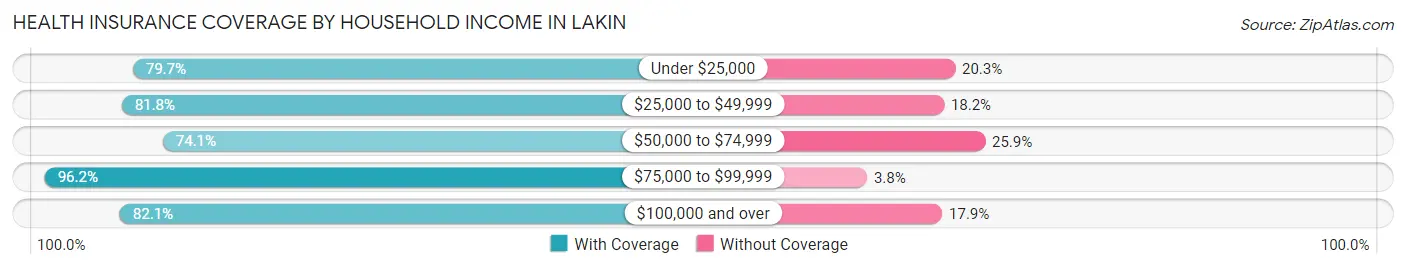
| Household Income | With Coverage | Without Coverage |
| Under $25,000 | 287 (79.7%) | 73 (20.3%) |
| $25,000 to $49,999 | 454 (81.8%) | 101 (18.2%) |
| $50,000 to $74,999 | 226 (74.1%) | 79 (25.9%) |
| $75,000 to $99,999 | 229 (96.2%) | 9 (3.8%) |
| $100,000 and over | 437 (82.1%) | 95 (17.9%) |
Public vs Private Health Insurance Coverage by Age in Lakin
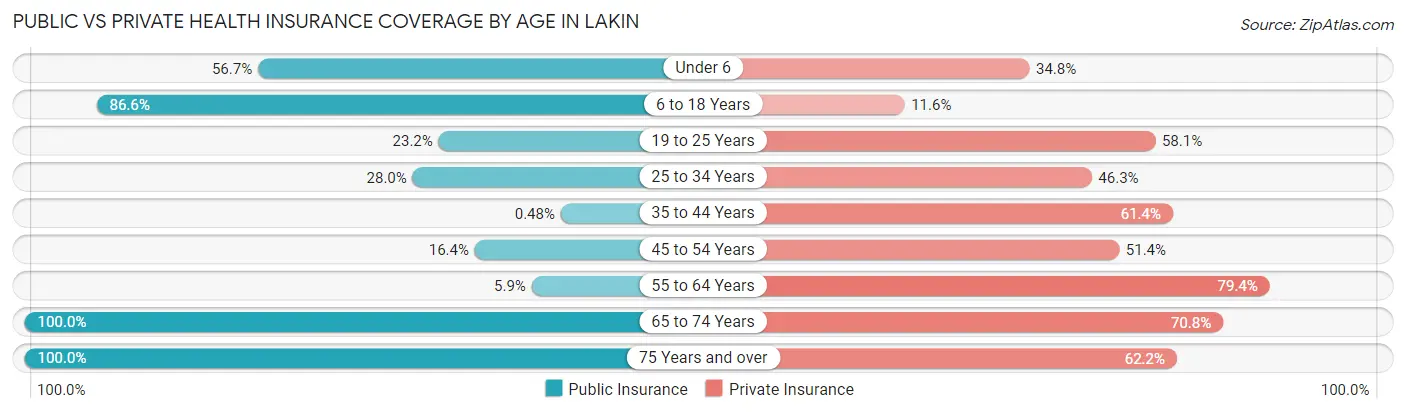
| Age Bracket | Public Insurance | Private Insurance |
| Under 6 | 106 (56.7%) | 65 (34.8%) |
| 6 to 18 Years | 441 (86.6%) | 59 (11.6%) |
| 19 to 25 Years | 47 (23.2%) | 118 (58.1%) |
| 25 to 34 Years | 61 (28.0%) | 101 (46.3%) |
| 35 to 44 Years | 1 (0.5%) | 129 (61.4%) |
| 45 to 54 Years | 23 (16.4%) | 72 (51.4%) |
| 55 to 64 Years | 14 (5.9%) | 189 (79.4%) |
| 65 to 74 Years | 171 (100.0%) | 121 (70.8%) |
| 75 Years and over | 119 (100.0%) | 74 (62.2%) |
| Total | 983 (49.3%) | 928 (46.5%) |
Disability Status by Sex by Age in Lakin
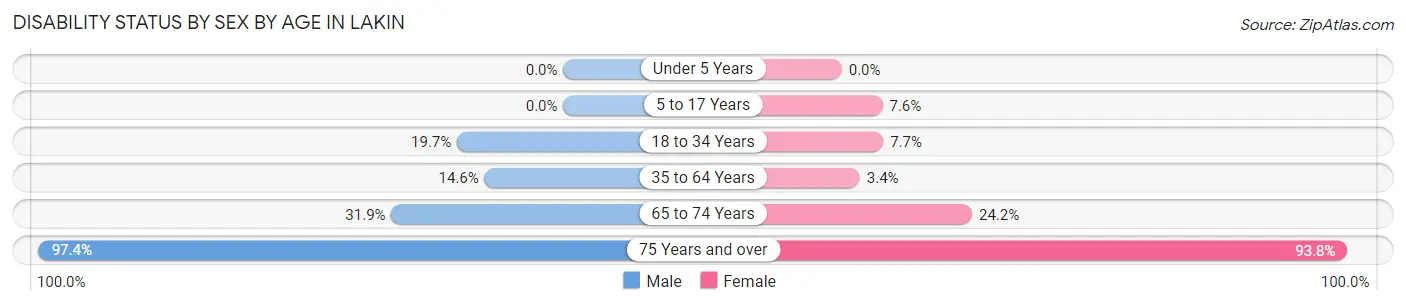
| Age Bracket | Male | Female |
| Under 5 Years | 0 (0.0%) | 0 (0.0%) |
| 5 to 17 Years | 0 (0.0%) | 17 (7.6%) |
| 18 to 34 Years | 43 (19.7%) | 17 (7.7%) |
| 35 to 64 Years | 51 (14.6%) | 8 (3.4%) |
| 65 to 74 Years | 15 (31.9%) | 30 (24.2%) |
| 75 Years and over | 37 (97.4%) | 76 (93.8%) |
Disability Class by Sex by Age in Lakin
Disability Class: Hearing Difficulty
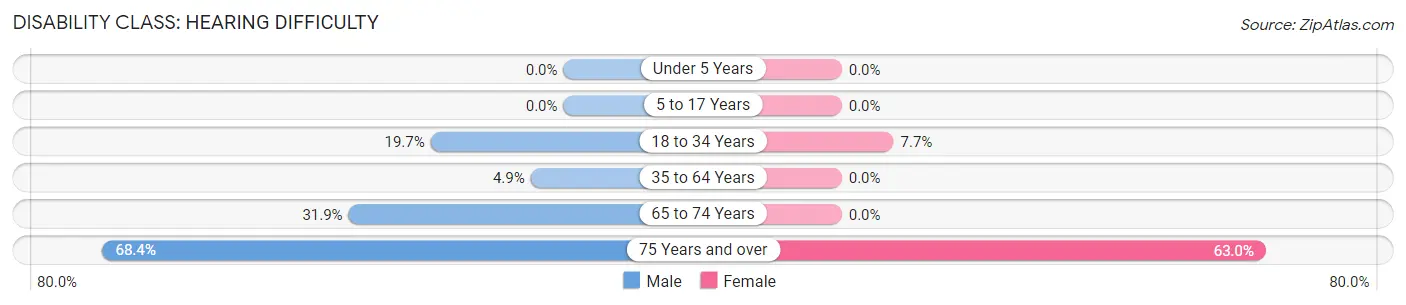
| Age Bracket | Male | Female |
| Under 5 Years | 0 (0.0%) | 0 (0.0%) |
| 5 to 17 Years | 0 (0.0%) | 0 (0.0%) |
| 18 to 34 Years | 43 (19.7%) | 17 (7.7%) |
| 35 to 64 Years | 17 (4.9%) | 0 (0.0%) |
| 65 to 74 Years | 15 (31.9%) | 0 (0.0%) |
| 75 Years and over | 26 (68.4%) | 51 (63.0%) |
Disability Class: Vision Difficulty
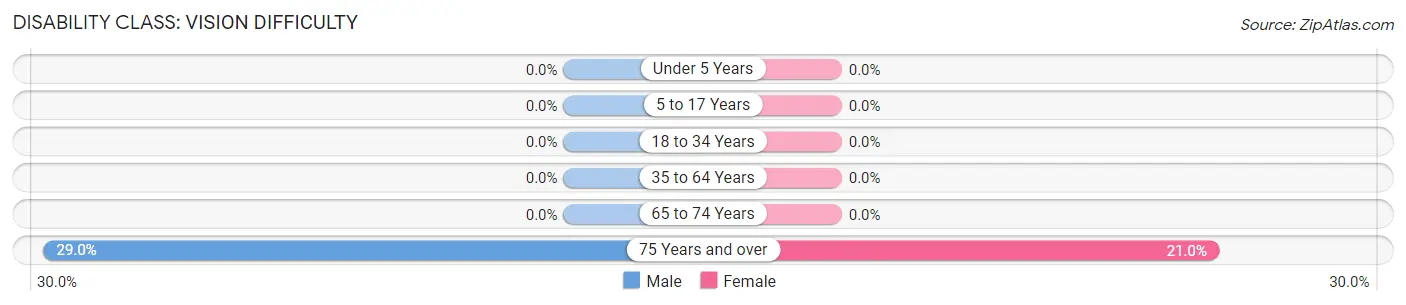
| Age Bracket | Male | Female |
| Under 5 Years | 0 (0.0%) | 0 (0.0%) |
| 5 to 17 Years | 0 (0.0%) | 0 (0.0%) |
| 18 to 34 Years | 0 (0.0%) | 0 (0.0%) |
| 35 to 64 Years | 0 (0.0%) | 0 (0.0%) |
| 65 to 74 Years | 0 (0.0%) | 0 (0.0%) |
| 75 Years and over | 11 (28.9%) | 17 (21.0%) |
Disability Class: Cognitive Difficulty
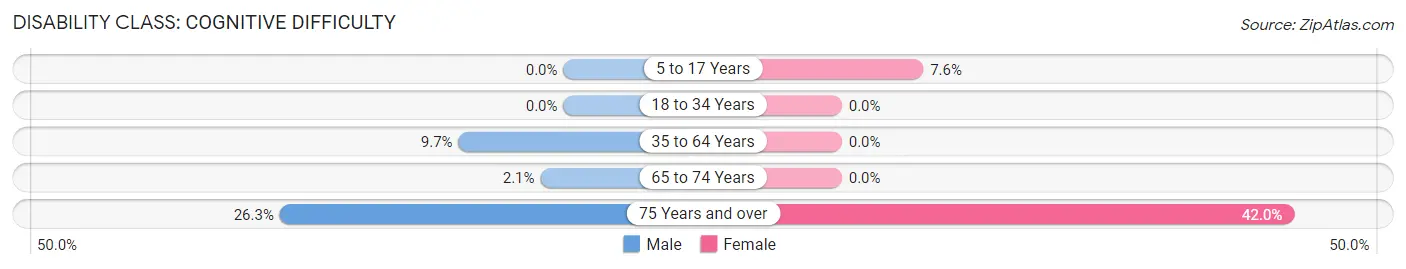
| Age Bracket | Male | Female |
| 5 to 17 Years | 0 (0.0%) | 17 (7.6%) |
| 18 to 34 Years | 0 (0.0%) | 0 (0.0%) |
| 35 to 64 Years | 34 (9.7%) | 0 (0.0%) |
| 65 to 74 Years | 1 (2.1%) | 0 (0.0%) |
| 75 Years and over | 10 (26.3%) | 34 (42.0%) |
Disability Class: Ambulatory Difficulty
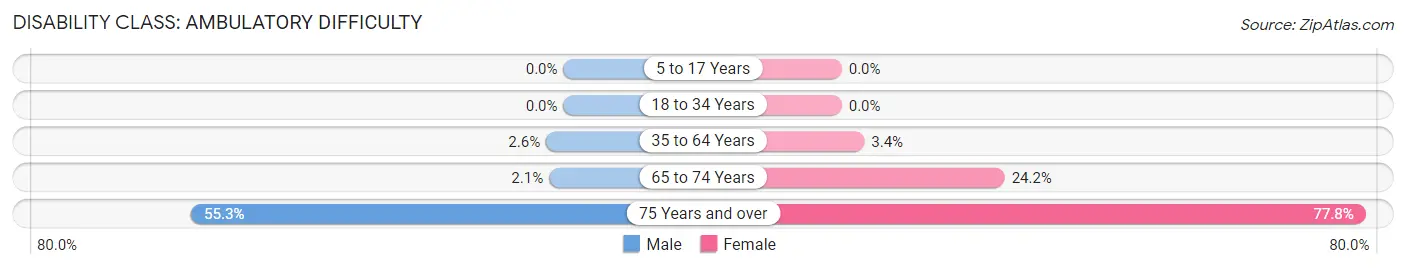
| Age Bracket | Male | Female |
| 5 to 17 Years | 0 (0.0%) | 0 (0.0%) |
| 18 to 34 Years | 0 (0.0%) | 0 (0.0%) |
| 35 to 64 Years | 9 (2.6%) | 8 (3.4%) |
| 65 to 74 Years | 1 (2.1%) | 30 (24.2%) |
| 75 Years and over | 21 (55.3%) | 63 (77.8%) |
Disability Class: Self-Care Difficulty
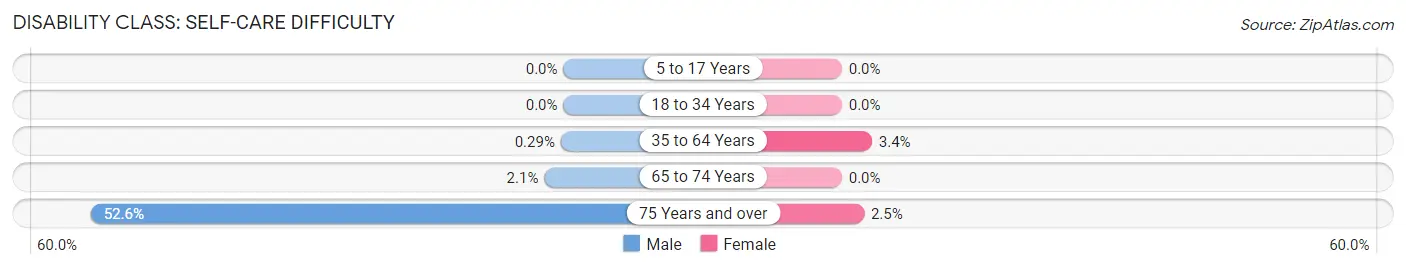
| Age Bracket | Male | Female |
| 5 to 17 Years | 0 (0.0%) | 0 (0.0%) |
| 18 to 34 Years | 0 (0.0%) | 0 (0.0%) |
| 35 to 64 Years | 1 (0.3%) | 8 (3.4%) |
| 65 to 74 Years | 1 (2.1%) | 0 (0.0%) |
| 75 Years and over | 20 (52.6%) | 2 (2.5%) |
Technology Access in Lakin
Computing Device Access in Lakin
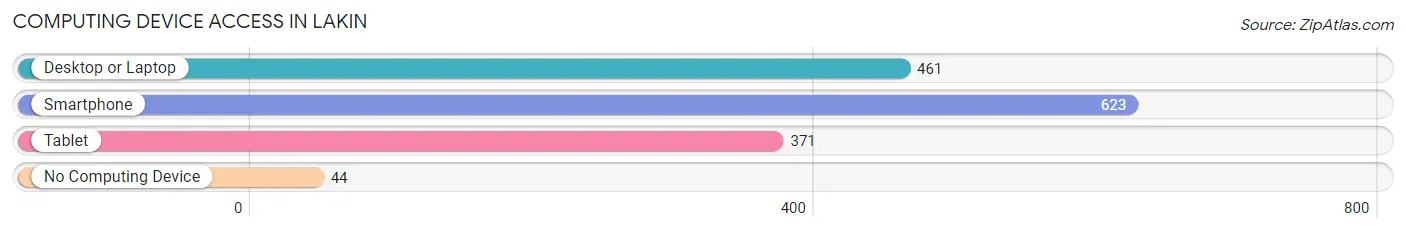
| Device Type | # Households | % Households |
| Desktop or Laptop | 461 | 65.5% |
| Smartphone | 623 | 88.5% |
| Tablet | 371 | 52.7% |
| No Computing Device | 44 | 6.2% |
| Total | 704 | 100.0% |
Internet Access in Lakin
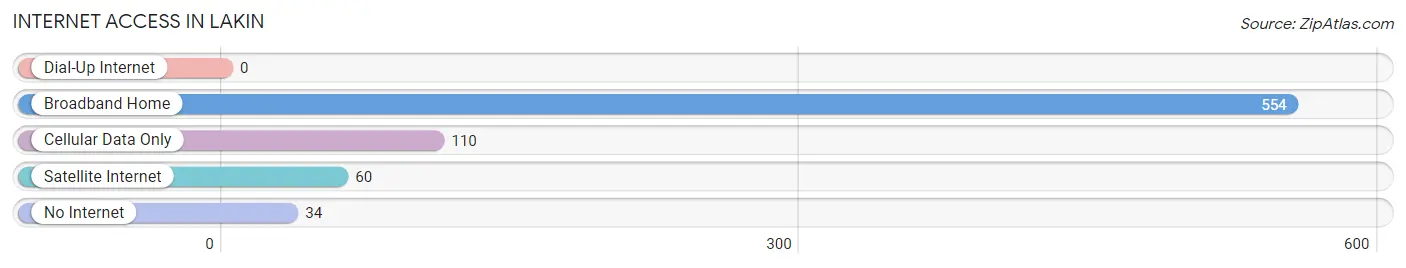
| Internet Type | # Households | % Households |
| Dial-Up Internet | 0 | 0.0% |
| Broadband Home | 554 | 78.7% |
| Cellular Data Only | 110 | 15.6% |
| Satellite Internet | 60 | 8.5% |
| No Internet | 34 | 4.8% |
| Total | 704 | 100.0% |
Lakin Summary
Lakin, Kansas is a small city located in Kearny County in the southwestern part of the state. It is situated on the Arkansas River, approximately 20 miles east of Garden City. The city has a population of approximately 2,500 people and is the county seat of Kearny County.
History
Lakin was founded in 1885 by the Santa Fe Railroad. The city was named after the Lakin family, who were early settlers in the area. The city was incorporated in 1887 and was the first city in Kearny County.
In the early 1900s, Lakin was a thriving agricultural community. The city was home to several grain elevators, a flour mill, and a creamery. The city also had a number of businesses, including a hotel, a bank, a newspaper, and a movie theater.
Geography
Lakin is located in the High Plains region of Kansas. The city is situated on the Arkansas River, approximately 20 miles east of Garden City. The city has a total area of 1.2 square miles, all of which is land.
The climate in Lakin is semi-arid, with hot summers and cold winters. The average annual temperature is 54 degrees Fahrenheit, and the average annual precipitation is 17.5 inches.
Economy
The economy of Lakin is largely based on agriculture. The city is home to several grain elevators, a flour mill, and a creamery. The city also has a number of businesses, including a hotel, a bank, a newspaper, and a movie theater.
The city is also home to a number of manufacturing companies, including a plastics manufacturer, a metal fabrication company, and a food processing plant.
Demographics
As of the 2010 census, the population of Lakin was 2,500. The racial makeup of the city was 95.2% White, 0.8% African American, 0.4% Native American, 0.4% Asian, 0.2% Pacific Islander, and 2.8% from other races. Hispanic or Latino of any race were 4.4% of the population.
The median household income in Lakin was $37,500, and the median family income was $45,000. The per capita income was $17,000. About 11.2% of families and 14.2% of the population were below the poverty line.
Lakin is served by the Kearny County Unified School District. The city is home to two elementary schools, one middle school, and one high school. The city also has a public library and a number of churches.
Common Questions
What is Per Capita Income in Lakin?
Per Capita income in Lakin is $26,804.
What is the Median Family Income in Lakin?
Median Family Income in Lakin is $54,223.
What is the Median Household income in Lakin?
Median Household Income in Lakin is $58,846.
What is Income or Wage Gap in Lakin?
Income or Wage Gap in Lakin is 52.3%.
Women in Lakin earn 47.7 cents for every dollar earned by a man.
What is Family Income Deficit in Lakin?
Family Income Deficit in Lakin is $14,320.
Families that are below poverty line in Lakin earn $14,320 less on average than the poverty threshold level.
What is Inequality or Gini Index in Lakin?
Inequality or Gini Index in Lakin is 0.37.
What is the Total Population of Lakin?
Total Population of Lakin is 2,066.
What is the Total Male Population of Lakin?
Total Male Population of Lakin is 1,060.
What is the Total Female Population of Lakin?
Total Female Population of Lakin is 1,006.
What is the Ratio of Males per 100 Females in Lakin?
There are 105.37 Males per 100 Females in Lakin.
What is the Ratio of Females per 100 Males in Lakin?
There are 94.91 Females per 100 Males in Lakin.
What is the Median Population Age in Lakin?
Median Population Age in Lakin is 34.1 Years.
What is the Average Family Size in Lakin
Average Family Size in Lakin is 3.3 People.
What is the Average Household Size in Lakin
Average Household Size in Lakin is 2.8 People.
How Large is the Labor Force in Lakin?
There are 829 People in the Labor Forcein in Lakin.
What is the Percentage of People in the Labor Force in Lakin?
55.5% of People are in the Labor Force in Lakin.
What is the Unemployment Rate in Lakin?
Unemployment Rate in Lakin is 4.7%.